

The proteinannotator template follows an nf-core/proteinannotator run from the input FASTA files to one protein's structure, reading each tool's own files and joining them per residue, per domain, per protein and per sample:
- Overview: the run in four key figures, live findings and four figures, each linked to the tab that explains it
- Data & QC: what the length and duplicate filter removed, and how much of each protein the databases describe
- Domains: hits from Pfam, FunFam, NMPFamsDB, MetagRoot and InterProScan in one table, drawn along each chain, and where the databases agree
- Secondary structure: the S4PRED helix, strand and coil calls per residue, with the domains that cover them
- Structure: one protein in 3D, coloured by its best domain, linked residue by residue to its sequence track
Folding needs the structure resolver and sends the sequence out
The pipeline predicts no 3D structure. The Structure tab folds the picked
protein from its sequence through the
structure resolver,
which is off by default: an administrator sets
DEPICTIO_STRUCTURE_RESOLVER_ENABLED=true on the server. Folding sends the
protein sequence to ESMFold on Meta's ESM Atlas (api.esmatlas.com), and
ESMFold folds at most 400 residues. With the resolver off, or for a longer
protein, the tile says why it is empty and the rest of the dashboard is
unaffected.
Grouping needs a design table
The pipeline's samplesheet has only id and fasta, so a design is always
an extra table, passed with --var METADATA_FILE. Without one, the group
filters, the Samples card and the design table are pruned, and every tile
bound to the per-sample summary keeps working.
Quick start
The results directory is the only thing you have to pass. To group and
filter samples, add a design table: the sample id in the first column (or a
column named sample), then one column per factor.
depictio ingest /path/to/proteinannotator_results \
--template nf-core/proteinannotator/latest \
--var METADATA_FILE=/path/to/design.tsv
| Variable | Default | Role |
|---|---|---|
METADATA_FILE |
unset | design table; enables the group filters, the Samples card and the design table |
GROUP_COL |
first factor column | design column the dashboard groups and filters by |
SKIP_INTERPROSCAN |
unset | set for a --skip_interproscan run: drops the InterProScan collections and the step that cites them |
SKIP_S4PRED |
unset | set for a --skip_s4pred run: drops the Secondary structure tab; the residue table keeps its sequence and domains |
depictio config nextflow --install     # once per machine
nextflow run nf-core/proteinannotator -r 1.1.0 -profile docker --outdir results
No depictio ingest, and no template named: the pipeline ingests its own
output directory when it finishes and resolves this template from its own
manifest. See Nextflow trigger.
Reference
The template reads the SeqFu statistics and the filtered FASTA of qc/, the
hmmsearch domain tables of four HMM libraries (Pfam, FunFam, NMPFamsDB,
MetagRoot), InterProScan's signature matches and the S4PRED secondary
structure. Empty files are normal (InterProScan writes an empty TSV for a sample
with no match, hmmsearch a header-only table) and read as no rows. The run's
MultiQC report holds only SeqFu sections anchored by sample name, so the template
has no MultiQC tab.
- Protein ids. A protein is the first word of its FASTA header, the id the
three tools report. Characters outside
A-Za-z0-9._+-become_in every table, so the S4PRED, domain, residue and protein tables share oneentity. - Domains. hmmsearch domains are kept at an independent E-value of 0.01 or less, HMMER's own inclusion threshold, and span the envelope coordinates. Weaker hits stay in the collapsed hmmsearch hits section. InterProScan matches are kept as reported.
- Coverage. A protein's annotated share counts the residues covered by at least one domain once. The best domain, the one with the lowest E-value, names the protein and colours the structure.
Self-adapting layout
The dashboard adapts to whatever the run actually produced: components bound
to pruned or unparsed data collections are hidden, tabs left with no real
visualizations are dropped entirely, and the remaining components are
re-packed so there are no empty rows. A --skip_s4pred run loses the
Secondary structure tab and its Overview finding.
Template variables
Variables you provide when running the template: DATA_ROOT is the results directory given to depictio ingest, the others are set with --var NAME=value:
| Variable | Required | Description |
|---|---|---|
DATA_ROOT |
✓ | Root directory of one proteinannotator run (qc/, domain_annotation/, functional_annotation/, s4pred/, pipeline_info/) |
METADATA_FILE |
— | Optional design table (TSV or CSV): sample id in the first column (or a column named sample), one column per factor. Enables the design filter and the design card. |
METADATA_ID_COL |
— | Design table sample-id column (links join on it). Auto-detected as the first column; defaults to 'sample'. |
GROUP_COL |
— | Design column the dashboards group and filter by. Auto-detected as the first factor column of METADATA_FILE. |
SKIP_INTERPROSCAN |
— | Set (--var SKIP_INTERPROSCAN=true) for a run with --skip_interproscan: no functional_annotation/, so the InterProScan collections are pruned. |
SKIP_S4PRED |
— | Set (--var SKIP_S4PRED=true) for a run with --skip_s4pred: no s4pred/, so the secondary-structure collections are pruned (the residue table keeps its sequence and domains). |
Auto-detected (set from the run's metadata / params.json; the route flags drive Conditional routes below): GROUP_COL_DISPLAY, ANNOTATION_COLS
Data collections
17 data collections — 12 required 5 optional · 6 direct 11 derived.
Origin tells you whether a collection is real pipeline data or a reshape of it: direct = a pipeline output (scanned, or a recipe that reads raw files); derived = a recipe that reshapes one or more direct collections into the layout a visualization needs (no new measurement). Reads shows what produces it: a recipe .py transform, whose name links to its source on GitHub, or a raw file scanned off disk. (A direct collection can still have a recipe — one that merely parses/cleans the raw file; derived means the recipe reshapes another collection.)
| Tag | Origin | Type | Reads | Status |
|---|---|---|---|---|
metadata |
direct | Table | file {METADATA_FILE} |
optional |
seqfu_stats_raw |
direct | Table | file .*_(?:before|after).tsv$ |
required |
seqkit_fasta_raw |
direct | Table | file (?:.*/)?qc/[/]+/[/]+.(?:fasta|faa|fa)$ |
required |
hmmer_domtbl_raw |
direct | Table | file .*.domtbl(?:.gz)?$ |
required |
interproscan_tsv_raw |
direct | Table | file (?:.*/)?interproscan/[/]+/[/]+.tsv$ |
optional |
s4pred_ss2_raw |
direct | Table | file .*.ss2$ |
optional |
seqfu_stats |
derived | Table | recipe seqfu/stats.py |
required |
seqkit_sequences |
derived | Table | recipe seqkit/sequences.py |
required |
hmmer_hmmsearch_domtbl |
derived | Table | recipe hmmer/hmmsearch_domtbl.py |
required |
interproscan_matches |
derived | Table | recipe interproscan/matches.py |
optional |
s4pred_secondary_structure |
derived | Table | recipe s4pred/secondary_structure.py |
optional |
proteinannotator_domains |
derived | Table | recipe proteinannotator/domains.py |
required |
proteinannotator_proteins |
derived | Table | recipe proteinannotator/proteins.py |
required |
proteinannotator_residues |
derived | Table | recipe proteinannotator/residues.py |
required |
proteinannotator_database_coverage |
derived | Table | recipe proteinannotator/database_coverage.py |
required |
proteinannotator_database_sets |
derived | Table | recipe proteinannotator/database_sets.py |
required |
samples |
derived | Table | recipe proteinannotator/sample_summary.py |
required |
Conditional routes
Rows are data collections; columns are the variables you set or params.json flags auto-detected from the run. Each filled cell is the effect of setting that variable; an empty cell means that variable leaves the collection unchanged. (12 collections are unaffected by any variable — present on every run.)
+ included− removed⇄ repointed
| Data collection | METADATA_FILE |
SKIP_INTERPROSCAN |
SKIP_S4PRED |
|---|---|---|---|
metadata |
+ | ||
interproscan_tsv_raw |
− | ||
s4pred_ss2_raw |
− | ||
interproscan_matches |
− | ||
s4pred_secondary_structure |
− |
Cross-DC links
23 links — selecting a value in the source collection filters the target. The join column is shown after the source.
| Source · column | Target | Filters | |
|---|---|---|---|
samples · sample_id |
→ | seqfu_stats |
Filter the SeqFu statistics by the sample hub selection |
samples · sample_id |
→ | proteinannotator_proteins |
Filter the protein summary by the sample hub selection |
samples · sample_id |
→ | proteinannotator_domains |
Filter the domain table by the sample hub selection |
samples · sample_id |
→ | proteinannotator_residues |
Filter the residue table by the sample hub selection |
samples · sample_id |
→ | proteinannotator_database_coverage |
Filter the coverage matrix rows by the sample hub selection |
samples · sample_id |
→ | proteinannotator_database_sets |
Filter the database membership rows by the sample hub selection |
samples · sample_id |
→ | hmmer_hmmsearch_domtbl |
Filter the raw hmmsearch hits by the sample hub selection |
samples · sample_id |
→ | s4pred_secondary_structure |
Filter the S4PRED residues by the sample hub selection |
metadata · {METADATA_ID_COL} |
→ | samples |
Filter the sample hub by the design table selection |
metadata · {METADATA_ID_COL} |
→ | proteinannotator_proteins |
Filter the protein summary by the design table selection |
metadata · {METADATA_ID_COL} |
→ | proteinannotator_domains |
Filter the domain table by the design table selection |
metadata · {METADATA_ID_COL} |
→ | proteinannotator_residues |
Filter the residue table by the design table selection |
metadata · {METADATA_ID_COL} |
→ | proteinannotator_database_coverage |
Filter the coverage matrix rows by the design table selection |
metadata · {METADATA_ID_COL} |
→ | proteinannotator_database_sets |
Filter the database membership rows by the design table selection |
metadata · {METADATA_ID_COL} |
→ | s4pred_secondary_structure |
Filter the S4PRED residues by the design table selection |
metadata · {METADATA_ID_COL} |
→ | hmmer_hmmsearch_domtbl |
Filter the raw hmmsearch hits by the design table selection |
proteinannotator_proteins · entity |
→ | proteinannotator_domains |
Filter the domain table by the selected proteins |
proteinannotator_proteins · entity |
→ | proteinannotator_residues |
Filter the residue table by the selected proteins |
proteinannotator_proteins · entity |
→ | proteinannotator_database_coverage |
Filter the coverage matrix by the selected proteins |
proteinannotator_proteins · entity |
→ | proteinannotator_database_sets |
Filter the database membership by the selected proteins |
proteinannotator_proteins · entity |
→ | hmmer_hmmsearch_domtbl |
Filter the raw hmmsearch hits by the selected proteins |
proteinannotator_proteins · entity |
→ | s4pred_secondary_structure |
Filter the S4PRED residues by the selected proteins |
proteinannotator_domains · entity |
→ | proteinannotator_proteins |
Filter the protein summary to the proteins carrying the selected domains |
Recipes
Each recipe reshapes raw pipeline output into a tidy table. The name links to its source; Output lists the validated OUTPUT_SCHEMA columns.
| Recipe | Transforms | Output |
|---|---|---|
hmmer/hmmsearch_domtbl.py |
One row per domain hit of an hmmsearch --domtblout table. |
entity, sample, source, label, accession, description, start, end, protein_length, hmm_length, domain_index, domain_count, seq_evalue, seq_score, c_evalue, i_evalue, dom_score, dom_bias, hmm_from, hmm_to, ali_from, ali_to, acc, hmm_coverage, neg_log10_evalue |
interproscan/matches.py |
One row per InterProScan signature match, from the headerless TSV output. | entity, sample, source, label, description, start, end, evalue, protein_length, interpro_accession, interpro_description, go_terms, pathways |
proteinannotator/database_coverage.py |
Protein x database matrix: the share of each protein a database annotates. | entity, sample, pfam, funfam, nmpfams, metagroot, interproscan |
proteinannotator/database_sets.py |
Protein x database membership: 1 when a database annotates the protein. | entity, sample, pfam, funfam, nmpfams, metagroot, interproscan |
proteinannotator/domains.py |
Every domain of every searched database in one domain table. | domain_id, entity, sample, database, source, label, description, start, end, span, protein_length, evalue, neg_log10_evalue, score, hmm_coverage, hmm_from, hmm_to, hmm_length, accession |
proteinannotator/proteins.py |
One row per protein: length, domain hits per database, cover, structure. | entity, sample, description, length, annotation_status, domain_hits, databases_hit, pfam_hits, funfam_hits, nmpfams_hits, metagroot_hits, interproscan_hits, annotated_residues, annotated_pct, top_domain, top_domain_database, top_domain_evalue, helix_pct, strand_pct, coil_pct |
proteinannotator/residues.py |
The residue table of every protein: sequence, secondary structure, domains. | entity, sample, position, residue, category, value, domain, domain_database, domains_here, sequence |
proteinannotator/sample_summary.py |
The sample hub: one row per sample of the run, every per-sample number. | sample_id, input_sequences, kept_sequences, removed_sequences, kept_residues, mean_length, n50, min_length, max_length, annotated_proteins, annotated_protein_pct, domain_hits, median_annotated_pct |
s4pred/secondary_structure.py |
One row per residue of an S4PRED ss2 file (PSIPRED VFORMAT). | entity, sample, position, residue, ss_code, category, value, p_coil, p_helix, p_strand |
seqfu/stats.py |
One row per file SeqFu stats summarised, with its sample and stage. |
sample, stage, file, sequences, total_length, mean_length, n50, n75, n90, aun, min_length, max_length |
seqkit/sequences.py |
One row per FASTA record: id, description, length and sequence. | entity, sample, description, length, sequence, sequence_id |
Dashboard tabs
One dashboard: the Overview, then four child tabs in two groups, read from the sequences that survived the filter to the structure of one of them. Each tab below carries the same icon and colour the dashboard gives it, so the page and the app read alike.
| Group | Tabs |
|---|---|
| Data & QC | Input filtering |
| Annotation | Domains, Secondary structure, Structure |
Each child tab opens with a short intro and a strip of four cards, then at most three open sections; tables follow, collapsed. The persistent Sample filters sit in the left panel and the Sample sheet (the design table and the per-sample summary) is pinned, collapsed, to the bottom of every child tab. The annotation databases share one palette, and the S4PRED states are fixed: helix, strand and coil.
Protein sequences, filtered, searched for domains and given a predicted secondary structure.
A short hero links the run parameters. About this dashboard says how the two filter levels work, The run lists the samples, the proteins, the length window, the E-value and the InterProScan applications, and Pipeline walks five steps (filter, search, match, predict, fold), each linked to its parameters and its tab. The findings are live values that follow the filters: the median annotated share, the domains and the database that reports most, the commonest predicted state, and the proteins short enough to fold.
Filters and components
Filters · the left panel starts collapsed. Key figures has its own filter bar (group and sample), Findings another (group and database): each narrows its own section only.
| Section | What it holds |
|---|---|
| Top | Hero, About this dashboard, The run, Pipeline |
| Key figures | 4 headline cards: samples, proteins, domains, residues in a domain |
| Findings | Live result rows, then 4 figures: length against annotated share, the domain architecture, the state shares and one protein along its chain |
| How to read this dashboard | The tabs by group, each with its question |
Data & QC · Which sequences passed the filter, and how well are they annotated?
The sequences removed, the protein length, the residues kept per sample and the domains per protein. Then the sequences before and after the filter, per sample, and the length against the share of the protein that sits in a domain, one point per protein, whose picked protein opens in a record card beside it. Low points are mostly outside known families. The protein table is collapsed.
Filters and components
Filters · Protein length (residues), Residues in a domain (%) and
Annotation status on proteinannotator_proteins.
| Section | What it holds |
|---|---|
| Filter at a glance | 4 cards |
| Filter yield | Sequences before and after the filter |
| Annotated share | 2 advanced visualizations: the scatter and the Protein record |
| Protein table (collapsed) | Proteins |
Annotation · Which domains does each protein carry, and do the databases agree?
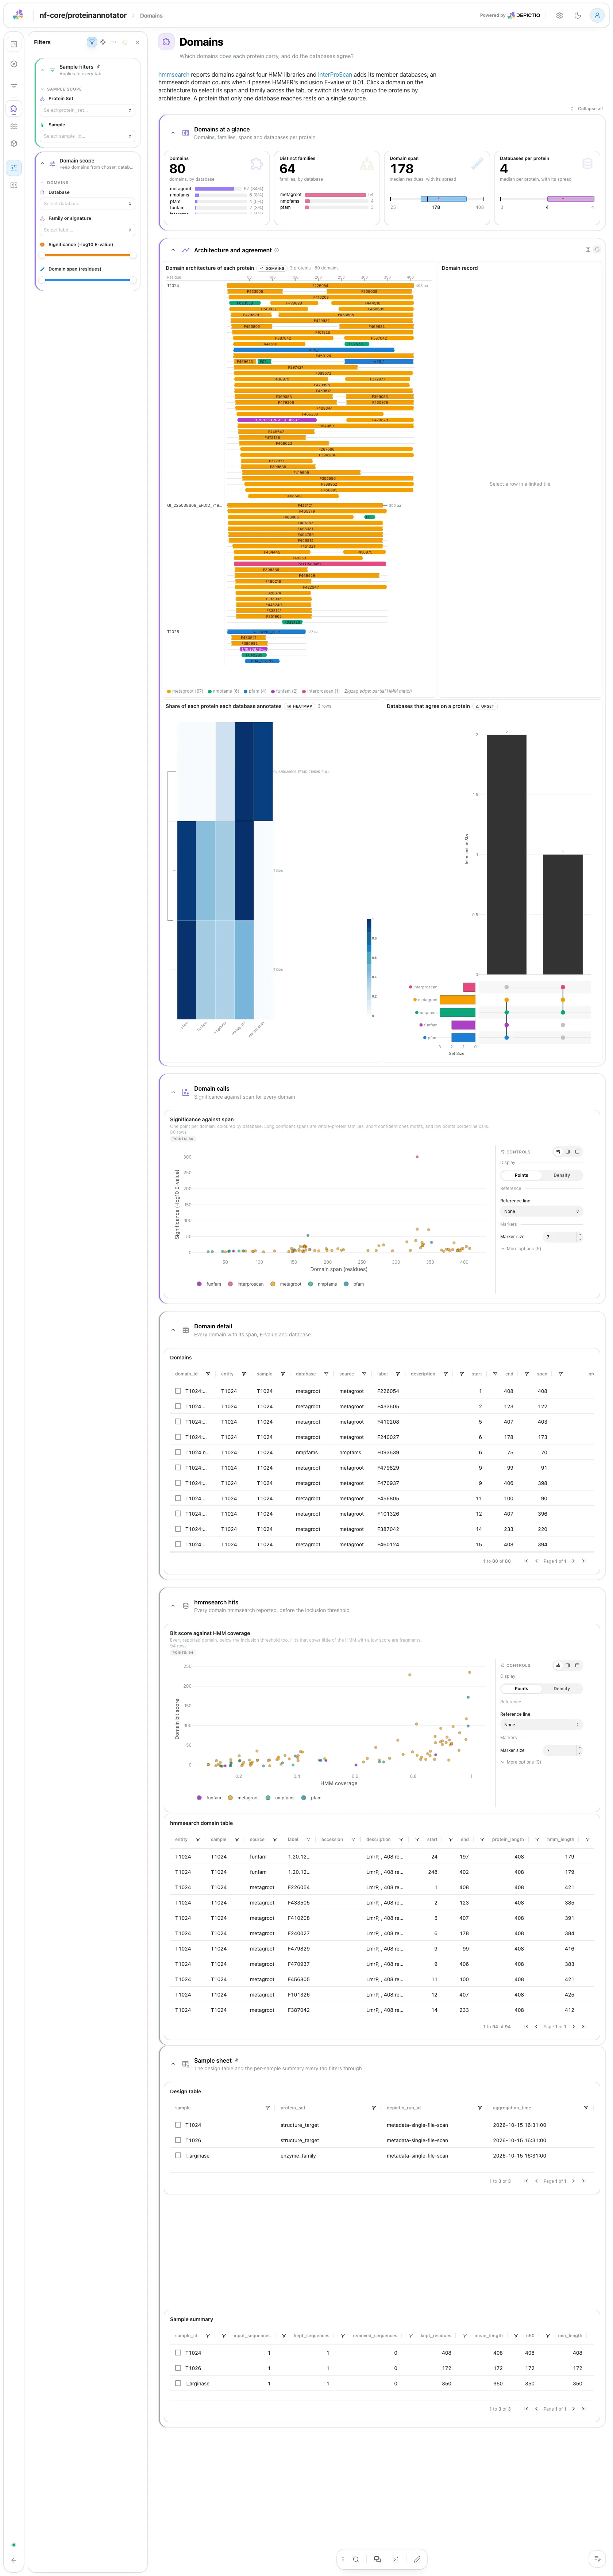
The domain architecture draws one backbone per protein with its domains from all five databases, coloured by database; a click selects the protein and the span on the residue tables and the family on the domain table, the scatter and the record card. A View control groups proteins by architecture. The architecture, its record card, the protein by database heatmap and the UpSet plot (which databases agree) share one linked view, so they stay side by side. Significance against span separates families from motifs and borderline calls. The domain table and the raw hmmsearch hits are collapsed.
Filters and components
Filters · Database, Family or signature, Significance (-log10
E-value) and Domain span (residues) on proteinannotator_domains.
| Section | What it holds |
|---|---|
| Domains at a glance | 4 cards |
| Architecture and agreement (linked view) | 4 advanced visualizations: the architecture, the Domain record, the coverage heatmap and the UpSet |
| Domain calls | Significance against span |
| Domain detail (collapsed) | Domains |
| hmmsearch hits (collapsed) | Bit score against HMM coverage, hmmsearch domain table |
Annotation · Which stretches of each protein fold as helix, strand or coil?
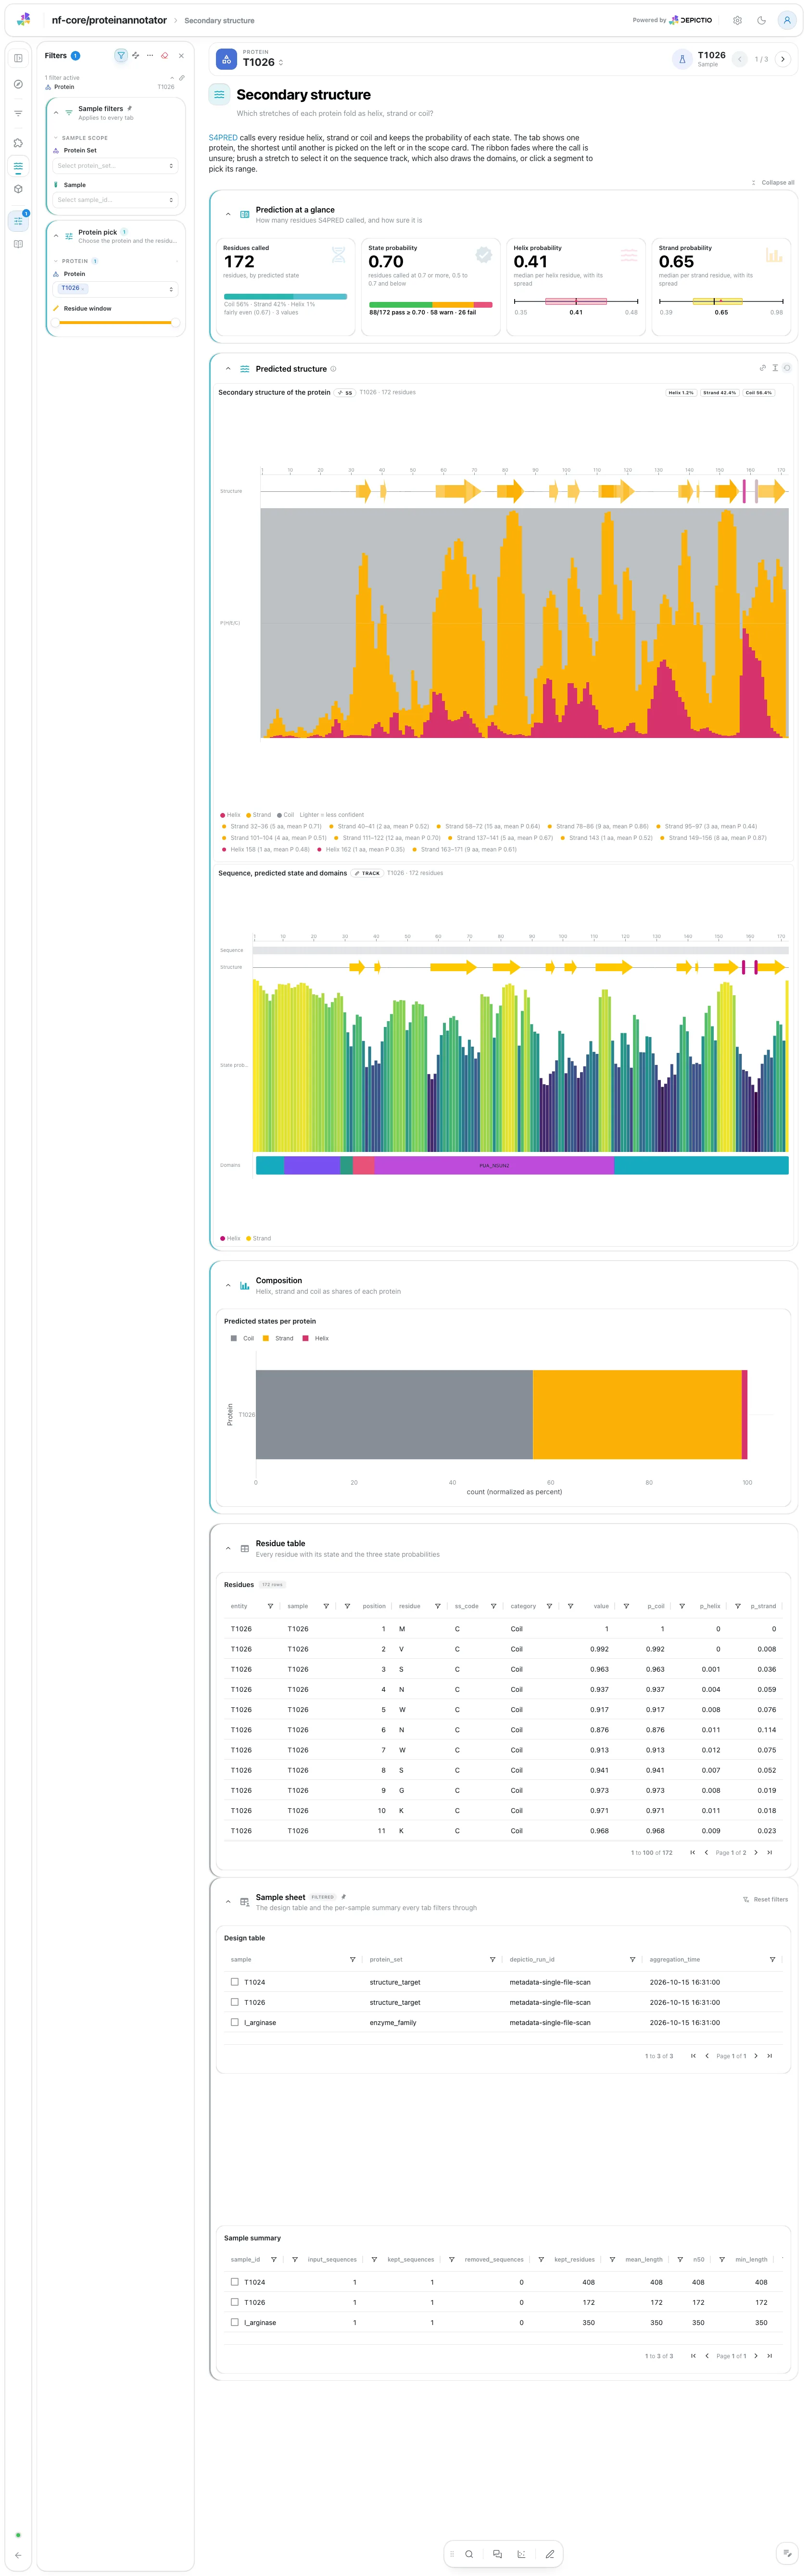
The tab shows one protein, the shortest first; its scope banner names it and its sample. The residues S4PRED called, the probability of the called state, and the helix and strand probabilities. Then a linked view stacks the secondary structure ribbon, over the probability of each state with its segment list, on the sequence track, which also draws the domain spans; a brush or a segment pick selects the same residues on both. A stacked bar compares the state shares of the proteins. The residue table is collapsed.
Filters and components
Filters · Protein (always one, opening on the shortest) and
Residue window on s4pred_secondary_structure.
| Section | What it holds |
|---|---|
| Prediction at a glance | 4 cards |
| Predicted structure (linked view) | 2 advanced visualizations: the ribbon and the sequence track |
| Composition | Predicted states per protein |
| Residue table (collapsed) | Residues |
Annotation · Where do the domains sit on one protein's 3D structure?
The tab shows one protein, the shortest first so that the first one folds. Its scope banner prints its length, domain hits and annotated share. A linked view puts its 3D structure, coloured by best domain over its written sequence, beside the sequence track (state, probability and domain spans), linked residue by residue: a click on a residue in 3D, on a letter of the sequence or a brush on the track selects the same residues in both. A protein over 400 residues cannot be folded: its tile says so, and the Protein length card flags it.
Filters and components
Filters · Protein (always one, opening on the shortest) and
Protein length (residues) on proteinannotator_proteins, and
Residue window on proteinannotator_residues. The length filter has no
default window, so every protein stays in the picker.
| Section | What it holds |
|---|---|
| Structure at a glance | 4 cards: domains, residues in a domain, domains per residue, protein length |
| Structure and domains (linked view) | 2 advanced visualizations: the predicted structure and the sequence track |
| Protein summary (collapsed) | Protein |
| Residue table (collapsed) | Residues |
Tables and point views select on entity, the protein id, so a protein picked in
one tile is the protein in the others; the domain tiles also select on the
family, and the structure and the track on the residue position.
Running the pipeline
Depictio reads the output of nf-core/proteinannotator, it does not run the pipeline. Run the pipeline first:
nextflow run nf-core/proteinannotator -r 1.1.0 \
  --input samplesheet.csv \
  --outdir results \
  -profile docker
The samplesheet is id,fasta, one protein FASTA per sample. Then point Depictio
at the results, with a design table if you have one:
depictio ingest results/ \
  --template nf-core/proteinannotator/latest \
  --var METADATA_FILE=design.tsv
For a run with --skip_interproscan or --skip_s4pred, add
--var SKIP_INTERPROSCAN=true or --var SKIP_S4PRED=true.
See nf-co.re/proteinannotator/usage for full pipeline documentation.
Required data structure
Point depictio ingest at the directory holding the pipeline output. Depictio
scans recursively and matches on file name; the sample and the database are read
off the path.
<DATA_ROOT>/
├── input/
│   └── design.tsv                              # optional, wherever --var METADATA_FILE points
├── pipeline_info/
│   ├── params_*.json
│   └── *software*versions*.yml
├── qc/<sample>/
│   ├── <sample>_{before,after}.tsv             # SeqFu statistics around the filter
│   └── <sample>.fasta                          # the filtered FASTA every later step ran on
├── domain_annotation/<db>/<sample>.domtbl.gz   # hmmsearch, one directory per library
├── functional_annotation/interproscan/<sample>/<sample>.tsv   # optional
└── s4pred/<sample>/ss2/<sequence id>.ss2       # optional
Validation runs
The repository ships
download_test_data.sh,
which fetches the subset of nf-core's AWS megatest run that the template needs
and copies the vendored samplesheet and design table into input/:
bash depictio/projects/nf-core/proteinannotator/1.1.0/download_test_data.sh \
  /tmp/proteinannotator_test
depictio ingest /tmp/proteinannotator_test \
  --template nf-core/proteinannotator/latest \
  --var METADATA_FILE=/tmp/proteinannotator_test/input/sample_metadata.tsv
The run is
s3://nf-core-awsmegatests/proteinannotator/results-cbf78d471f62d91af666e8c77bcd580b4743c6be/,
a development run that reports itself as v1.2.0dev: three single-protein FASTA
inputs (two structure-prediction targets and one enzyme) searched against
test-sized Pfam, FunFam, NMPFamsDB and MetagRoot libraries, InterProScan with the
HAMAP, TIGRFAM and SFLD applications, and S4PRED. The design table's
protein_set column was written for the demo.
Additional resources
- nf-co.re/proteinannotator: official pipeline documentation
- nf-co.re/proteinannotator/results: AWS test results
- Template System Reference: YAML format, variables, conditionals
- Recipes: how to read, test, and write recipes
Authorship
 weber8thomas
Reviewing a template on your own data, or taking over a role here, is a contribution in itself: the contributing guide says what each one involves.