

The oncoanalyser template reads the tables the Hartwig Medical Foundation WiGiTS toolkit writes for each tumor, from sequencing QC to the protein changes and neoepitopes of its variants:
- Overview: the run in four key figures, live findings and four figures, each linked to the tab that explains it
- Data & QC: BamTools coverage and insert sizes, and QSEE's verdict on each check
- Tumor profile: purity and ploidy, CUPPA's tissue of origin, COSMIC signatures and the HRD probability
- Copy number and structural variants: PURPLE's copy-number profile, gene-level events, and LINX's rearrangements and fusions
- Drivers and variants: the driver catalog, somatic small variants, and protein changes on the sequence and on a predicted structure
- Immune context: HLA alleles, candidate neoepitopes and telomere length
Tables only
The template reads the tools' tables and the PURPLE somatic VCF. It reads no BAM and no MultiQC report (the pipeline writes none), so it has no MultiQC tab. Isofox, PEACH, CIDER, ORANGE and the virus tables are not read yet.
Quick start
The pipeline outdir is what you pass: one <group_id>/ directory per tumor,
plus pipeline_info/. oncoanalyser does not publish the samplesheet it ran
on, so the template reads input/samplesheet.csv under that directory by
default. Copy your --input sheet there, or name it. A sheet you name makes
the CLI guess the id and group columns from its header, so pin them:
depictio ingest /path/to/oncoanalyser_results \
--template nf-core/oncoanalyser/latest \
--var METADATA_FILE=/path/to/samplesheet.csv \
--var METADATA_ID_COL=sample_id \
--var GROUP_COL=sample_class
| Variable | Default | Role |
|---|---|---|
METADATA_FILE |
{DATA_ROOT}/input/samplesheet.csv |
The samplesheet the run started with |
GROUP_COL |
sample_class |
Sheet column the dashboard groups samples by. The default is sample_type and sequence_type joined, e.g. tumor_dna |
GENOME |
hg38 |
UCSC name of the assembly: hg38 for GRCh38_hmf, hg19 for GRCh37_hmf. It sets the chord diagram, the genome track and its gene lane |
depictio config nextflow --install     # once per machine
nextflow run nf-core/oncoanalyser -r 3.0.0 -profile docker \
  --mode wgts --genome GRCh38_hmf --input samplesheet.csv --outdir results
No depictio ingest, and no template named: the pipeline ingests its own
output directory when it finishes and resolves this template from its own
manifest. See Nextflow trigger. The
trigger passes no --var, so put a copy of the samplesheet at
results/input/samplesheet.csv before the run, and ingest by hand for a
--genome GRCh37_hmf run.
Reference
The template reads the per-tumor tables of PURPLE, LINX, BamTools, QSEE, CUPPA,
SIGS, CHORD, LILAC, TEAL and Neo, and PURPLE's somatic VCF, of which it keeps the
PASS calls. Every output sits under <group_id>/<tool>/, so a cohort run is a set
of group directories side by side, and each recipe globs for its files. The
protein changes come from the PAVE annotation of the VCF: the three-letter
residues of each HGVS protein change become a residue number and one-letter amino
acids. A driver row from LINX is kept only when PURPLE has no row for the same
tumor, gene and driver type, so LINX's disruptions are added without doubling the
reported drivers.
Optional tools drop their tiles
CUPPA, SIGS, CHORD, LILAC, TEAL, Neo and QSEE can be excluded with
--processes_exclude, and a targeted (panel) run skips several of them. A
run without them skips those collections at ingest, and the dashboard drops
the tiles that bind them: the Findings row and the Pipeline step that cite
them, a section whose tiles all go, and the Immune context tab when LILAC, Neo
and TEAL are all missing. Without QSEE only the QC verdicts and the QSEE
table go.
Template variables
Variables you provide when running the template: DATA_ROOT is the results directory given to depictio ingest, the others are set with --var NAME=value:
| Variable | Required | Description |
|---|---|---|
DATA_ROOT |
✓ | oncoanalyser output directory (one |
METADATA_FILE |
— | The samplesheet the run was started with (--input: group_id, subject_id, sample_id, sample_type, sequence_type, filetype, filepath). Defaults to input/samplesheet.csv under DATA_ROOT. |
METADATA_ID_COL |
— | Samplesheet id column. oncoanalyser fixes it to sample_id, the name every per-sample output file carries. |
GROUP_COL |
— | Samplesheet column the dashboard groups and filters samples by. Defaults to sample_class (sample_type and sequence_type joined, e.g. tumor_dna), which the sample hub derives. |
GROUP_COL_DISPLAY |
— | Reader-facing label of GROUP_COL, used in filter and card titles. |
GENOME |
— | Genome build of the run (UCSC name): hg38 for GRCh38_hmf, hg19 for GRCh37_hmf. Sets the chromosome ring, the locus views and their gene lane. |
TRACKS_URI |
— | s3:// or https:// folder holding the run's outdir (the one with a tracks collection uploads whichever of those files DATA_ROOT holds. |
Data collections
23 data collections — 15 required 8 optional · 20 direct 3 derived.
Origin tells you whether a collection is real pipeline data or a reshape of it: direct = a pipeline output (scanned, or a recipe that reads raw files); derived = a recipe that reshapes one or more direct collections into the layout a visualization needs (no new measurement). Reads shows what produces it: a recipe .py transform, whose name links to its source on GitHub, or a raw file scanned off disk. (A direct collection can still have a recipe — one that merely parses/cleans the raw file; derived means the recipe reshapes another collection.)
| Tag | Origin | Type | Reads | Status |
|---|---|---|---|---|
samples |
direct | Table | recipe nf-core/oncoanalyser/samples.py |
required |
tracks |
direct | genomic_tracks | recipe nf-core/oncoanalyser/tracks.py |
required |
purple_purity |
direct | Table | recipe purple/purity.py |
required |
purple_cnv_segments |
direct | Table | recipe purple/cnv_segments.py |
required |
purple_gene_copy_number |
direct | Table | recipe purple/gene_copy_number.py |
required |
purple_drivers |
direct | Table | recipe purple/drivers.py |
required |
purple_somatic_variants |
direct | Table | recipe purple/somatic_variants.py |
required |
purple_protein_changes |
derived | Table | recipe purple/protein_changes.py |
required |
purple_protein_genes |
derived | Table | recipe nf-core/oncoanalyser/protein_genes.py |
required |
linx_svs |
direct | Table | recipe linx/svs.py |
required |
linx_fusions |
direct | Table | recipe linx/fusions.py |
required |
linx_fusion_structure |
derived | Table | recipe linx/fusion_structure.py |
required |
cuppa_predictions |
direct | Table | recipe cuppa/predictions.py |
optional |
cuppa_classifier_matrix |
direct | Table | recipe cuppa/classifier_matrix.py |
optional |
sigs_allocation |
direct | Table | recipe sigs/allocation.py |
optional |
chord_prediction |
direct | Table | file .*.chord.prediction.tsv$ |
optional |
teal_telomere_length |
direct | Table | file .*.teal.tellength.tsv$ |
optional |
lilac_alleles |
direct | Table | recipe lilac/alleles.py |
optional |
neo_neoepitopes |
direct | Table | recipe neo/neoepitopes.py |
optional |
hmf_bamtools_summary |
direct | Table | recipe hmf_bamtools/summary.py |
required |
hmf_bamtools_coverage_profile |
direct | Table | recipe hmf_bamtools/coverage_profile.py |
required |
hmf_bamtools_fragment_length |
direct | Table | recipe hmf_bamtools/fragment_length.py |
required |
qsee_status |
direct | Table | recipe qsee/status.py |
optional |
Conditional routes
Rows are data collections; columns are the variables you set or params.json flags auto-detected from the run. Each filled cell is the effect of setting that variable; an empty cell means that variable leaves the collection unchanged. (22 collections are unaffected by any variable — present on every run.)
+ included− removed⇄ repointed
| Data collection | TRACKS_URI |
|---|---|
tracks |
⇄ |
Cross-DC links
28 links — selecting a value in the source collection filters the target. The join column is shown after the source.
| Source · column | Target | Filters | |
|---|---|---|---|
samples · sample_id |
→ | purple_purity |
Filter the purity fit by samplesheet samples |
samples · sample_id |
→ | purple_cnv_segments |
Filter the copy-number segments by samplesheet samples |
samples · sample_id |
→ | purple_gene_copy_number |
Filter the gene copy number by samplesheet samples |
samples · sample_id |
→ | purple_drivers |
Filter the driver catalog by samplesheet samples |
samples · sample_id |
→ | purple_somatic_variants |
Filter the somatic variants by samplesheet samples |
samples · sample_id |
→ | purple_protein_changes |
Filter the protein changes by samplesheet samples |
samples · sample_id |
→ | purple_protein_genes |
Filter the genes with a protein change by samplesheet samples |
samples · sample_id |
→ | linx_svs |
Filter the structural variants by samplesheet samples |
samples · sample_id |
→ | linx_fusions |
Filter the fusions by samplesheet samples |
samples · sample_id |
→ | linx_fusion_structure |
Filter the fusion structures by samplesheet samples |
samples · sample_id |
→ | cuppa_predictions |
Filter the tissue-of-origin predictions by samplesheet samples |
samples · sample_id |
→ | cuppa_classifier_matrix |
Filter the classifier matrix by samplesheet samples |
samples · sample_id |
→ | sigs_allocation |
Filter the signature allocation by samplesheet samples |
samples · sample_id |
→ | chord_prediction |
Filter the HRD prediction by samplesheet samples |
samples · sample_id |
→ | teal_telomere_length |
Filter the telomere lengths by samplesheet samples |
samples · sample_id |
→ | lilac_alleles |
Filter the HLA alleles by samplesheet samples |
samples · sample_id |
→ | neo_neoepitopes |
Filter the neoepitopes by samplesheet samples |
samples · sample_id |
→ | hmf_bamtools_summary |
Filter the alignment summary by samplesheet samples |
samples · sample_id |
→ | hmf_bamtools_coverage_profile |
Filter the coverage curves by samplesheet samples |
samples · sample_id |
→ | hmf_bamtools_fragment_length |
Filter the fragment length curves by samplesheet samples |
samples · sample_id |
→ | qsee_status |
Filter the QC verdicts by samplesheet samples |
purple_drivers · gene |
→ | purple_protein_changes |
Filter the protein changes by the genes of the selected drivers |
purple_gene_copy_number · gene |
→ | purple_drivers |
Filter the driver catalog by the selected genes |
samples · sample_id |
→ | tracks |
Show the genome tracks of the samples picked in the left panel |
tracks · sample_id |
→ | samples |
Filter the dashboard by the samples whose tracks are picked in the genome browser |
purple_somatic_variants · sample |
→ | tracks |
Open the genome tracks of the tumor a picked call was made in |
purple_cnv_segments · sample |
→ | tracks |
Open the genome tracks of the tumor a picked copy-number segment belongs to |
linx_svs · sample |
→ | tracks |
Open the genome tracks of the tumor a picked structural variant was called in |
Recipes
Each recipe reshapes raw pipeline output into a tidy table. The name links to its source; Output lists the validated OUTPUT_SCHEMA columns.
| Recipe | Transforms | Output |
|---|---|---|
cuppa/classifier_matrix.py |
CUPPA's probabilities as a cancer type by classifier matrix, for a heatmap. | row_label, sample, cancer_type, combined |
cuppa/predictions.py |
CUPPA's tissue-of-origin probabilities, one row per tumor, classifier and cancer type. | sample, classifier_group, classifier, cancer_type, probability, rank, is_top |
hmf_bamtools/coverage_profile.py |
hmftools BamTools coverage distribution, as a cumulative curve per sample. | sample, coverage, bases, fraction, fraction_at_least |
hmf_bamtools/fragment_length.py |
hmftools BamTools fragment length distribution, decimated for a profile. | sample, fragment_length, pairs, fraction |
hmf_bamtools/summary.py |
hmftools BamTools alignment summary, one row per DNA sample. | sample, region_bases, total_reads, duplicate_reads, dual_strand_reads, mean_coverage, sd_coverage, median_coverage, mad_coverage, low_map_qual_frac, duplicate_frac, unmapped_frac, low_base_qual_frac, overlapping_read_frac, capped_coverage_frac, frac_ge_10x, frac_ge_20x, frac_ge_30x, frac_ge_60x |
lilac/alleles.py |
LILAC's HLA class I and II typing, one row per tumor and called allele. | allele_id, sample, gene, allele, ref_fragments, ref_unique_fragments, tumor_fragments, rna_fragments, tumor_copy_number, lost_in_tumor, somatic_missense, somatic_nonsense_or_frameshift, somatic_splice, somatic_inframe_indel, somatic_synonymous, somatic_mutations |
linx/fusion_structure.py |
LINX fusions as two partner lanes along the fused transcript, in exon units. | fusion_id, fusion, sample, partner, feature, start, end, retained, breakpoint, phased, reported |
linx/fusions.py |
LINX's predicted gene fusions, one row per fusion, with both partners resolved. | fusion_id, sample, fusion, gene_up, gene_down, reported, reported_type, reportable_reasons, phased, likelihood, transcript_up, transcript_down, region_up, region_down, coords_up, coords_down, fused_exon_up, fused_exon_down, exons_up_total, exons_down_total, skipped_exons_up, skipped_exons_down, chain_length, chain_links, chain_terminated, domains_kept, domains_lost |
linx/svs.py |
LINX's annotated somatic structural variants, one row per SV, as locus pairs. | sv_key, sample, sv_id, label, type, cluster_id, resolved_type, cluster_category, cluster_sv_count, chrom_a, pos_a, orient_a, chrom_b, pos_b, orient_b, length, junction_copy_number, junction_copy_number_min, junction_copy_number_max, genes_a, genes_b, is_foldback, fragile_site, line_element |
neo/neoepitopes.py |
Neo's scored neoepitopes, one row per tumor and candidate neoepitope. | neoepitope_id, sample, variant_type, variant, gene, up_amino_acids, novel_amino_acids, down_amino_acids, peptides, rna_fragments, rna_depth, expected_tpm, effective_tpm, variant_copy_number, copy_number, subclonal_likelihood |
nf-core/oncoanalyser/protein_genes.py |
One row per tumor and gene with a protein change: the protein tab's selector. | entity, sample, changes, hotspots, max_af, worst_effect, driver_likelihood, gene_role, driver_types, reported |
nf-core/oncoanalyser/samples.py |
Sample hub for nf-core/oncoanalyser: the run's samplesheet, one row per sample. | sample_id, group_id, subject_id, sample_type, sequence_type, sample_class, input_files, filetypes |
nf-core/oncoanalyser/tracks.py |
Genome-browser track manifest: one row per track file the run published. | track_id, sample_id, group_id, source_sample, kind, format, uri, name, category, order |
purple/cnv_segments.py |
PURPLE's fitted copy-number segments as a canonical cnv_profile table. |
sample, chrom, start, end, log2, baf, copy_number, segment, label, depth, minor_copy_number, major_copy_number |
purple/drivers.py |
The run's driver catalog, somatic and germline, one row per gene and driver. | driver_id, sample, gene, driver, origin, source_tool, category, reported, report_status, driver_likelihood, likelihood_method, biallelic, missense, nonsense, splice, inframe, frameshift, min_copy_number, max_copy_number, chrom, chromosome_band, transcript |
purple/gene_copy_number.py |
PURPLE's copy number per gene, with a call a reader can filter on. | sample, gene, chrom, start, end, chromosome_band, transcript, min_copy_number, max_copy_number, min_minor_allele_copy_number, relative_min_copy_number, somatic_regions, cn_event, reported_status, driver_type |
purple/protein_changes.py |
Protein-changing somatic variants in the protein module's variant contract. | entity, position, ref_aa, alt_aa, category, value, label, sample, hgvs_p, hgvs_c, transcript, canonical_effect, variant_key, chrom, pos, variant_copy_number, biallelic, hotspot, reported |
purple/purity.py |
PURPLE's tumor fit and QC verdict, one row per tumor sample. | sample, purity, ploidy, fit_status, sex, whole_genome_duplication, ms_indels_per_mb, ms_status, tmb_per_mb, tmb_status, tml, tml_status, sv_tmb, diploid_fraction, polyclonal_fraction, min_purity, max_purity, min_ploidy, max_ploidy, fit_score, run_mode, qc_status, fit_method, cn_segments, unsupported_cn_segments, deleted_genes, contamination, germline_aberrations, amber_mean_depth, loh_fraction, tinc_level |
purple/somatic_variants.py |
PURPLE's somatic small variants, one row per PASS call, with PAVE's impact. | variant_key, sample, chrom, pos, ref, alt, variant_type, tier, gene, transcript, canonical_effect, coding_effect, hgvs_c, hgvs_p, worst_coding_effect, splice_region, tumor_af, tumor_depth, tumor_alt_reads, purple_af, copy_number, variant_copy_number, minor_allele_copy_number, subclonal_likelihood, biallelic, hotspot, reported, kataegis, trinucleotide_context, germline_status, gnomad_frequency, mappability |
qsee/status.py |
QSEE's QC verdicts, one row per sample and checked feature. | check_id, sample, sample_type, source_tool, feature_type, feature, value, qc_status, fail_condition |
sigs/allocation.py |
SIGS' COSMIC signature allocation, one row per tumor and signature. | sample, signature, allocation, fraction, percent |
Dashboard tabs
One dashboard: the Overview, then eight child tabs in three groups, read as a funnel from the sequencing to the tumor's genome and then to its variants. Each tab below carries the same icon and colour the dashboard gives it, so the page and the app read alike.
| Group | Tabs |
|---|---|
| Data & QC | Sequencing QC |
| Genome | Tumor profile, Copy number, Structural variants |
| Variants | Drivers, Small variants, Protein changes, Immune context |
Each child tab opens with a short intro and a strip of four cards, then at most three open sections; tables and record cards follow, collapsed. The persistent Sample filters (sample class, sample, analysis group) sit in the left panel and narrow every tab through the samplesheet links. The Sample sheet is pinned, collapsed, to the bottom of every child tab. The Structural variants and Small variants tabs each embed a genome browser with the tumor's calls and reads.
Tumor genomes, from the reads to purity, copy number, drivers, variants and immune context.
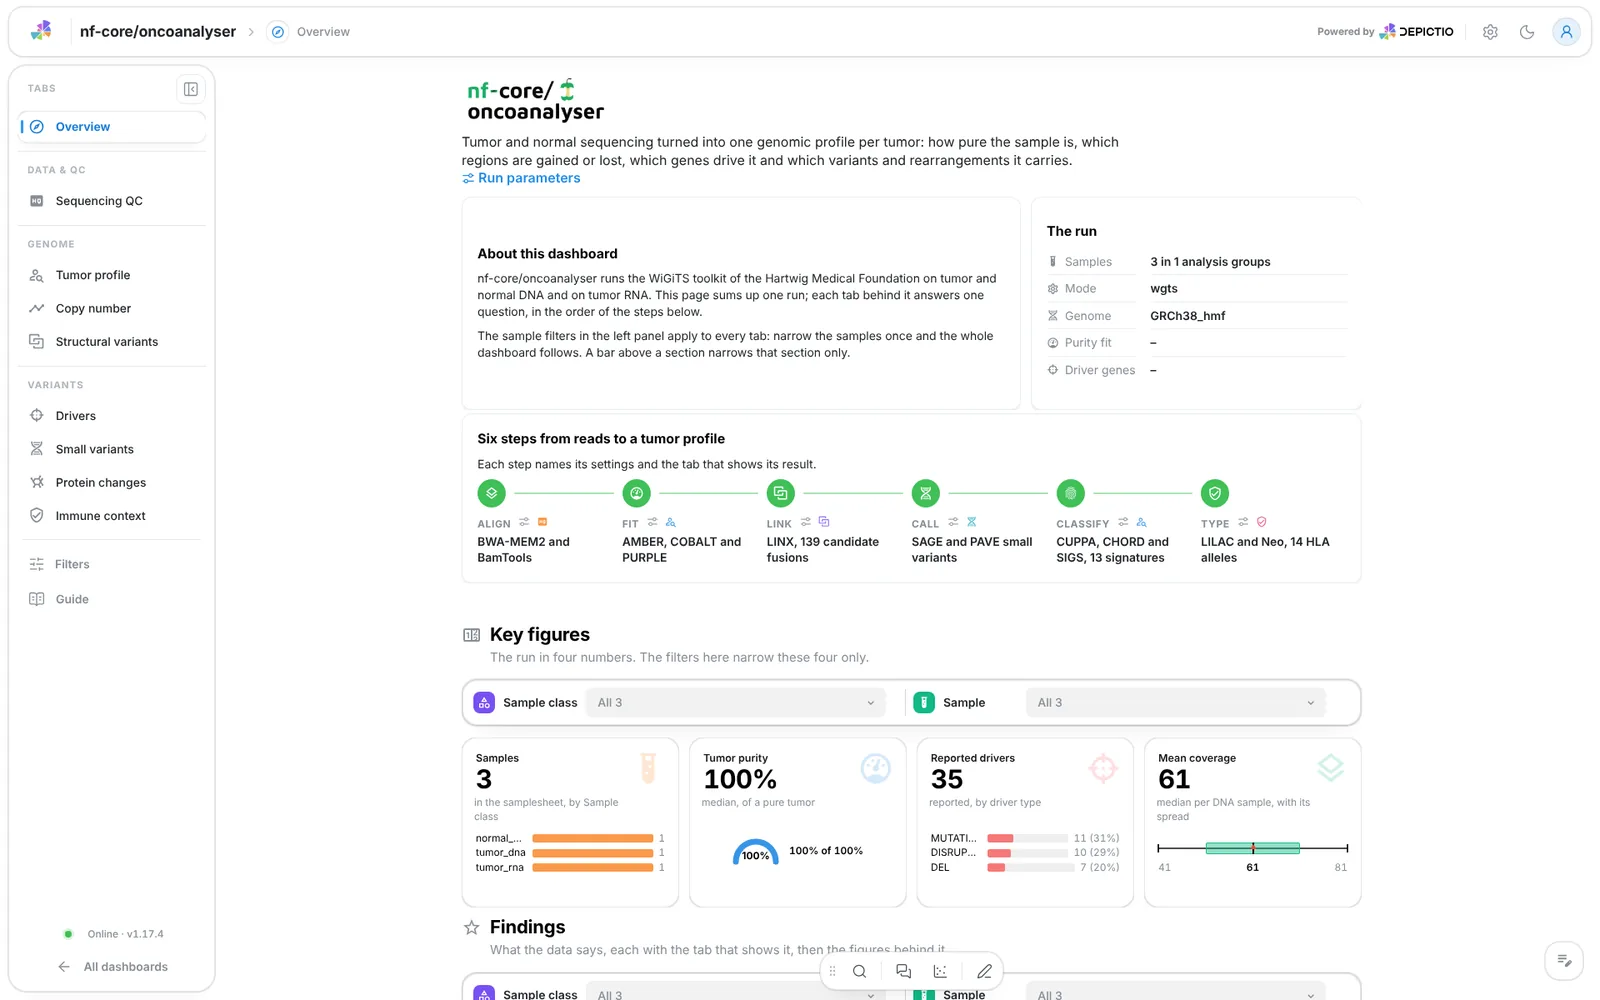
A short hero links the run parameters. About this dashboard says how the two filter levels work, The run lists the samples, analysis groups, mode, genome and purity fit, and Pipeline walks six steps (align, fit, link, call, classify, type), each linked to its settings and its tab. The findings are live values and follow the filters: the leading signature's share of SNVs, genes lost and gained, structural variants by their commonest resolved event, and somatic calls per megabase. A run without CUPPA and SIGS loses the signature finding.
Filters and components
Filters · the left panel starts collapsed. Key figures and Findings each have their own filter bar (sample class and sample id): each narrows its own section only.
| Section | What it holds |
|---|---|
| Top | Hero, About this dashboard, The run, Pipeline |
| Key figures | 4 headline cards: samples, tumor purity, reported drivers, mean coverage |
| Findings | Live result rows, then 4 figures: the signature shares, the copy-number profile, the structural variant chord diagram and the allele frequency histogram |
| How to read this dashboard | The tabs by group, each with its question |
Data & QC · Is the sequencing deep and clean enough for the calls?
BamTools' summary and QSEE's checks. The mean coverage, reads per sample, the highest duplicate share and the lowest share at 30x or more. Then the cumulative coverage and the insert size distribution, one curve per sample, and QSEE's PASS, WARN and FAIL verdicts per tool. The BamTools summary with a library record and the QSEE check table are collapsed.
Filters and components
Filters · a Mean coverage range on hmf_bamtools_summary, and
QC verdict and Source tool on qsee_status.
| Section | What it holds |
|---|---|
| QC at a glance | 4 cards |
| Coverage and insert size | 2 advanced visualizations |
| QC verdicts | QC verdicts per tool |
| Library detail (collapsed) | BamTools summary per sample, Library record |
| QC reference tables (collapsed) | QSEE checks |
Genome · How pure is the tumor, and what kind of tumor is it?
PURPLE's fit and the classifiers around it. Purity, ploidy, mutations per Mb and microsatellite indels. Then CUPPA's cancer-type probability per classifier as a heatmap, the share of SNVs per COSMIC signature beside CHORD's HRD probability and the SNVs allocated, and purity against ploidy with one point per tumor. The PURPLE fit table with a tumor record and the CUPPA and CHORD tables are collapsed.
Filters and components
Filters · PURPLE fit status and PURPLE QC on purple_purity.
| Section | What it holds |
|---|---|
| Tumor at a glance | 4 cards |
| Tissue of origin | 1 advanced visualization: the CUPPA heatmap |
| Mutational processes | Share of SNVs per mutational signature, 2 cards |
| Purity and ploidy | 1 advanced visualization |
| Tumor detail (collapsed) | PURPLE fit per tumor, Tumor record |
| Reference tables (collapsed) | CUPPA probabilities, CHORD prediction |
Genome · Which regions are gained or lost, and in which genes?
Segments, the median segment copy number, genes in view and the LOH share of
the genome. Then PURPLE's copy-number profile along the genome (log2 of copy
number over 2, with the B-allele frequency underneath) and the lowest against
the highest copy number per gene. Events follow PURPLE's cut-offs: AMP when
the lowest copy number is above three times the ploidy, DEL below 0.5
copies, LOH when the minor allele is below 0.5 copies, and PARTIAL_* when
only part of the gene qualifies. The tab opens with the event filter on whole
and partial amplifications and deletions so the gene scatter stays readable;
clearing it adds the genes with LOH or no change. The gene table with a gene
record is collapsed.
Filters and components
Filters · Gene copy-number event on purple_gene_copy_number and
Chromosome on purple_cnv_segments.
| Section | What it holds |
|---|---|
| Copy number at a glance | 4 cards |
| Copy-number profile | 1 advanced visualization |
| Gene copy number | 1 advanced visualization |
| Gene detail (collapsed) | Copy number per gene, Gene record |
Genome · Which rearrangements shaped the genome, and which fusions follow?
LINX's clustered rearrangements and fusion calls. Structural variants, SV clusters, the median junction copy number and candidate fusions. Then a chord diagram of the breakend pairs beside the SVs per resolved event, and the kept and lost exons per fusion beside the fusions per reading frame. The pipeline writes no transcript model, so exon spans are drawn in exon units along the fused transcript, from the fused and total exon counts of each partner. The fusion table with a fusion record and the SV table are collapsed.
Filters and components
Filters · Resolved event and SV type on linx_svs, and Fusion
phase on linx_fusions.
| Section | What it holds |
|---|---|
| Structural variants at a glance | 4 cards |
| Rearrangement landscape | 1 advanced visualization: the chord diagram, and SVs per resolved event |
| Fusion structure | 1 advanced visualization: the exon layout, and Fusions per reading frame |
| Fusion detail (collapsed) | Candidate fusions, Fusion record |
| Structural variant tables (collapsed) | Structural variants |
Variants · Which genes drive this tumor, and how?
PURPLE's driver catalog, with LINX's disruptions added. Driver entries,
oncogenes and suppressors, biallelic entries and the median driver
likelihood. Then an oncoplot of driver genes by tumor and driver type beside
the entries per gene role, and the likelihood per driver type. The tab opens
with Report status on REPORTED so the oncoplot stays readable on a
whole-genome catalog; clearing it adds the unreported entries. The driver
table with a driver record is collapsed.
Filters and components
Filters · Driver type, Gene role, Origin and Report status on
purple_drivers.
| Section | What it holds |
|---|---|
| Drivers at a glance | 4 cards |
| Driver landscape | 1 advanced visualization: the oncoplot, and Entries per gene role and driver type |
| Driver likelihood | Driver likelihood per driver type |
| Driver detail (collapsed) | Driver catalog, Driver record |
Variants · How many somatic variants are there, and how clonal?
PASS calls of PURPLE's somatic VCF, with the gene, effect and HGVS change from PAVE's canonical transcript. Somatic calls, coding calls, the median purity-adjusted allele frequency and the median variant copy number. Then their histograms (a variant type keeps one colour on every tile) and every call along the genome, with a gene lane. The variant table with a variant record is collapsed.
Filters and components
Filters · Coding effect, Variant type and a Purity-adjusted allele
frequency range on purple_somatic_variants.
| Section | What it holds |
|---|---|
| Variants at a glance | 4 cards |
| Clonality | Purity-adjusted allele frequency, Variant copy number |
| Along the genome | 1 advanced visualization |
| Variant detail (collapsed) | Somatic small variants, Variant record |
Variants · Which proteins change, and where on the protein and its structure?
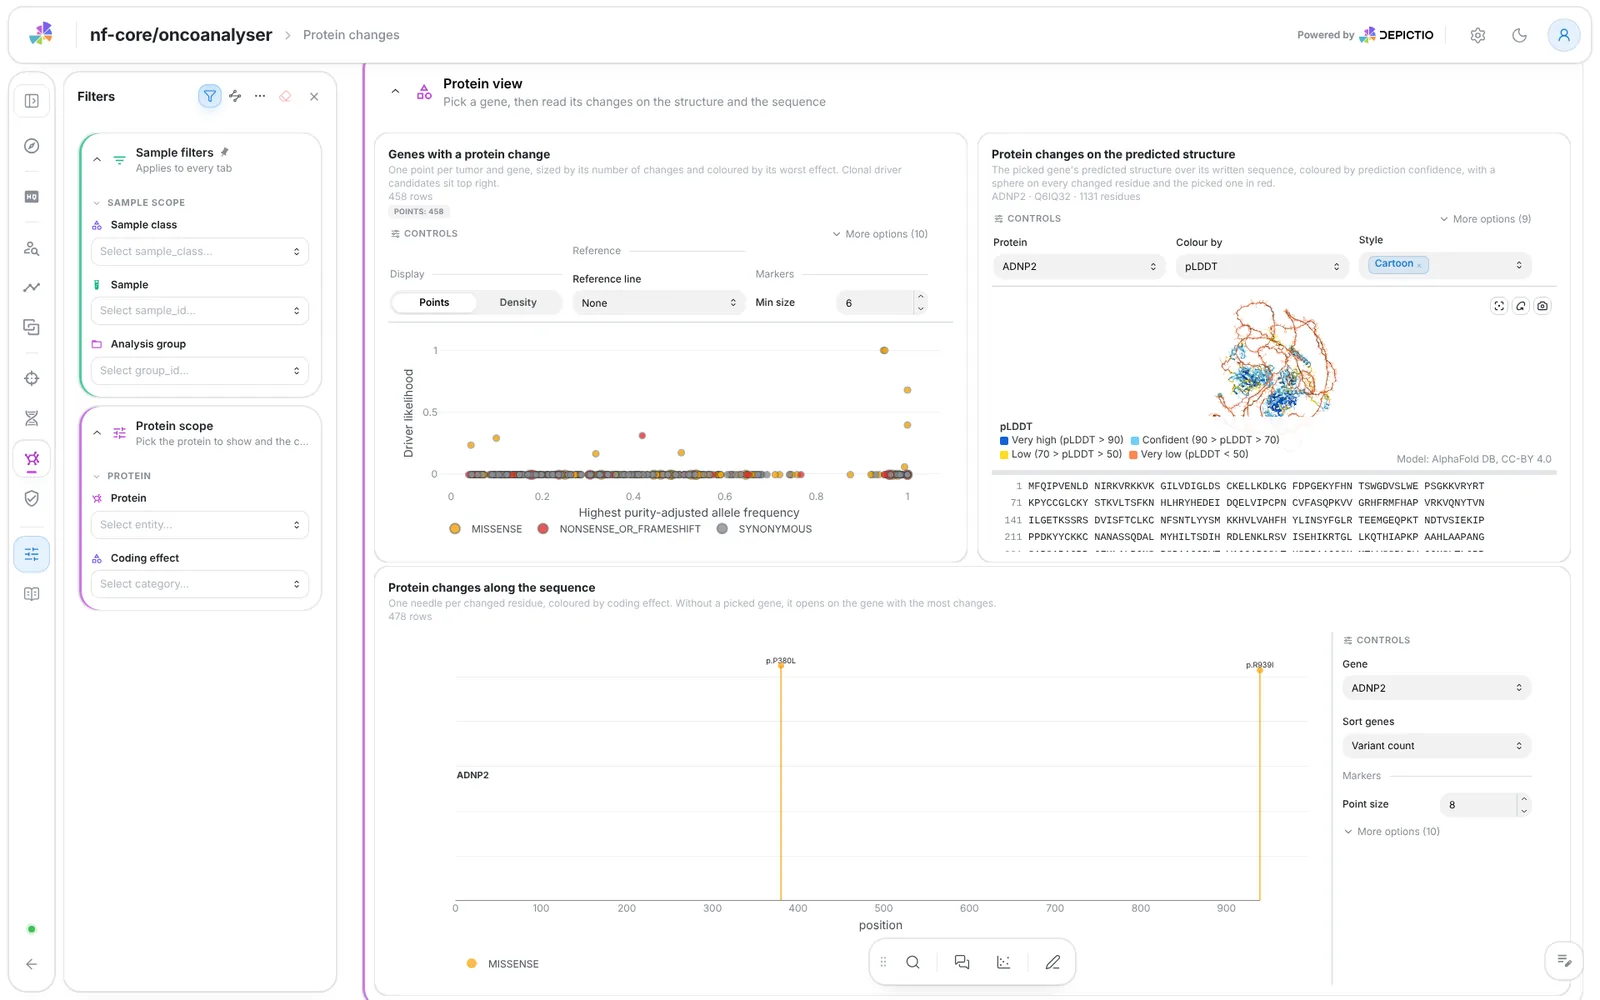
Protein changes, proteins hit, changes at known hotspots and the median
allele frequency. Then a scatter of the genes with a change (highest
purity-adjusted allele frequency against PURPLE's driver likelihood, sized by
change count, coloured by worst effect) beside the predicted structure of the
picked gene over its written sequence, and a full-width lollipop of its
changes. Click a gene on the scatter and the other two follow it; click a
residue in one and it is marked in the others, red on the structure. Without a
pick the views open on the protein with the most changes, and the Protein
filter drives them too. The change table with a record is collapsed.
The structure tile needs the resolver
The pipeline predicts no structure. The 3D structure
tile looks the picked gene up by its symbol (UniProt, then the AlphaFold DB
model), which needs DEPICTIO_STRUCTURE_RESOLVER_ENABLED=true on the
server (it is off by default; see the
structure resolver).
With it off the tile says the lookup is disabled, and the scatter, the
lollipop and the table keep working. A change whose reference residue
disagrees with the model is listed, not drawn.
Filters and components
Filters · Protein (a single pick) and Coding effect on
purple_protein_changes.
| Section | What it holds |
|---|---|
| Protein changes at a glance | 4 cards |
| Protein view | 3 advanced visualizations: the gene scatter, the structure and the lollipop |
| Protein change detail (collapsed) | Protein changes, Protein change record |
Variants · Which HLA alleles does the tumor keep, and what could they present?
LILAC's HLA alleles, Neo's candidate neoepitopes and TEAL's telomere length. HLA alleles, candidate neoepitopes, their median expression and telomere length. Then the tumor copy number per HLA allele beside the telomere length per sample, and neoepitope expression against variant copy number beside the neoepitopes per source event. The neoepitope table with a record and the HLA allele and telomere tables are collapsed. The tab is dropped when LILAC, Neo and TEAL are all missing.
Filters and components
Filters · HLA gene on lilac_alleles and Neoepitope source on
neo_neoepitopes.
| Section | What it holds |
|---|---|
| Immune context at a glance | 4 cards |
| HLA and telomeres | Tumor copy number per HLA allele, Telomere length per sample |
| Neoepitopes | 1 advanced visualization, Neoepitopes per source event |
| Neoepitope detail (collapsed) | Candidate neoepitopes, Neoepitope record |
| Immune reference tables (collapsed) | HLA alleles, Telomere length |
The sample sheet selects on sample_id, and the sample links carry the pick to
every collection. A driver pick narrows the protein changes to its genes, and a
gene picked in the copy-number table or scatter narrows the driver catalog. Each
record card sits beside the table that drives it and opens on the selected row.
Running the pipeline
Depictio reads the output of nf-core/oncoanalyser, it does not run the
pipeline. Run the pipeline first; its --input sheet has one row per input file
with group_id, subject_id, sample_id, sample_type and sequence_type:
nextflow run nf-core/oncoanalyser -r 3.0.0 \
  --mode wgts \
  --genome GRCh38_hmf \
  --input samplesheet.csv \
  --outdir results -profile docker
Then point Depictio at the results, with the samplesheet the run started with:
depictio ingest results/ \
  --template nf-core/oncoanalyser/latest \
  --var METADATA_FILE=samplesheet.csv \
  --var METADATA_ID_COL=sample_id \
  --var GROUP_COL=sample_class
See nf-co.re/oncoanalyser/usage for full pipeline documentation.
Required data structure
Point depictio ingest at the pipeline outdir. Depictio scans recursively and
matches on file name; every tumor-level file is named after the tumor's
sample_id, which is the key the sample hub links on.
<DATA_ROOT>/
├── input/samplesheet.csv                          # not published by the pipeline: copy it here, or --var METADATA_FILE
├── pipeline_info/
│   ├── params*.json
│   └── *software*versions*.yml
└── <group_id>/                                    # one directory per tumor
    ├── purple/
    │   ├── *.purple.{purity.tsv,qc,cnv.somatic.tsv,cnv.gene.tsv,somatic.vcf.gz}
    │   └── *.driver.catalog.*.tsv
    ├── linx/
    │   ├── somatic_annotations/*.linx.{svs,clusters,fusion,breakend}.tsv
    │   └── {somatic,germline}_annotations/*.driver.catalog.tsv
    ├── bamtools/<sample>/*.bam_metric.{summary,coverage,frag_length}.tsv
    ├── qsee/*.qsee.status.tsv.gz                  # optional
    ├── cuppa/*.cuppa.vis_data.tsv                 # optional
    ├── sigs/*.sig.allocation.tsv                  # optional
    ├── chord/*.chord.prediction.tsv               # optional
    ├── lilac/*.lilac.tsv                          # optional
    ├── teal/*.teal.tellength.tsv                  # optional
    └── neo/scorer/*.neo.neoepitope.tsv            # optional
Validation runs
The template was validated against the AWS megatest of the 3.0.0 release,
results-7c74c87a43749952b38c9a18915947570f0595a0, on its test_full profile:
one WGTS subject, a tumor and normal DNA pair plus tumor RNA. The full run is
272 GB, almost all of it BAMs. megatest.yaml lists the tables-only subset the
template needs, about 33 MB, and the script copies the samplesheet under
input/. The screenshots above come from that run:
bash depictio/projects/nf-core/oncoanalyser/3.0.0/download_test_data.sh /tmp/oncoanalyser_test
depictio ingest /tmp/oncoanalyser_test --template nf-core/oncoanalyser/latest
Do not pass --project when ingesting: the dashboard is attached to the
project by name, so renaming it breaks a later depictio dashboard import.
Re-ingesting accumulates dashboards, so delete the project before repeating a run.
Additional resources
- nf-co.re/oncoanalyser: official pipeline documentation
- nf-co.re/oncoanalyser/3.0.0/results: AWS test results
- Template System Reference: YAML format, variables, conditionals
- Recipes: how to read, test, and write recipes
Authorship
 weber8thomas
Reviewing a template on your own data, or taking over a role here, is a contribution in itself: the contributing guide says what each one involves.