

The differentialabundance template covers the DESeq2 route of a standard nf-core/differentialabundance run:
- Overview: the run in four key figures, live findings and four figures, each linked to the tab that explains it
- Data & QC: the sample space, DESeq2 size factors, the expression distribution per sample and the most variable features
- Differential: volcano with MA and QQ views per contrast, test diagnostics, effect size by biotype, and every annotated call on the genome
- Gene sets: GSEA enrichment per contrast and pole (needs a GSEA run)
The DESeq2 route only
This template binds --differential_method deseq2, the pipeline default. The
limma, propd and dream routes write differently named tables and are not
covered.
No MultiQC tab
differentialabundance runs no MultiQC: its reporting is an R/shinyngs application, which is not parquet-backed and has nothing Depictio can read. The Samples tab carries the run-level quality read instead.
Quick start
depictio ingest /path/to/differentialabundance_results \
  --template nf-core/differentialabundance/latest
The results directory is the only thing you have to pass. The observation sheet is
auto-detected from {DATA_ROOT}/input/; pass
--var SAMPLESHEET_FILE=... to point somewhere else.
GSEA is opt-in in the pipeline. For a run that did not run it, add
--var NO_GSEA=true: the two enrichment collections are pruned and the
Enrichment tab drops out instead of scanning for tables that were never
written.
| Variable | Required | Meaning |
|---|---|---|
DATA_ROOT |
yes | The run's output directory (tables/, other/, pipeline_info/) |
SAMPLESHEET_FILE |
no | The pipeline's --input observation sheet, CSV or TSV; auto-detected from {DATA_ROOT}/input/ |
NO_GSEA |
no | Set for a run without GSEA; prunes the Enrichment tab |
depictio config nextflow --install     # once per machine
nextflow run nf-core/differentialabundance -r 2.0.0 -profile docker --outdir results
No depictio ingest, and no template named: the pipeline ingests its own
output directory when it finishes and resolves this template from its own
manifest. See Nextflow trigger.
Reference
The template reads the per-contrast DESeq2 tables, the same statistics joined to the GTF annotation, the variance-stabilised matrix and the per-sample size factors. Contrast ids are recovered from the result file names, so no contrast variable is needed.
Self-adapting layout
The dashboard adapts to whatever the run actually produced: components bound to pruned or unparsed data collections are hidden, tabs left with no real visualizations are dropped entirely, and the remaining components are re-packed so there are no empty rows.
Template variables
Variables you provide when running the template: DATA_ROOT is the results directory given to depictio ingest, the others are set with --var NAME=value:
| Variable | Required | Description |
|---|---|---|
DATA_ROOT |
✓ | Root directory containing differentialabundance output (tables/, other/, pipeline_info/). |
SAMPLESHEET_FILE |
— | Path to the pipeline's --input observation sheet. Auto-detected from {DATA_ROOT}/input/ (CSV or TSV) when omitted; download_test_data.sh puts the megatest's sheet there. |
NO_GSEA |
— | Set (--var NO_GSEA=true) for a run that did not run GSEA (no --gsea_run, or no gene-set file). Prunes the two enrichment collections, so the Enrichment tab drops out instead of scanning for tables that were never written. |
Data collections
11 data collections — 7 required 4 optional · 8 direct 3 derived.
Origin tells you whether a collection is real pipeline data or a reshape of it: direct = a pipeline output (scanned, or a recipe that reads raw files); derived = a recipe that reshapes one or more direct collections into the layout a visualization needs (no new measurement). Reads shows what produces it: a recipe .py transform, whose name links to its source on GitHub, or a raw file scanned off disk. (A direct collection can still have a recipe — one that merely parses/cleans the raw file; derived means the recipe reshapes another collection.)
| Tag | Origin | Type | Reads | Status |
|---|---|---|---|---|
samples |
direct | Table | recipe nf-core/differentialabundance/samples.py |
required |
deseq2_results_raw |
direct | Table | file .*.deseq2.results.tsv$ |
required |
deseq2_results_annotated_raw |
direct | Table | file .*_deseq2.annotated.tsv$ |
optional |
deseq2_results |
derived | Table | recipe deseq2/results_long.py |
required |
deseq2_results_annotated |
derived | Table | recipe deseq2/results_annotated.py |
optional |
deseq2_vst_pca |
direct | Table | recipe deseq2/vst_pca.py |
required |
deseq2_vst_heatmap |
direct | Table | recipe deseq2/vst_top_variable.py |
required |
deseq2_sample_distance |
direct | Table | recipe deseq2/vst_sample_distance.py |
required |
deseq2_vst_distribution |
direct | Table | recipe deseq2/vst_distribution.py |
required |
gsea_report_raw |
direct | Table | file ..gsea_report_for_..tsv$ |
optional |
gsea_report |
derived | Table | recipe gsea/report.py |
optional |
Conditional routes
Rows are data collections; columns are the variables you set or params.json flags auto-detected from the run. Each filled cell is the effect of setting that variable; an empty cell means that variable leaves the collection unchanged. (9 collections are unaffected by any variable — present on every run.)
+ included− removed⇄ repointed
| Data collection | NO_GSEA |
|---|---|
gsea_report_raw |
− |
gsea_report |
− |
Cross-DC links
11 links — selecting a value in the source collection filters the target. The join column is shown after the source.
| Source · column | Target | Filters | |
|---|---|---|---|
samples · sample_id |
→ | deseq2_vst_pca |
Filter the sample PCA by the samples picked on the hub sheet |
samples · sample_id |
→ | deseq2_sample_distance |
Filter the sample-distance matrix by the samples picked on the hub sheet |
deseq2_vst_pca · sample_id |
→ | deseq2_sample_distance |
Carry a cluster lassoed on the PCA over to the sample-distance matrix |
deseq2_results · gene_id |
→ | deseq2_results_annotated |
Carry a gene selected on the differential scatter over to the annotated table |
deseq2_results_annotated · gene_id |
→ | deseq2_results |
Carry a gene selected in the annotated table back to the differential panels |
samples · sample_id |
→ | deseq2_vst_heatmap |
Narrow the variance-stabilised heatmap to the samples picked on the hub sheet |
deseq2_vst_pca · sample_id |
→ | deseq2_vst_heatmap |
Carry a cluster lassoed on the PCA over to the variance-stabilised heatmap |
samples · sample_id |
→ | deseq2_vst_distribution |
Filter the per-sample distributions by the samples picked on the hub sheet |
deseq2_vst_pca · sample_id |
→ | deseq2_vst_distribution |
Carry a cluster lassoed on the PCA over to the per-sample distributions |
deseq2_results · contrast |
→ | deseq2_results_annotated |
Narrow the annotated statistics to the contrasts picked in the left panel |
deseq2_results · contrast |
→ | gsea_report |
Filter the enrichment panels to the contrast picked on the differential tab |
Recipes
Each recipe reshapes raw pipeline output into a tidy table. The name links to its source; Output lists the validated OUTPUT_SCHEMA columns.
| Recipe | Transforms | Output |
|---|---|---|
deseq2/results_annotated.py |
Annotated DESeq2 results: statistics joined to the gene annotation. | contrast, gene_id, gene_name, chromosome, start, end, gene_biotype, base_mean, log2fc, lfc_se, pvalue, padj, neg_log10_padj, significant, direction |
deseq2/results_long.py |
Long DESeq2 results table, one row per (contrast, feature). | contrast, gene_id, base_mean, log2fc, lfc_se, pvalue, padj, log2_base_mean, neg_log10_padj, significant, direction |
deseq2/vst_distribution.py |
Per-sample expression distributions from the variance-stabilised matrix. | sample_id, bin_centre, density, group, q1, median, q3, p05, p95, floor_share |
deseq2/vst_pca.py |
Sample PCA on the DESeq2 variance-stabilised matrix (embedding schema). | sample_id, dim_1, dim_2, group |
deseq2/vst_sample_distance.py |
Sample-to-sample distance matrix on the DESeq2 variance-stabilised data. | sample |
deseq2/vst_top_variable.py |
Top variable genes of the DESeq2 variance-stabilised matrix, for ComplexHeatmap. | gene_id |
gsea/report.py |
Enriched gene sets, from the GSEA report tables a pre-ranked run publishes. | contrast, phenotype, term, size, es, nes, abs_nes, nom_pvalue, fdr_qvalue, fwer_pvalue, neg_log10_fdr, rank_at_max, leading_edge_percent, leading_edge |
nf-core/differentialabundance/samples.py |
Sample hub for nf-core/differentialabundance: the sample sheet plus DESeq2 size factors. | sample_id, group, size_factor, factor_2, factor_2_name, factor_3, factor_3_name, factor_4, factor_4_name |
Dashboard tabs
One dashboard: the Overview, then four child tabs in three groups, read as a funnel from the samples to the gene sets that move. Each tab below carries the same icon and colour the dashboard gives it, so the page and the app read alike.
| Group | Tabs |
|---|---|
| Data & QC | Samples |
| Differential | Differential expression, Genome view |
| Gene sets | Enrichment |
Each child tab opens with a short intro and a strip of four cards, then at most three open sections; tables and details follow, collapsed. Two persistent filter sections sit in the left panel. Sample filters (the group, the sample and three further factors) narrow the Samples tab and the sample sheet: a contrast pools its samples, so the differential tables have no sample column. Contrast narrows the three analysis tabs, and one pick follows you from tab to tab. The Sample sheet is pinned, collapsed, to the bottom of every child tab.
DESeq2 differential expression, from sample space to the gene sets that move.
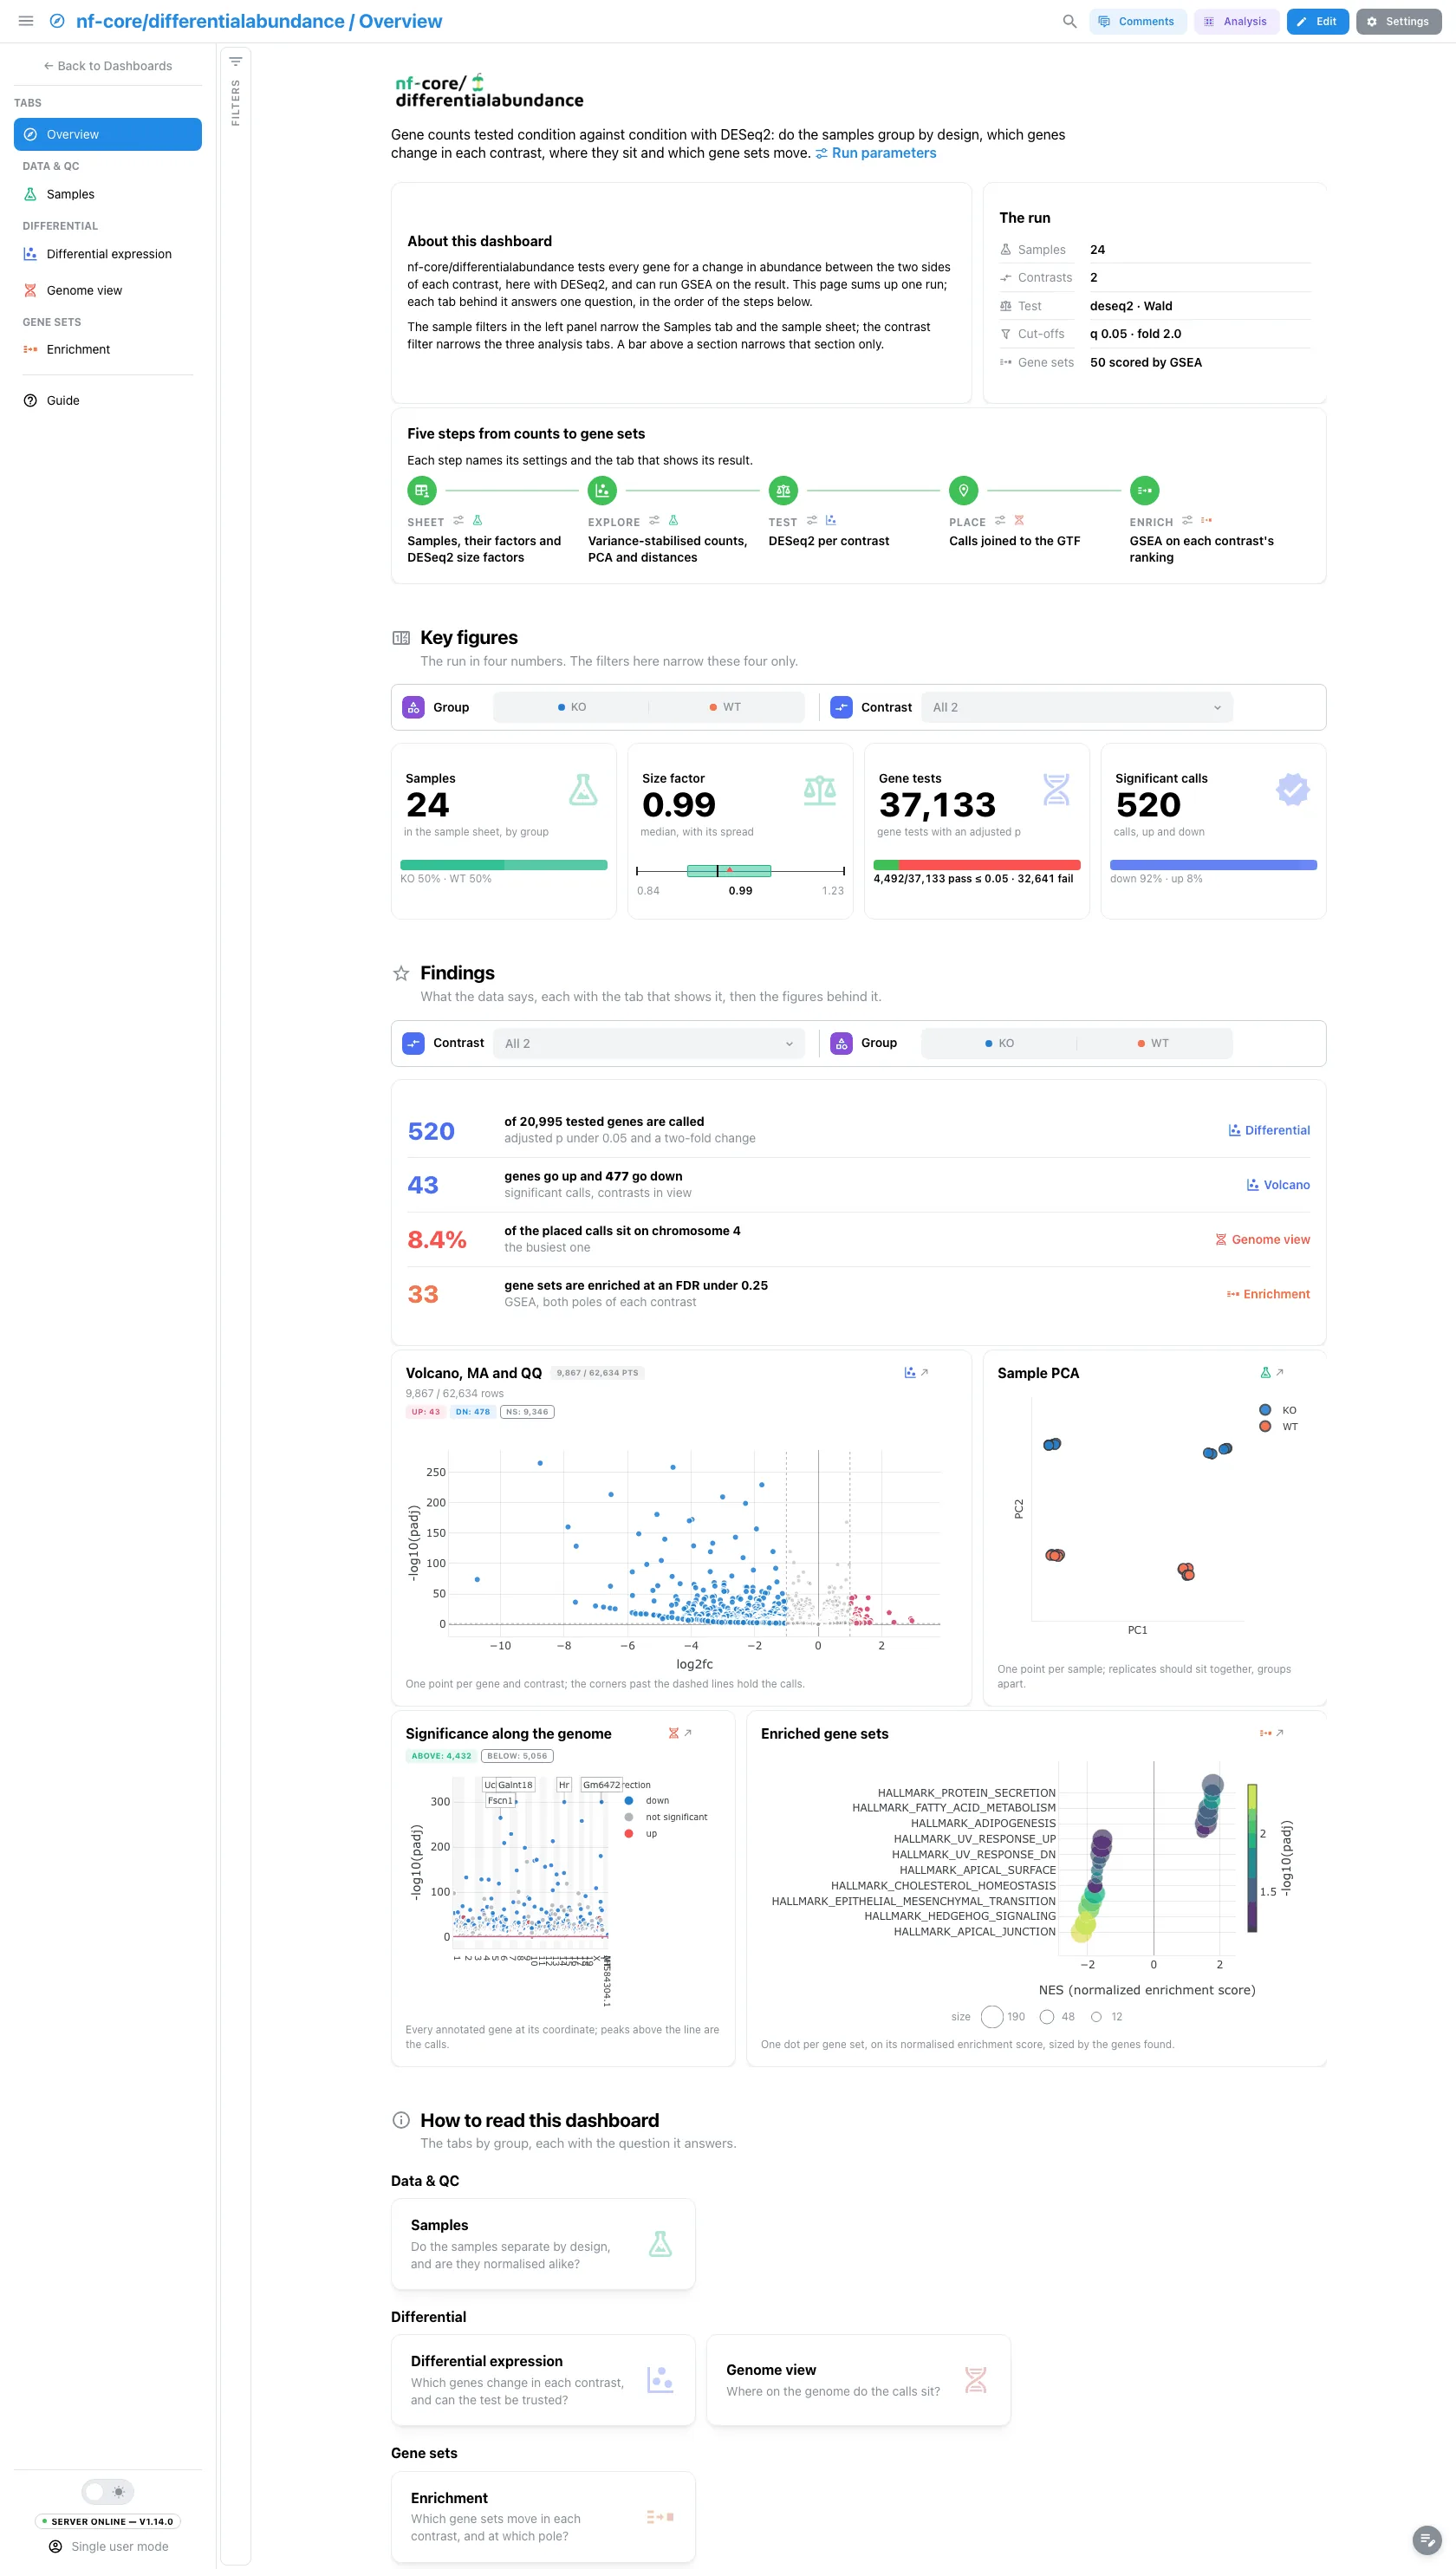
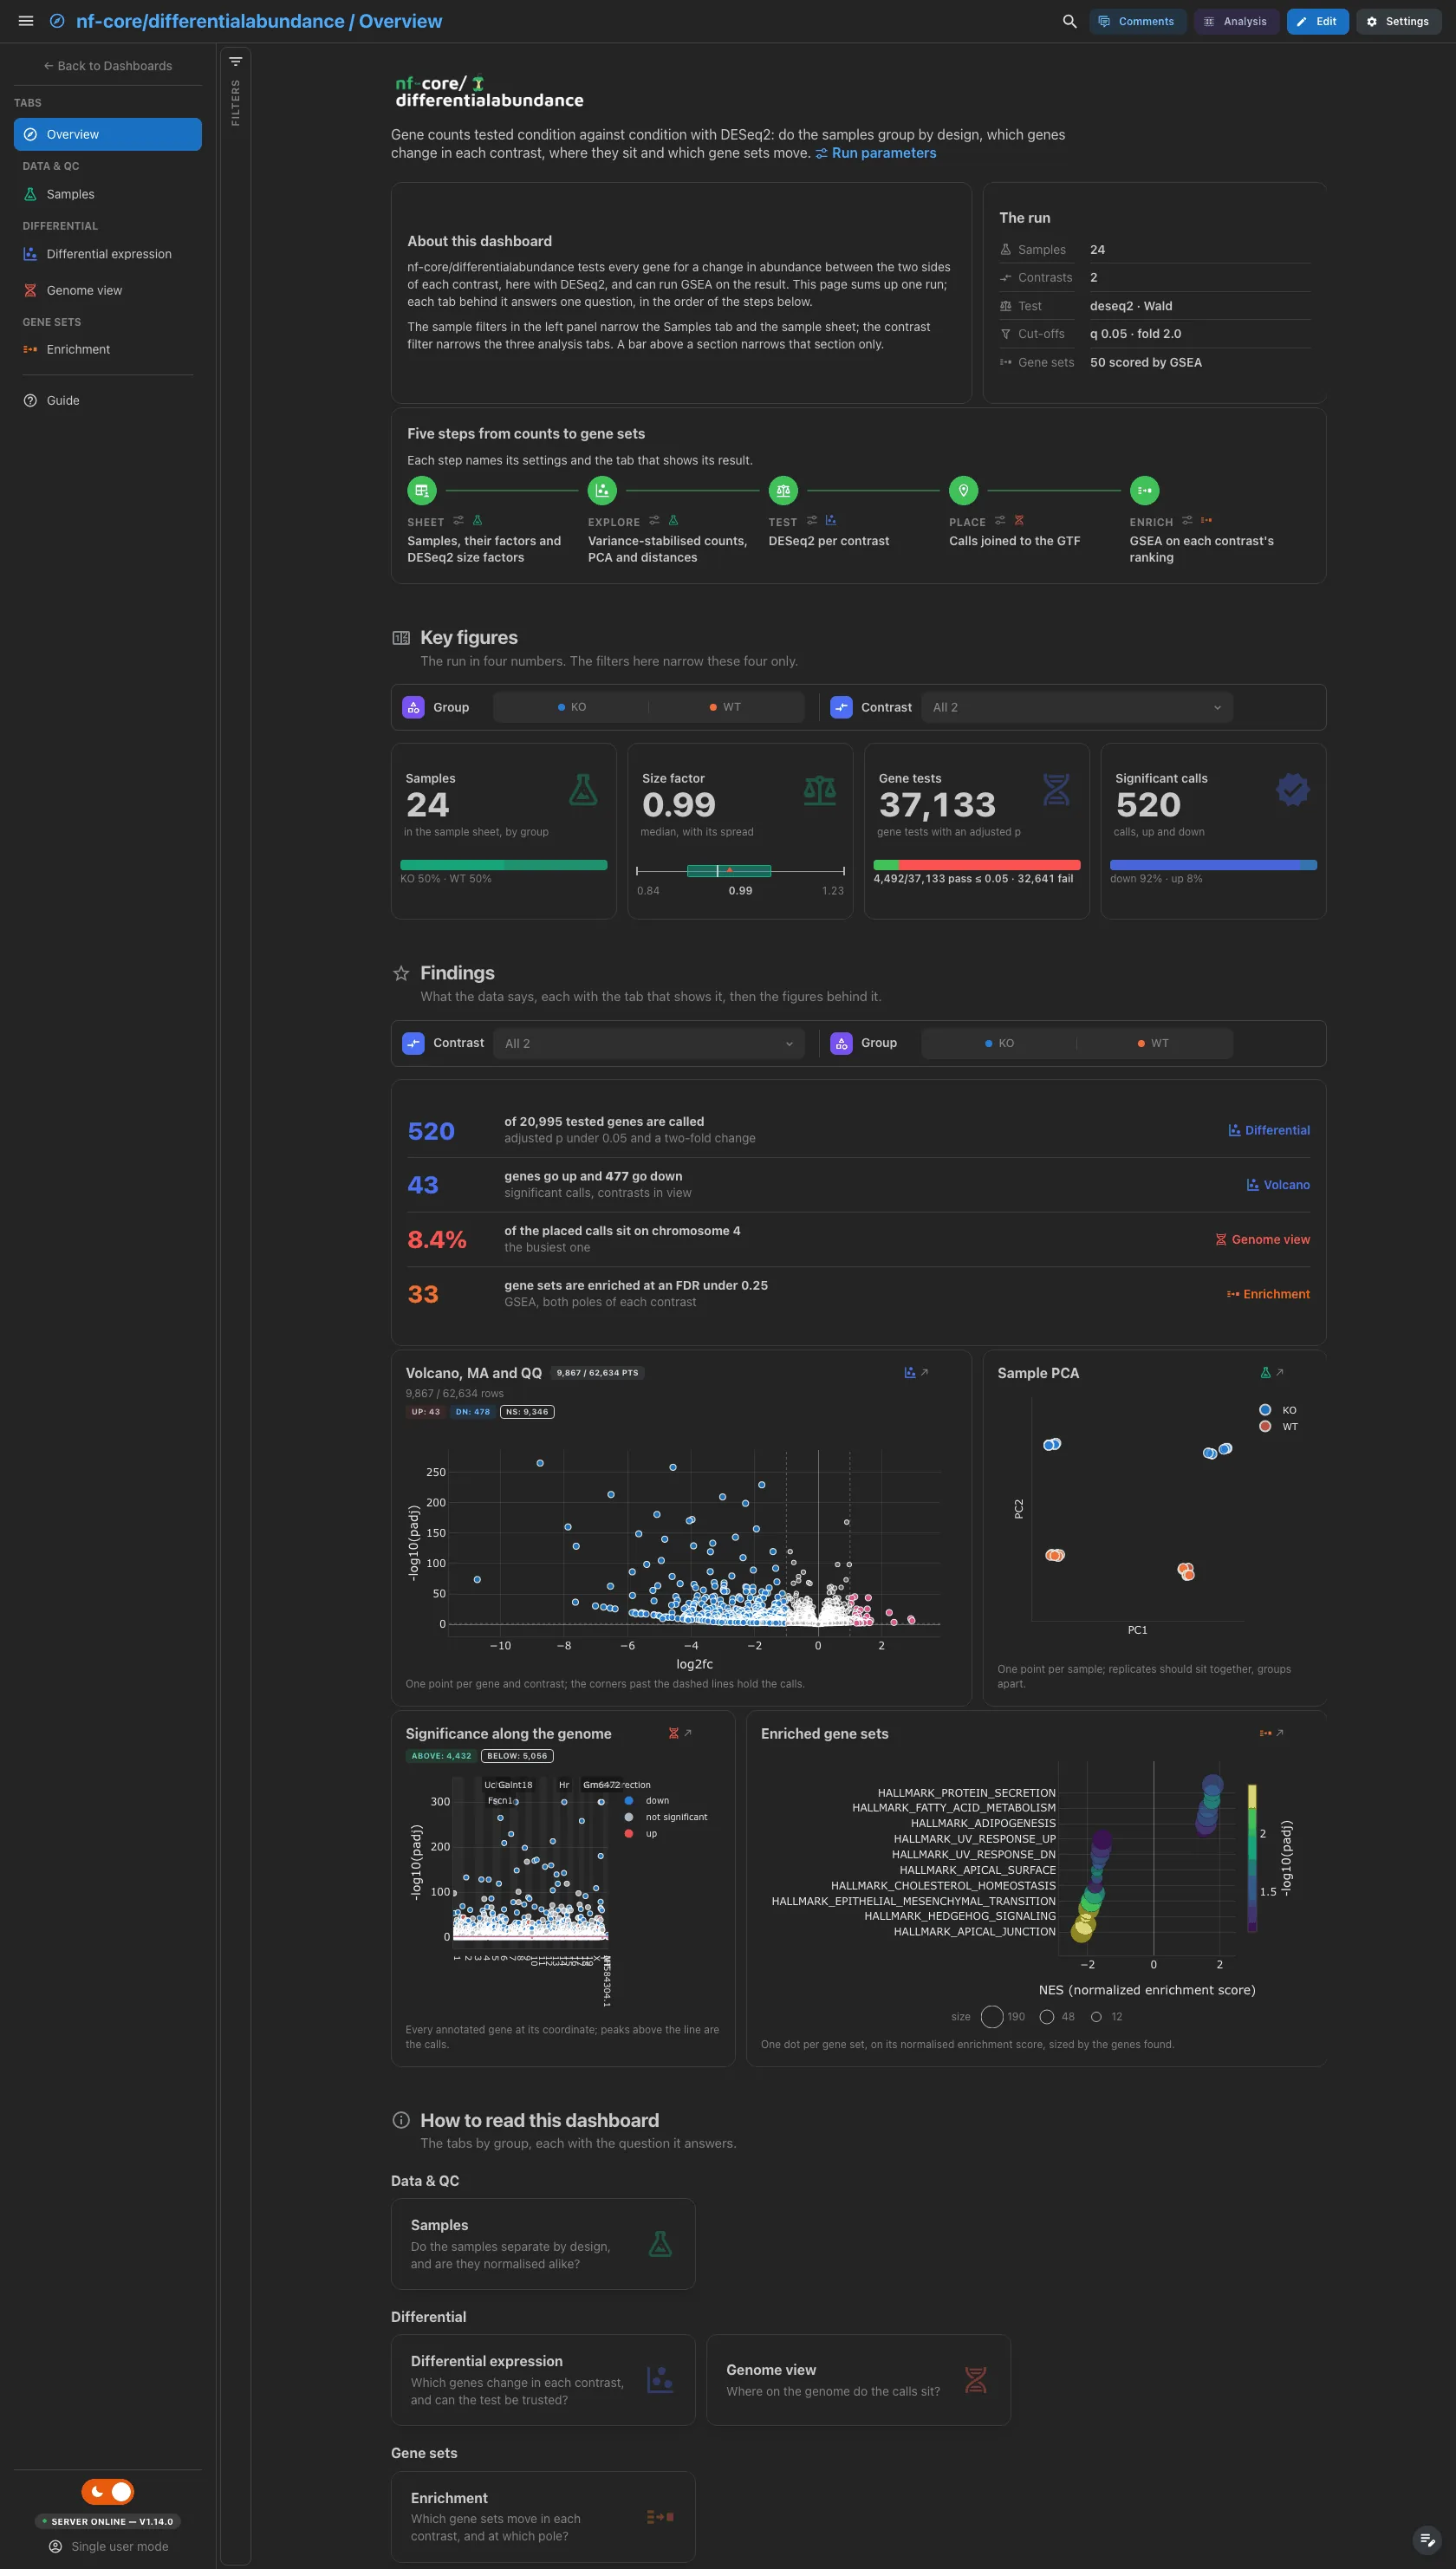
A short hero links the run parameters. About this dashboard says how to move through the tabs, The run lists the samples, the contrasts, the test, the cut-offs and the gene sets GSEA scored, and Pipeline walks the five steps from the sample sheet to enrichment, each linked to its parameters and its tab. The findings are live values: they follow the filters, and a run without a GTF or GSEA drops the rows it cannot fill.
Filters and components
Filters · the left panel starts collapsed. Key figures and Findings each have a filter bar (the group and the contrast) that narrows that section only.
| Section | What it holds |
|---|---|
| Top | Hero, About this dashboard, The run, Pipeline |
| Key figures | 4 headline cards: samples, size factor, gene tests, significant calls |
| Findings | Live result rows, then 4 figures: the volcano, the sample PCA, the Manhattan plot and the GSEA dot plot |
| How to read this dashboard | The tabs by group, each with its question |
Data & QC · Do the samples separate by design, and are they normalised alike?
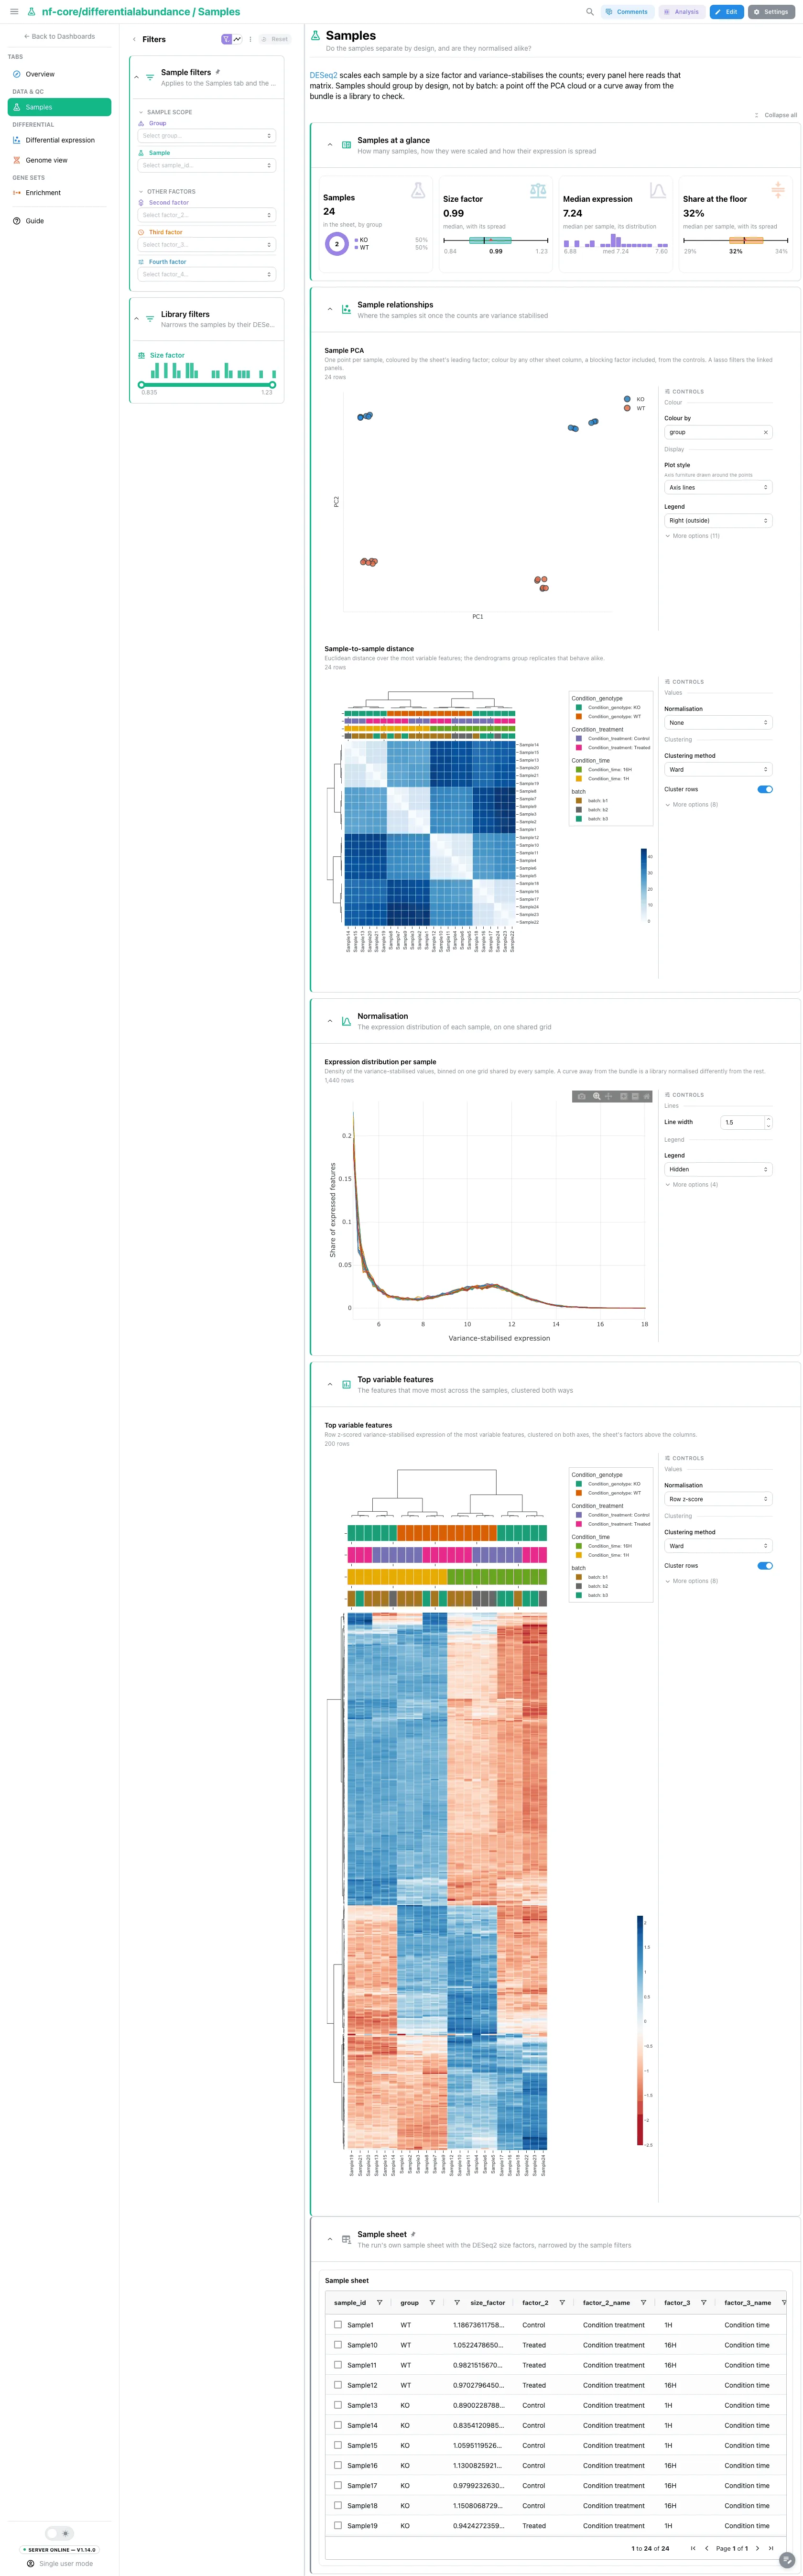
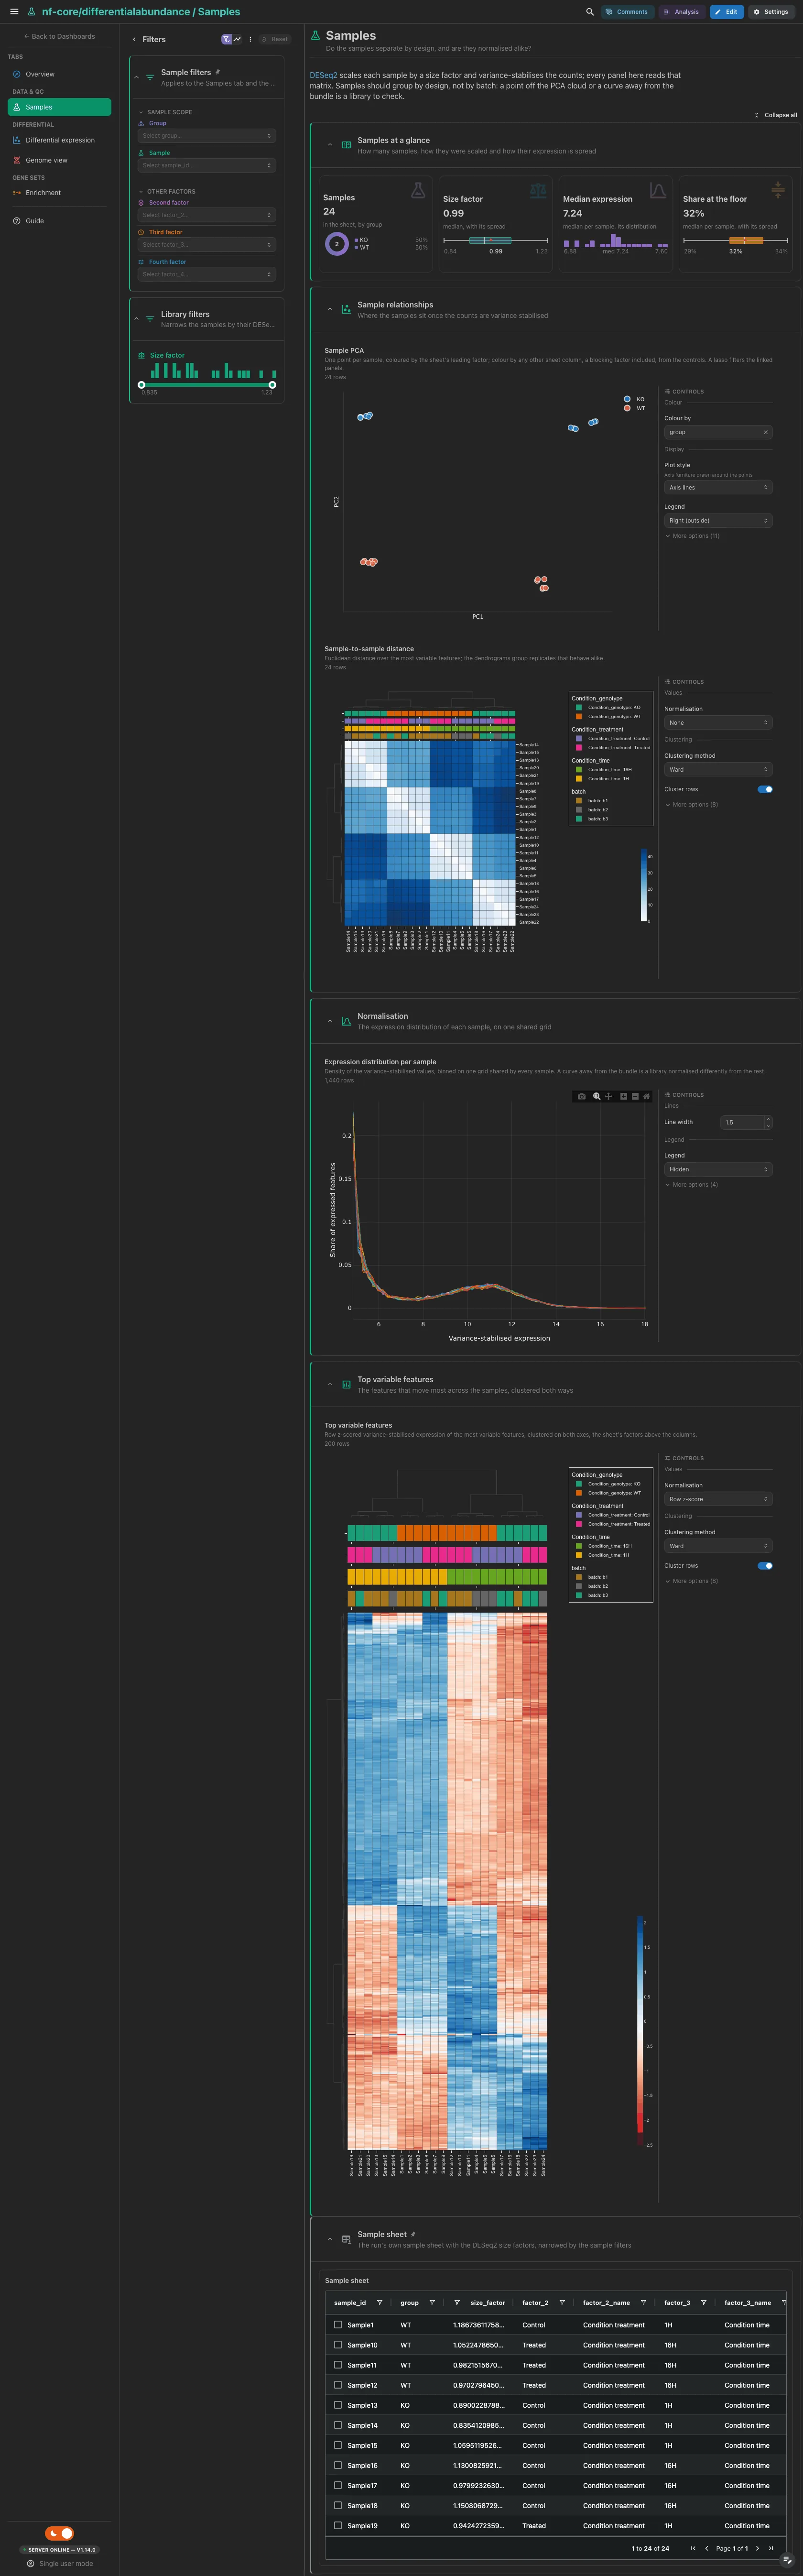
The samples by group, the DESeq2 size factor, the median variance-stabilised expression per sample and the share of features at the matrix floor. Then the PCA above the sample-to-sample distance heatmap; a lasso on the PCA carries those samples to the other panels. Then the expression distribution of every sample on one grid, where a curve out of the bundle is a library normalised differently, and the most variable features, clustered both ways.
Filters and components
Filters · a Size factor range on samples, plus the sample filters.
| Section | What it holds |
|---|---|
| Samples at a glance | 4 cards |
| Sample relationships | 2 advanced visualizations |
| Normalisation | 1 advanced visualization |
| Top variable features | 1 advanced visualization |
Differential · Which genes change in each contrast, and can the test be trusted?
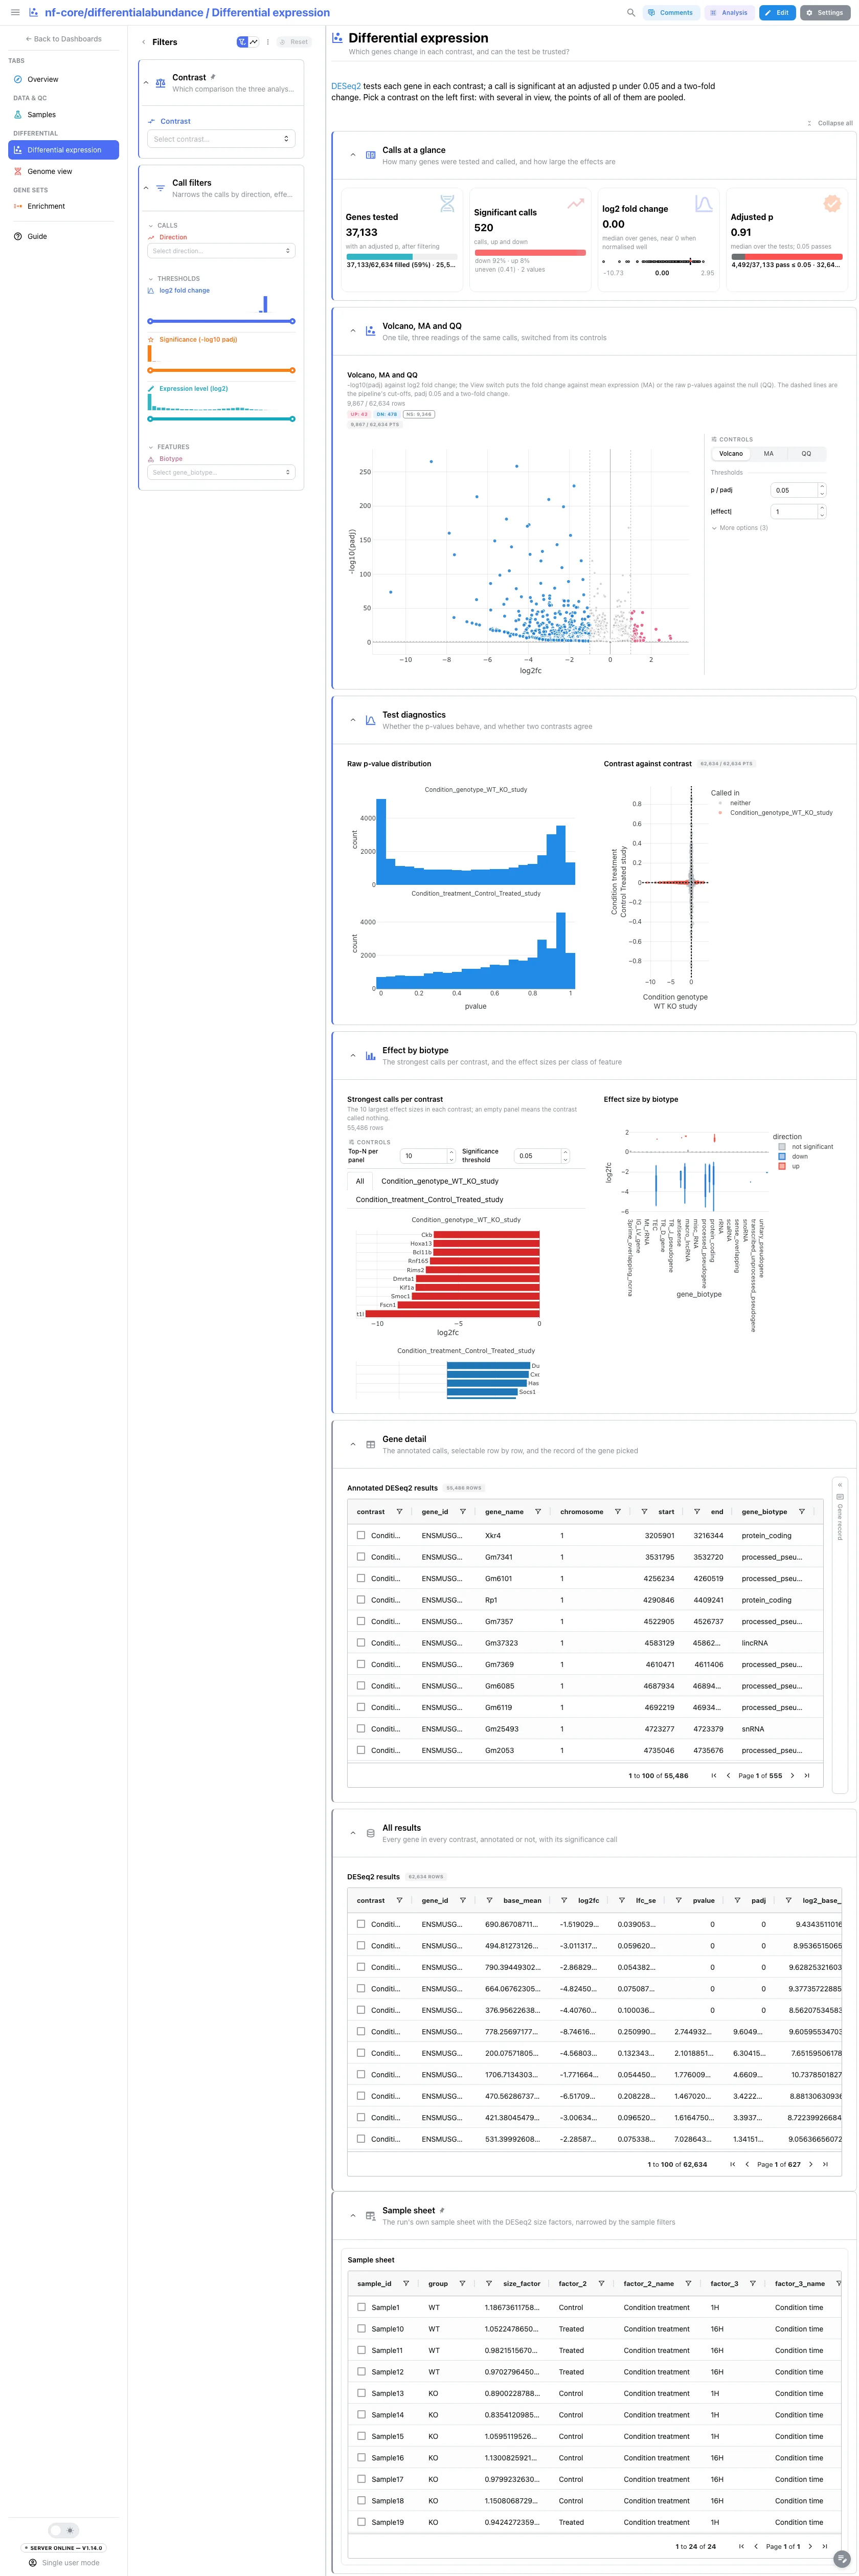
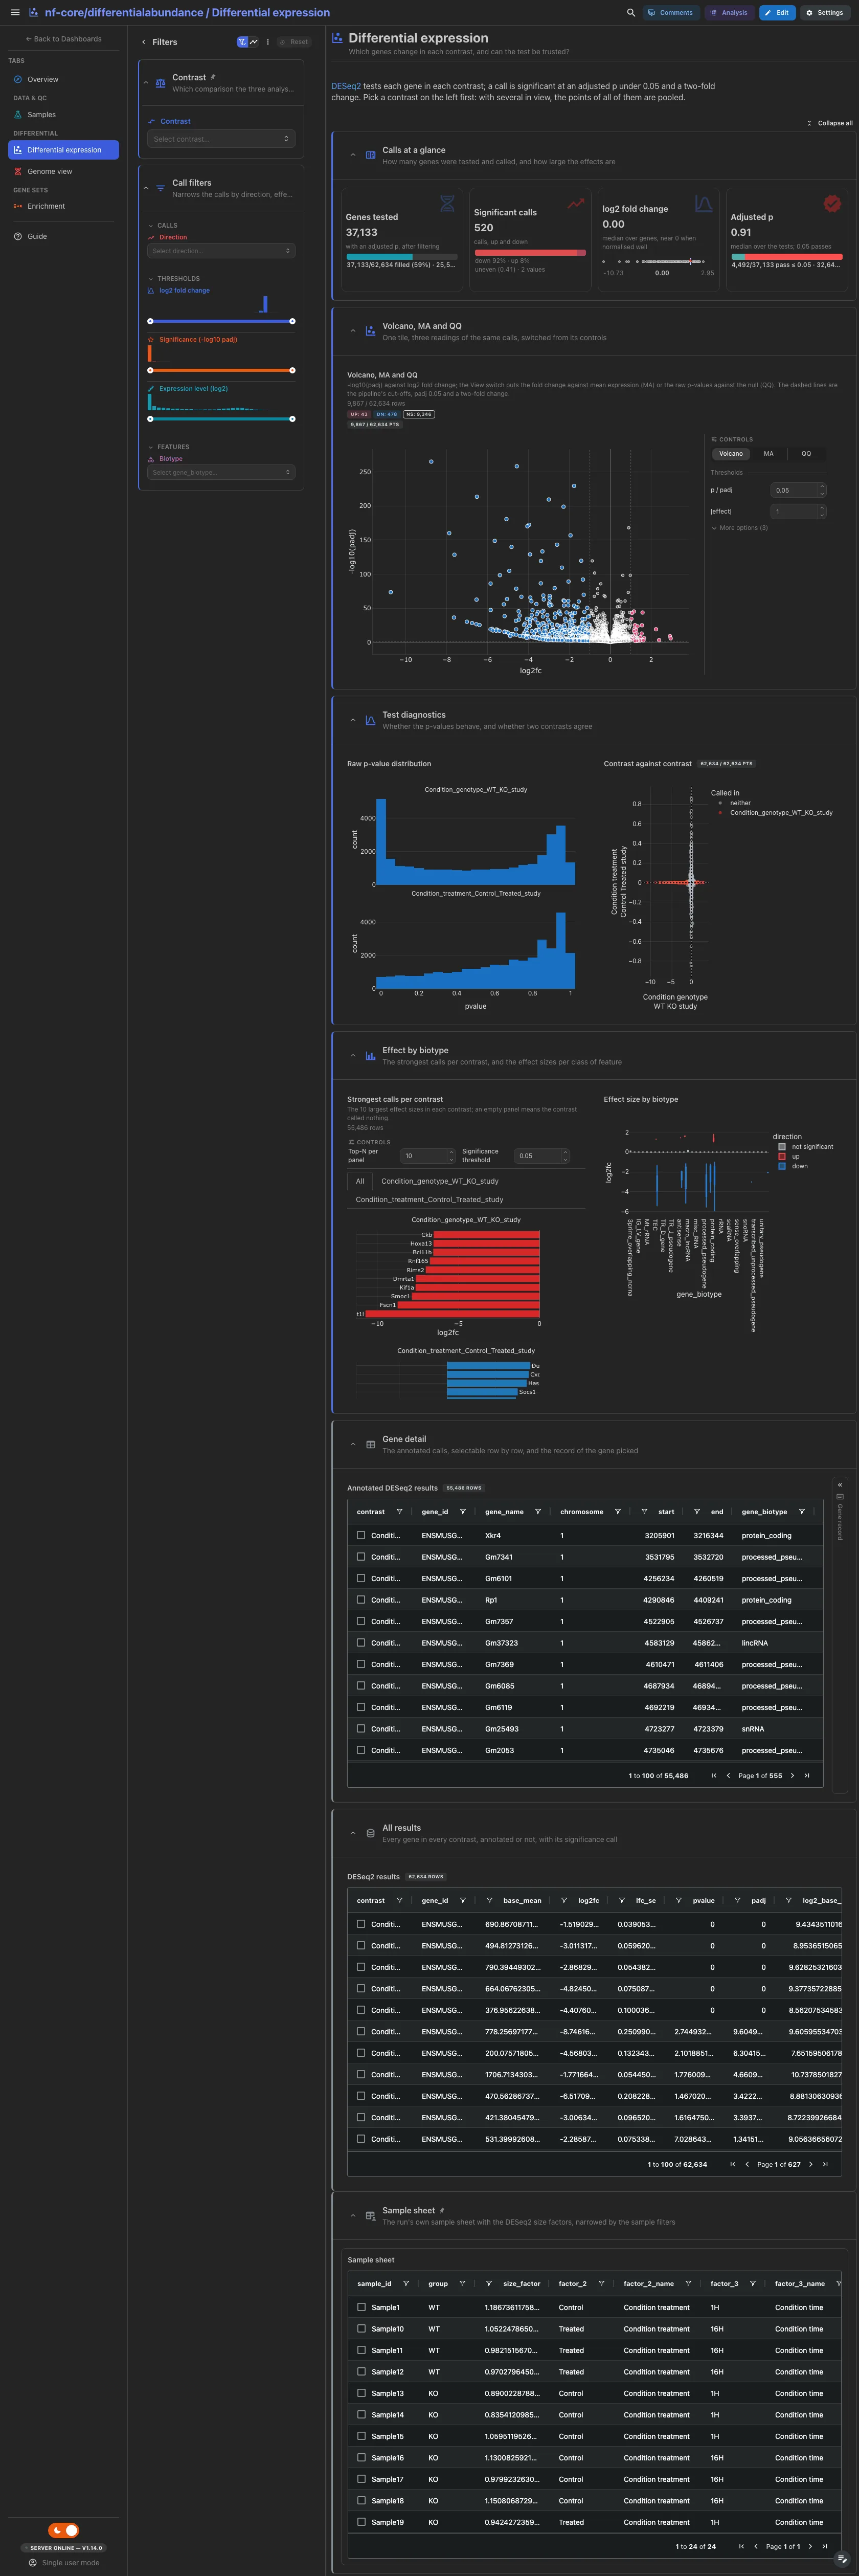
Pick a contrast first. The gene tests that kept an adjusted p-value, the significant calls by direction, the median log2 fold change and the median adjusted p-value. Then the volcano, cut at the pipeline's thresholds, whose View switch reads the same calls as an MA or a QQ plot. The test diagnostics (raw p-values, one contrast against another) and the strongest calls and effect sizes per biotype follow; the annotated table, with a gene record for the row you pick, and the full DESeq2 table are collapsed.
Filters and components
Filters · Direction, and log2 fold change, significance and
expression-level ranges on deseq2_results; Biotype on
deseq2_results_annotated; plus the persistent Contrast.
| Section | What it holds |
|---|---|
| Calls at a glance | 4 cards |
| Volcano, MA and QQ | 1 advanced visualization |
| Test diagnostics | Raw p-value distribution, Contrast against contrast |
| Effect by biotype | 1 advanced visualization + Effect size by biotype |
| Gene detail (collapsed) | Annotated DESeq2 results + a gene record card |
| All results (collapsed) | DESeq2 results |
Differential · Where on the genome do the calls sit?
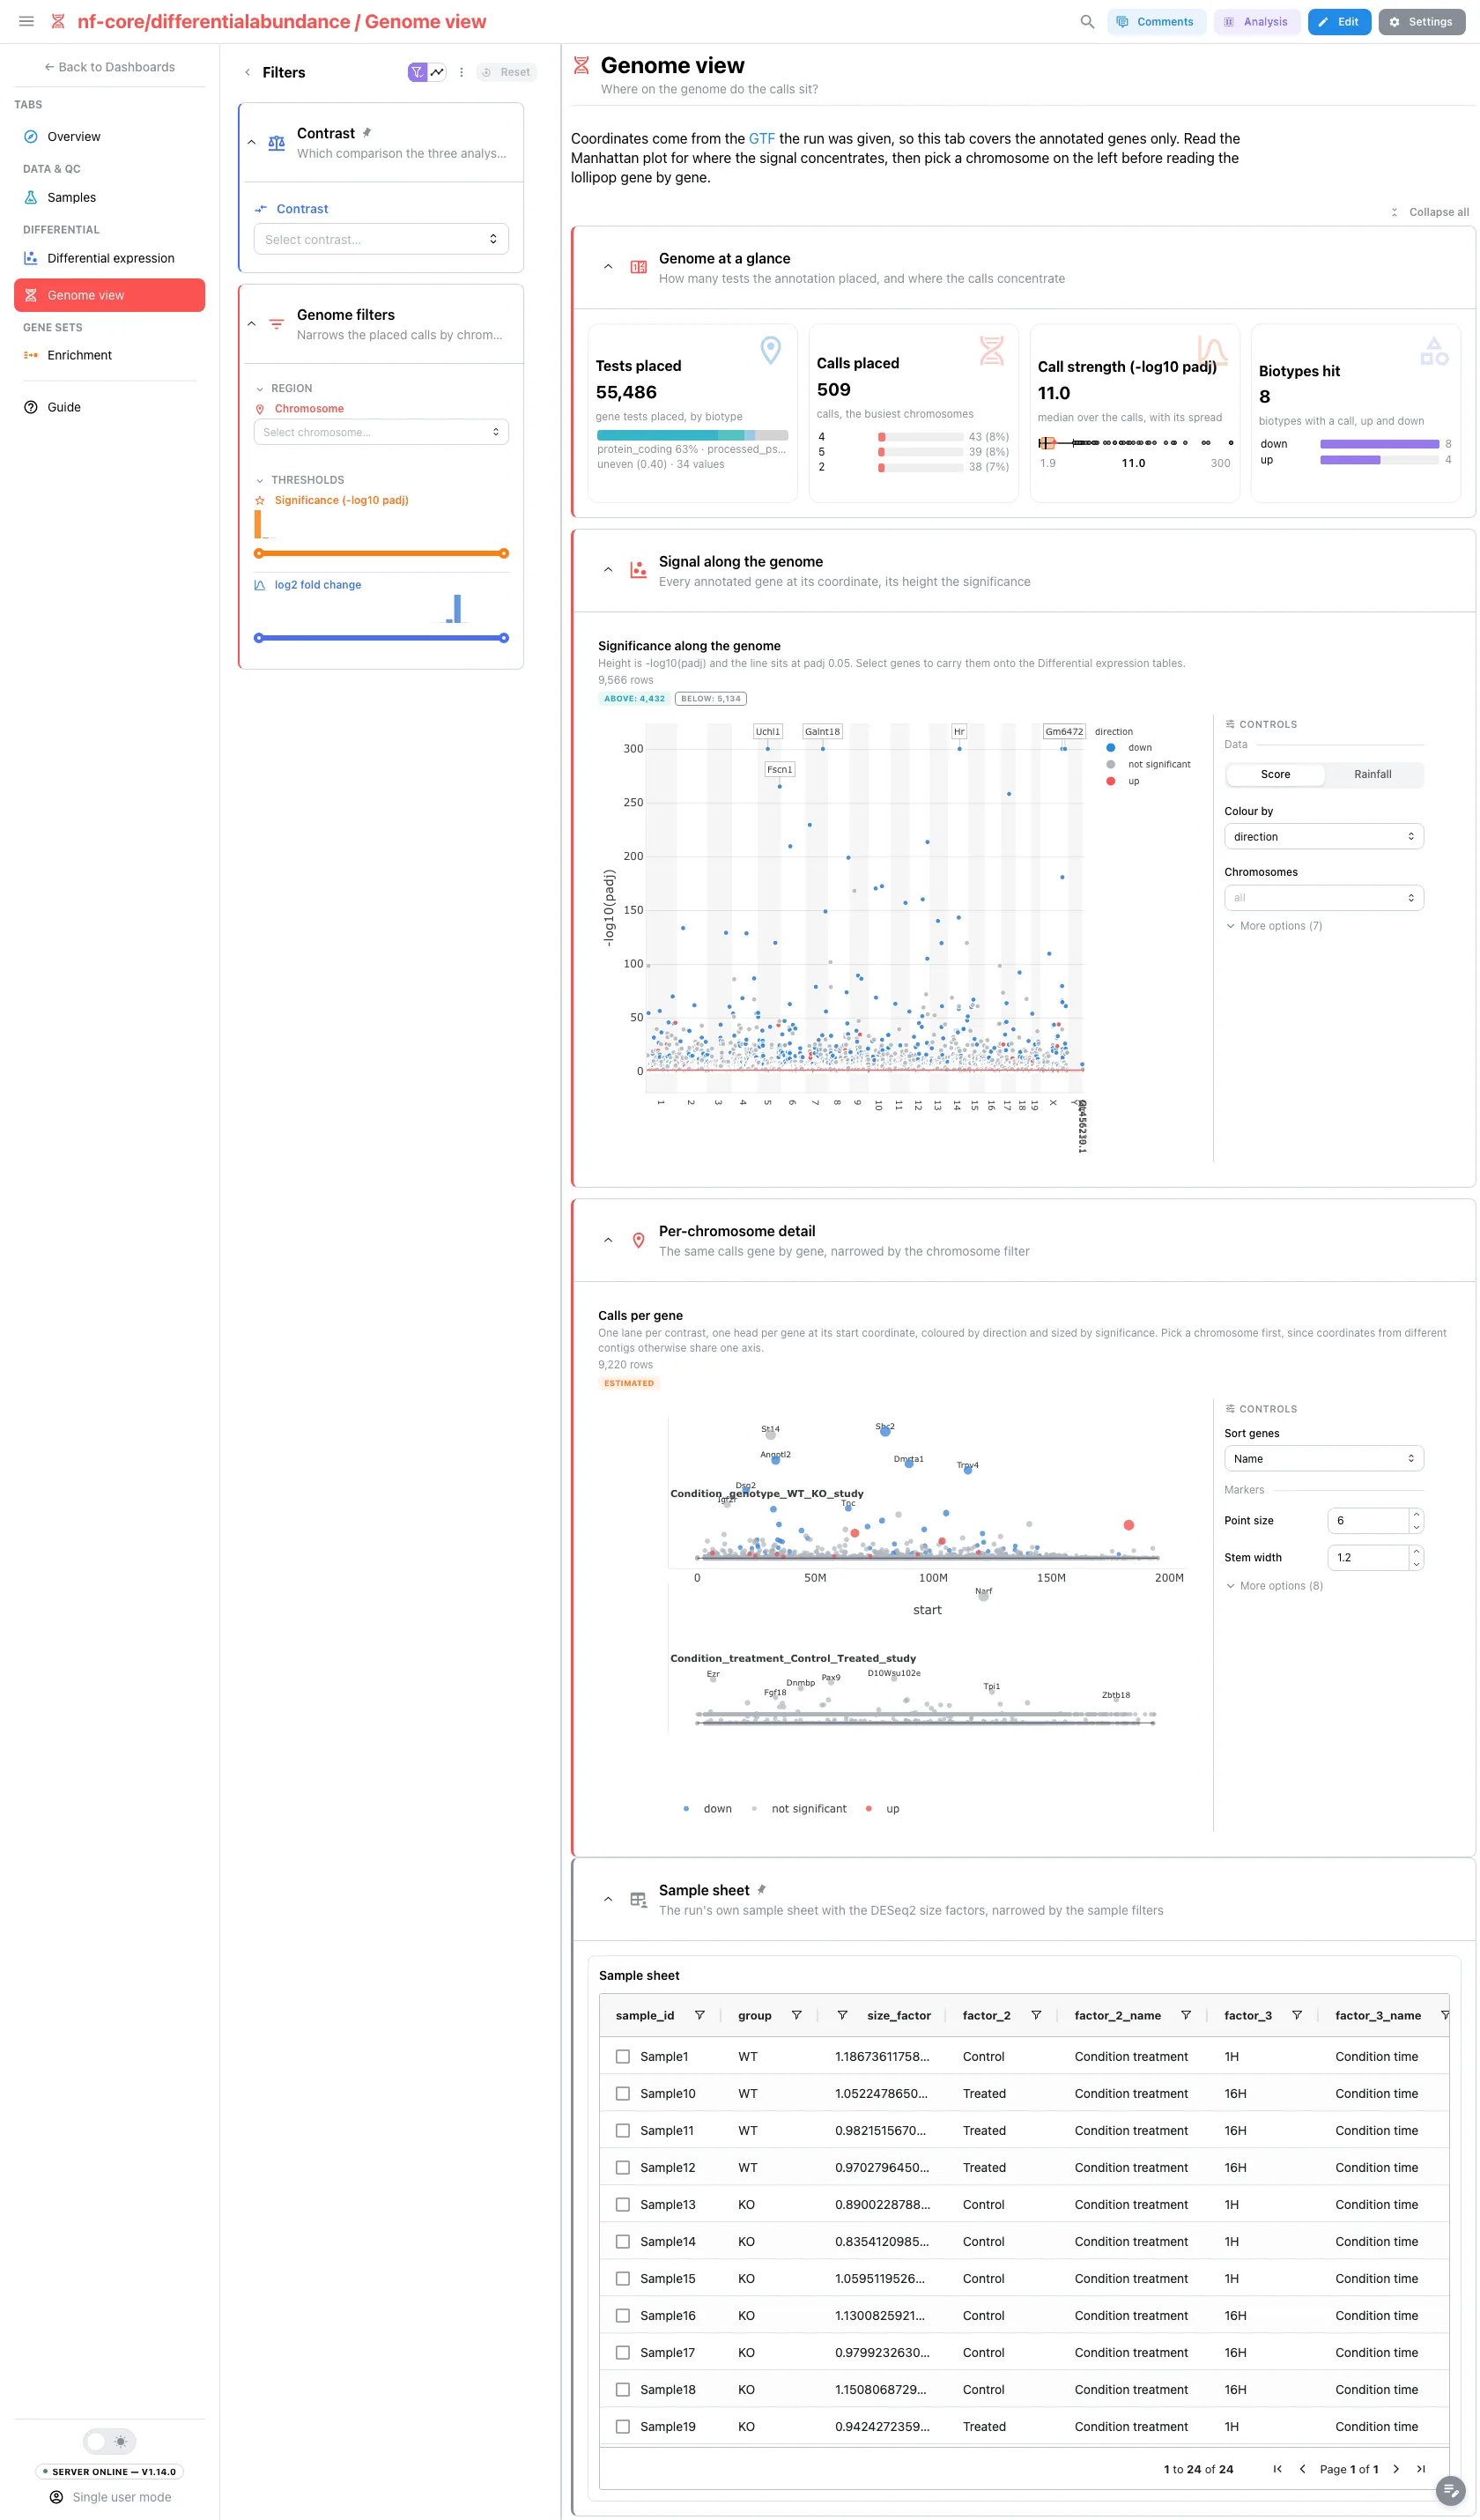
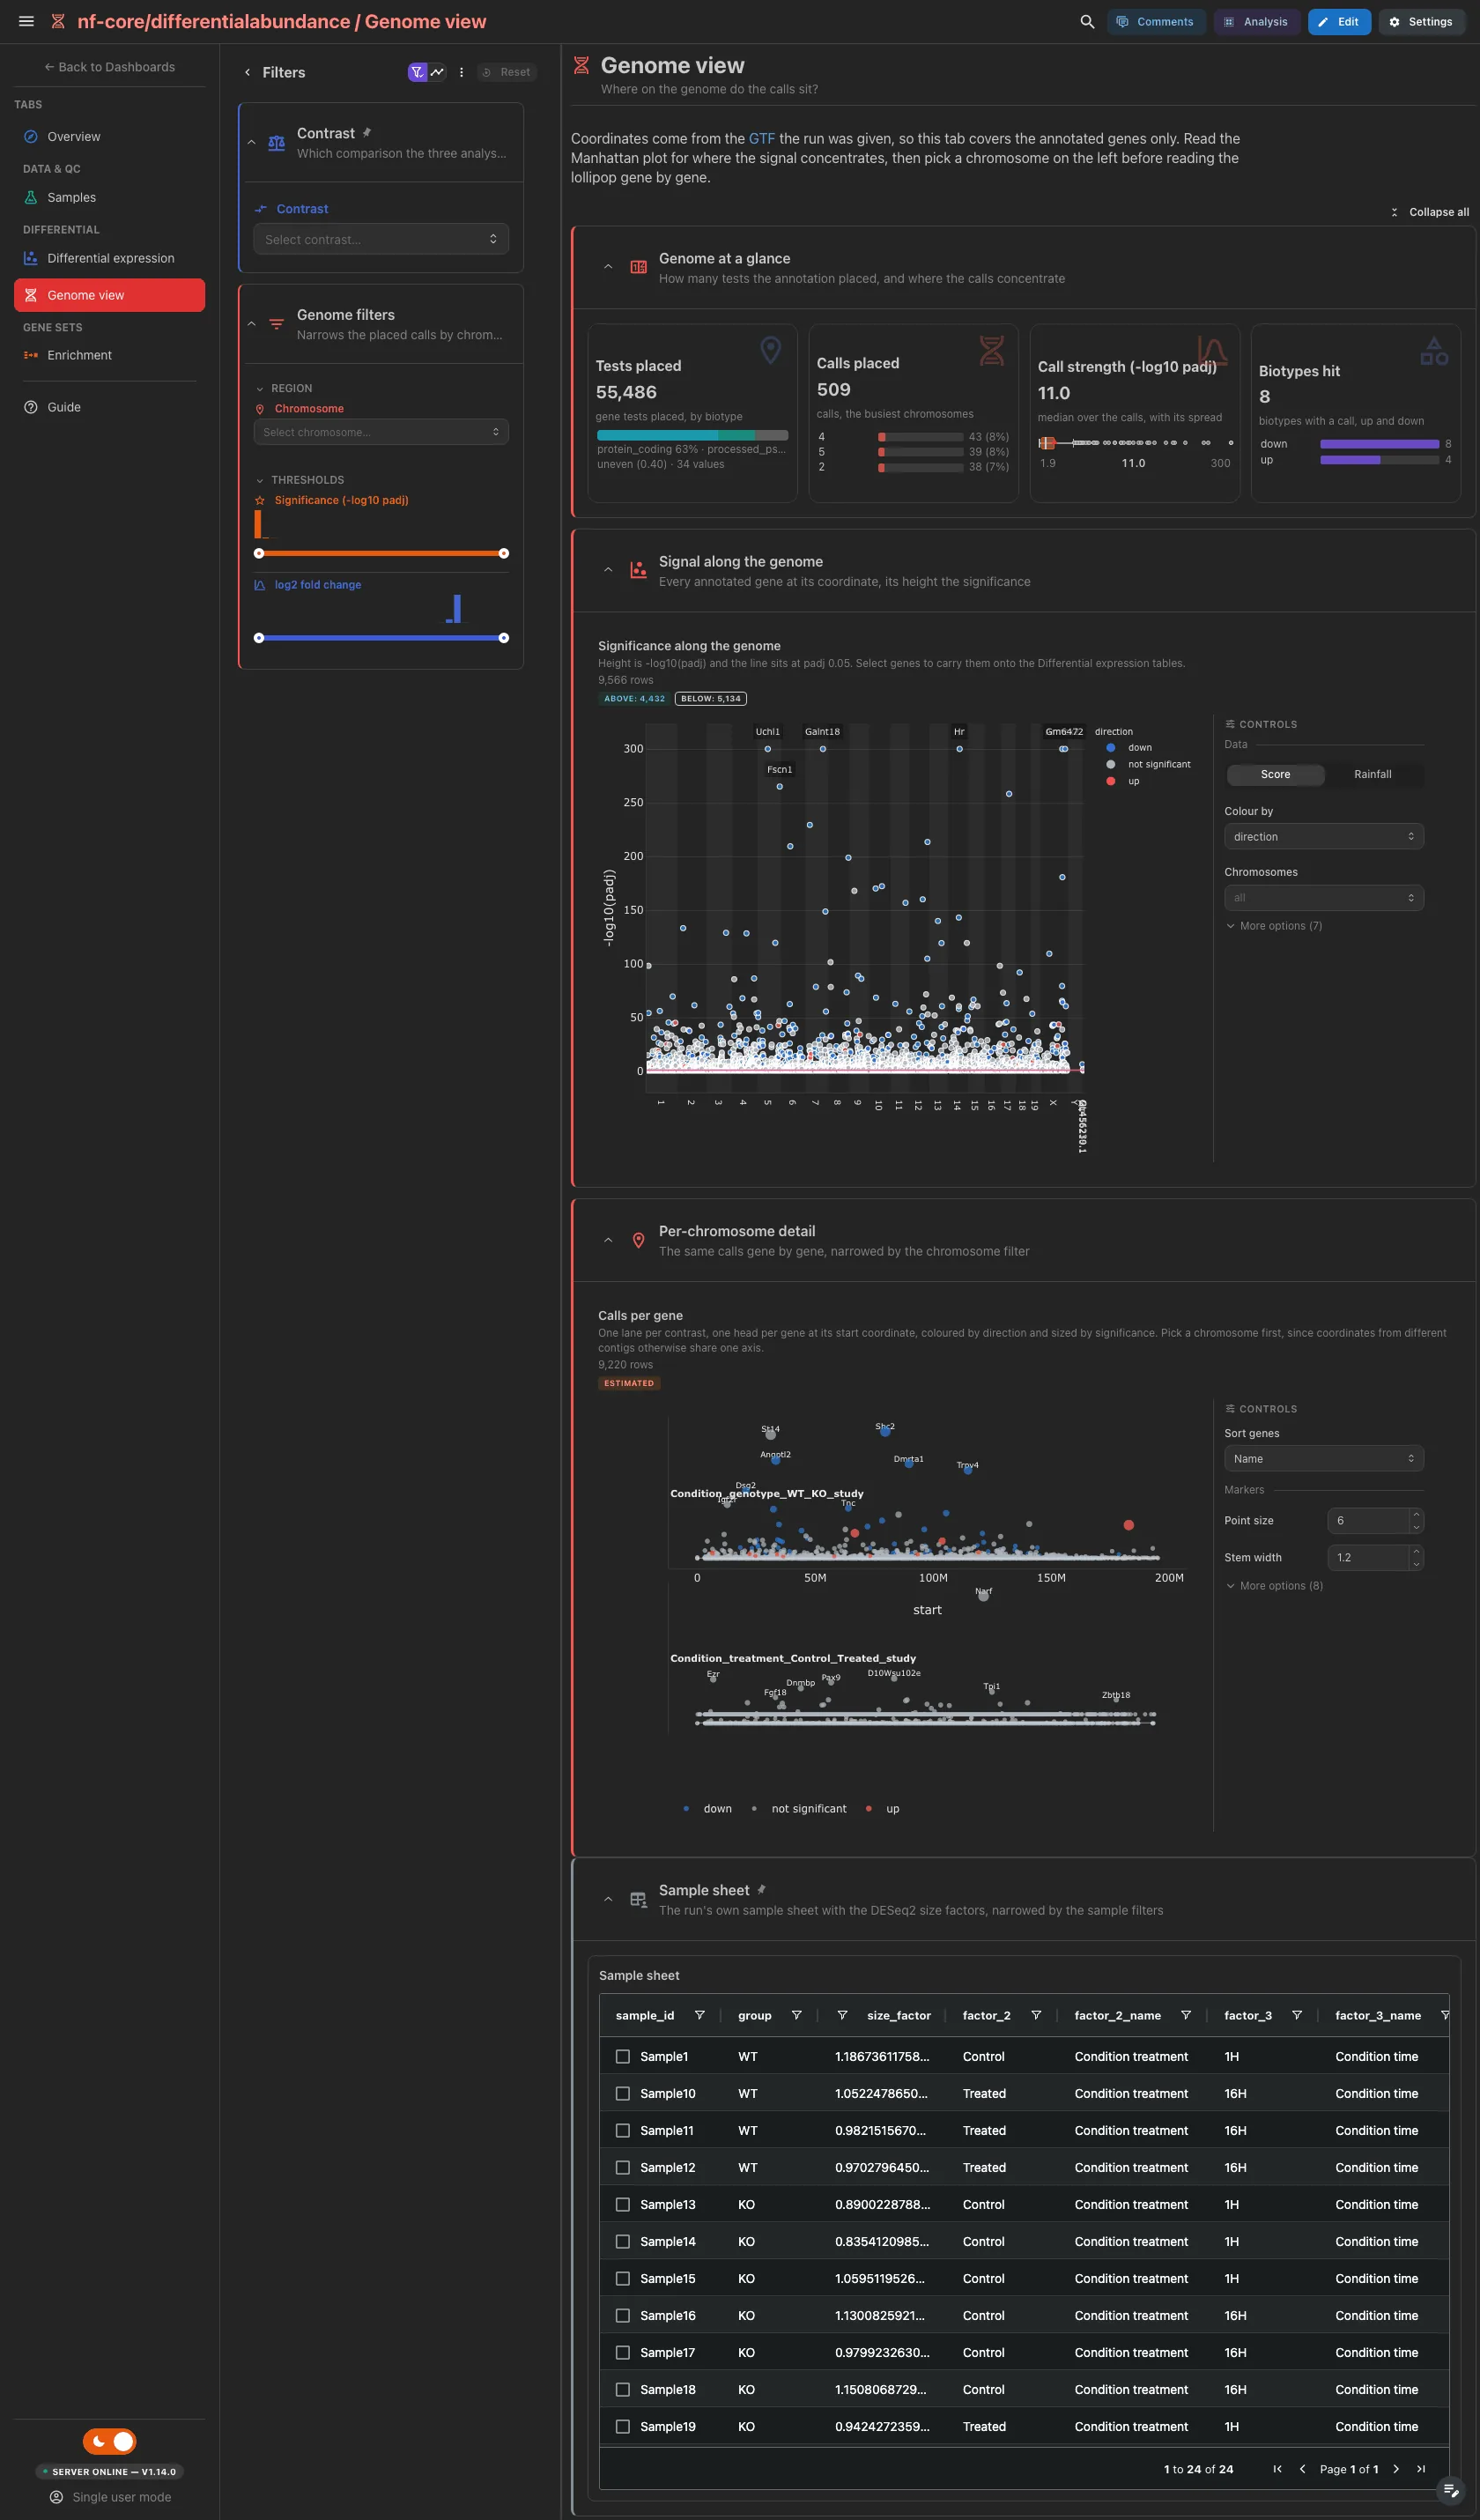
Needs the run's GTF. The gene tests the annotation places, the placed calls by chromosome, the call strength and the biotypes the up and down calls reach. Then the Manhattan plot, with a threshold line at padj 0.05, and the lollipop panel, one lane per contrast and one head per gene. Pick a chromosome on the left before reading the lollipop.
Filters and components
Filters · Chromosome, and significance and log2 fold-change ranges,
on deseq2_results_annotated, plus the persistent Contrast.
| Section | What it holds |
|---|---|
| Genome at a glance | 4 cards |
| Signal along the genome | 1 advanced visualization |
| Per-chromosome detail | 1 advanced visualization |
Gene sets · Which gene sets move in each contrast, and at which pole?
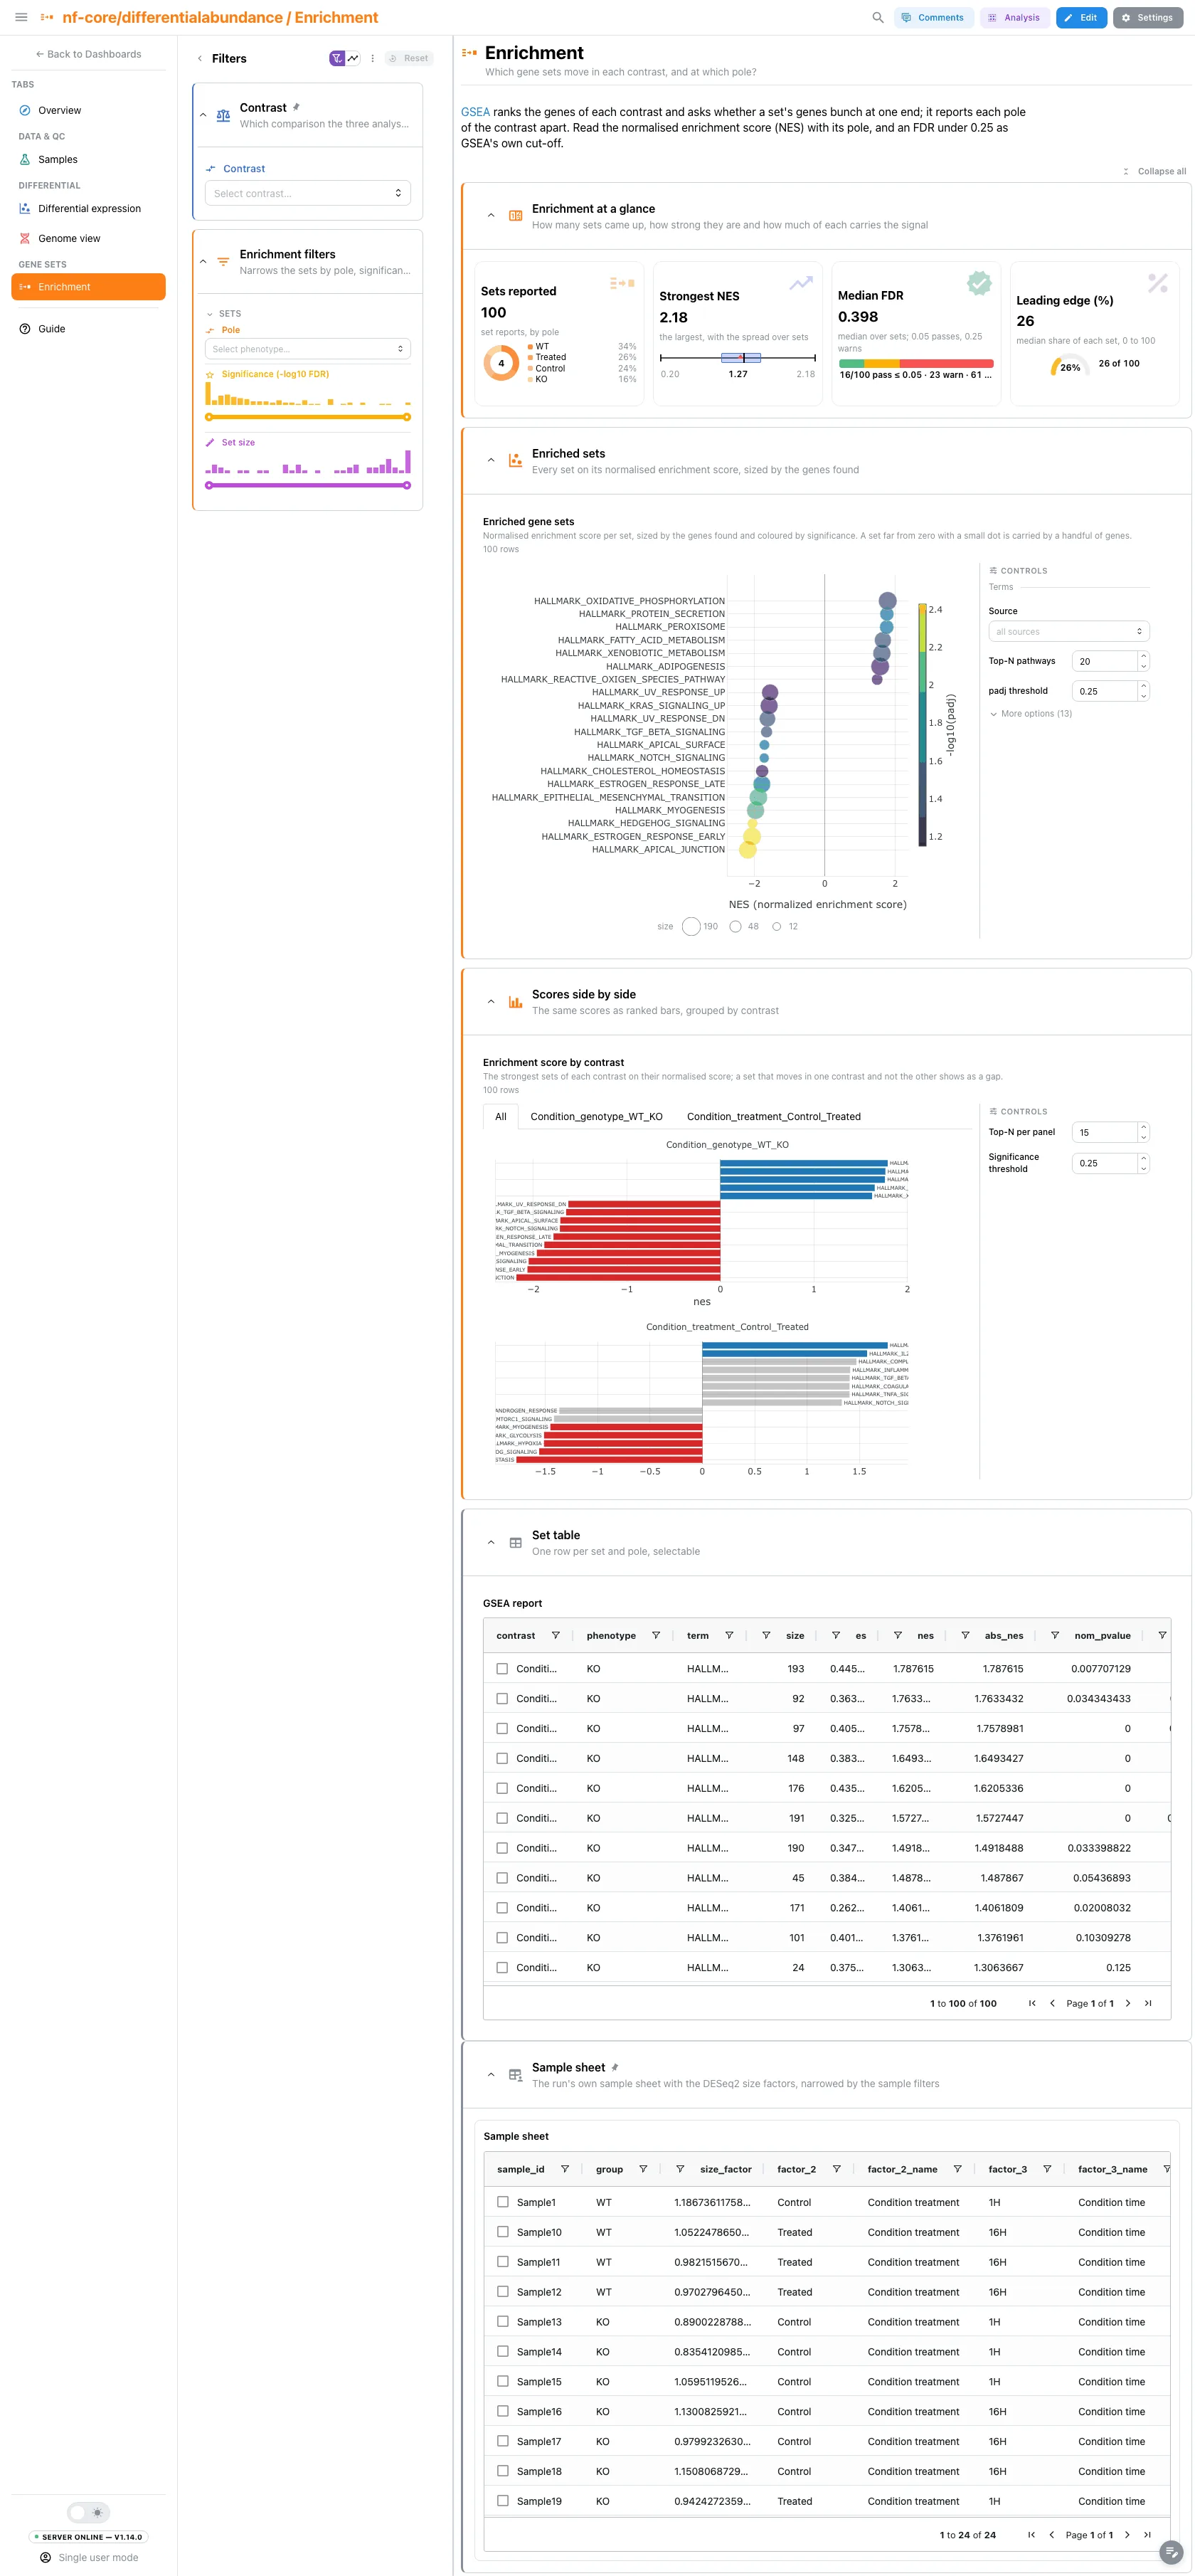
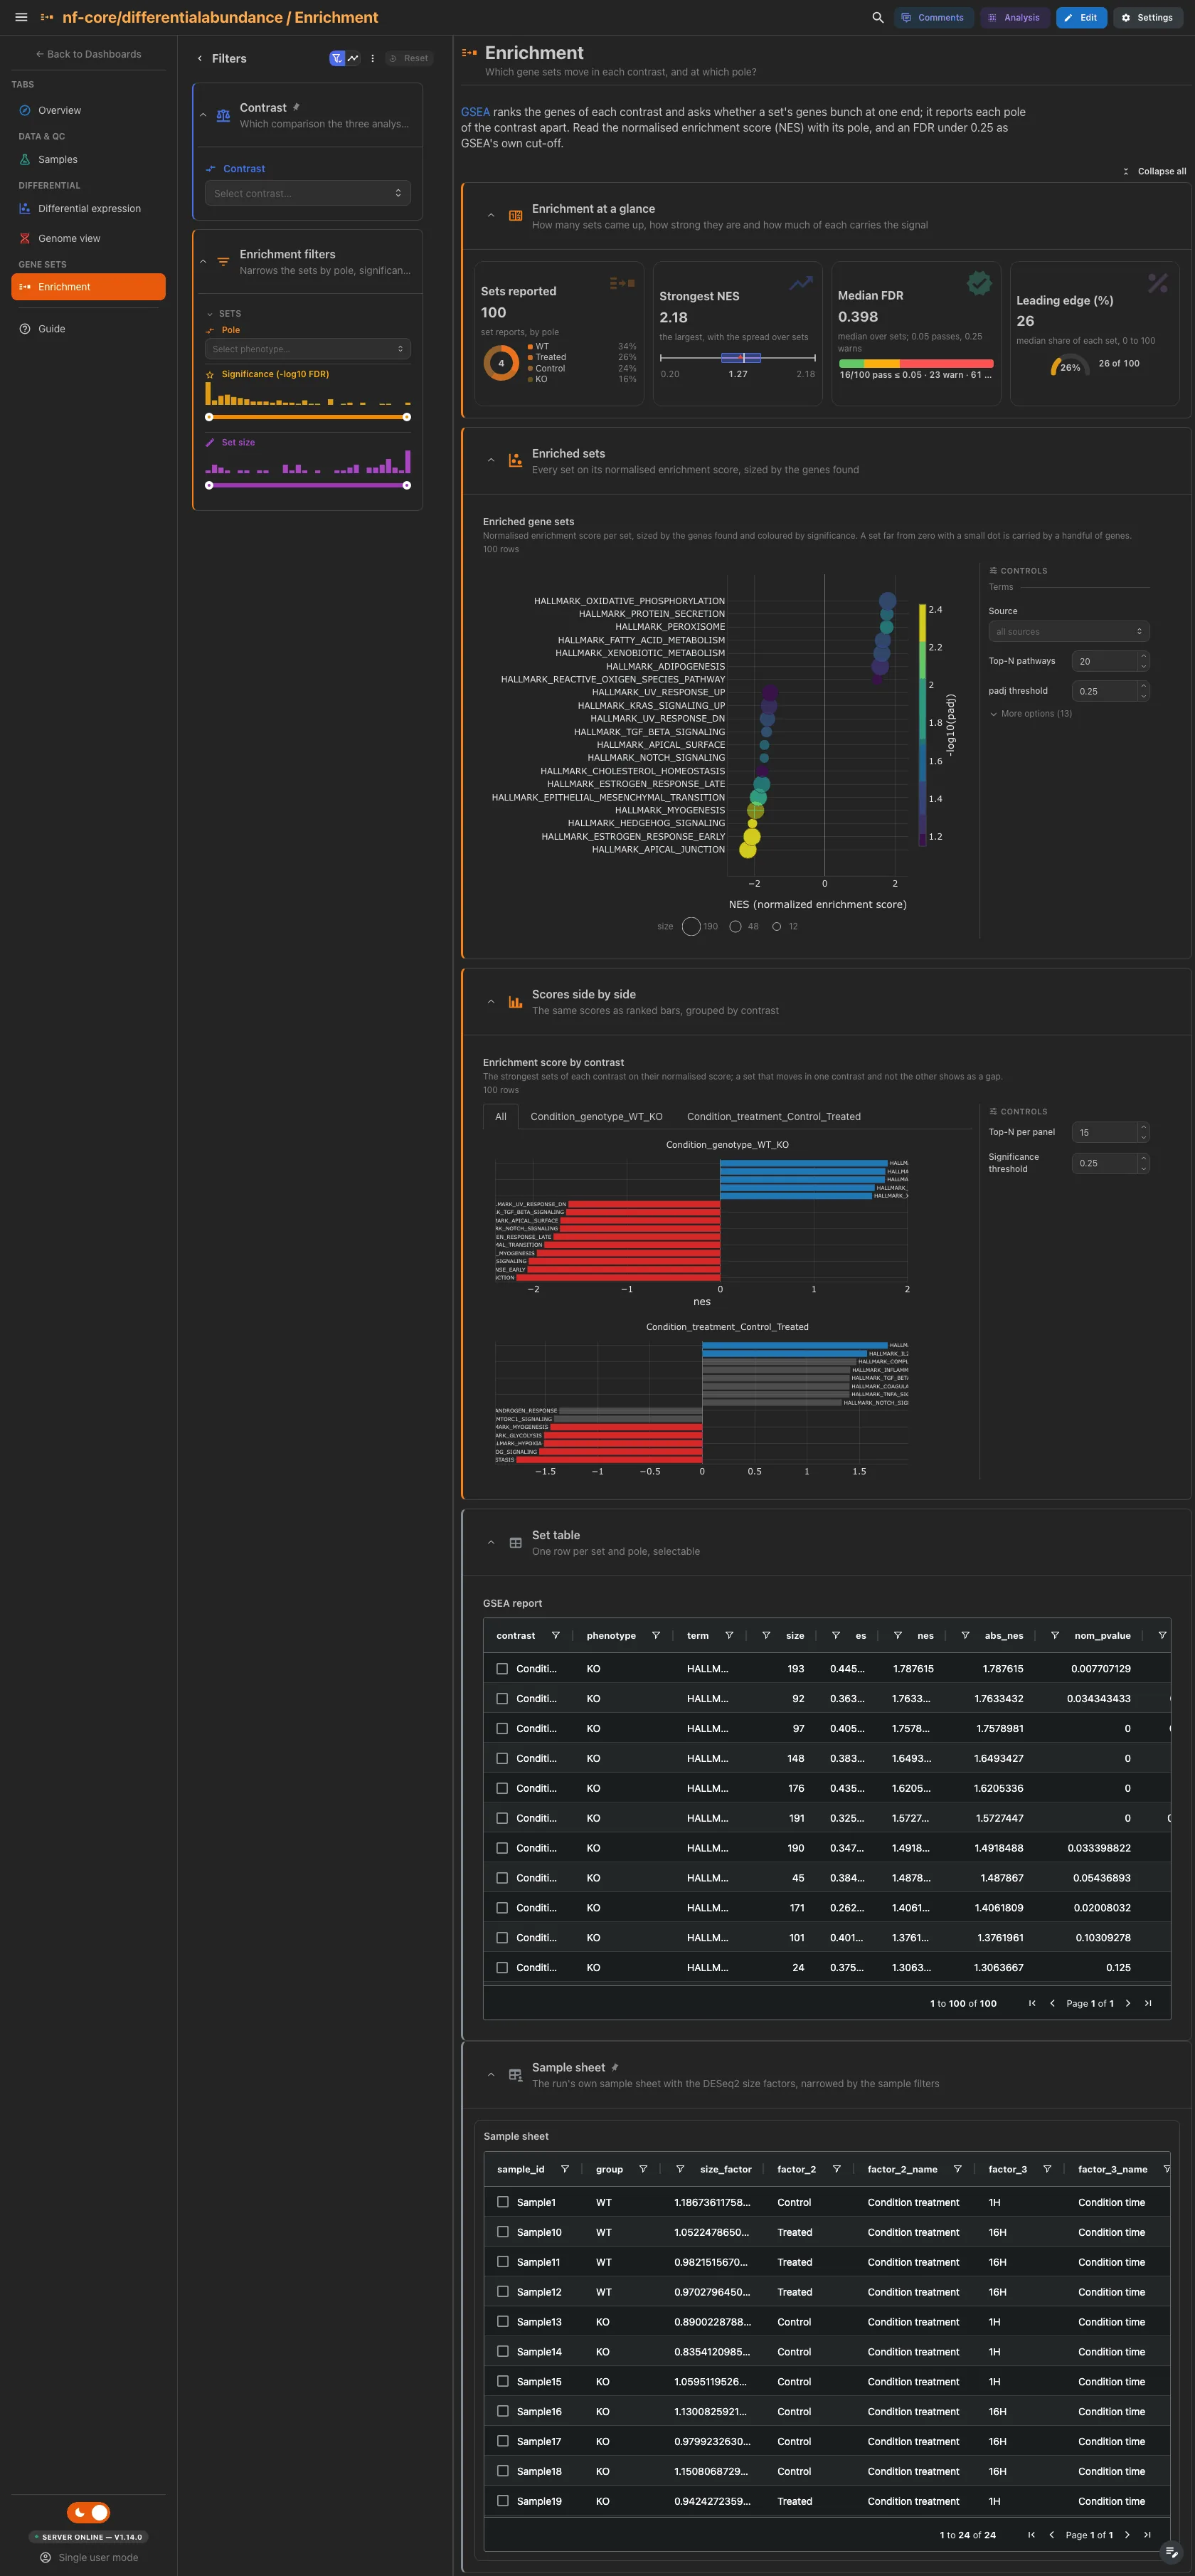
Needs a GSEA run. The set reports by pole, the strongest absolute normalised enrichment score, the median FDR and the median leading-edge share of each set. Then the dot plot of every set on its normalised enrichment score, sized by the genes found, and the same scores as bars grouped by contrast, which shows whether a set moved in one comparison or in both.
Filters and components
Filters · Pole, and significance and set-size ranges, on
gsea_report, plus the persistent Contrast.
| Section | What it holds |
|---|---|
| Enrichment at a glance | 4 cards |
| Enriched sets | 1 advanced visualization |
| Scores side by side | 1 advanced visualization |
| Set table (collapsed) | GSEA report |
A contrast that found nothing still has to read as such
A contrast with no significant calls keeps its place. Its volcano is a symmetric cloud with no labelled points and its effect-size panel is empty, which is what an honest null result looks like rather than a broken dashboard.
Tables and point views select on their entity column: the sample sheet and the
PCA on sample_id, which narrows the distance matrix, the heatmap and the
distribution panel; the results tables, the contrast-against-contrast scatter and
the Manhattan panel on gene_id; the GSEA table on term. A pick narrows the
other tiles of its collection and follows the project links to the collections
they reach. The distribution panel does not select: its collection has no
outgoing link.
Running the pipeline
Depictio reads the output of nf-core/differentialabundance, it does not run the pipeline. Run the pipeline first:
nextflow run nf-core/differentialabundance -r 2.0.0 \
  --input samplesheet.csv \
  --contrasts contrasts.csv \
  --matrix counts.tsv \
  --gtf genome.gtf \
  --functional_method gsea --gene_sets_files gene_sets.gmt \
  --outdir results -profile docker
Leave out the two GSEA flags to skip enrichment, and pass --var NO_GSEA=true to
Depictio for that run.
Then point Depictio at the results:
See nf-co.re/differentialabundance/usage for full pipeline documentation.
Required data structure
Point depictio ingest at the directory holding the pipeline output. Depictio scans
recursively and matches on file name, so a run that nests its tables one level
deeper (as the reference megatest does, having been launched with two parameter
sets at once) binds identically.
<DATA_ROOT>/
├── input/                                     # --var SAMPLESHEET_FILE (auto-detected)
│   └── samplesheet.tsv
├── pipeline_info/
│   ├── params.json
│   └── software_versions.yml
├── tables/
│   ├── differential/
│   │   ├── <contrast>.deseq2.results.tsv       # per-contrast statistics
│   │   └── <contrast>_deseq2.annotated.tsv     # the same, joined to the GTF
│   ├── processed_abundance/
│   │   └── all.vst.tsv                         # variance-stabilised matrix
│   └── gsea/<contrast>/
│       └── *.gsea_report_for_<pole>.tsv        # optional, one per pole
└── other/
    └── deseq2/
        └── <contrast>.deseq2.sizefactors.tsv   # library-size normalisation
Validation runs
The repository ships
download_test_data.sh,
which fetches the subset of nf-core's AWS megatest run that the template needs:
bash depictio/projects/nf-core/differentialabundance/2.0.0/download_test_data.sh \
  /tmp/differentialabundance_test
The run is
s3://nf-core-awsmegatests/differentialabundance/results-30ed7741fc392127156c2fb10cfa3d69d216b54b/:
24 mouse RNA-seq samples over two contrasts. The observation sheet and the
contrasts file live outside the results prefix; post_fetch_help in
megatest.yaml next to the script gives the two curl commands that put them
under input/. The pinned prefix publishes no tables/gsea/, so the GSEA
reports behind the Enrichment tab screenshot come from a sibling prefix of the
same pipeline; the fetch command is in the megatest.yaml header.
Then run Depictio against it:
Additional resources
- nf-co.re/differentialabundance: official pipeline documentation
- nf-co.re/differentialabundance/2.0.0/results: AWS test results
- Template System Reference: YAML format, variables, conditionals
- Recipes: how to read, test, and write recipes
Authorship
 weber8thomas
Reviewing a template on your own data, or taking over a role here, is a contribution in itself: the contributing guide says what each one involves.