

The nanoseq template follows a Nanopore RNA-seq run from the basecalled reads to the genes and isoforms that differ between conditions:
- Overview: the run in four key figures, live findings and four figures, each linked to the tab that explains it
- Data & QC: FastQC and samtools panels from the reprocessed MultiQC report, NanoStat's length and quality per library with the Nx and quality ladders, and what minimap2 placed with its identity, depth and indel spectrum
- Expression: what Bambu counted and whether the libraries group by condition or by preparation, the genes DESeq2 calls between the conditions, and the transcripts DEXSeq finds shifting their share of their gene
The persistent Sample filters (condition, library, library preparation,
flow-cell run, source replicate) sit in the left panel, and the template's links
carry a pick to NanoStat, the samtools distributions, the melted Bambu counts and
the MultiQC panels alike. The DESeq2 and DEXSeq results carry no sample column,
so the filters do not narrow them.
nanoseq 3.0.0 writes no MultiQC parquet
The release ships MultiQC 1.11, which writes multiqc_data.json only, and
Depictio reads multiqc.parquet (MultiQC 1.31 and later). Reprocess the
run's own tool outputs once before ingesting; the parquet lands in
multiqc/multiqc_data/, where the template looks for it:
The design is a variable
nanoseq names every sample <group>_R<replicate>, and the template recovers
only those two fields from the name. The condition and the three
confounders the dashboard offers beside it (library preparation, source
replicate, flow-cell run) come from an optional design table passed as
METADATA_FILE. Without it, the condition is the samplesheet group and the
confounders read unknown.
Quick start
The results directory is the only thing you have to pass. The hub of the dashboard
is the samplesheet the run validated, pipeline_info/samplesheet.valid.csv,
one row per library. To bring your own design, add the table and name the
factor the run compares:
depictio ingest /path/to/nanoseq_results \
--template nf-core/nanoseq/latest \
--var METADATA_FILE=/path/to/sample_metadata.tsv \
--var GROUP_COL=condition
| Variable | Default | Role |
|---|---|---|
METADATA_FILE |
none | Optional design table (TSV), one row per sample (or samplesheet group), one column per factor |
METADATA_ID_COL |
first column | The design table's id column |
GROUP_COL |
first factor column | The factor carried as condition; columns named protocol, source_replicate and run_id feed the three confounder filters |
depictio config nextflow --install     # once per machine
nextflow run nf-core/nanoseq -r 3.0.0 -profile docker --outdir results
No depictio ingest, and no template named: the pipeline ingests its own
output directory when it finishes and resolves this template from its own
manifest. The MultiQC reprocess above still applies to a 3.0.0 run. See
Nextflow trigger.
Reference
The template reads the validated samplesheet, the reprocessed MultiQC report,
NanoStat's summaries, the samtools stats files of the minimap2 alignments,
Bambu's gene and transcript matrices and the DESeq2 and DEXSeq result tables.
Bambu publishes feature by sample matrices, so catalog recipes melt them into
one row per sample and feature; that is what lets the sample picker reach the
counts. When Bambu's row labels are GTF attribute strings, the recipes extract
the ENSG or ENST id and promote the biotype to its own filterable column.
Self-adapting layout
The dashboard adapts to whatever the run actually produced: components bound to pruned or unparsed data collections are hidden, tabs left with no real visualizations are dropped entirely, and the remaining components are re-packed so there are no empty rows.
Template variables
Variables you provide when running the template: DATA_ROOT is the results directory given to depictio ingest, the others are set with --var NAME=value:
| Variable | Required | Description |
|---|---|---|
DATA_ROOT |
✓ | Root directory containing nanoseq output (bambu/, fastqc/, minimap2/, nanoplot/, pipeline_info/) plus the reprocessed multiqc/multiqc_data/multiqc.parquet. |
METADATA_FILE |
— | Optional design table (TSV): sample name (or samplesheet group) in METADATA_ID_COL, one column per factor. GROUP_COL becomes the condition; columns named protocol, source_replicate and run_id feed the library preparation, source replicate and flow-cell run filters; other factors are carried as extra columns. |
METADATA_ID_COL |
— | Design table id column. Auto-detected as the first column. |
GROUP_COL |
— | Design table factor the run compares, carried as the condition column. Auto-detected as the first factor column of METADATA_FILE. |
Auto-detected (set from the run's metadata / params.json; the route flags drive Conditional routes below): GROUP_COL_DISPLAY, ANNOTATION_COLS
Data collections
22 data collections — 19 required 3 optional · 14 direct 8 derived.
Origin tells you whether a collection is real pipeline data or a reshape of it: direct = a pipeline output (scanned, or a recipe that reads raw files); derived = a recipe that reshapes one or more direct collections into the layout a visualization needs (no new measurement). Reads shows what produces it: a recipe .py transform, whose name links to its source on GitHub, or a raw file scanned off disk. (A direct collection can still have a recipe — one that merely parses/cleans the raw file; derived means the recipe reshapes another collection.)
| Tag | Origin | Type | Reads | Status |
|---|---|---|---|---|
metadata |
direct | Table | file {METADATA_FILE} |
optional |
samples |
derived | Table | recipe nf-core/nanoseq/samples.py |
required |
samplesheet |
direct | Table | file samplesheet.valid.csv$ |
required |
multiqc_data |
direct |  MultiQC MultiQC |
file (?:.*/)?multiqc(?:/[^/]+)?/multiqc_data/multiqc.parquet$ |
required |
nanoplot_nanostats_raw |
direct | Table | file (?:.*_)?NanoStats.txt$ |
required |
nanostats |
derived | Table | recipe nanoplot/nanostats.py |
required |
nanostats_quality |
derived | Table | recipe nanoplot/nanostats_quality.py |
required |
samtools_stats_raw |
direct | Table | file .*.bam.stats$ |
required |
samtools_stats_sections |
derived | Table | recipe samtools/stats_sections.py |
required |
samtools_read_length_nx |
derived | Table | recipe nf-core/nanoseq/read_length_nx.py |
required |
bambu_counts_gene_long |
direct | Table | recipe bambu/counts_gene_long.py |
required |
bambu_counts_transcript_long |
direct | Table | recipe bambu/counts_transcript_long.py |
required |
bambu_sample_pca |
direct | Table | recipe bambu/sample_pca.py |
required |
bambu_sample_correlation |
direct | Table | recipe bambu/sample_correlation.py |
required |
bambu_top_variable_genes |
direct | Table | recipe bambu/top_variable_genes.py |
required |
deseq2_results_raw |
direct | Table | file (?:.*/)?deseq2/deseq2.results.txt$ |
required |
deseq2_results |
derived | Table | recipe nf-core/nanoseq/deseq2_results.py |
required |
deseq2_top_expressed |
derived | Table | recipe nf-core/nanoseq/deseq2_top_expressed.py |
required |
dexseq_results |
direct | Table | recipe dexseq/results.py |
required |
dexseq_usage |
direct | Table | recipe nf-core/nanoseq/dexseq_usage.py |
required |
gtf_transcripts_raw |
direct | Table | file (?:.*/)?bambu/extended_annotations.gtf(?:.gz)?$ |
optional |
gtf_transcripts |
derived | Table | recipe gtf/transcripts.py |
optional |
Conditional routes
Rows are data collections; columns are the variables you set or params.json flags auto-detected from the run. Each filled cell is the effect of setting that variable; an empty cell means that variable leaves the collection unchanged. (21 collections are unaffected by any variable — present on every run.)
+ included− removed⇄ repointed
| Data collection | METADATA_FILE |
|---|---|
metadata |
+ |
Cross-DC links
13 links — selecting a value in the source collection filters the target. The join column is shown after the source.
| Source · column | Target | Filters | |
|---|---|---|---|
samples · sample_id |
→ | multiqc_data |
Filter the MultiQC panels by the samples picked in the left panel |
samples · sample_id |
→ | nanostats |
Filter the NanoStat summary by the samples picked in the left panel |
samples · sample_id |
→ | nanostats_quality |
Filter the quality-cutoff ladder by the samples picked in the left panel |
samples · sample_id |
→ | samtools_stats_sections |
Filter the alignment distributions by the samples picked in the left panel |
samples · sample_id |
→ | bambu_counts_gene_long |
Filter the gene counts by the samples picked in the left panel |
samples · sample_id |
→ | bambu_counts_transcript_long |
Filter the transcript counts by the samples picked in the left panel |
samples · sample_id |
→ | bambu_sample_pca |
Filter the sample structure readings by the samples picked in the left panel |
samples · sample_id |
→ | bambu_sample_correlation |
Filter the correlation matrix rows by the samples picked in the left panel |
samples · sample_id |
→ | samtools_read_length_nx |
Filter the Nx ladder by the samples picked in the left panel |
samples · sample_id |
→ | dexseq_usage |
Filter the DEXSeq usage shares by the samples picked in the left panel |
samples · sample_id |
→ | gtf_transcripts |
Filter the isoform structures by the samples picked in the left panel |
nanostats · sample |
→ | samples |
Scope the sample hub to a library picked on the NanoStat table |
bambu_sample_pca · sample_id |
→ | samples |
Scope the sample hub to a sample picked on the PCA |
Recipes
Each recipe reshapes raw pipeline output into a tidy table. The name links to its source; Output lists the validated OUTPUT_SCHEMA columns.
| Recipe | Transforms | Output |
|---|---|---|
bambu/counts_gene_long.py |
Bambu's gene count matrix, melted to one row per sample and gene. | sample, condition, gene_id, gene_biotype, count, cpm, log_cpm |
bambu/counts_transcript_long.py |
Bambu's transcript count matrix, melted to one row per sample and transcript. | sample, condition, transcript_id, gene_id, gene_biotype, count, cpm, log_cpm |
bambu/sample_correlation.py |
Sample-to-sample expression correlation of a Bambu gene matrix. | sample_id, condition, mean_correlation |
bambu/sample_pca.py |
Sample structure of a Bambu gene matrix: PCA coordinates plus library metrics. | sample_id, condition, dim_1, dim_2, dim_3, pc1_var_pct, pc2_var_pct, total_counts, n_genes_detected, pct_protein_coding, top50_share_pct |
bambu/top_variable_genes.py |
The most variable genes of a Bambu matrix, on a log-CPM scale. | gene_id, gene_biotype, log_cpm_variance |
dexseq/results.py |
DEXSeq differential exon/transcript usage results (volcano schema). | feature_id, gene_id, log2fc, pvalue, padj, significant, direction |
gtf/transcripts.py |
Exon and CDS blocks of every transcript in a run's GTF/GFF annotations. | transcript_id, gene_id, gene_name, chrom, start, end, feature, strand, transcript_class, sample, expression |
nanoplot/nanostats.py |
NanoPlot's NanoStat summary, one row per sample. | sample, n_reads, total_bases, total_gigabases, mean_read_length, median_read_length, read_length_n50, stdev_read_length, mean_read_quality, median_read_quality, longest_read_length, top_read_quality |
nanoplot/nanostats_quality.py |
The yield-above-quality-cutoff ladder of a NanoStat summary. | sample, q_cutoff, n_reads, pct_reads, megabases |
nf-core/nanoseq/deseq2_results.py |
DESeq2 results on Bambu counts, with labels a reader can read. | contrast, gene_id, gene_biotype, feature_label, exon_id, base_mean, log2fc, lfc_se, pvalue, padj, log2_base_mean, neg_log10_padj, significant, direction |
nf-core/nanoseq/deseq2_top_expressed.py |
The most expressed slice of the DESeq2 table, for the pinned reference tile. | contrast, gene_id, gene_biotype, feature_label, exon_id, base_mean, log2fc, lfc_se, pvalue, padj, log2_base_mean, neg_log10_padj, significant, direction |
nf-core/nanoseq/dexseq_usage.py |
Relative transcript usage per library, for the genes DEXSeq ranks first. | sample, condition, gene_id, gene_label, transcript_id, count, usage_pct, gene_padj, usage_log2fc, significant |
nf-core/nanoseq/read_length_nx.py |
The Nx ladder of each library, from the read-length histogram samtools stats keeps. | sample, nx, read_length, bases_share |
nf-core/nanoseq/samples.py |
One row per nf-core/nanoseq sample: the validated samplesheet, joined to the run's design. | sample_id, condition, replicate, protocol, source_replicate, run_id, reference, is_transcripts, has_fast5 |
samtools/stats_sections.py |
The distribution sections of a samtools stats report, as one long table. |
sample, section, series, metric, bin, n_reads, n_bases, n_indels, n_pairs, reads_total, reads_mapped, reads_mapped_pct, bases_mapped, error_rate, identity_pct, average_length, maximum_length, average_quality, supplementary_alignments |
Dashboard tabs
One dashboard: the Overview, then six child tabs in two groups, read as a funnel from the raw reads to the genes and isoforms that differ between conditions. Each tab below carries the same icon and colour the dashboard gives it, so the page and the app read alike.
| Group | Tabs |
|---|---|
| Data & QC | MultiQC, Reads, Alignment |
| Expression | Quantification, Gene expression, Isoform usage |
Each child tab opens with a short intro and a strip of four cards, then at most three open sections; tables and details follow, collapsed. The persistent Sample filters (condition, library, then the library preparation, flow-cell run and source replicate) sit in the left panel and narrow every tab with a sample column through the sample hub. DESeq2 and DEXSeq compare the conditions once over the whole run: their result tables carry no sample column, so the sample filters do not narrow the Gene expression tab or the DEXSeq tiles of Isoform usage. The Sample sheet, the library design table, is pinned, collapsed, to the bottom of every child tab.
Nanopore long reads, from QC to the genes and isoforms that differ.
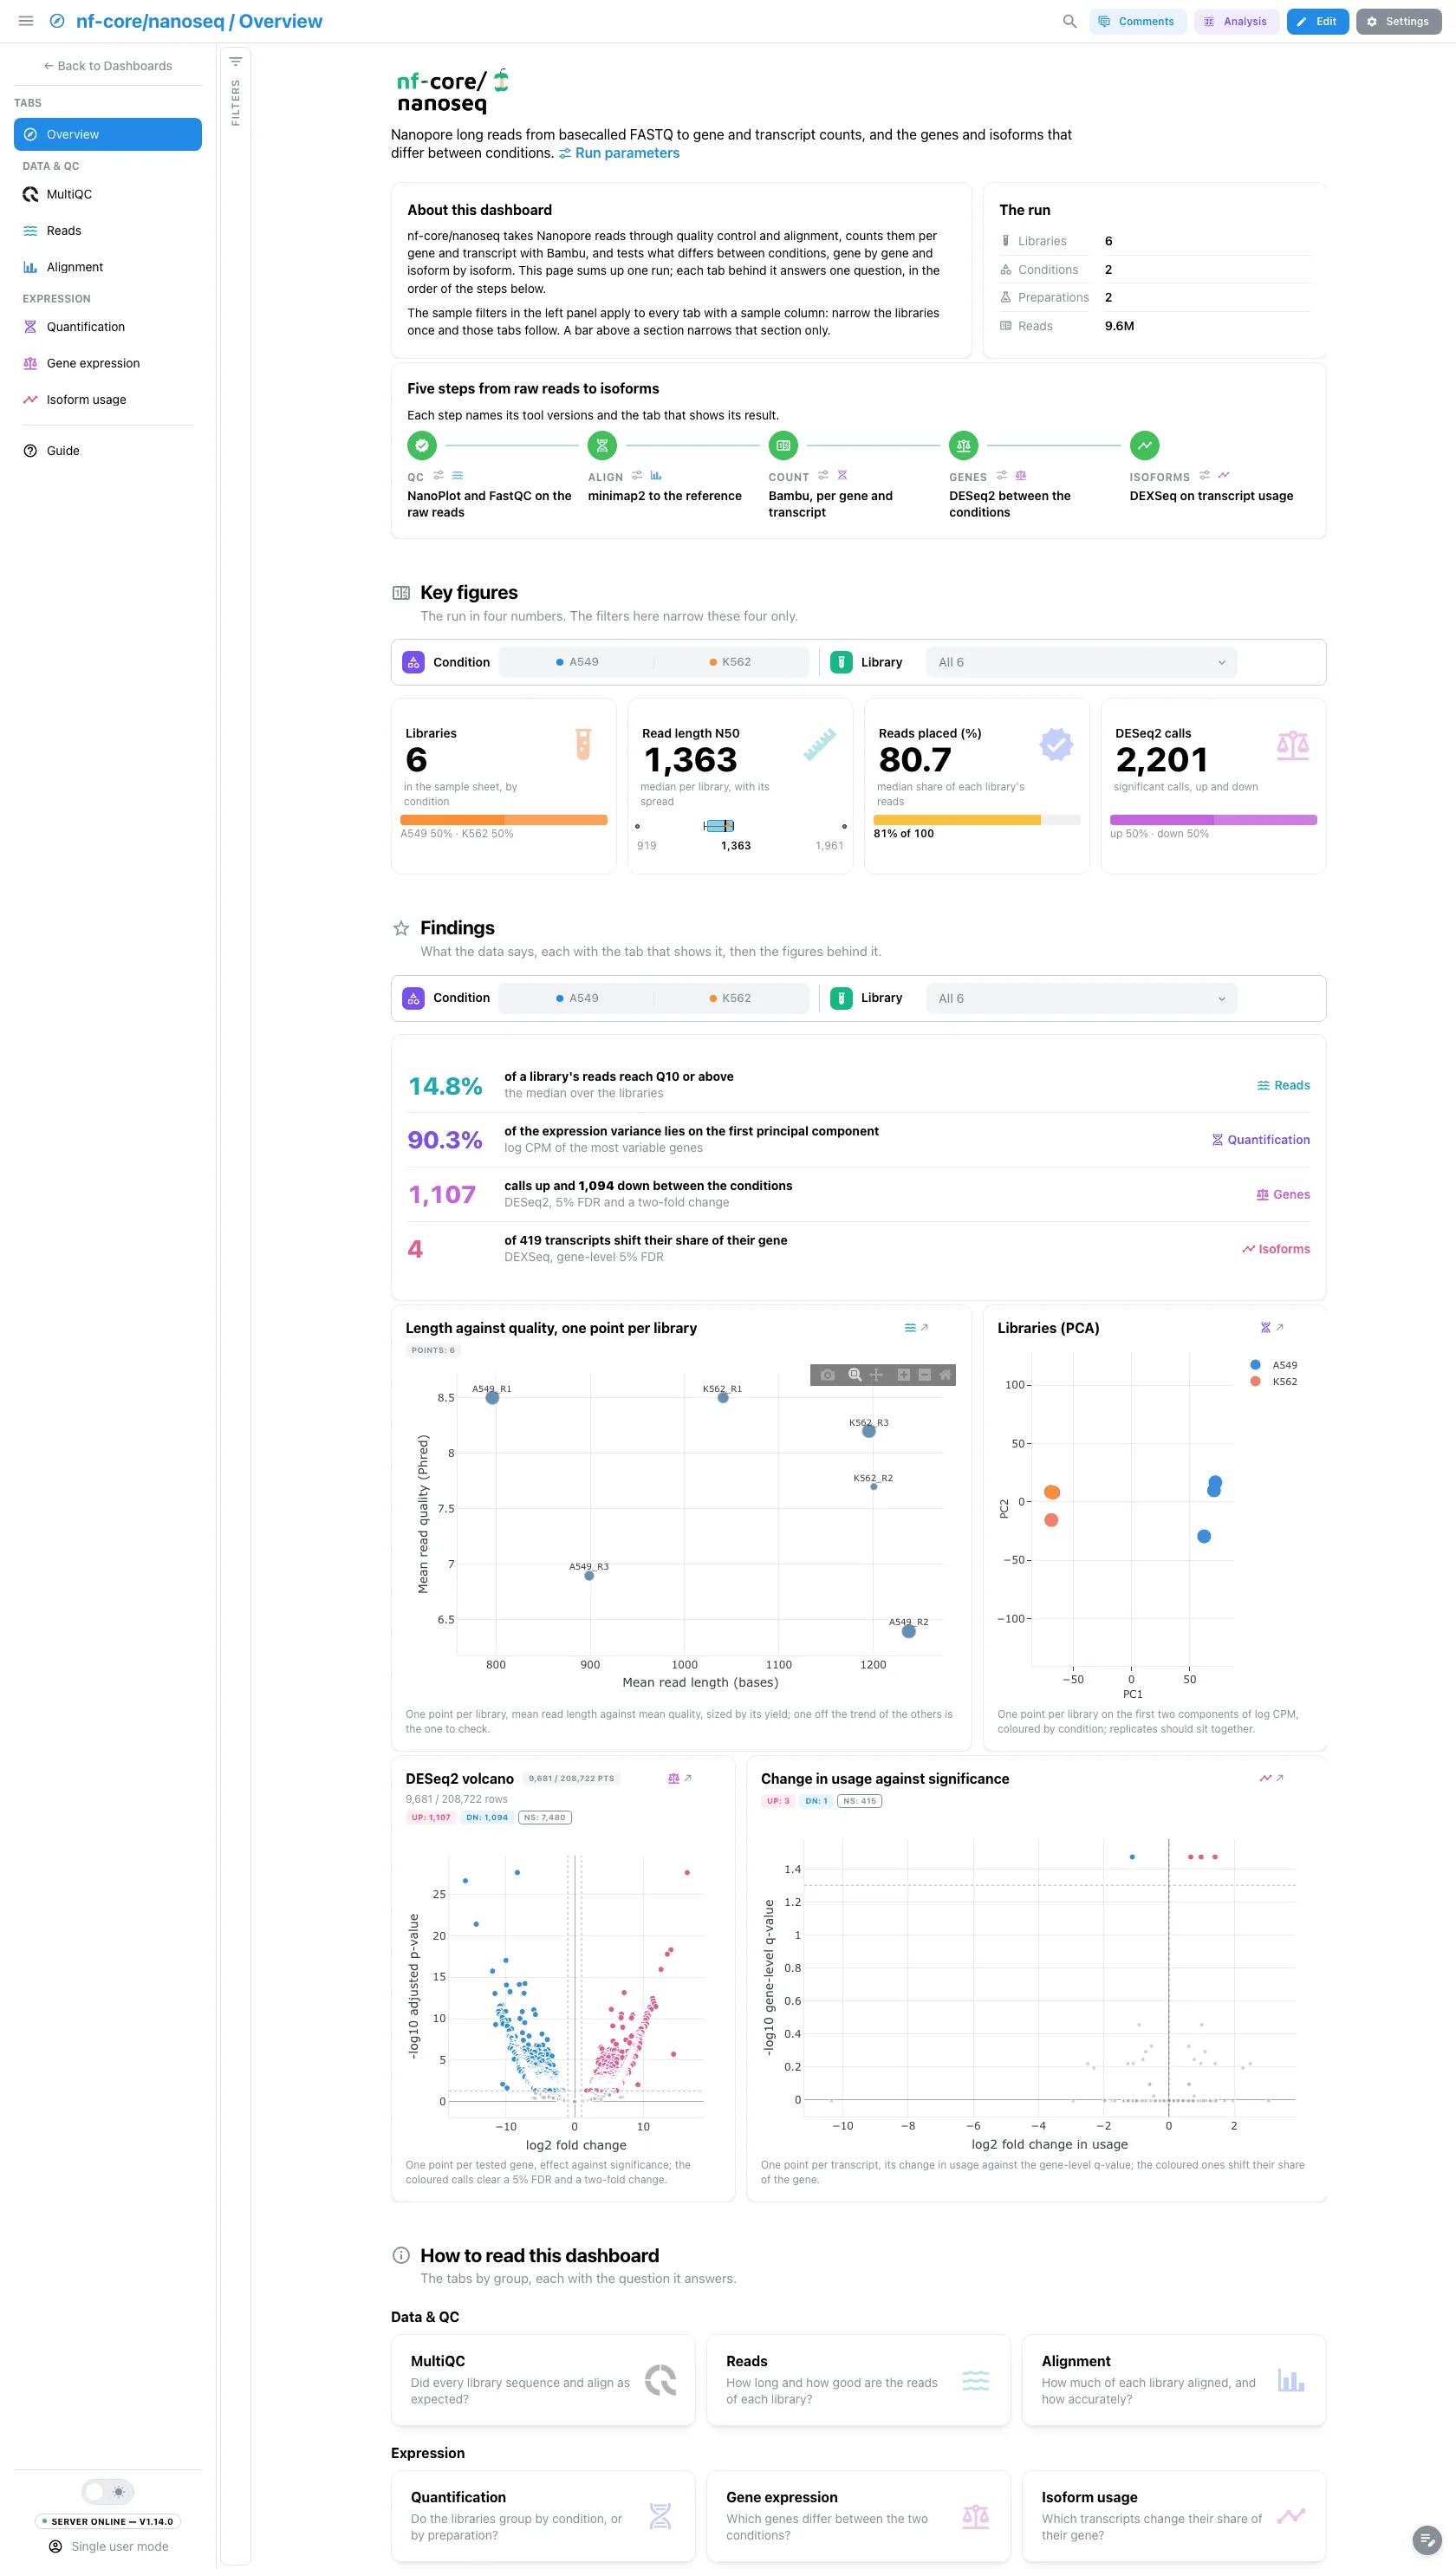
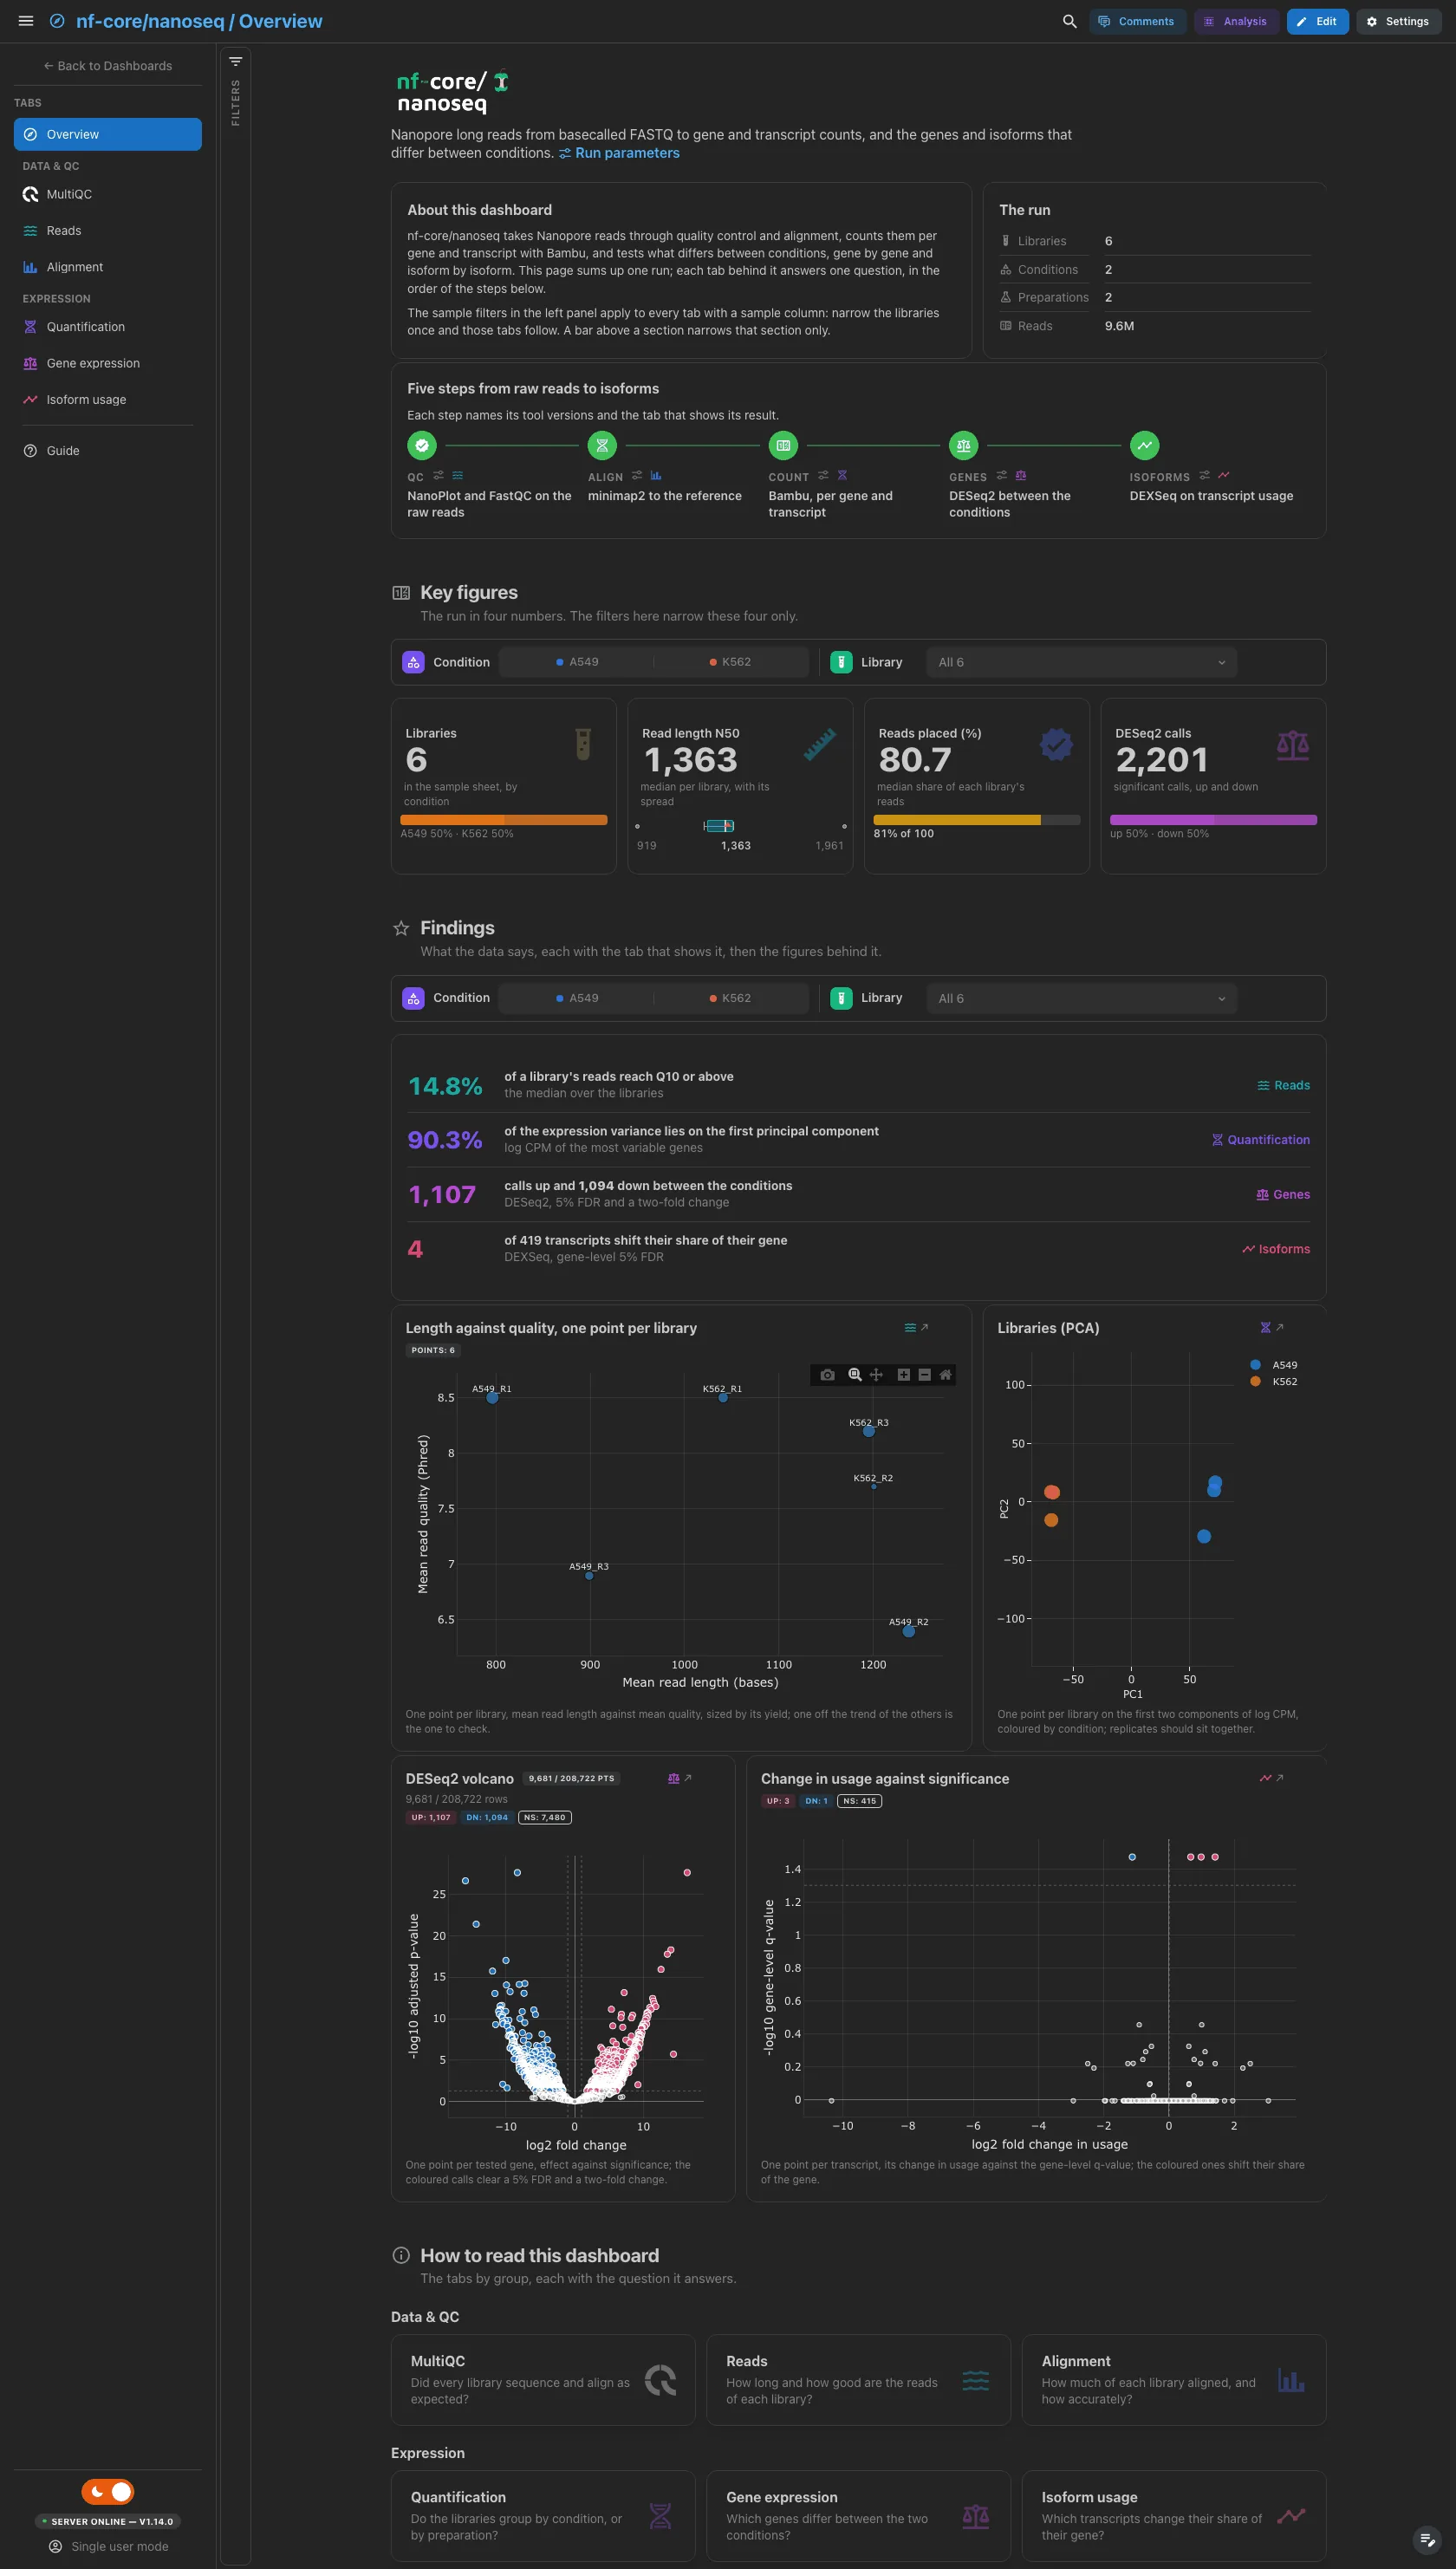
A short hero links the run's provenance: nanoseq writes no params.json, so
the dialog holds the software versions. About this dashboard says how the two
filter levels work, The run lists facts read from the data (libraries,
conditions, library preparations, reads), and Pipeline walks the five steps
from QC to isoforms, each linked to the version of its tool and its tab. The
findings are live values: they follow the filters. The DESeq2 row counts one
call per tested annotation entry, as the key figure and the volcano do; the
Gene expression tab counts the distinct genes.
Filters and components
Filters · the left panel starts collapsed. Key figures and Findings each have their own filter bar (the condition and the library): each narrows its own section only.
| Section | What it holds |
|---|---|
| Top | Hero, About this dashboard, The run, Pipeline |
| Key figures | 4 headline cards: libraries by condition, read length N50, reads placed, DESeq2 calls up and down |
| Findings | Live result rows, then 4 figures: length against quality per library, the library PCA, the DESeq2 volcano and the DEXSeq volcano |
| How to read this dashboard | The tabs by group, each with its question |
Data & QC · Did every library sequence and align as expected?
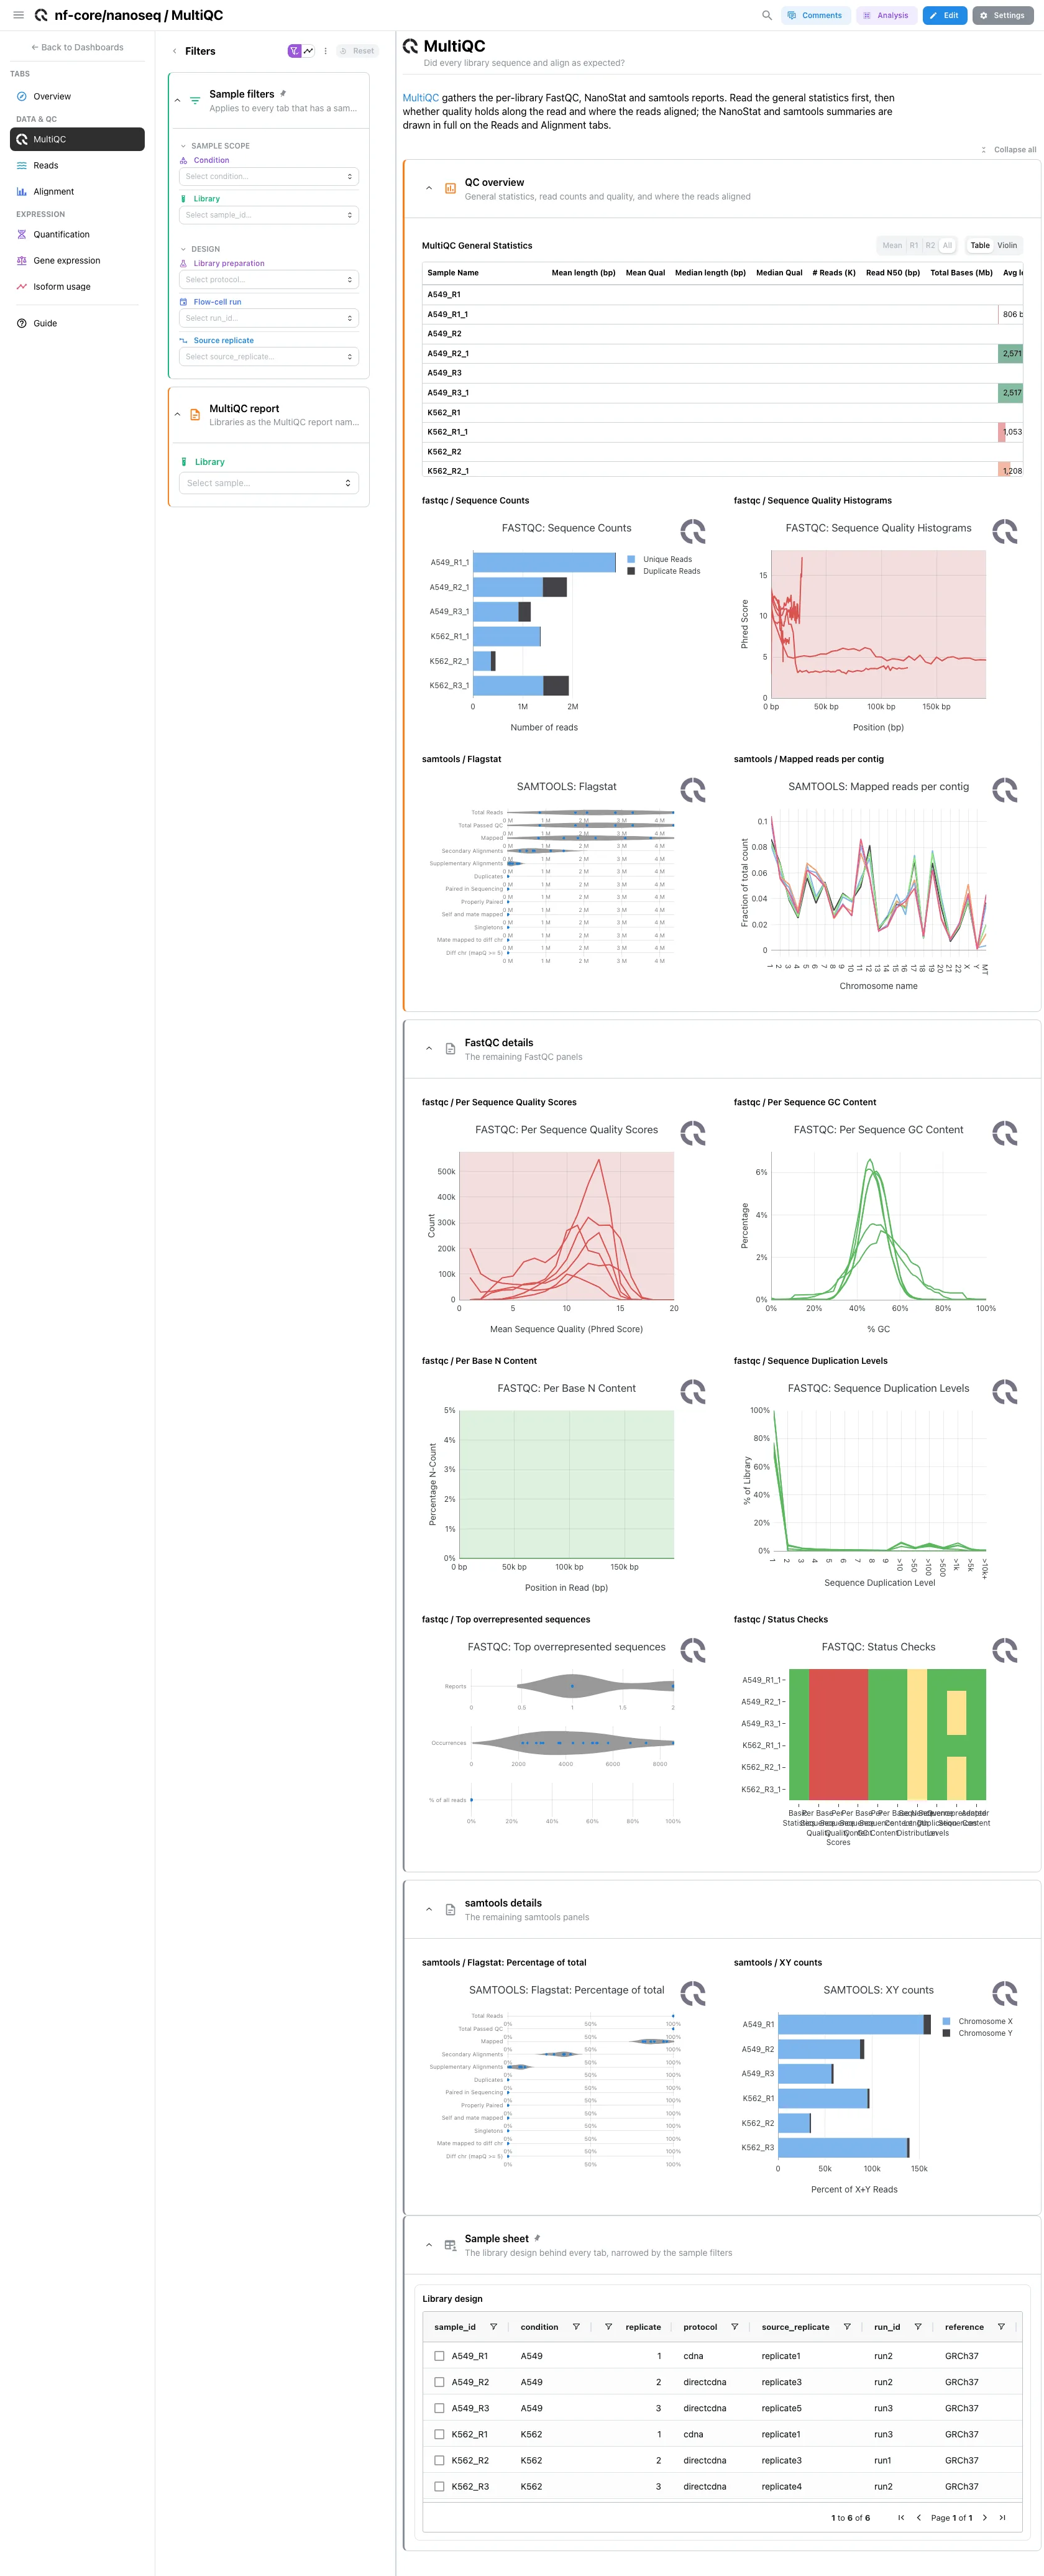
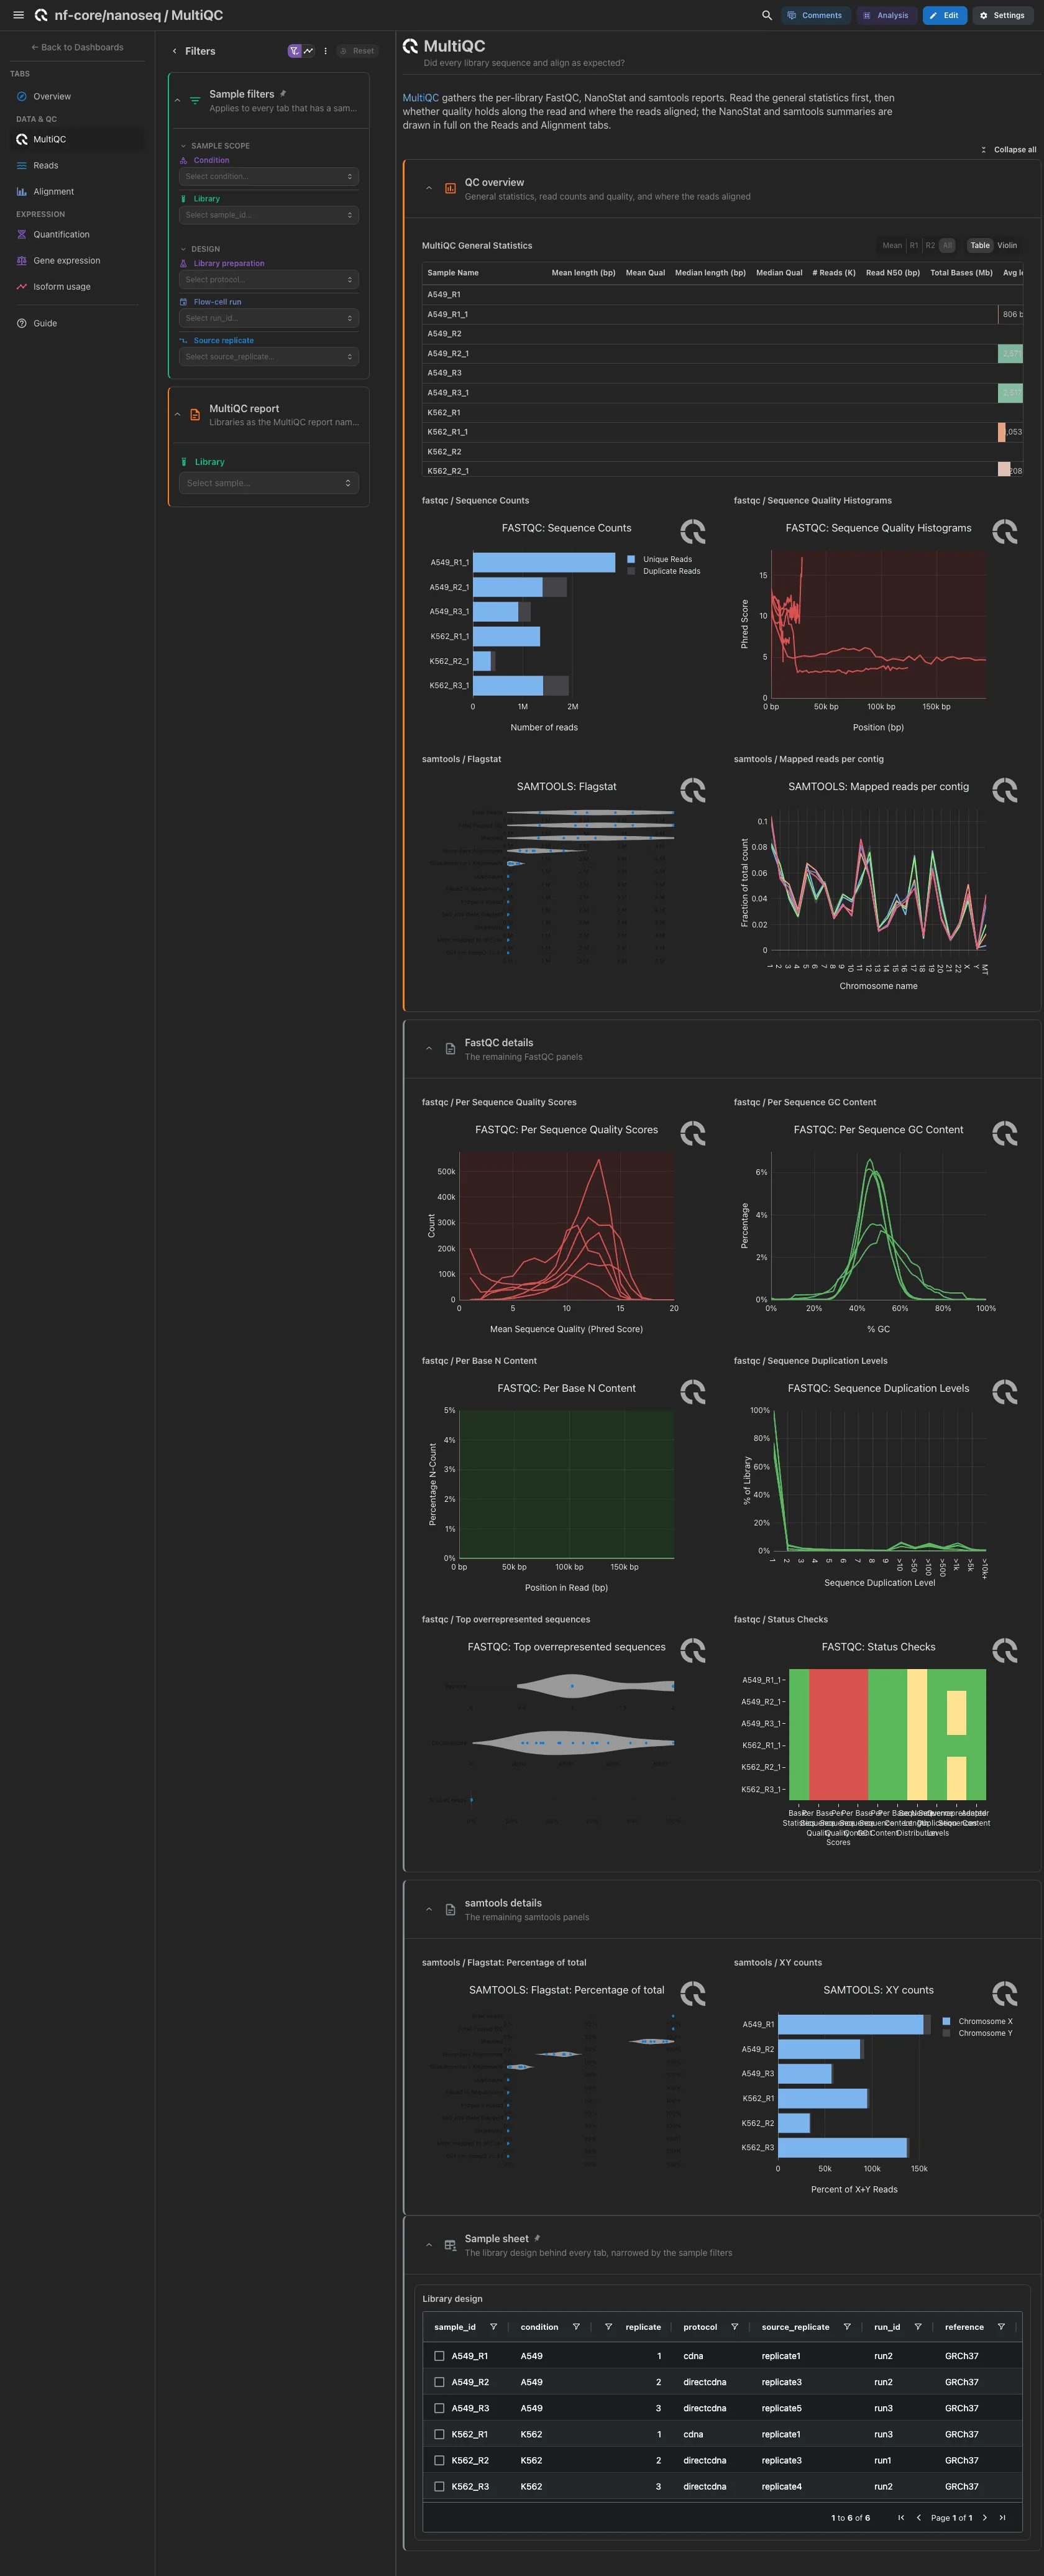
MultiQC panels only, from the reprocessed report. Open: general statistics, FastQC sequence counts and quality histograms, samtools flagstat and the mapped reads per contig. The other FastQC panels, then the samtools percentages and XY counts, are collapsed. The NanoStat panels are left out: the Reads tab draws the NanoStat summary and its quality ladder from the data, and the Alignment tab the samtools summary.
Filters and components
Filters · Library, read from the MultiQC report.
| Section | What it holds |
|---|---|
| QC overview | 5 MultiQC panels |
| FastQC details (collapsed) | 6 MultiQC panels |
| samtools details (collapsed) | 2 MultiQC panels |
Data & QC · How long and how good are the reads of each library?
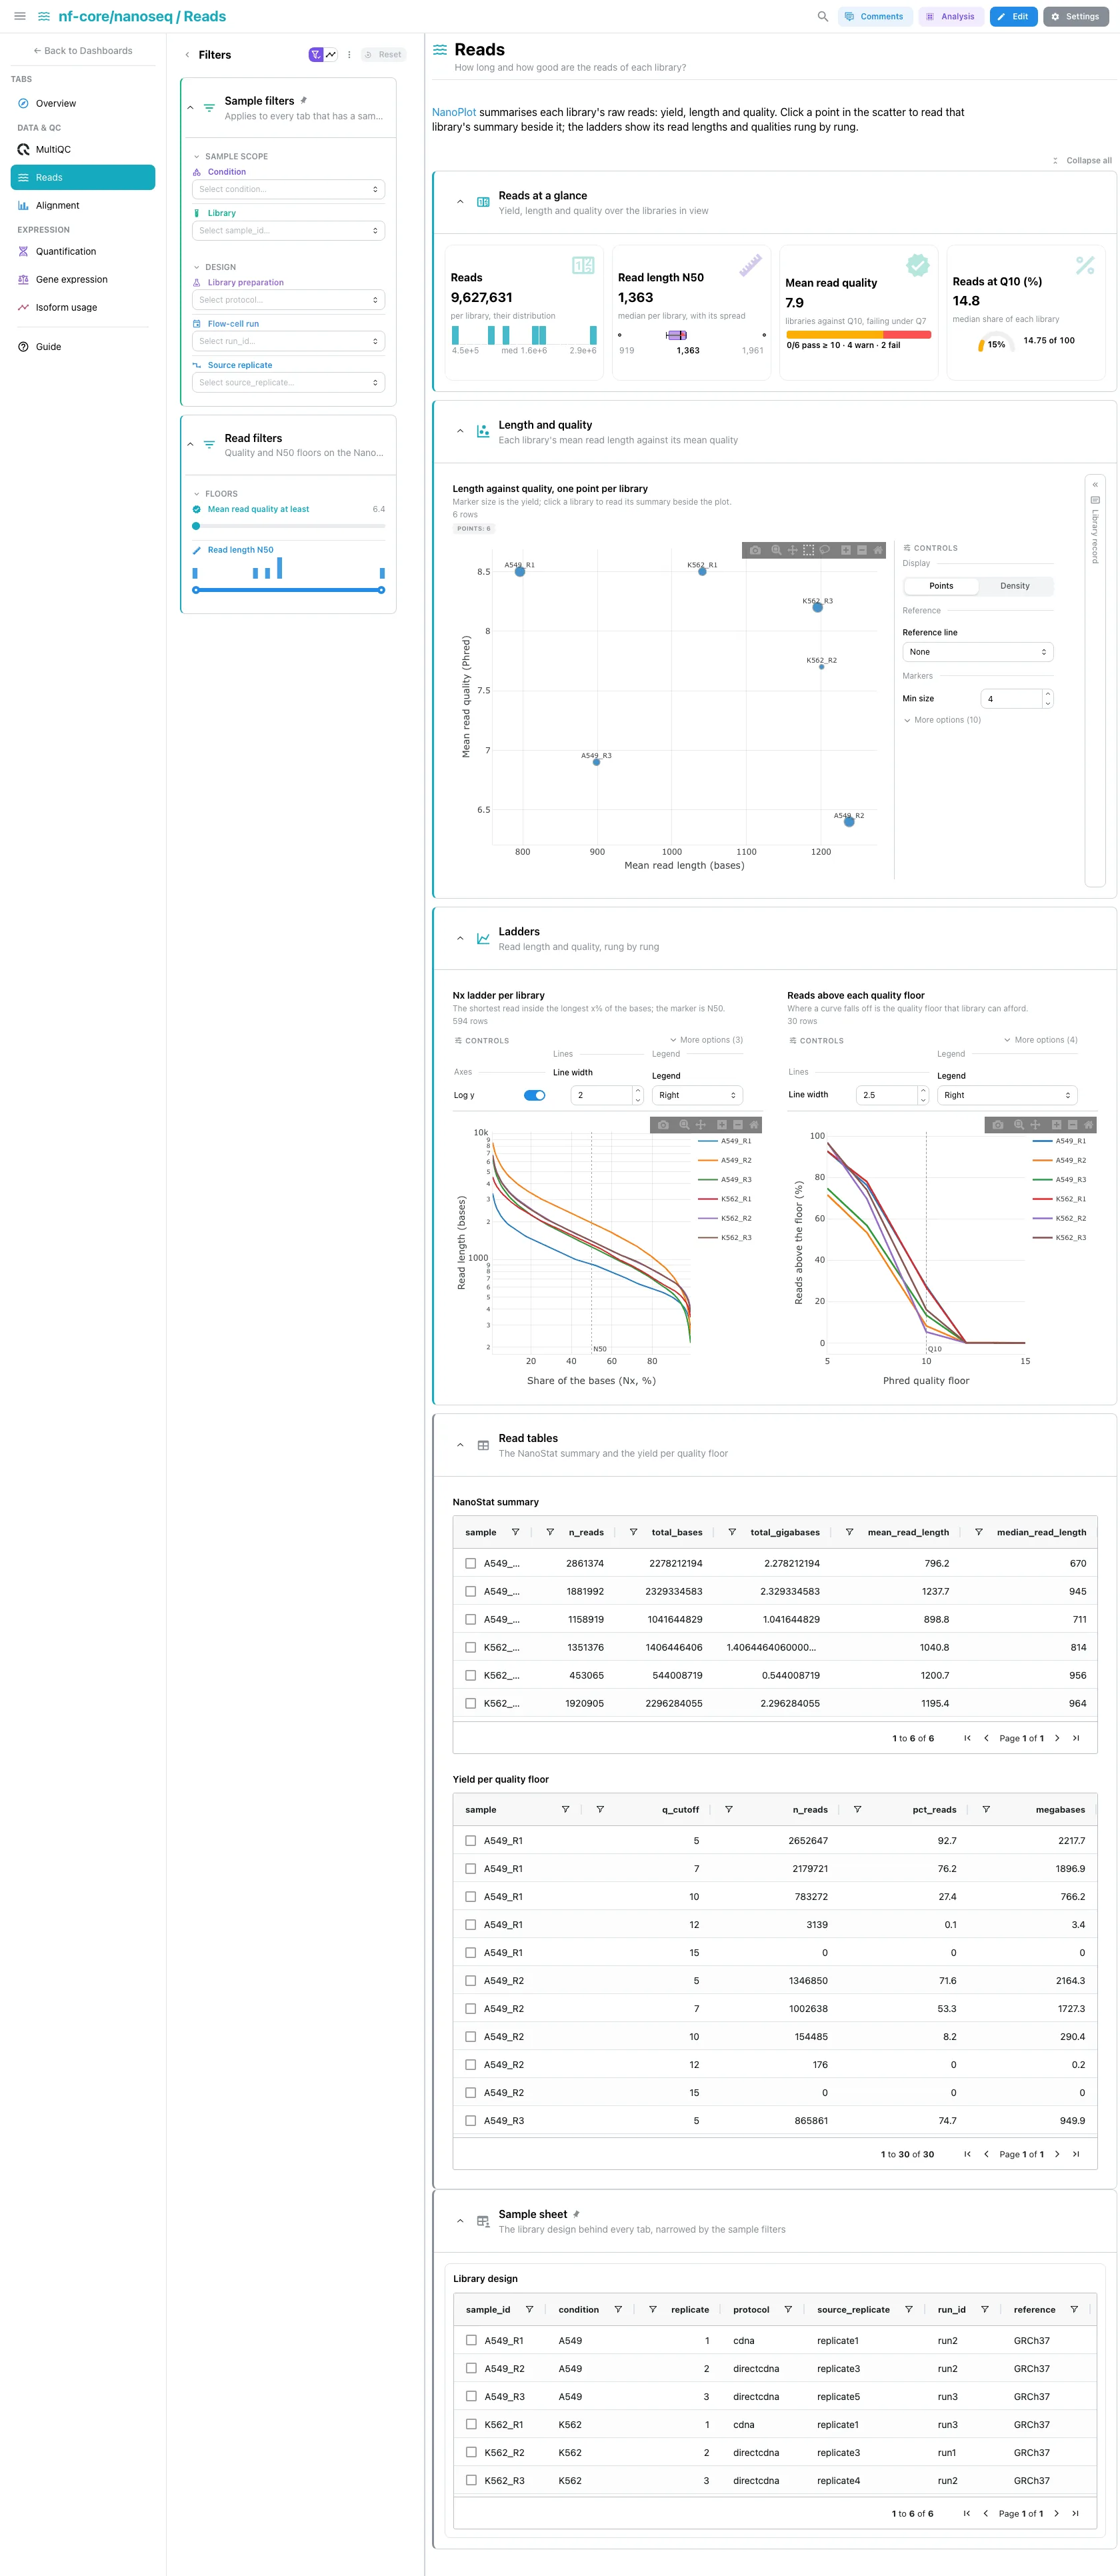
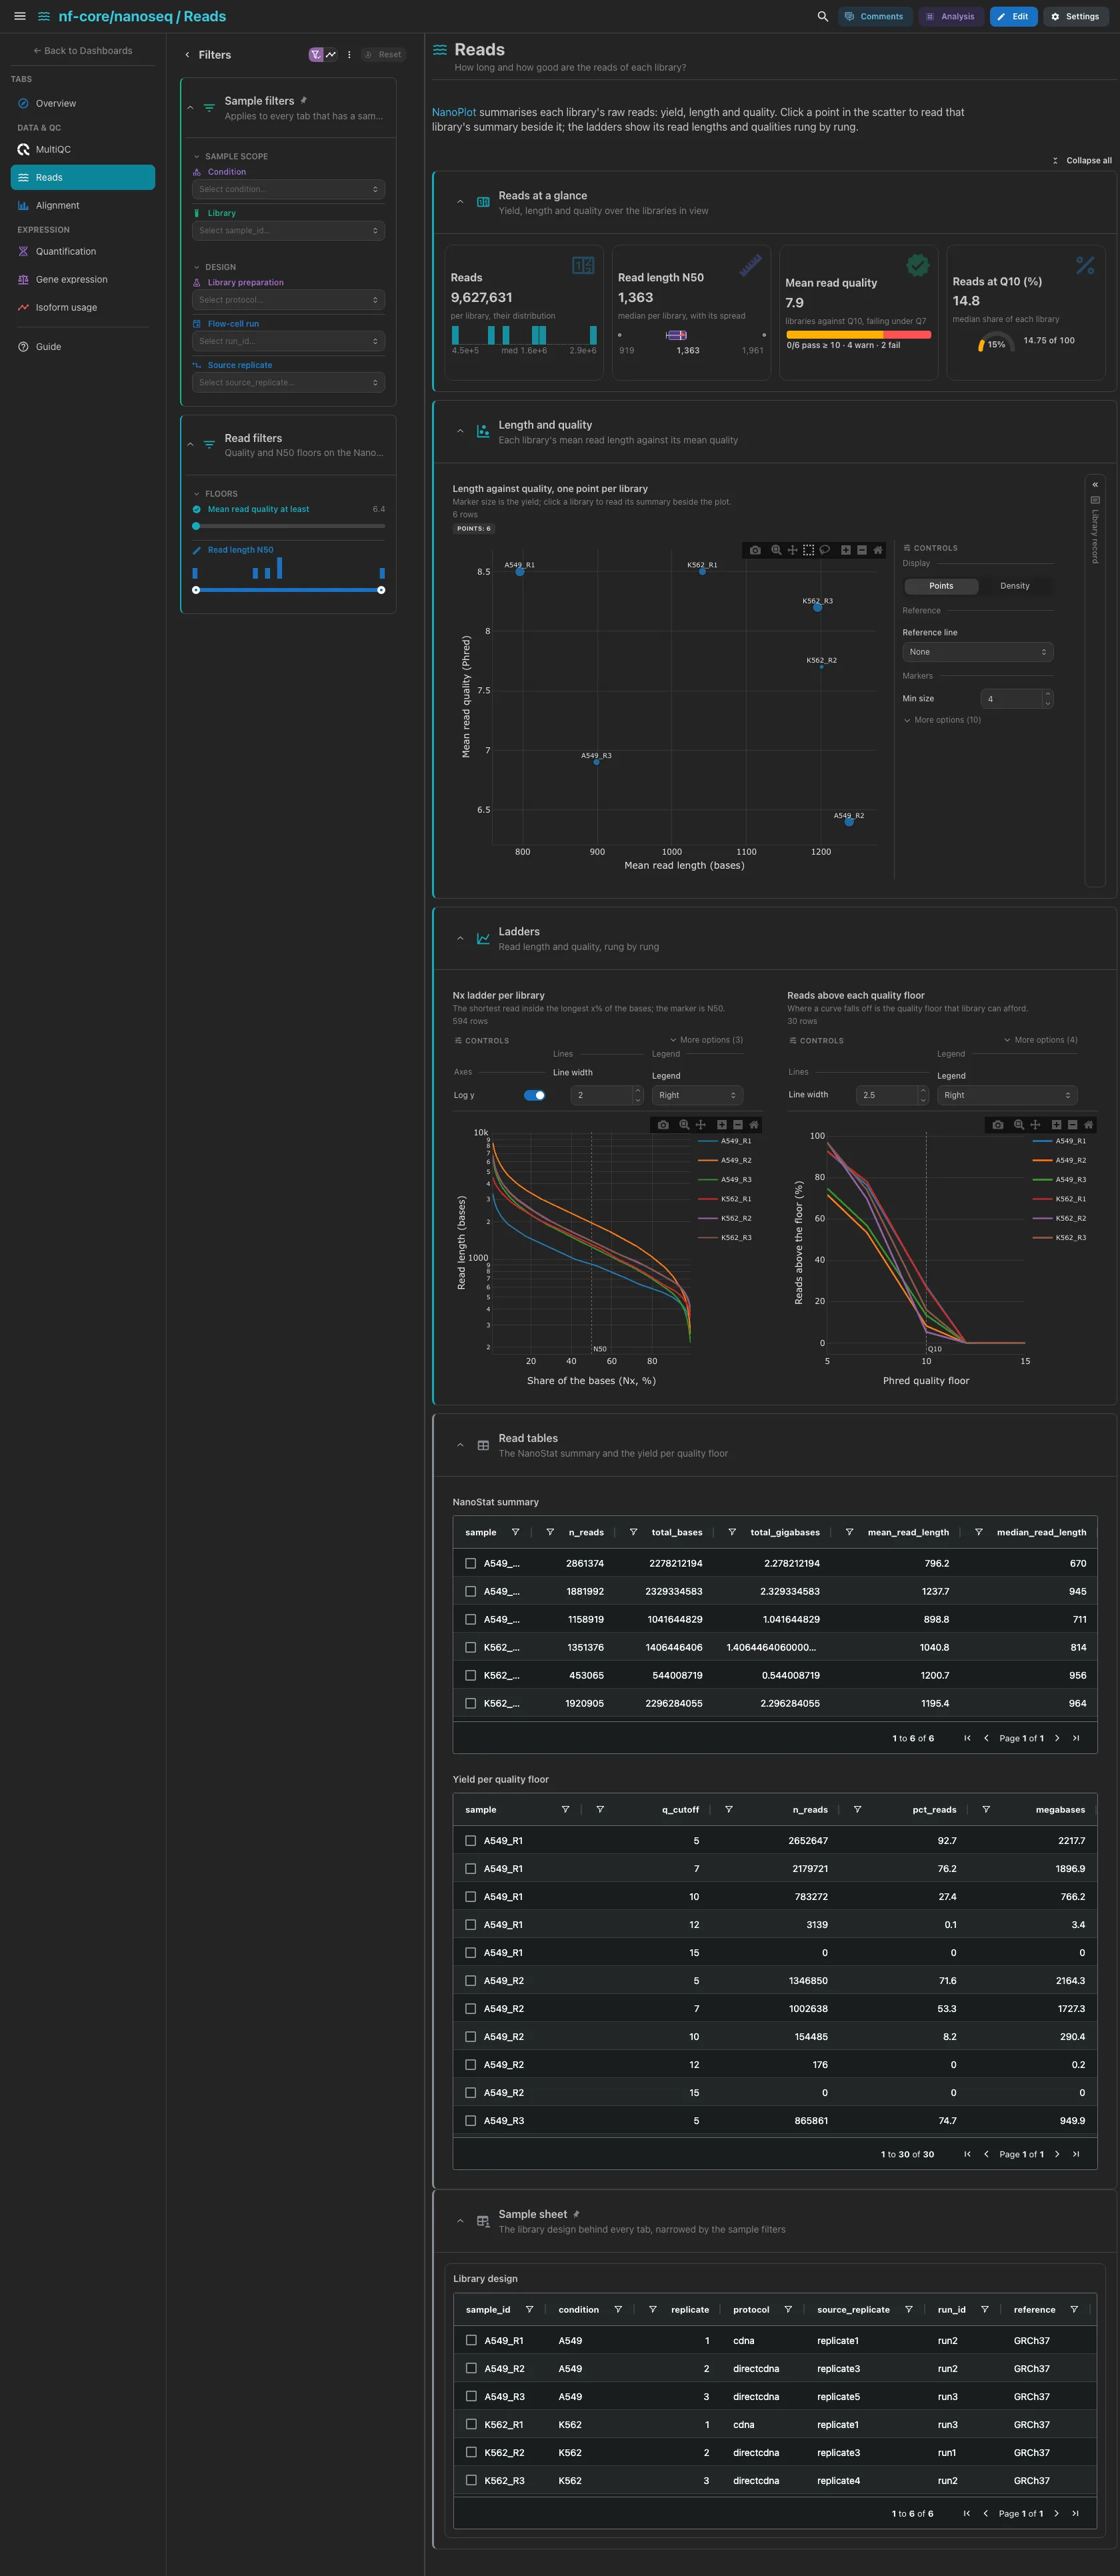
NanoPlot's summary of each library's raw reads. The reads basecalled, the median read length N50, the median mean read quality (libraries against Q10, failing under Q7) and the median share of reads at Q10 or above. Then mean read length against mean quality, one point per library sized by its yield (nanoseq publishes no per-read table), with the record of the clicked library beside it. The two ladders sit side by side: the Nx ladder recomputed from the samtools read-length histogram, N50 marked, and the share of reads above each Phred floor, Q10 marked. The NanoStat and per-floor tables are collapsed.
Filters and components
Filters · a Mean read quality at least floor and a Read length
N50 range on nanostats.
| Section | What it holds |
|---|---|
| Reads at a glance | 4 cards |
| Length and quality | 2 advanced visualizations: length against quality and the Library record |
| Ladders | 2 advanced visualizations: the Nx ladder and the reads above each quality floor |
| Read tables (collapsed) | NanoStat summary, Yield per quality floor |
Data & QC · How much of each library aligned, and how accurately?
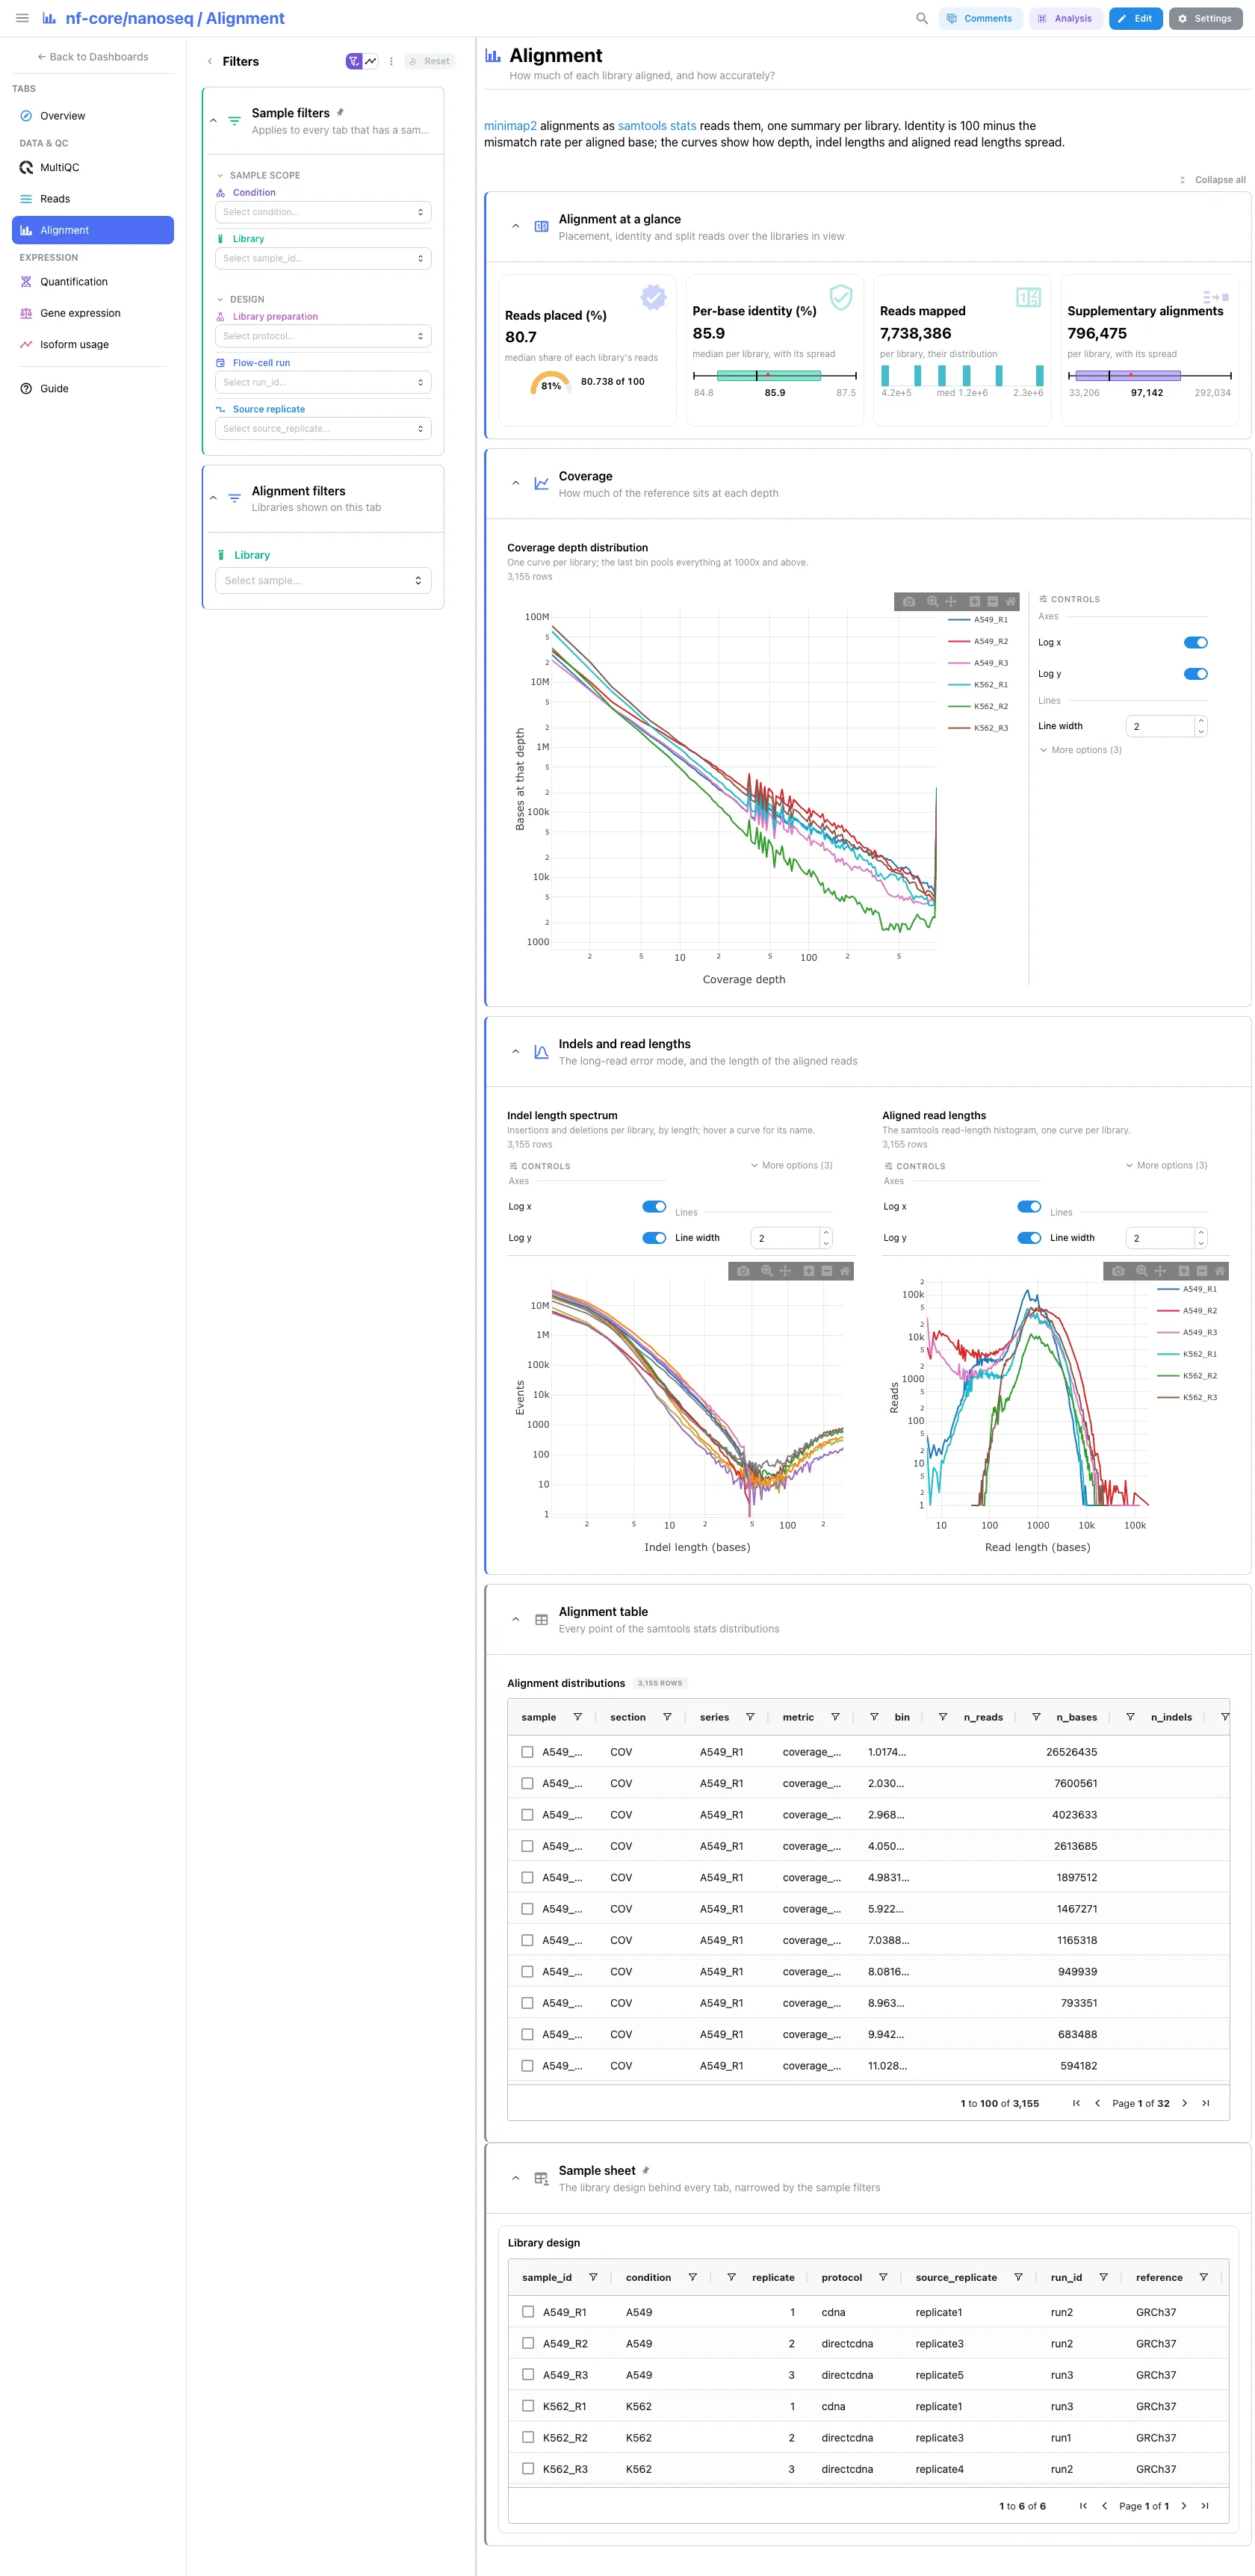
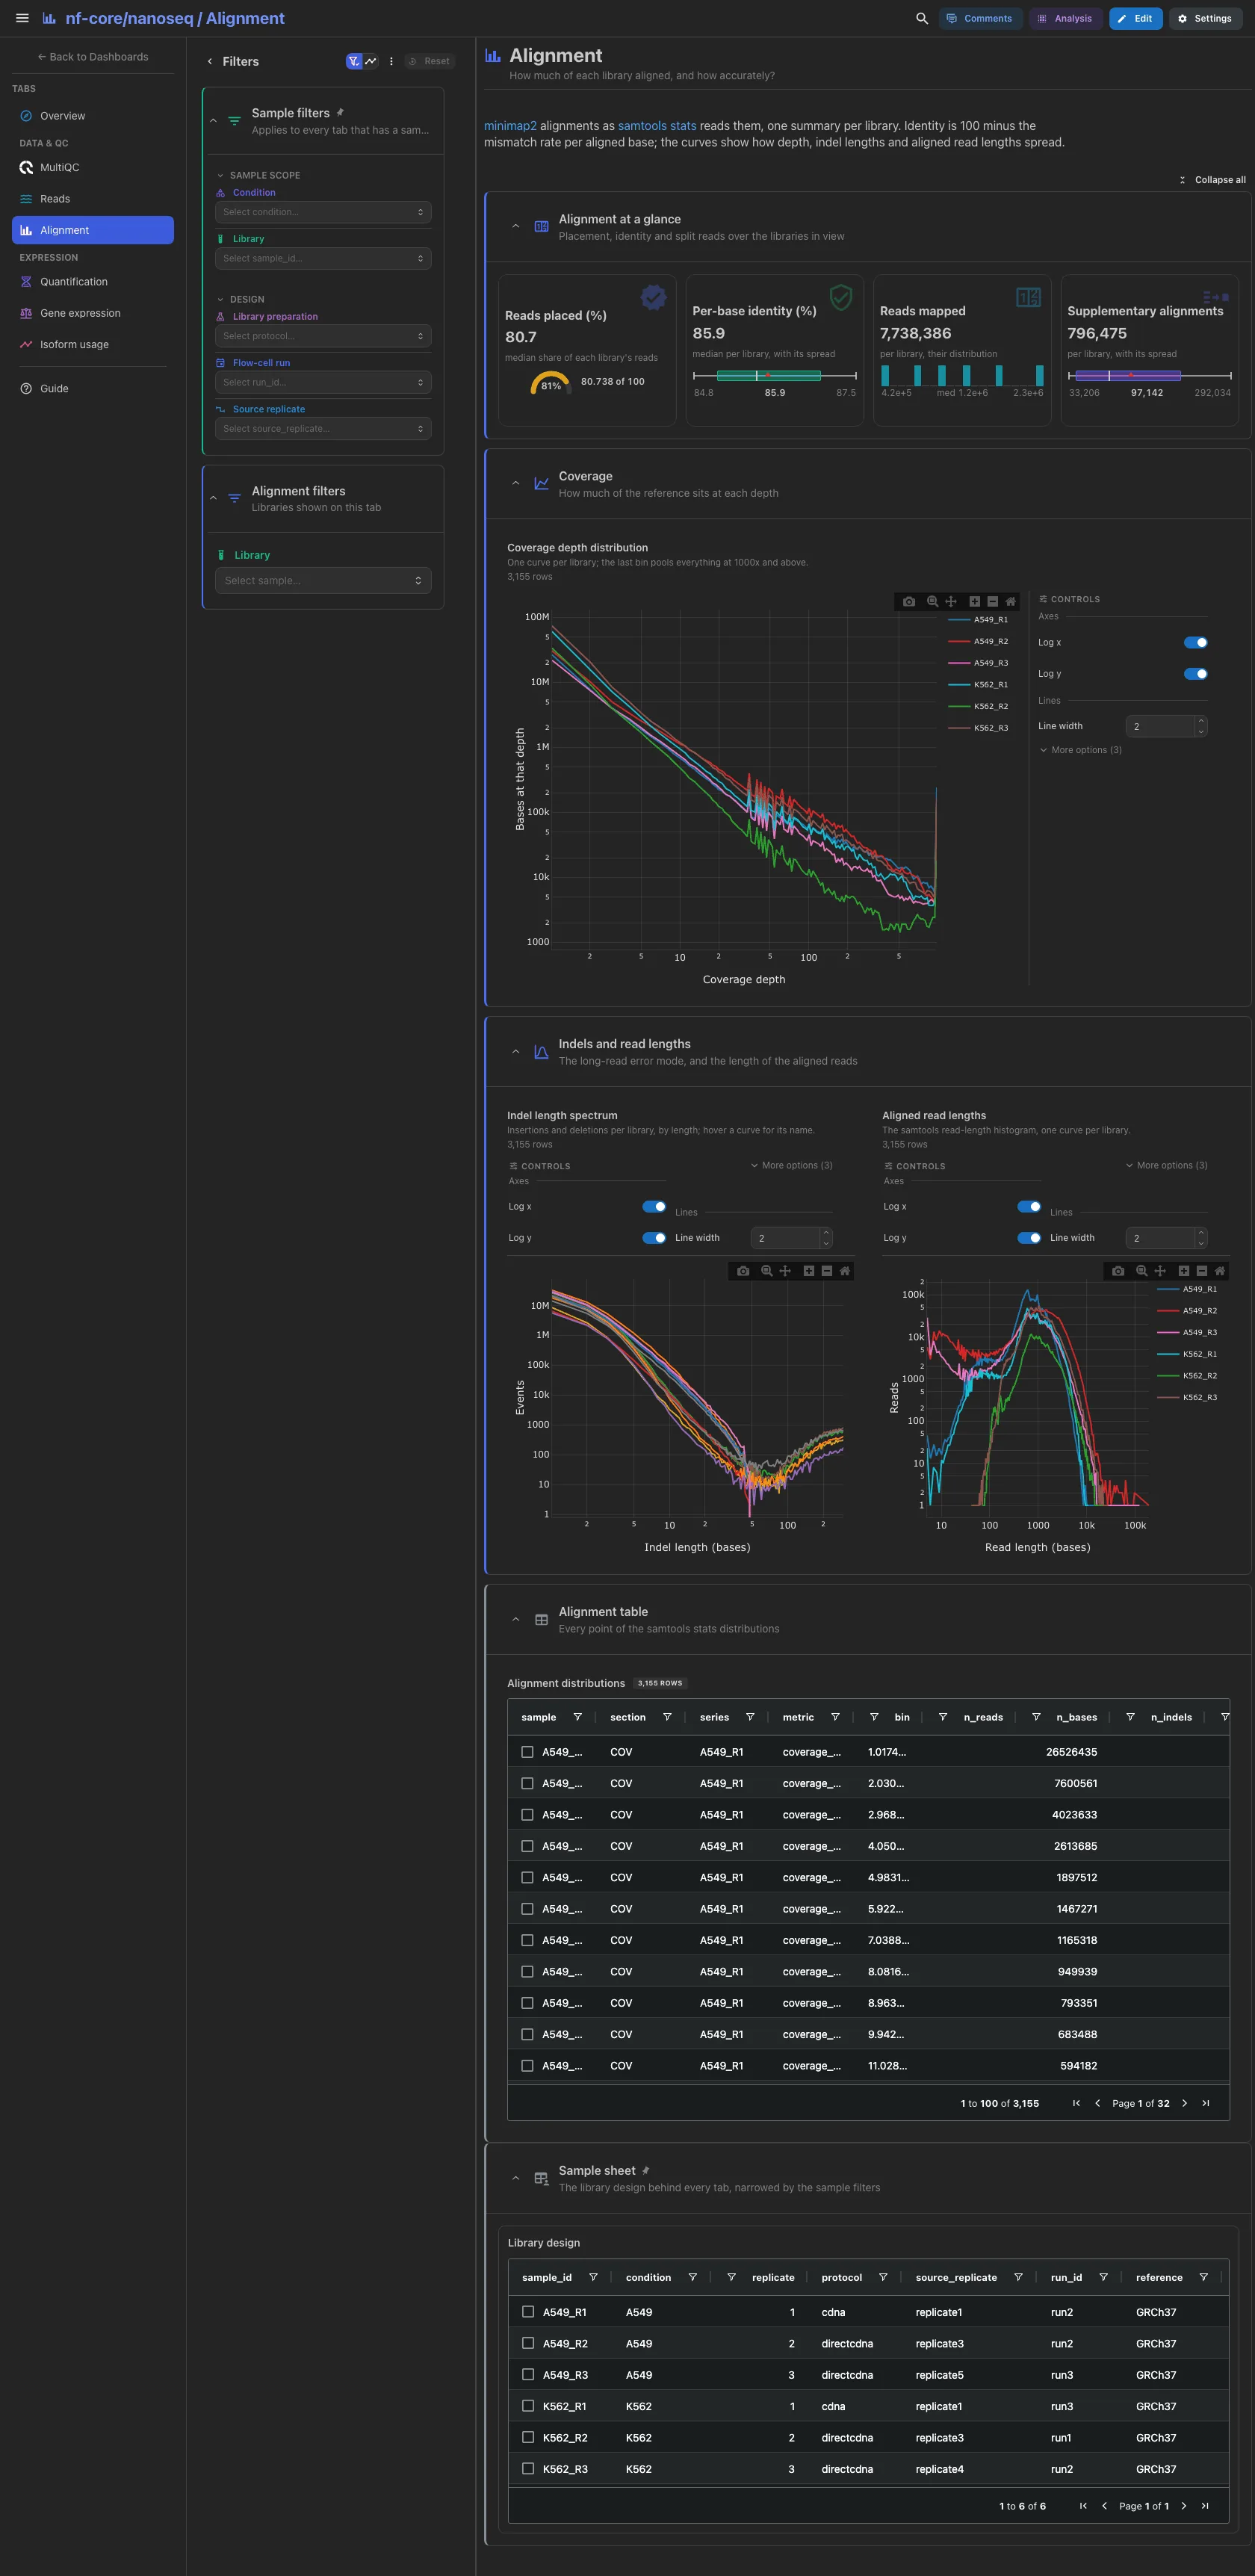
minimap2 alignments as samtools stats reads them, one summary per library.
The median share of reads placed, the median per-base identity (100 minus the
mismatch rate per aligned base), the reads mapped and the supplementary
alignments, the long-read signal of chimeras. Then the coverage depth
distribution, one curve per library, and the indel length spectrum beside the
aligned read lengths. The indel spectrum has no legend, as two curves per
library pass eight entries: hover a curve for its name. The distributions
table is collapsed.
Filters and components
Filters · a Library picker on samtools_stats_sections.
| Section | What it holds |
|---|---|
| Alignment at a glance | 4 cards |
| Coverage | 1 advanced visualization |
| Indels and read lengths | 2 advanced visualizations: the indel length spectrum and the aligned read lengths |
| Alignment table (collapsed) | Alignment distributions |
Expression · Do the libraries group by condition, or by preparation?
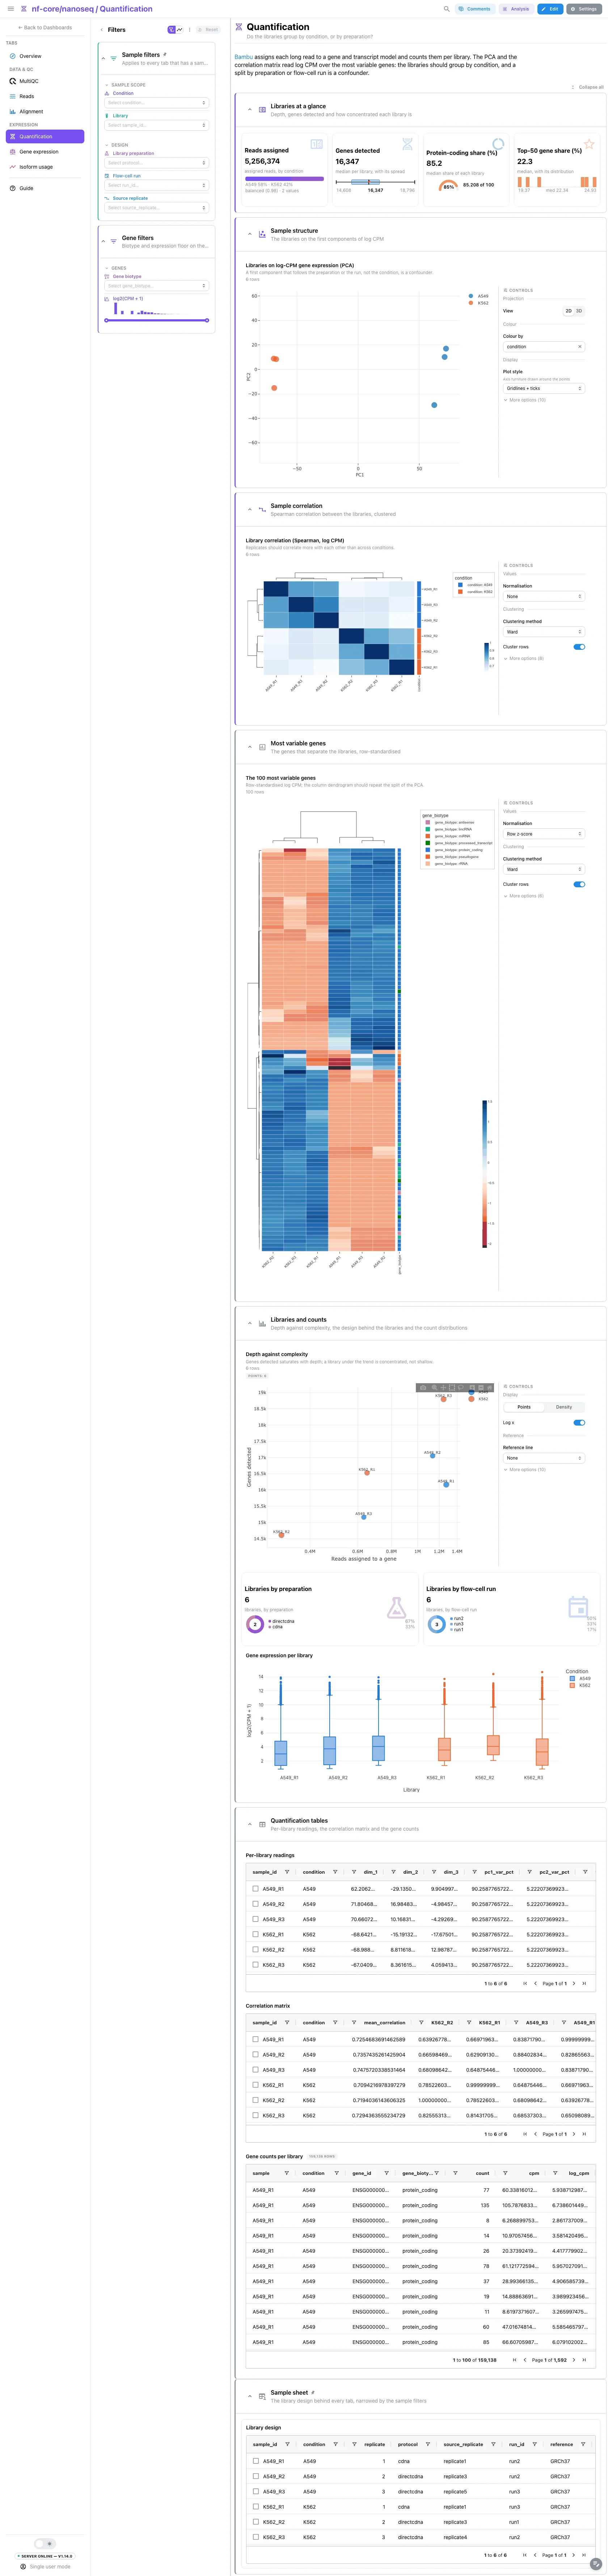
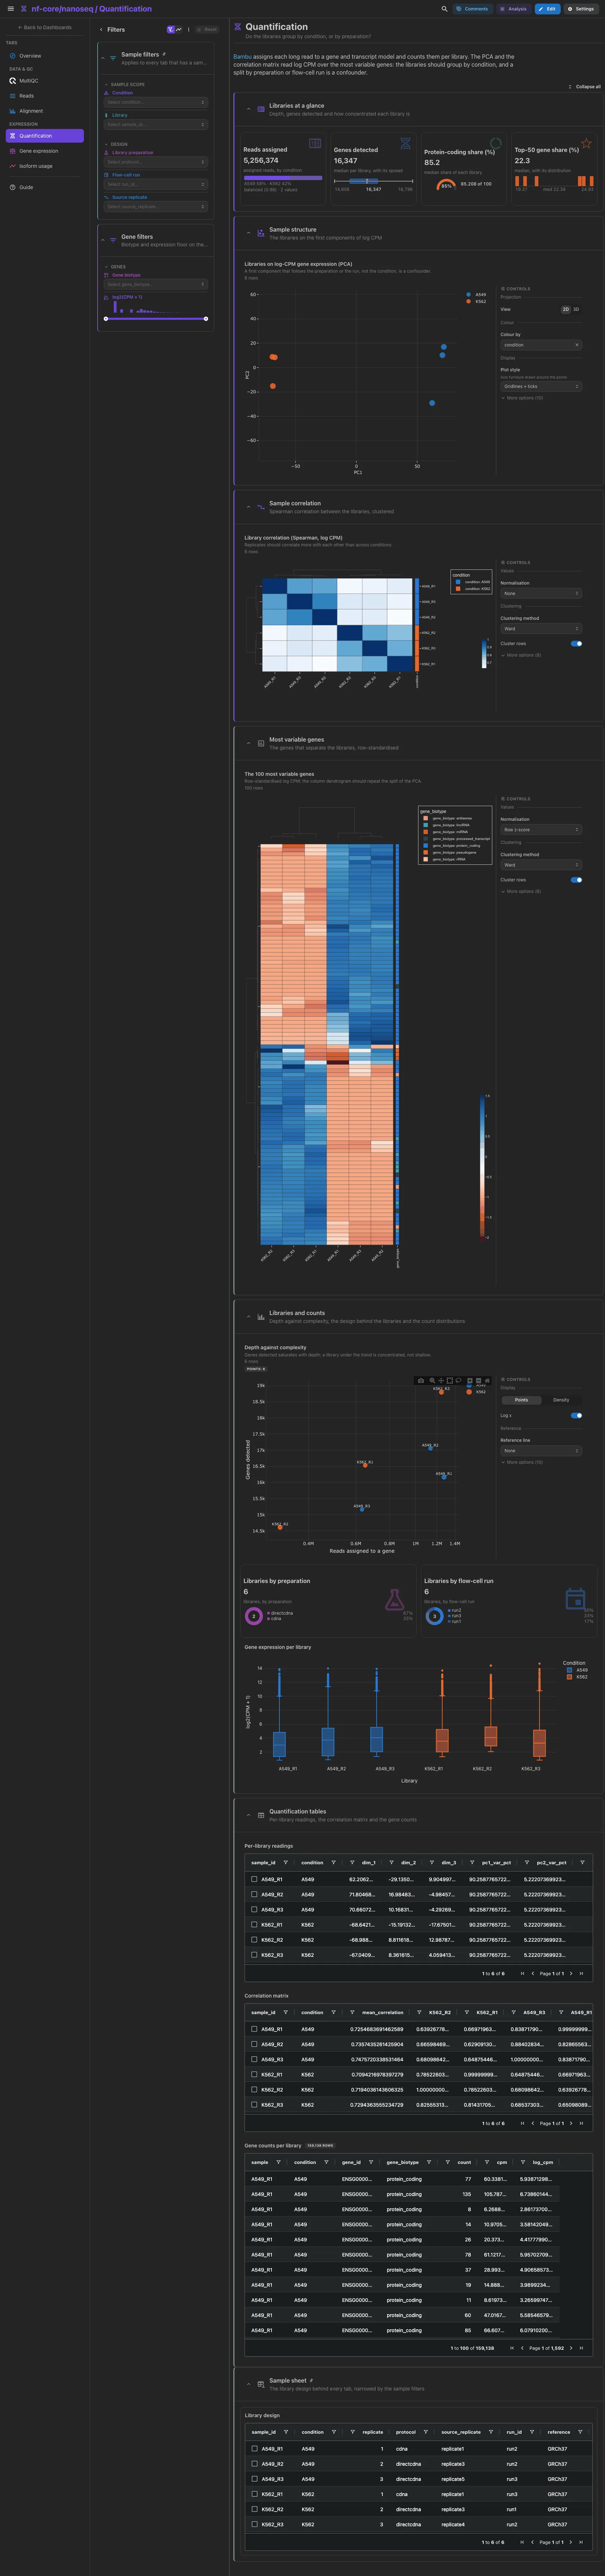
Bambu's counts per library. The reads assigned by condition, the median genes detected, the median protein-coding share and the median share of the 50 top genes. Then the PCA on log CPM over the 500 most variable genes and the Spearman correlation heatmap, full width with library ids on both axes. The libraries should group by condition; a split by preparation or flow-cell run is a confounder. Collapsed: the 100 most variable genes, row-standardised; depth against complexity, the libraries by preparation and by flow-cell run and the gene expression per library; then the tables.
Filters and components
Filters · Gene biotype and a log2(CPM + 1) range on
bambu_counts_gene_long; the biotype also narrows the variable-gene
heatmap.
| Section | What it holds |
|---|---|
| Libraries at a glance | 4 cards |
| Sample structure | 1 advanced visualization (PCA) |
| Sample correlation | 1 advanced visualization (heatmap) |
| Most variable genes (collapsed) | 1 advanced visualization (heatmap) |
| Libraries and counts (collapsed) | 1 advanced visualization (depth against complexity), 2 cards, Gene expression per library |
| Quantification tables (collapsed) | Per-library readings, Correlation matrix, Gene counts per library |
Expression · Which genes differ between the two conditions?
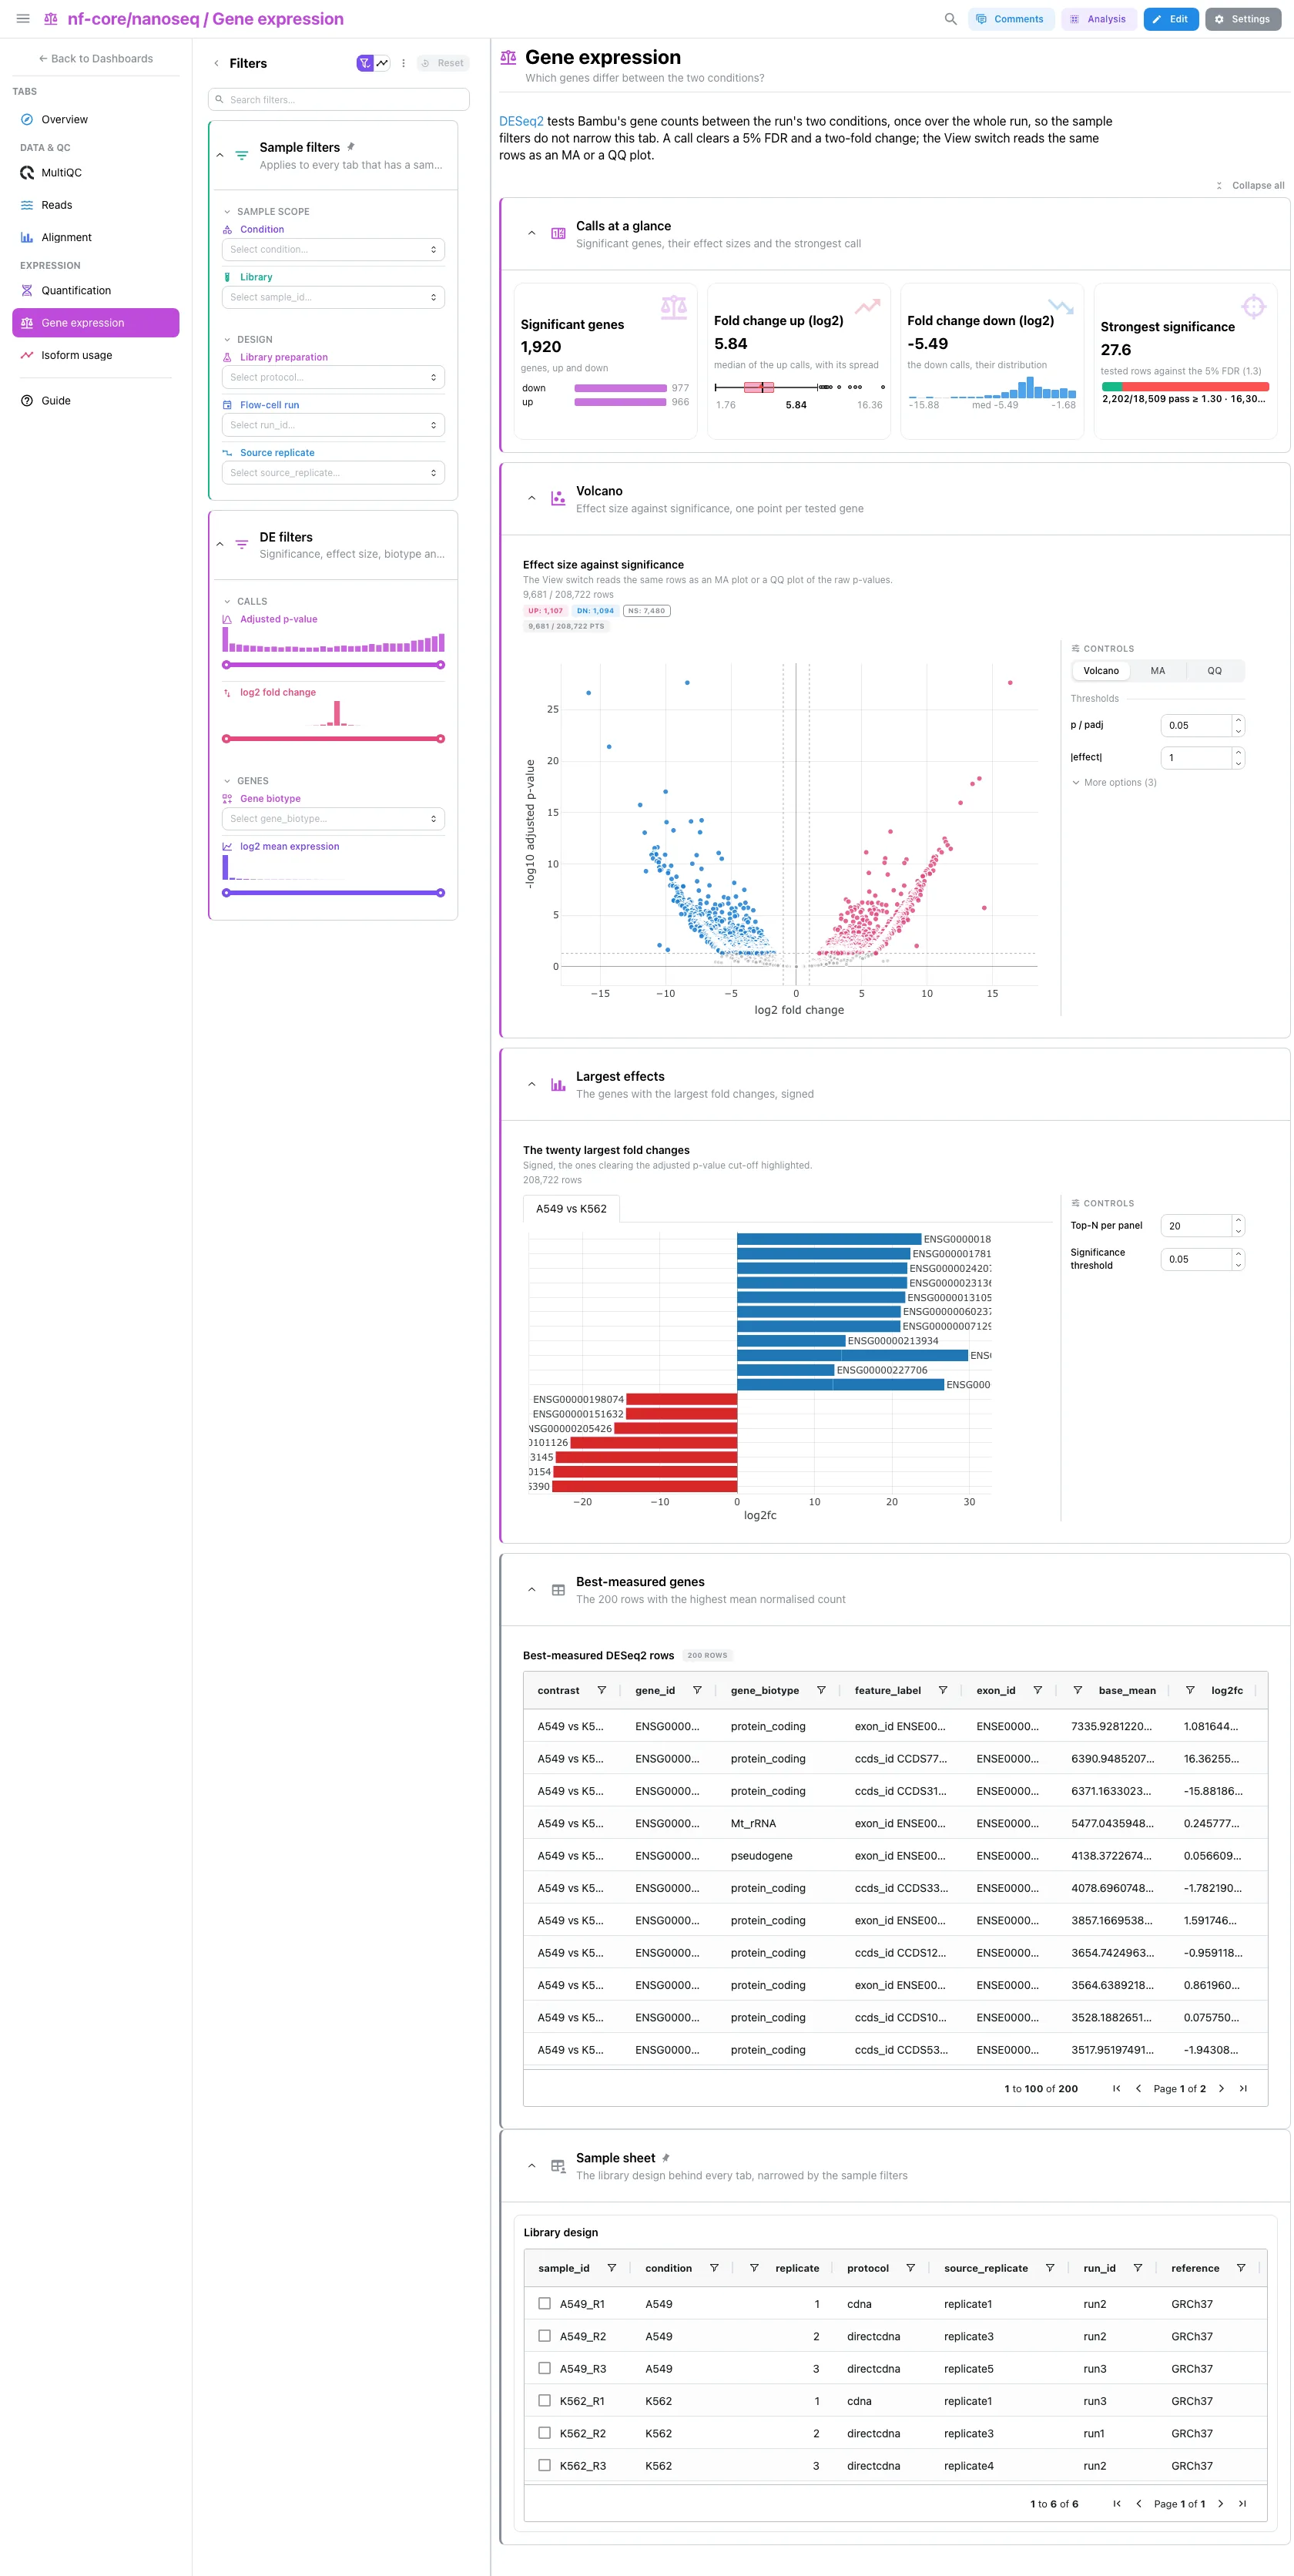
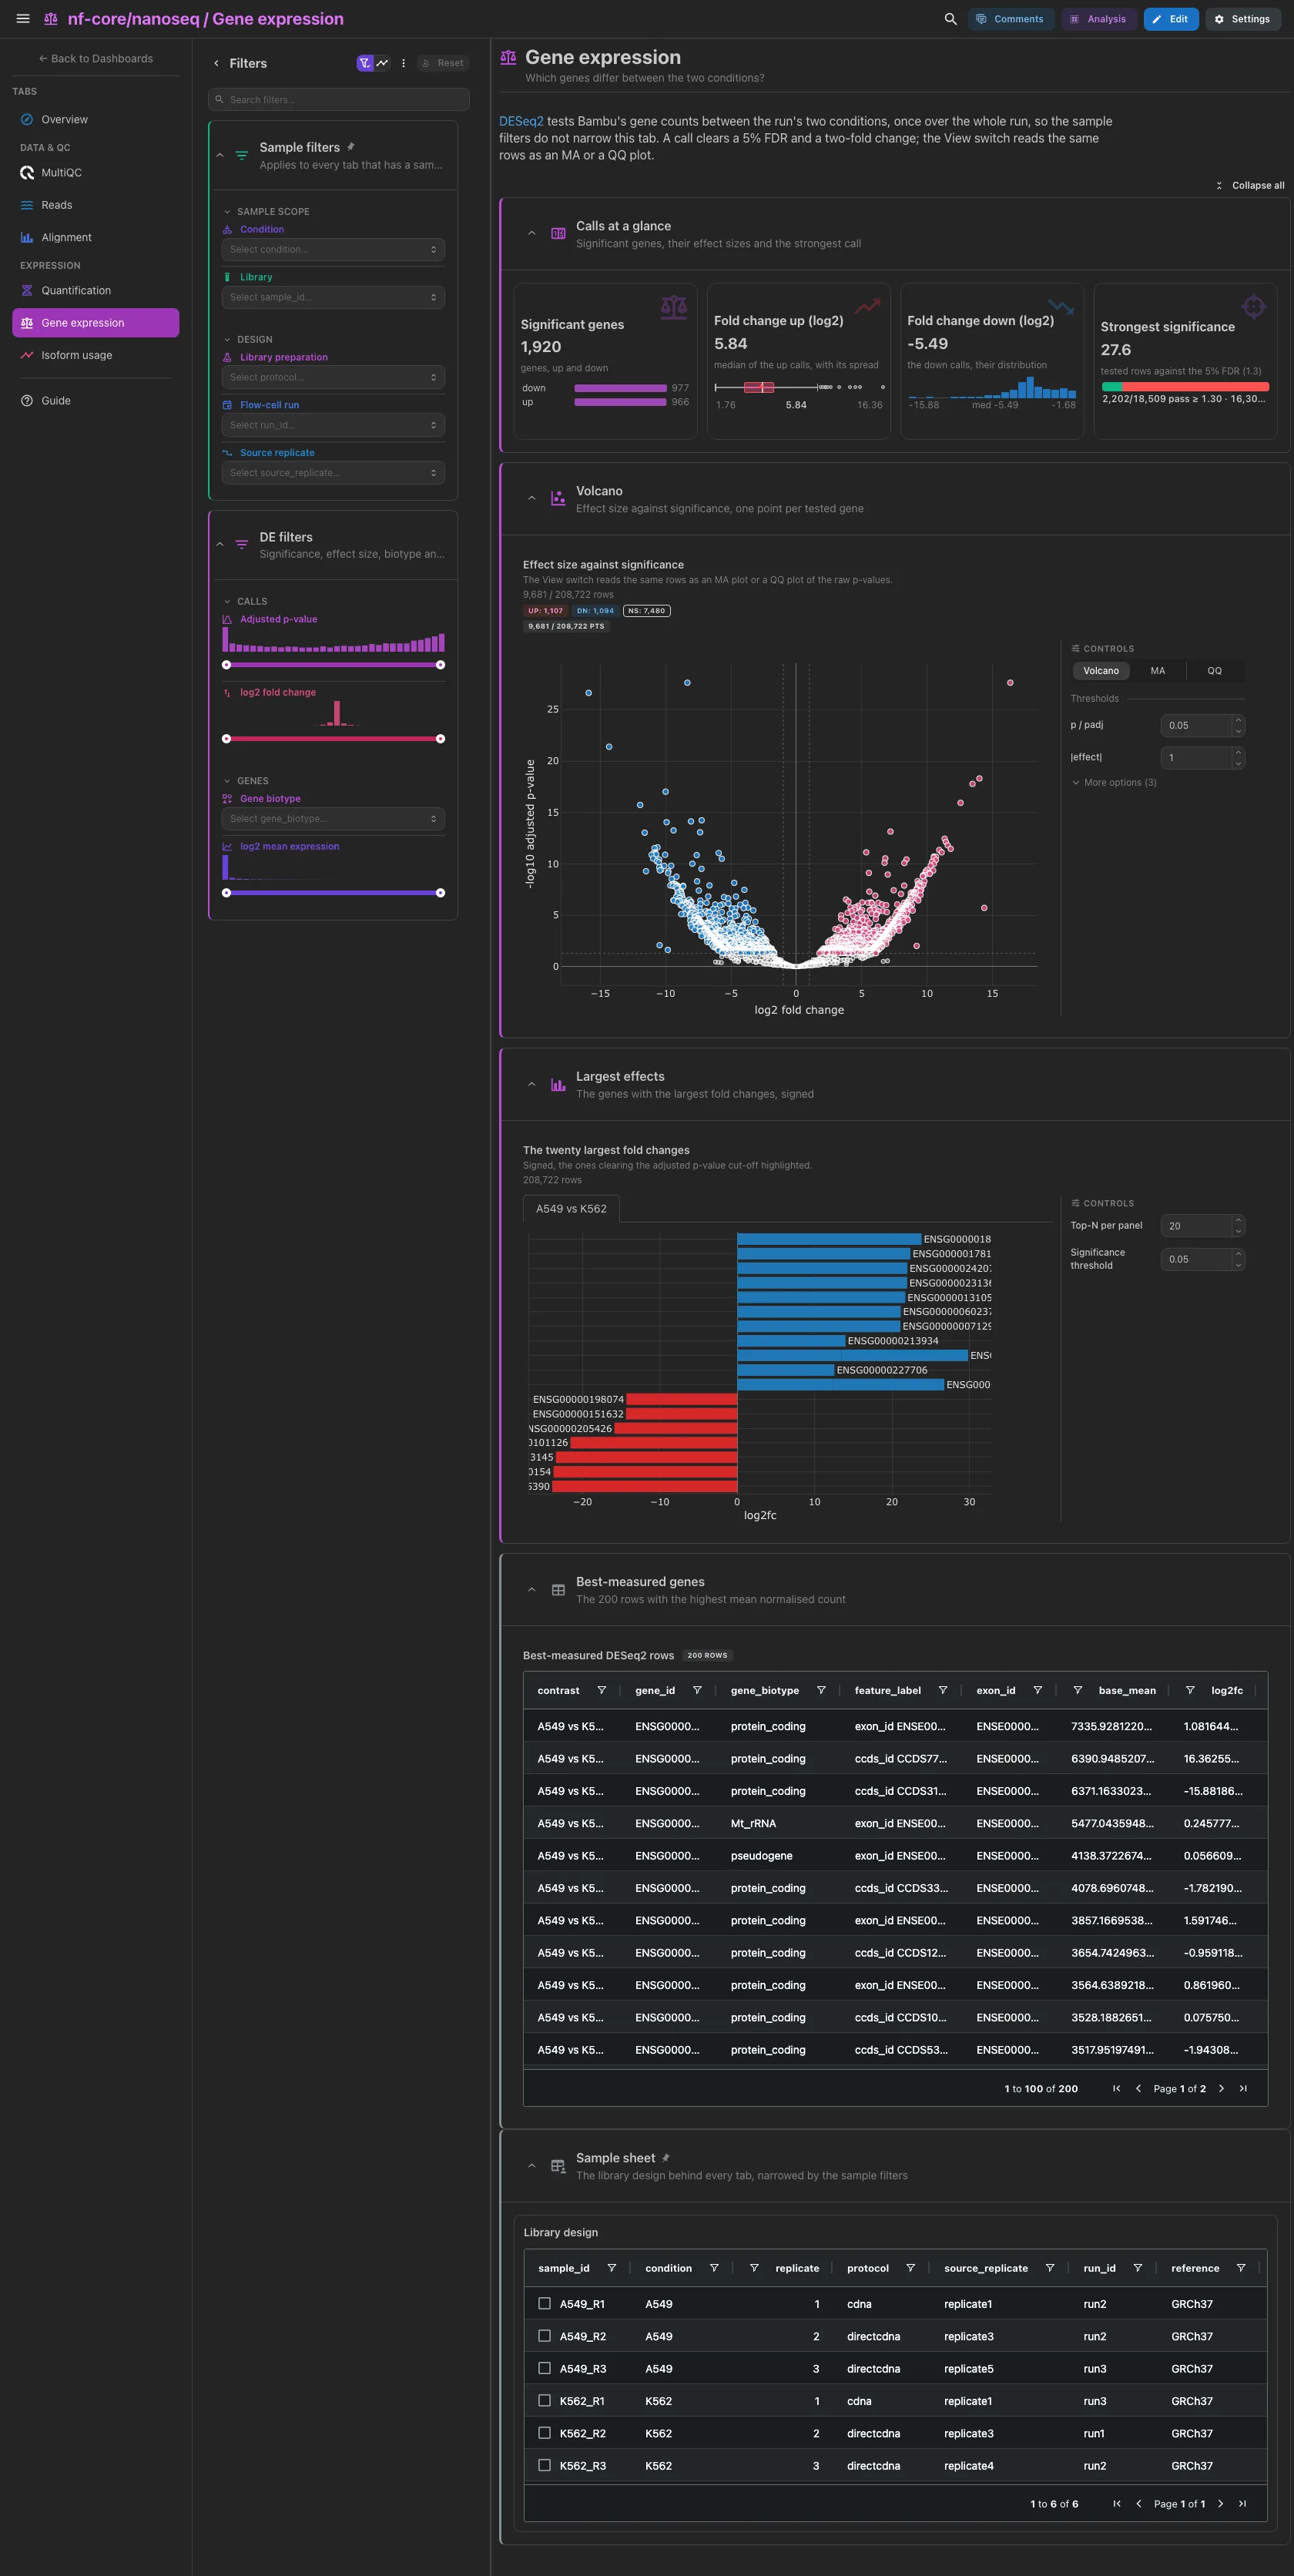
DESeq2 on Bambu's gene counts, once over the whole run, so the sample filters do not narrow this tab. The significant genes, ranked up and down, the median log2 fold change of the up calls and of the down calls, each on its own card so neither cancels the other, and the strongest significance against the 5% FDR. Then one tile with three views of the same rows, switched from its View control: the volcano, an MA plot from the mean expression and a QQ plot of the raw p-values, without point labels (the labels are Ensembl ids). The twenty largest fold changes follow, signed. The 200 best-measured rows are collapsed.
Filters and components
Filters · Adjusted p-value, log2 fold change and log2 mean
expression ranges and Gene biotype, all on deseq2_results. There is
no direction filter: it would empty one of the two direction cards.
| Section | What it holds |
|---|---|
| Calls at a glance | 4 cards |
| Volcano | 1 advanced visualization with volcano, MA and QQ views |
| Largest effects | 1 advanced visualization |
| Best-measured genes (collapsed) | Best-measured DESeq2 rows |
Expression · Which transcripts change their share of their gene?
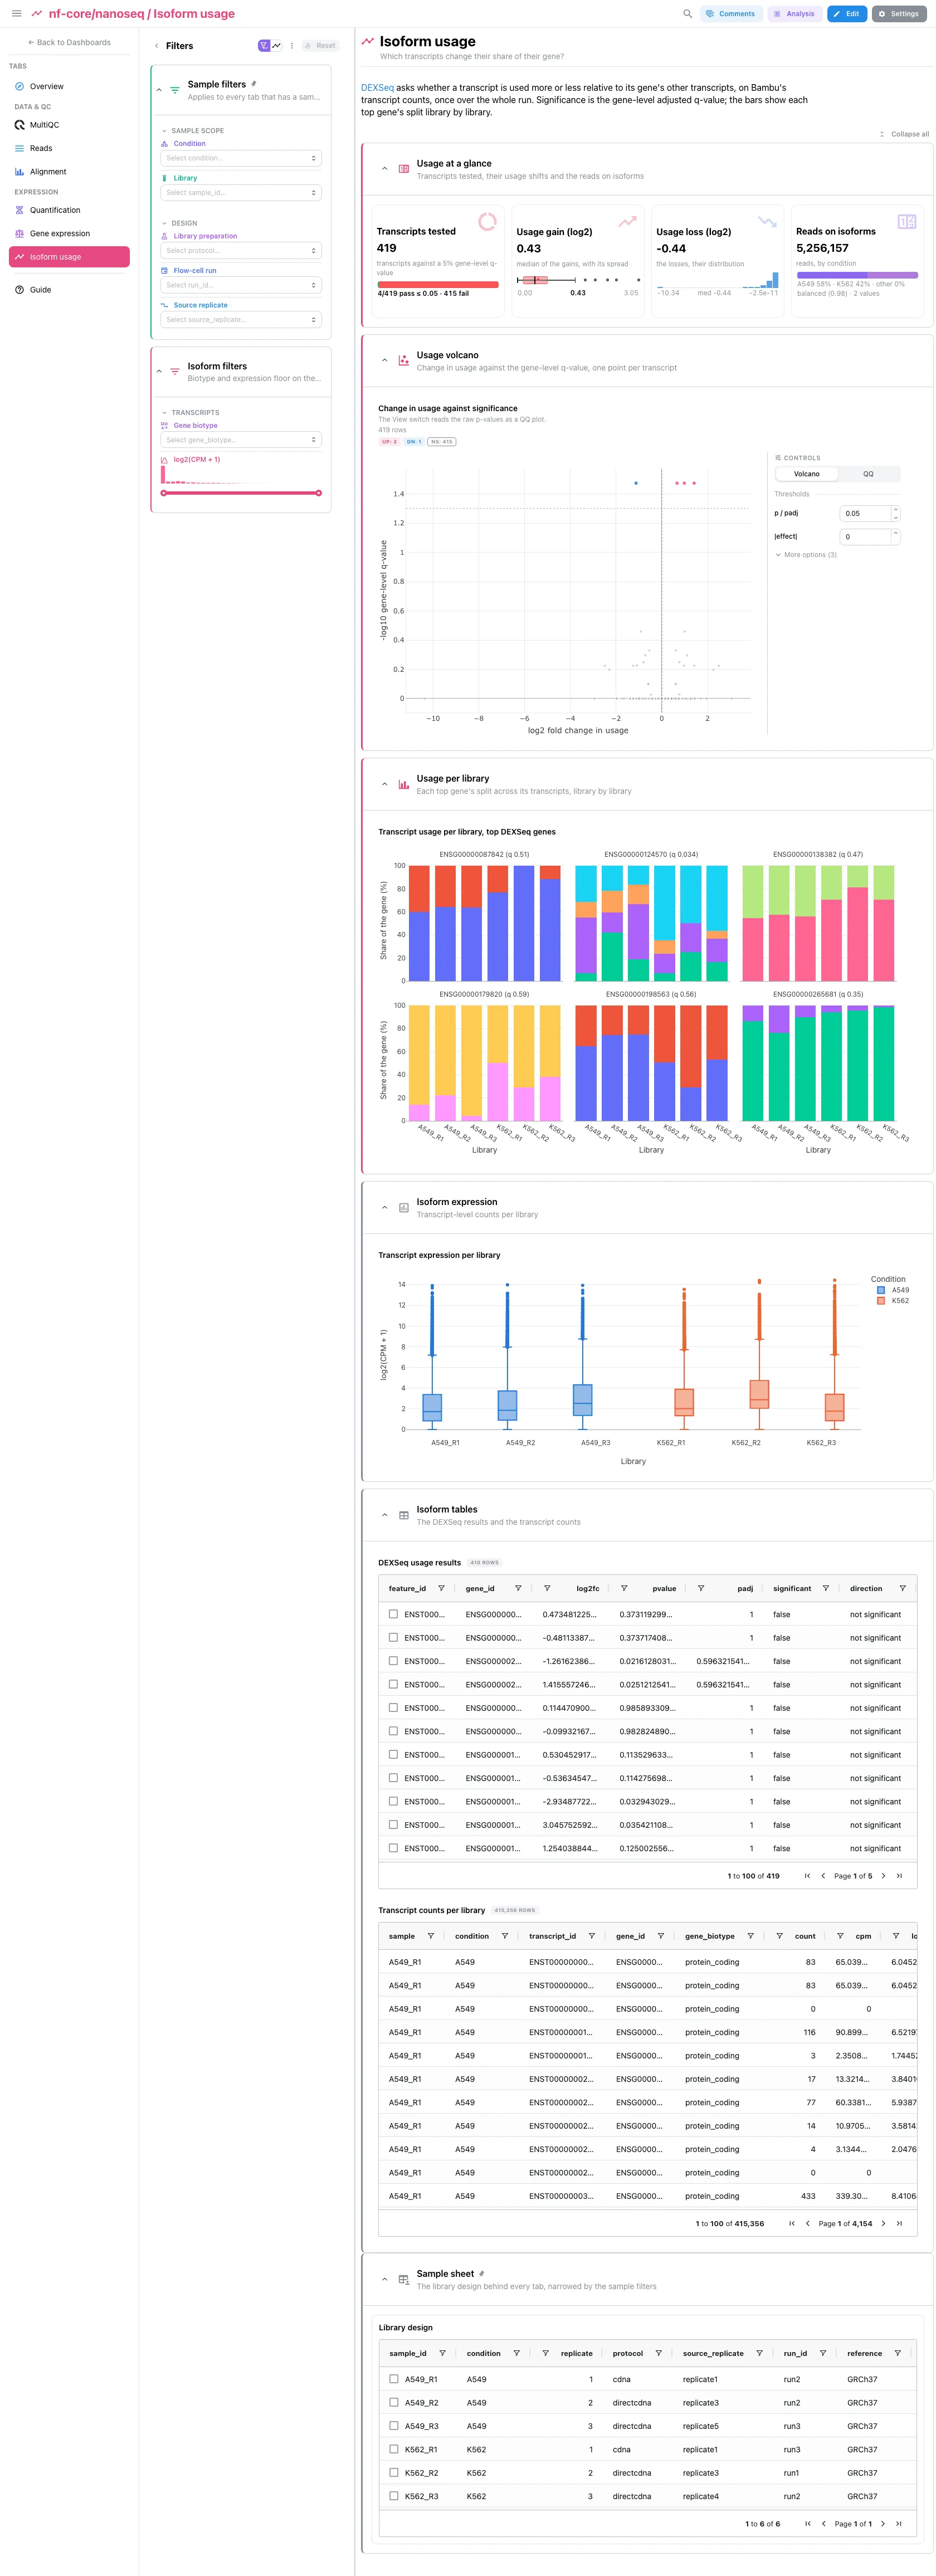
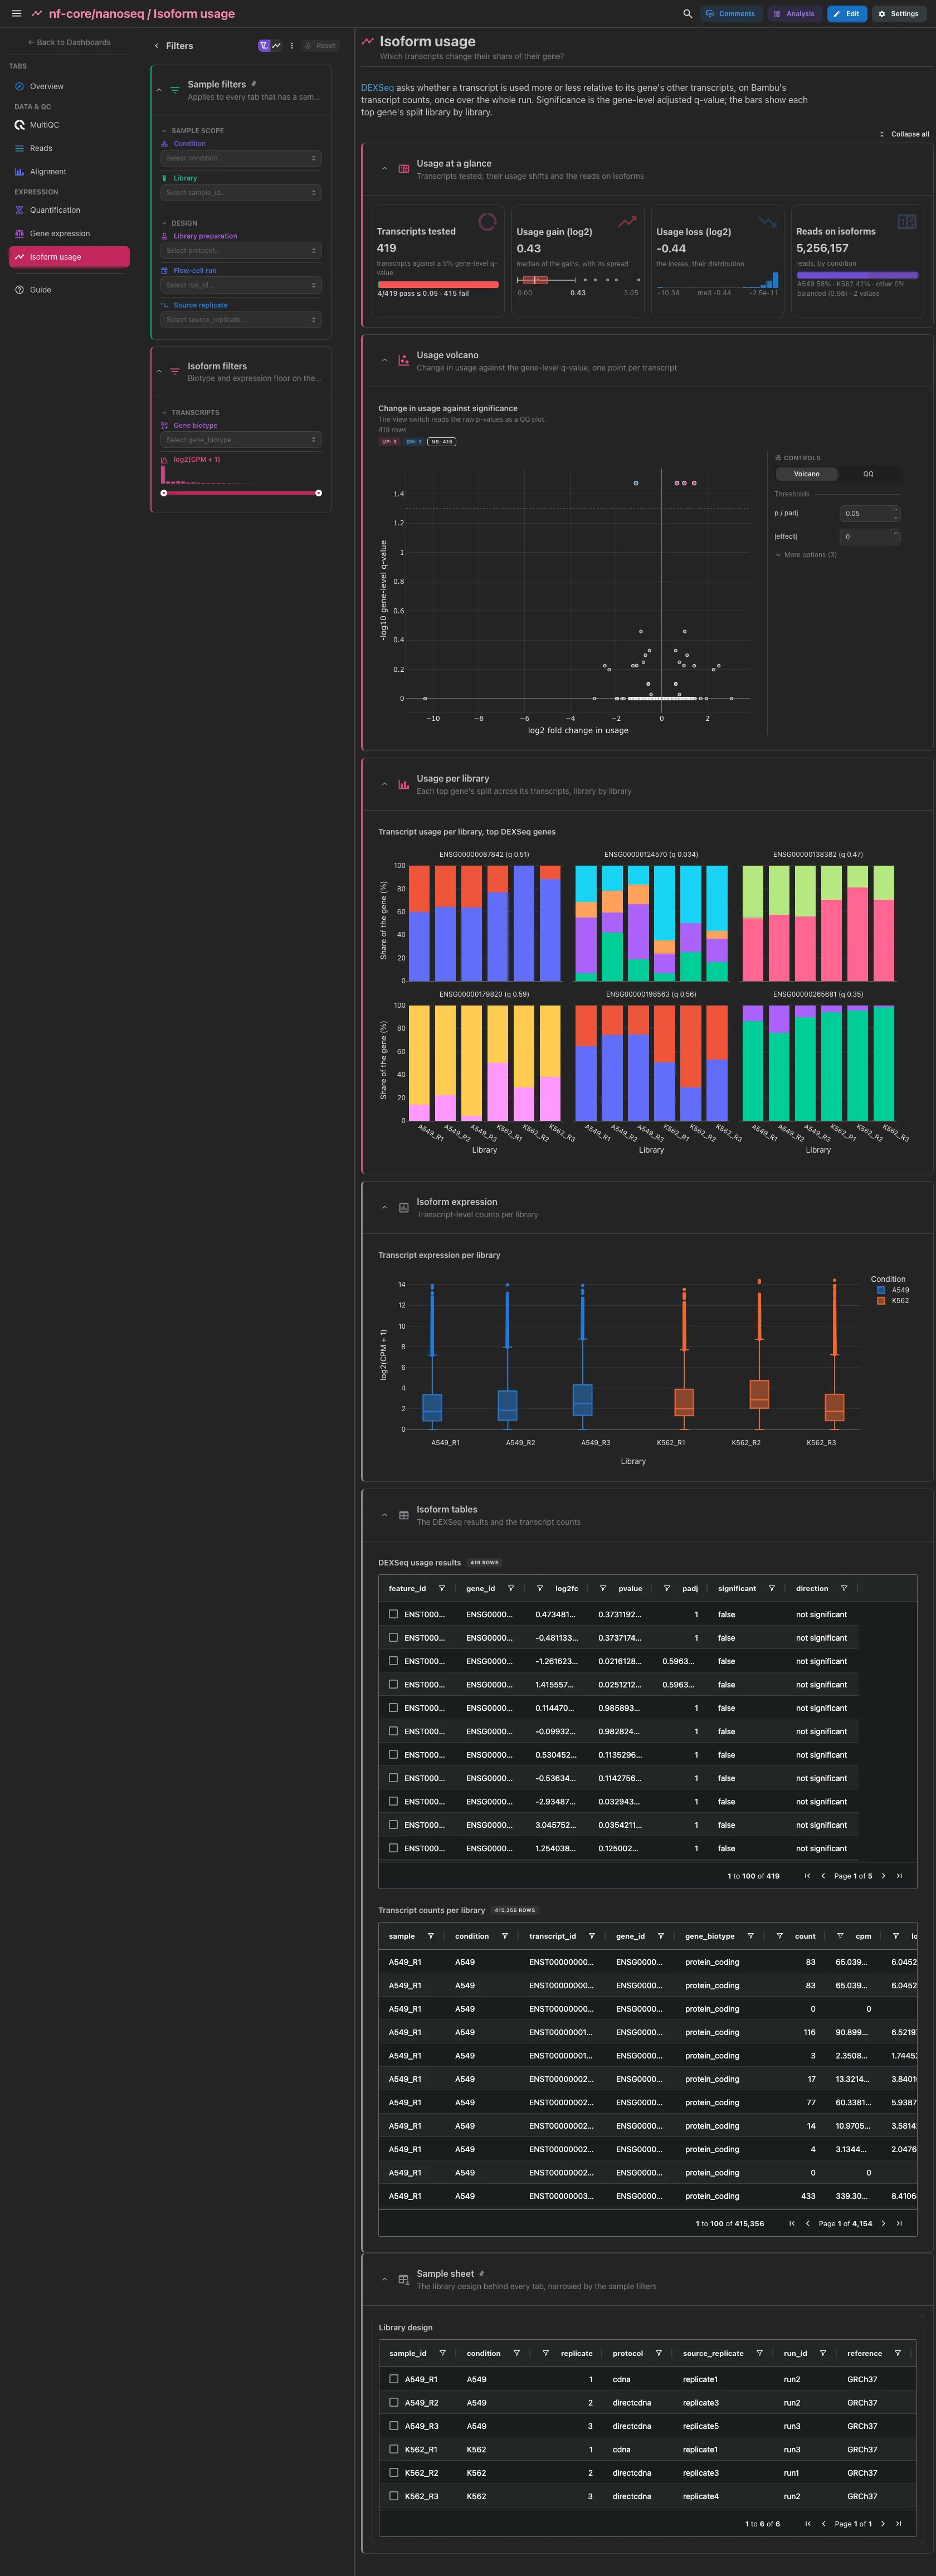
DEXSeq on Bambu's transcript counts: whether a transcript is used more or less relative to its gene's other transcripts, once over the whole run. The transcripts tested against a 5% gene-level q-value, the median usage gain and the median usage loss, each on its own card, and the reads on isoforms by condition. Then the change in usage against the gene-level q-value, with a QQ view and no MA view (DEXSeq writes no mean intensity), and the per-library transcript shares of the top DEXSeq genes, each bar summing to 100% of its gene's reads. The transcript expression per library, the isoform structures and the tables are collapsed.
Filters and components
Filters · Gene biotype and a log2(CPM + 1) range on
bambu_counts_transcript_long.
| Section | What it holds |
|---|---|
| Usage at a glance | 4 cards |
| Usage volcano | 1 advanced visualization with volcano and QQ views |
| Usage per library | Transcript usage per library, top DEXSeq genes |
| Isoform expression (collapsed) | Transcript expression per library |
| Isoform structures (collapsed) | 1 advanced visualization |
| Isoform tables (collapsed) | DEXSeq usage results, Transcript counts per library |
The isoform structures need Bambu's extended annotation
The isoform lane view reads bambu/extended_annotations.gtf, which a
quantification-only run does not write; without it the view is dropped.
nanoseq publishes no splice-junction table, so there is no sashimi view.
Every per-library plot (length against quality, the ladders, the coverage, indel
and read-length curves, the PCA, depth against complexity) and every per-library
table selects on the library, which the sample hub links to every sample-keyed
collection, so a pick narrows the rest of the tab. The length against quality
scatter drives the library record card, which waits for a pick. The DEXSeq usage
table selects on feature_id, which narrows the other tiles of dexseq_results.
The gene and transcript count tables and the DESeq2 table do not select: their
feature ids link to no other collection.
Running the pipeline
Depictio reads the output of nf-core/nanoseq, it does not run the pipeline. Run the pipeline first:
nextflow run nf-core/nanoseq -r 3.0.0 \
  --input samplesheet.csv \
  --protocol cDNA \
  --quantification_method bambu \
  --outdir results -profile docker
Then regenerate the MultiQC report as a parquet and point Depictio at the results:
python -m depictio.dev_scripts.multiqc_reprocess --src results/ --dest results/
depictio ingest results/ --template nf-core/nanoseq/latest
DESeq2 and DEXSeq need at least two conditions in the samplesheet; a run with one condition leaves the Gene expression and Isoform usage tabs empty. See nf-co.re/nanoseq/usage for full pipeline documentation.
Required data structure
Point depictio ingest at the directory holding the pipeline output. Depictio scans
recursively and matches on file name, so the DESeq2 and DEXSeq tables are found
under bambu/ or stringtie2/ alike.
<DATA_ROOT>/
├── pipeline_info/
│   ├── samplesheet.valid.csv            # the hub: one row per library
│   └── software_versions.yml
├── multiqc/multiqc_data/
│   └── multiqc.parquet                  # written by the reprocess step
├── fastqc/*.zip                         # raw MultiQC inputs
├── nanoplot/fastq/<sample>/
│   └── *NanoStats.txt                   # length and quality summary
├── minimap2/samtools_stats/
│   └── *.bam.{stats,flagstat,idxstats}
├── bambu/
│   ├── counts_gene.txt                  # feature x sample matrices
│   ├── counts_transcript.txt
│   ├── extended_annotations.gtf         # optional: isoform lanes
│   ├── deseq2/deseq2.results.txt
│   └── dexseq/dexseq.results.txt
└── input/sample_metadata.tsv            # optional: METADATA_FILE, anywhere you like
Validation runs
The template was validated against the AWS megatest of the 3.0.0 release,
results-1e60482a2c4621234393a6eef8e9a104309c20ae: the SG-NEx A549 and K562
cell lines, direct cDNA and cDNA libraries, three replicates each. That run
writes no pycoQC, fusion or variant-calling outputs, so the template reads none.
Its design table is vendored in the template as input/sample_metadata.tsv,
and the screenshots above come from that run:
bash depictio/projects/nf-core/nanoseq/3.0.0/download_test_data.sh /tmp/nanoseq_test
python -m depictio.dev_scripts.multiqc_reprocess --src /tmp/nanoseq_test --dest /tmp/nanoseq_test
mkdir -p /tmp/nanoseq_test/input
cp depictio/projects/nf-core/nanoseq/3.0.0/input/sample_metadata.tsv /tmp/nanoseq_test/input/
depictio ingest /tmp/nanoseq_test --template nf-core/nanoseq/latest \
  --var METADATA_FILE=/tmp/nanoseq_test/input/sample_metadata.tsv
Do not pass --project when ingesting: the dashboard is attached to the
project by name, so renaming it breaks a later depictio dashboard import.
Re-ingesting accumulates dashboards, so delete the project before repeating a run.
Additional resources
- nf-co.re/nanoseq: official pipeline documentation
- nf-co.re/nanoseq/3.0.0/results: AWS test results
- Template System Reference: YAML format, variables, conditionals
- Recipes: how to read, test, and write recipes
Authorship
 weber8thomas
Reviewing a template on your own data, or taking over a role here, is a contribution in itself: the contributing guide says what each one involves.