

The methylseq template follows the Bismark route of an nf-core/methylseq run from the reads to the windows whose methylation differs between groups:
- Overview: the run in four key figures, live findings and four figures, each linked to the tab that explains it
- Data & QC: FastQC, Cutadapt, Bismark and Qualimap panels from the regenerated MultiQC report, the libraries that fail the alignment, duplication or conversion floors, and how deep and how evenly the alignments cover the reference
- Methylome: whether the extraction needs a read-position trim, whether each methylome is bimodal, whether the libraries group by the design, and the windows that differ between two groups
The persistent Sample filters (the design factor, then the sample id) sit in the
left panel and narrow every tab through the project links, and the collapsed
Sample sheet is pinned to the bottom of every child tab.
The MultiQC report must be regenerated
methylseq 2.3.0 ships MultiQC 1.13, which writes no parquet, and Depictio
reads only multiqc.parquet (MultiQC 1.31 and later). Re-run MultiQC over
the run's own tool outputs before ingesting, or the MultiQC tab stays empty:
Bismark route only
methylseq also publishes bismark_hisat/ and bwameth/ routes. This template
covers the default bismark/ route; its file patterns match any
bismark_<aligner> suffix, so the sample ids parse the same way on the
hisat2 route.
The design is a table beside the run
The methylseq samplesheet carries no design column, and the template never
parses one out of sample names. Pass a design table with METADATA_FILE:
without it there is no group to filter or colour by, and the window
comparison is pruned, leaving the Group comparison tab with only the
per-library lanes of its collapsed locus section.
Quick start
depictio ingest /path/to/methylseq_results \
  --template nf-core/methylseq/latest \
  --var METADATA_FILE=/path/to/design.tsv \
  --var GENOME=hg38
The sample hub reads input/samplesheet_full.csv under the data root. The
variables:
| Variable | Default | What it does |
|---|---|---|
METADATA_FILE |
none | Design table (TSV): sample id in a sample column or the first column, one column per factor |
METADATA_ID_COL |
first column | The design table's sample-id column |
GROUP_COL |
first factor | The factor the dashboards colour and filter by; the comparison tests it when it has two levels, else the first two-level factor |
GROUP_COL_DISPLAY |
title-cased GROUP_COL |
Label used in titles |
GENOME |
hg38 |
UCSC assembly of the locus tracks (contig axis and region search) |
depictio config nextflow --install     # once per machine
nextflow run nf-core/methylseq -r 2.3.0 -profile docker --outdir results
No depictio ingest, and no template named: the pipeline ingests its own
output directory when it finishes and resolves this template from its own
manifest. Without a METADATA_FILE the window comparison is pruned, and the
MultiQC tab stays empty until the report is regenerated as above. See
Nextflow trigger.
Reference
The template reads the samplesheet and the design table, the regenerated MultiQC
report, Bismark's alignment, deduplication, splitting and M-bias reports and its
per-CpG bedGraphs, and Qualimap BamQC. 68 of its 74 tiles carry a use: catalog
reference (bismark/*, qualimap/*, multiqc/*), and the two comparison tracks
of the locus view name their viz_kind explicitly.
Self-adapting layout
The dashboard adapts to whatever the run actually produced: components bound to pruned or unparsed data collections are hidden, tabs left with no real visualizations are dropped entirely, and the remaining components are re-packed so there are no empty rows.
Template variables
Variables you provide when running the template: DATA_ROOT is the results directory given to depictio ingest, the others are set with --var NAME=value:
| Variable | Required | Description |
|---|---|---|
DATA_ROOT |
✓ | Root directory containing methylseq Bismark-route output (bismark/, fastqc/, trimgalore/, qualimap/, pipeline_info/, input/) plus the reprocessed multiqc/multiqc_data/multiqc.parquet. |
METADATA_FILE |
— | Optional design table (TSV): sample id in a column named sample or in the first column, one column per factor. Enables the design filters and colouring and the window group comparison (on GROUP_COL, else the first two-level factor). |
METADATA_ID_COL |
— | Design table sample-id column. Auto-detected as the first column. |
GROUP_COL |
— | Design column the dashboards group, colour and filter by. Auto-detected as the first factor column of METADATA_FILE. The window group comparison tests it when it has exactly two levels. |
GENOME |
— | UCSC assembly name of the reference the run aligned to, used by the locus tracks' gene annotation and region search. |
Auto-detected (set from the run's metadata / params.json; the route flags drive Conditional routes below): GROUP_COL_DISPLAY, ANNOTATION_COLS
Data collections
29 data collections — 27 required 2 optional · 12 direct 17 derived.
Origin tells you whether a collection is real pipeline data or a reshape of it: direct = a pipeline output (scanned, or a recipe that reads raw files); derived = a recipe that reshapes one or more direct collections into the layout a visualization needs (no new measurement). Reads shows what produces it: a recipe .py transform, whose name links to its source on GitHub, or a raw file scanned off disk. (A direct collection can still have a recipe — one that merely parses/cleans the raw file; derived means the recipe reshapes another collection.)
| Tag | Origin | Type | Reads | Status |
|---|---|---|---|---|
metadata |
direct | Table | file {METADATA_FILE} |
optional |
samples |
derived | Table | recipe nf-core/methylseq/samples.py |
required |
samplesheet |
direct | Table | file samplesheet_full.csv$ |
required |
multiqc_data |
direct |  MultiQC MultiQC |
file (?:.*/)?multiqc(?:/[^/]+)?/multiqc_data/multiqc.parquet$ |
required |
bismark_alignment_raw |
direct | Table | file .*bismark[a-z0-9]+_(PE|SE)_report.txt$ |
required |
bismark_alignment_summary |
derived | Table | recipe bismark/alignment_summary.py |
required |
bismark_dedup_raw |
direct | Table | file .*.deduplication_report.txt$ |
required |
bismark_deduplication_summary |
derived | Table | recipe bismark/deduplication_summary.py |
required |
bismark_splitting_raw |
direct | Table | file .*_splitting_report.txt$ |
required |
bismark_methylation_context_summary |
derived | Table | recipe bismark/methylation_context_summary.py |
required |
bismark_mbias_raw |
direct | Table | file .*.M-bias.txt$ |
required |
bismark_mbias_curve |
derived | Table | recipe bismark/mbias_curve.py |
required |
bismark_summary_report |
derived | Table | recipe bismark/summary_report.py |
required |
bismark_mbias_all_contexts |
derived | Table | recipe bismark/mbias_all_contexts.py |
required |
bismark_bedgraph_index |
direct | Table | file .*.bedGraph.gz$ |
required |
bismark_binned_methylation |
derived | Table | recipe bismark/binned_methylation.py |
required |
bismark_methylation_density |
derived | Table | recipe bismark/methylation_density.py |
required |
bismark_window_pca |
derived | Table | recipe bismark/window_pca.py |
required |
bismark_window_correlation |
derived | Table | recipe bismark/window_correlation.py |
required |
bismark_top_variable_windows |
derived | Table | recipe bismark/top_variable_windows.py |
required |
bismark_window_group_compare |
derived | Table | recipe bismark/window_group_compare.py |
optional |
qualimap_bamqc_genome_results_raw |
direct | Table | file (?:.*/)?genome_results.txt$ |
required |
qualimap_bamqc_genome_results |
derived | Table | recipe qualimap/bamqc_genome_results.py |
required |
qualimap_coverage_across_reference_raw |
direct | Table | file .*coverage_across_reference.txt$ |
required |
qualimap_coverage_across_reference |
derived | Table | recipe qualimap/coverage_across_reference.py |
required |
qualimap_coverage_histogram_raw |
direct | Table | file .*coverage_histogram.txt$ |
required |
qualimap_coverage_histogram |
derived | Table | recipe qualimap/coverage_histogram.py |
required |
qualimap_genome_fraction_coverage_raw |
direct | Table | file .*genome_fraction_coverage.txt$ |
required |
qualimap_genome_fraction_coverage |
derived | Table | recipe qualimap/genome_fraction_coverage.py |
required |
Conditional routes
Rows are data collections; columns are the variables you set or params.json flags auto-detected from the run. Each filled cell is the effect of setting that variable; an empty cell means that variable leaves the collection unchanged. (27 collections are unaffected by any variable — present on every run.)
+ included− removed⇄ repointed
| Data collection | METADATA_FILE |
|---|---|
metadata |
+ |
bismark_window_group_compare |
+ |
Cross-DC links
16 links — selecting a value in the source collection filters the target. The join column is shown after the source.
| Source · column | Target | Filters | |
|---|---|---|---|
samples · sample_id |
→ | multiqc_data |
Filter the MultiQC panels by the samples picked in the left panel |
samples · sample_id |
→ | bismark_alignment_summary |
Filter the alignment summary by the samples picked in the left panel |
samples · sample_id |
→ | bismark_deduplication_summary |
Filter the deduplication summary by the samples picked in the left panel |
samples · sample_id |
→ | bismark_methylation_context_summary |
Filter the per-context methylation summary by the samples picked in the left panel |
samples · sample_id |
→ | bismark_mbias_curve |
Filter the M-bias curves by the samples picked in the left panel |
samples · sample_id |
→ | bismark_summary_report |
Filter the run summary by the samples picked in the left panel |
samples · sample_id |
→ | bismark_mbias_all_contexts |
Filter the per-context M-bias curves by the samples picked in the left panel |
samples · sample_id |
→ | bismark_binned_methylation |
Filter the binned methylation track by the samples picked in the left panel |
samples · sample_id |
→ | bismark_methylation_density |
Filter the per-CpG methylation density curves by the samples picked in the left panel |
samples · sample_id |
→ | bismark_window_pca |
Filter the library PCA by the samples picked in the left panel |
samples · sample_id |
→ | qualimap_bamqc_genome_results |
Filter the Qualimap BamQC summary by the samples picked in the left panel |
samples · sample_id |
→ | qualimap_coverage_across_reference |
Filter the depth track by the samples picked in the left panel |
samples · sample_id |
→ | qualimap_coverage_histogram |
Filter the depth histogram by the samples picked in the left panel |
samples · sample_id |
→ | qualimap_genome_fraction_coverage |
Filter the genome-fraction curves by the samples picked in the left panel |
samples · sample_id |
→ | bismark_window_correlation |
Filter the window-correlation matrix rows by the samples picked in the left panel |
bismark_window_group_compare · chromosome |
→ | bismark_binned_methylation |
A region brushed or typed on the group-comparison navigator narrows the binned per-library windows |
Recipes
Each recipe reshapes raw pipeline output into a tidy table. The name links to its source; Output lists the validated OUTPUT_SCHEMA columns.
| Recipe | Transforms | Output |
|---|---|---|
bismark/alignment_summary.py |
Per-sample Bismark alignment summary, one row per library. | sample, pairs_analysed, unique_best_hit, mapping_efficiency_pct, no_alignment, not_unique |
bismark/binned_methylation.py |
Genome-wide CpG methylation in fixed windows, one row per sample per window. | sample, chromosome, start, end, position, methylation_pct, n_cpg, cpg_density_class |
bismark/deduplication_summary.py |
Per-sample Bismark deduplication summary, one row per library. | sample, total_alignments, duplicates_removed, pct_duplication, leftover_sequences |
bismark/mbias_all_contexts.py |
M-bias in all three cytosine contexts, read 1 and read 2, one long frame. | sample, context, read, series, position, pct_methylation, coverage |
bismark/mbias_curve.py |
CpG M-bias curve, one row per sample x read x position. | sample, read, series, position, pct_methylation, coverage |
bismark/methylation_context_summary.py |
Per-sample, per-context methylation summary, long format (one row per | sample, context, methylated_c, unmethylated_c, pct_methylated |
bismark/methylation_density.py |
Distribution of per-CpG methylation, one curve per library. | sample, series, methylation_bin, n_cpgs, fraction_of_cpgs |
bismark/summary_report.py |
Bismark's own run-level summary table, one row per library. | sample, total_reads, aligned_reads, unaligned_reads, ambiguous_reads, duplicate_reads, unique_reads, total_cs, methylated_cpg, unmethylated_cpg, methylated_chg, unmethylated_chg, methylated_chh, unmethylated_chh, cpgs_called, pct_aligned, pct_duplicate, pct_cpg_methylation, pct_chg_methylation, pct_chh_methylation, conversion_efficiency_pct |
bismark/top_variable_windows.py |
The windows whose methylation moves most across the cohort. | window_id, chromosome, window_variance |
bismark/window_correlation.py |
Pairwise correlation of the libraries over their binned methylomes. | sample |
bismark/window_group_compare.py |
Window-by-window methylation comparison between the run's two groups. | window_id, chromosome, position, start, end, group_a, group_b, mean_a, mean_b, delta_methylation, t_statistic, p_value, padj, neg_log10_padj, direction, n_cpg_min |
bismark/window_pca.py |
Where each library sits in the space of its own binned methylome. | sample_id, dim_1, dim_2, dim_3 |
nf-core/methylseq/samples.py |
One row per methylseq sample: the samplesheet, joined to the run's design. | sample_id, fastq_1, fastq_2 |
qualimap/bamqc_genome_results.py |
One row per sample from a Qualimap BamQC genome_results.txt report. |
sample, total_reads, mapped_reads, percentage_aligned, mean_coverage, mean_mapping_quality, general_error_rate, gc_percentage, duplication_rate |
qualimap/coverage_across_reference.py |
Read depth along the reference, from Qualimap BamQC's own windowed table. | sample, chromosome, position, coverage, coverage_std, global_position |
qualimap/coverage_histogram.py |
How many bases of the reference sit at each depth, from Qualimap BamQC. | sample, coverage, n_genomic_locations, fraction |
qualimap/genome_fraction_coverage.py |
What share of the reference is covered at least X deep, from Qualimap BamQC. | sample, min_coverage, genome_fraction_pct |
Dashboard tabs
One dashboard: the Overview, then seven child tabs in two groups, read as a funnel from the reads to the windows whose methylation differs between groups. Each tab below carries the same icon and colour the dashboard gives it, so the page and the app read alike.
| Group | Tabs |
|---|---|
| Data & QC | MultiQC, Run QC, Coverage |
| Methylome | Bias and context, Methylation levels, Cohort structure, Group comparison |
Each child tab opens with a short intro and a strip of two to four cards, then at
most three open sections; tables, details and the locus view follow, collapsed.
The design is a table beside the run (METADATA_FILE), and GROUP_COL is the
factor every tab colours and filters by. The persistent Sample filters (the
group, then the sample id, both on the sample hub) sit in the left panel and
narrow every tab through the project links; each tab's own filters sit under them.
The Sample sheet is pinned, collapsed, to the bottom of every child tab.
Bisulfite methylomes, from read QC to the windows that differ between groups.
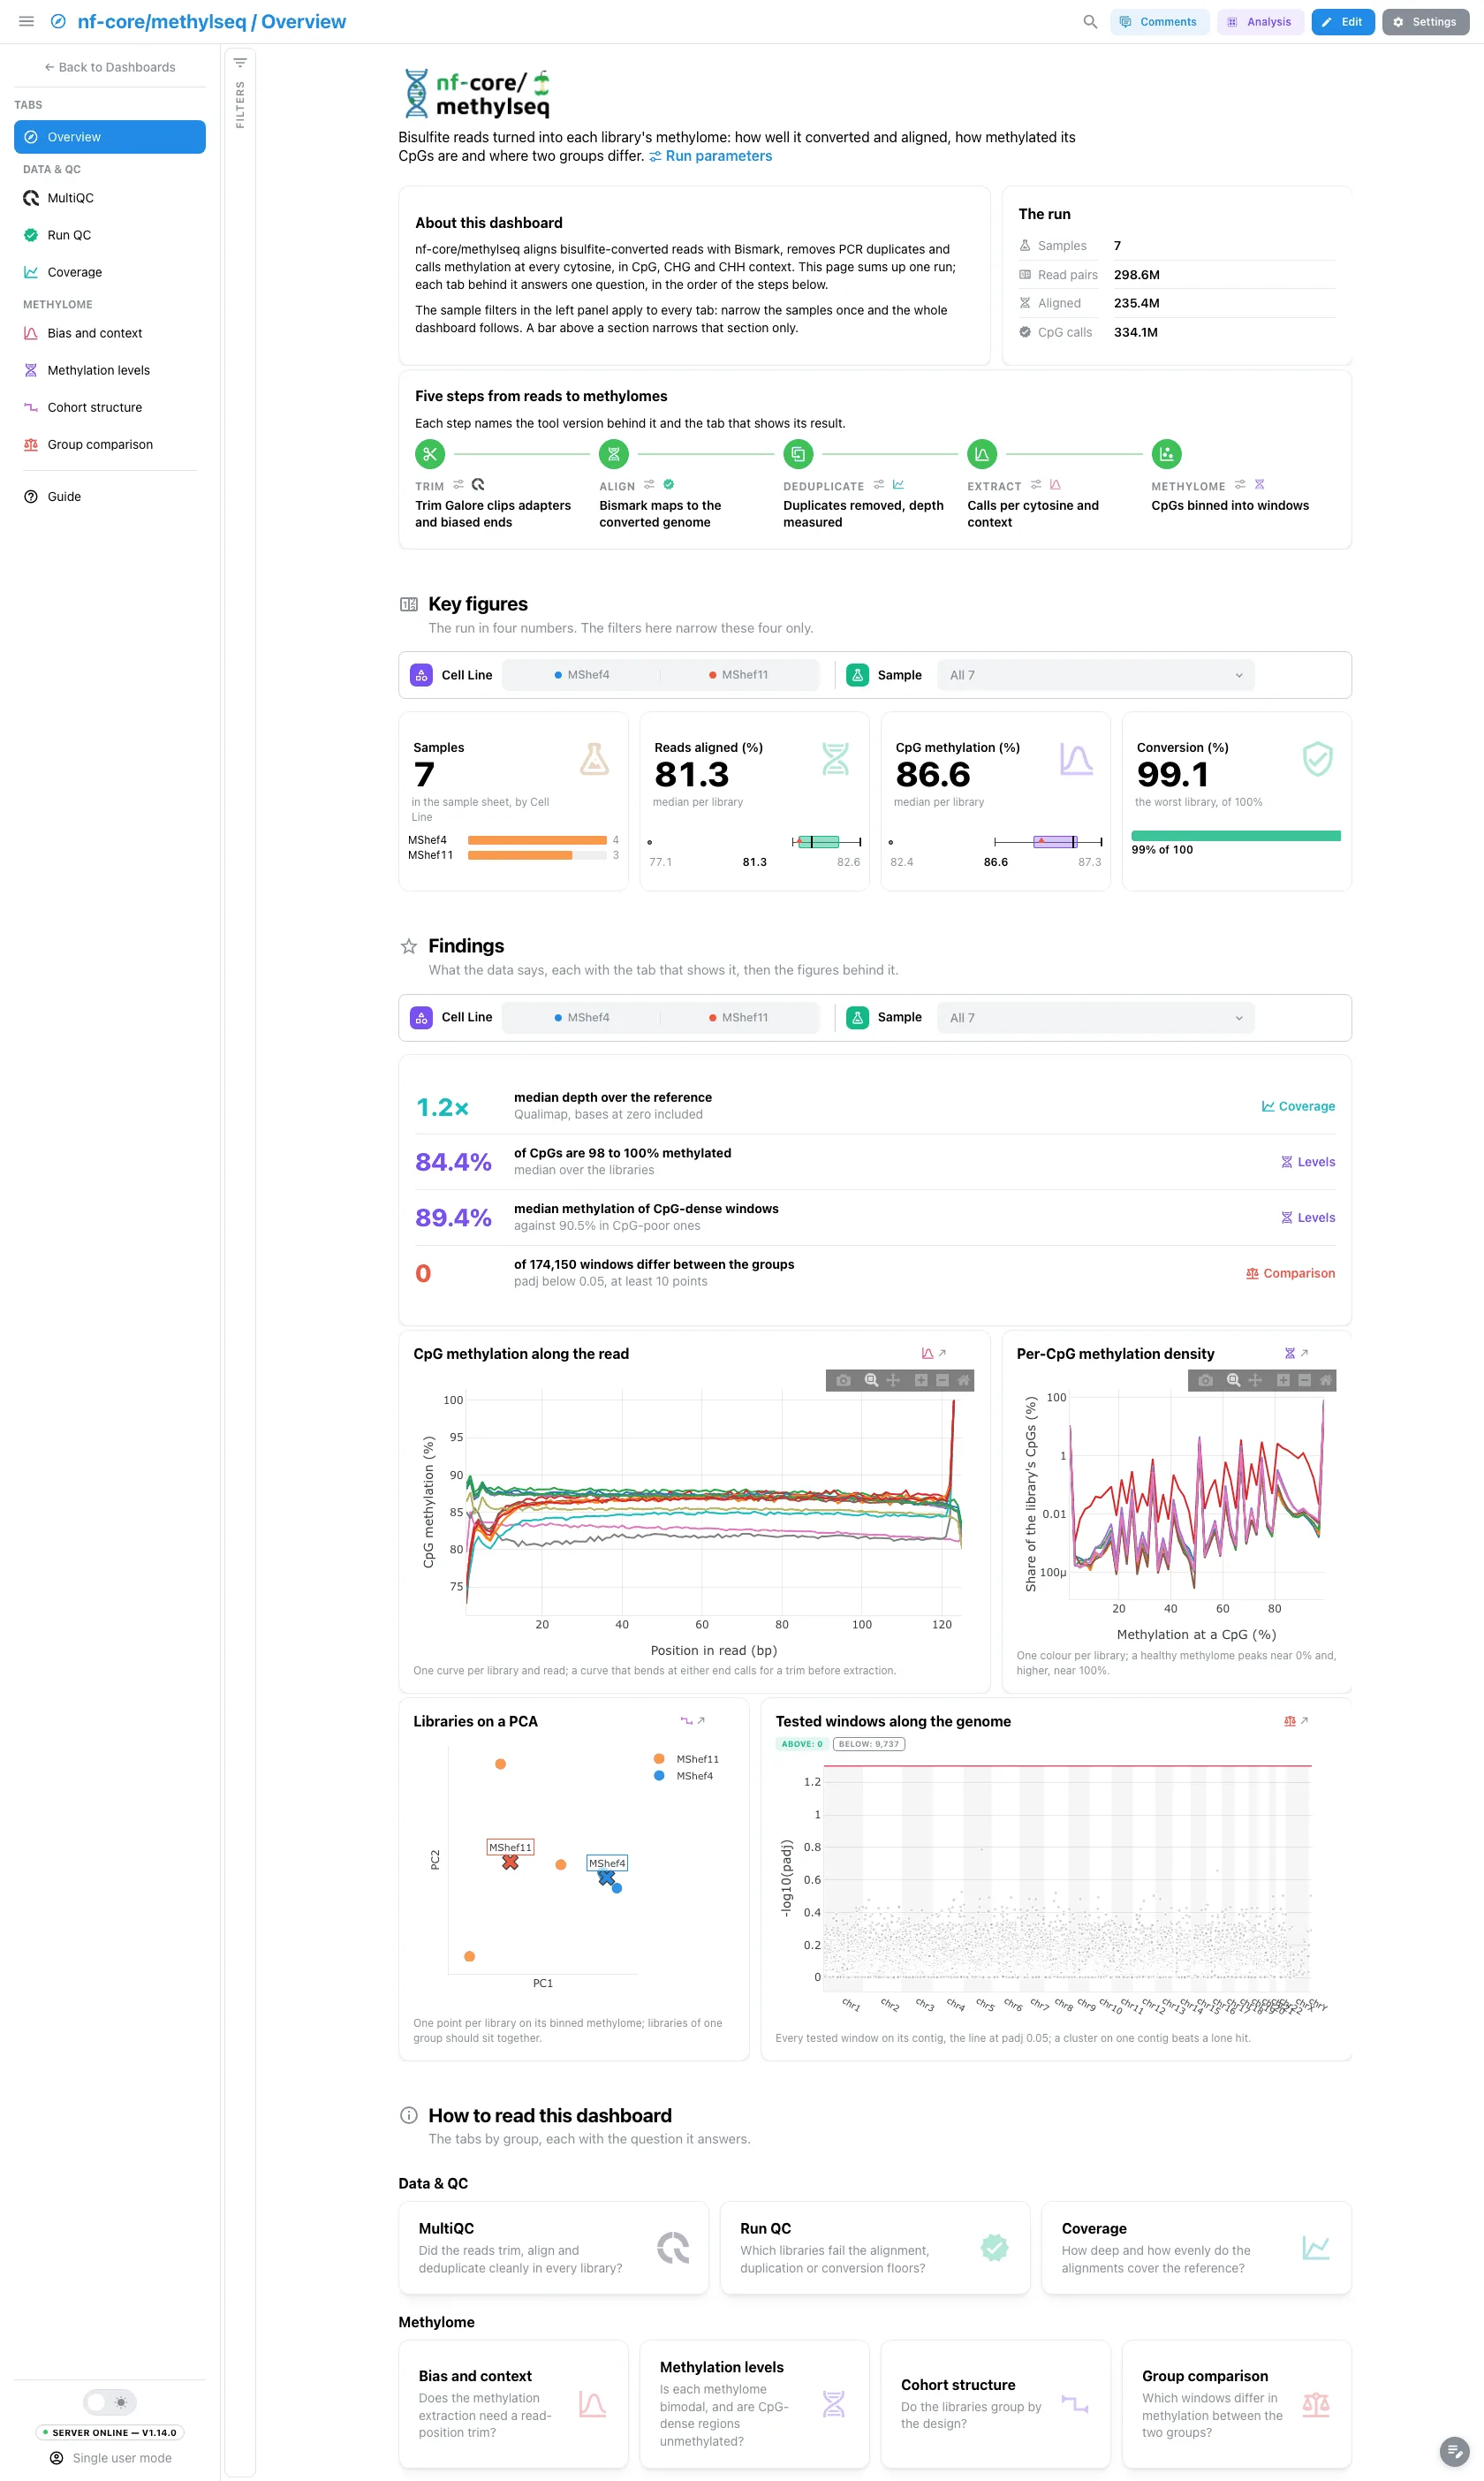
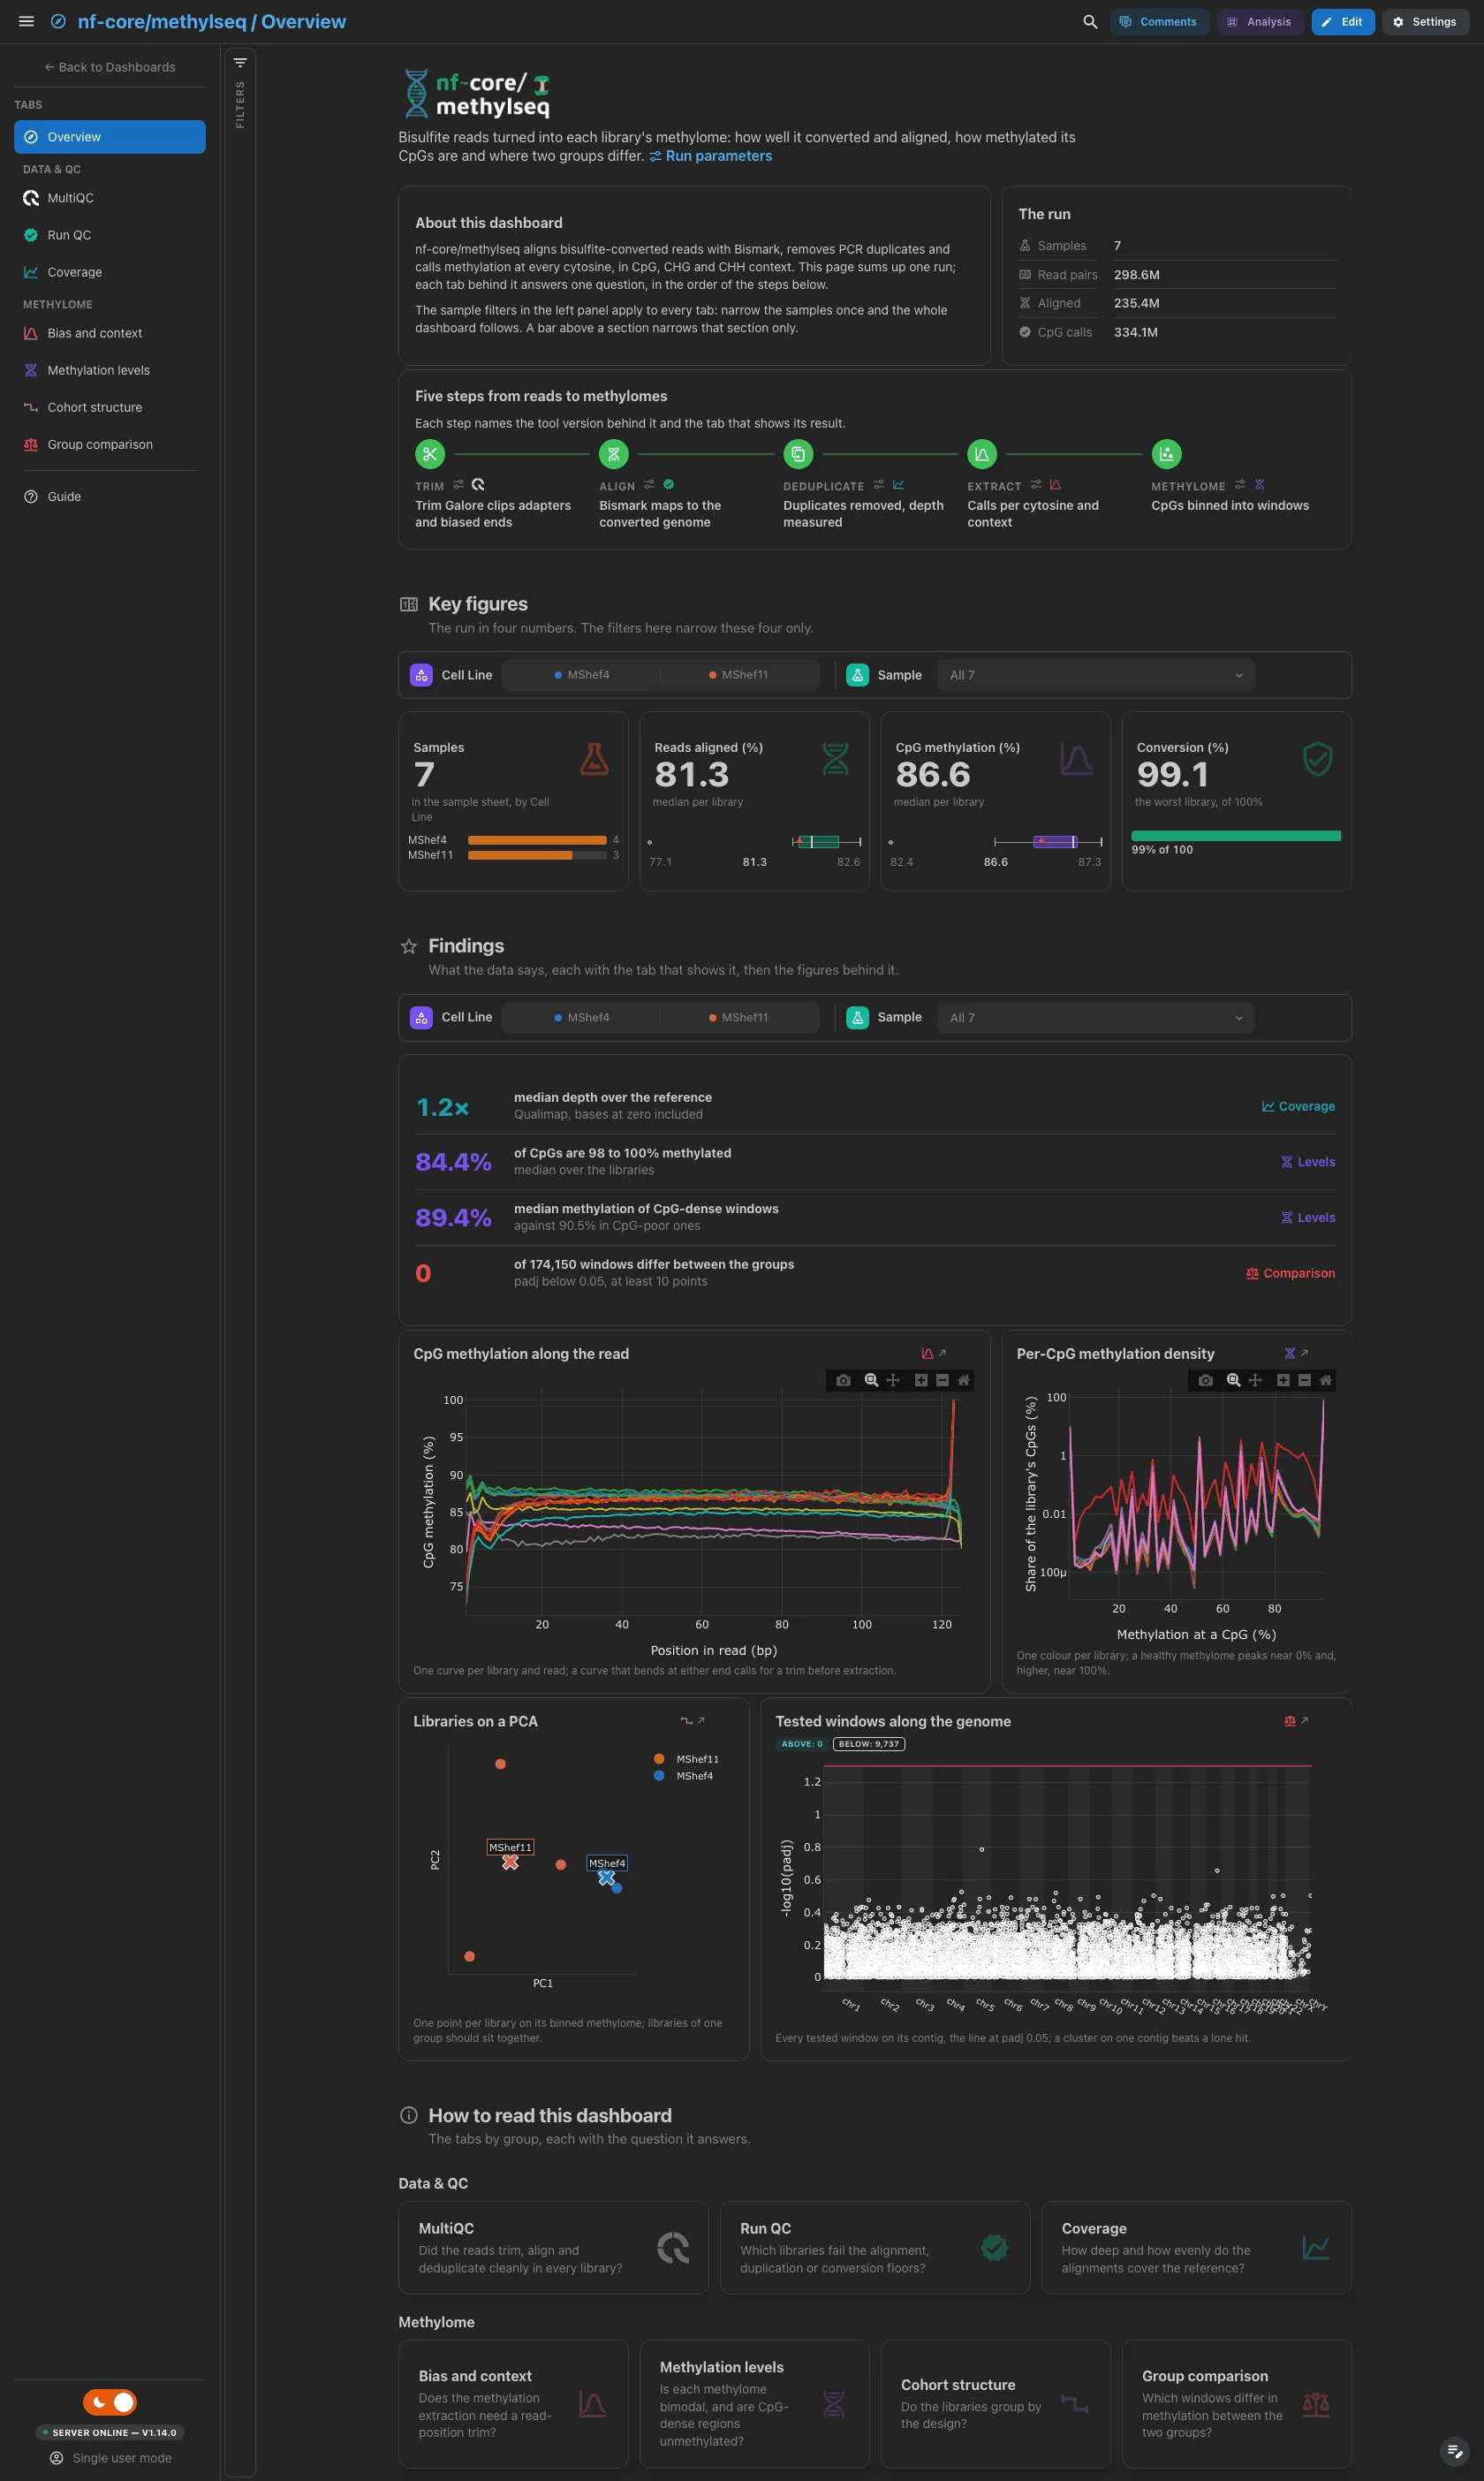
A short hero links the run's provenance: methylseq 2.3.0 writes no
params.json, so the dialog holds the software versions. About this
dashboard says how the two filter levels work, The run lists the samples,
read pairs, pairs aligned and CpG calls, and Pipeline walks the five steps
from trimming to the binned methylome, each linked to the version of its tool
and its tab. The findings are live values: they follow the filters. Without a
design table the windows row and the Manhattan drop out.
Filters and components
Filters · the left panel starts collapsed. Key figures and Findings each have their own filter bar (the group and the sample id): each narrows its own section only.
| Section | What it holds |
|---|---|
| Top | Hero, About this dashboard, The run, Pipeline |
| Key figures | 4 headline cards: samples, reads aligned, CpG methylation, the lowest conversion |
| Findings | Live result rows, then 4 figures, one per Methylome tab: the CpG M-bias curves, the per-CpG methylation density, the library PCA and the Manhattan of the tested windows |
| How to read this dashboard | The tabs by group, each with its question |
Data & QC · Did the reads trim, align and deduplicate cleanly in every library?
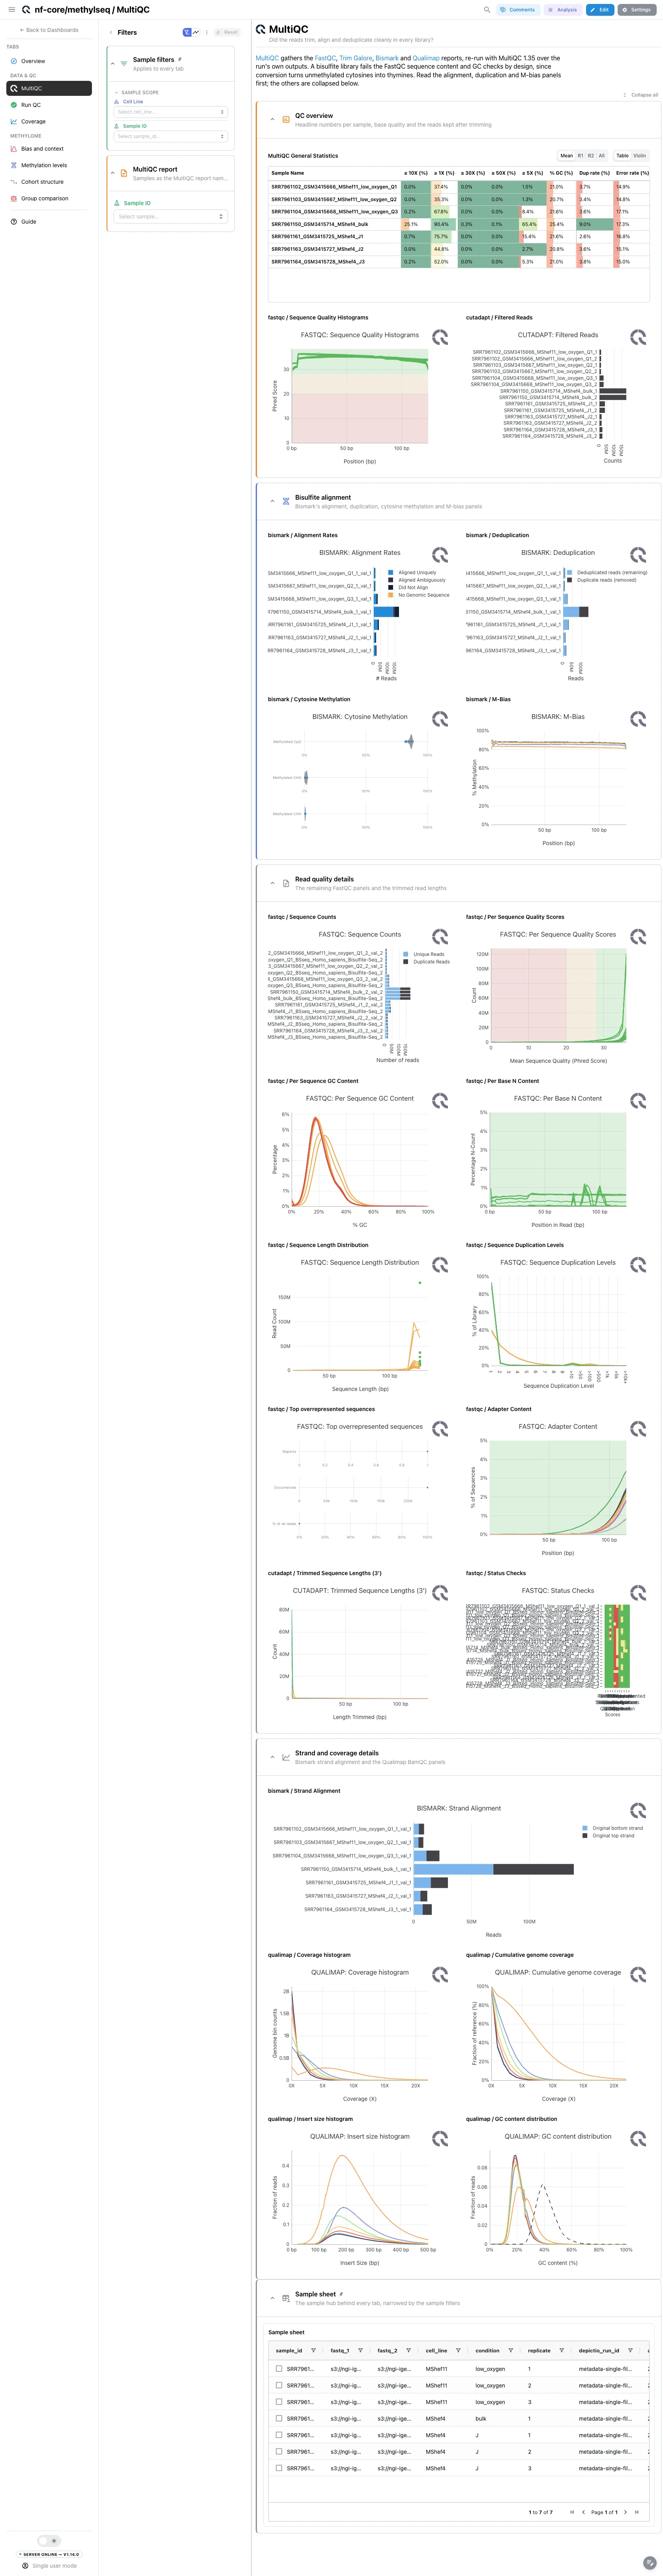
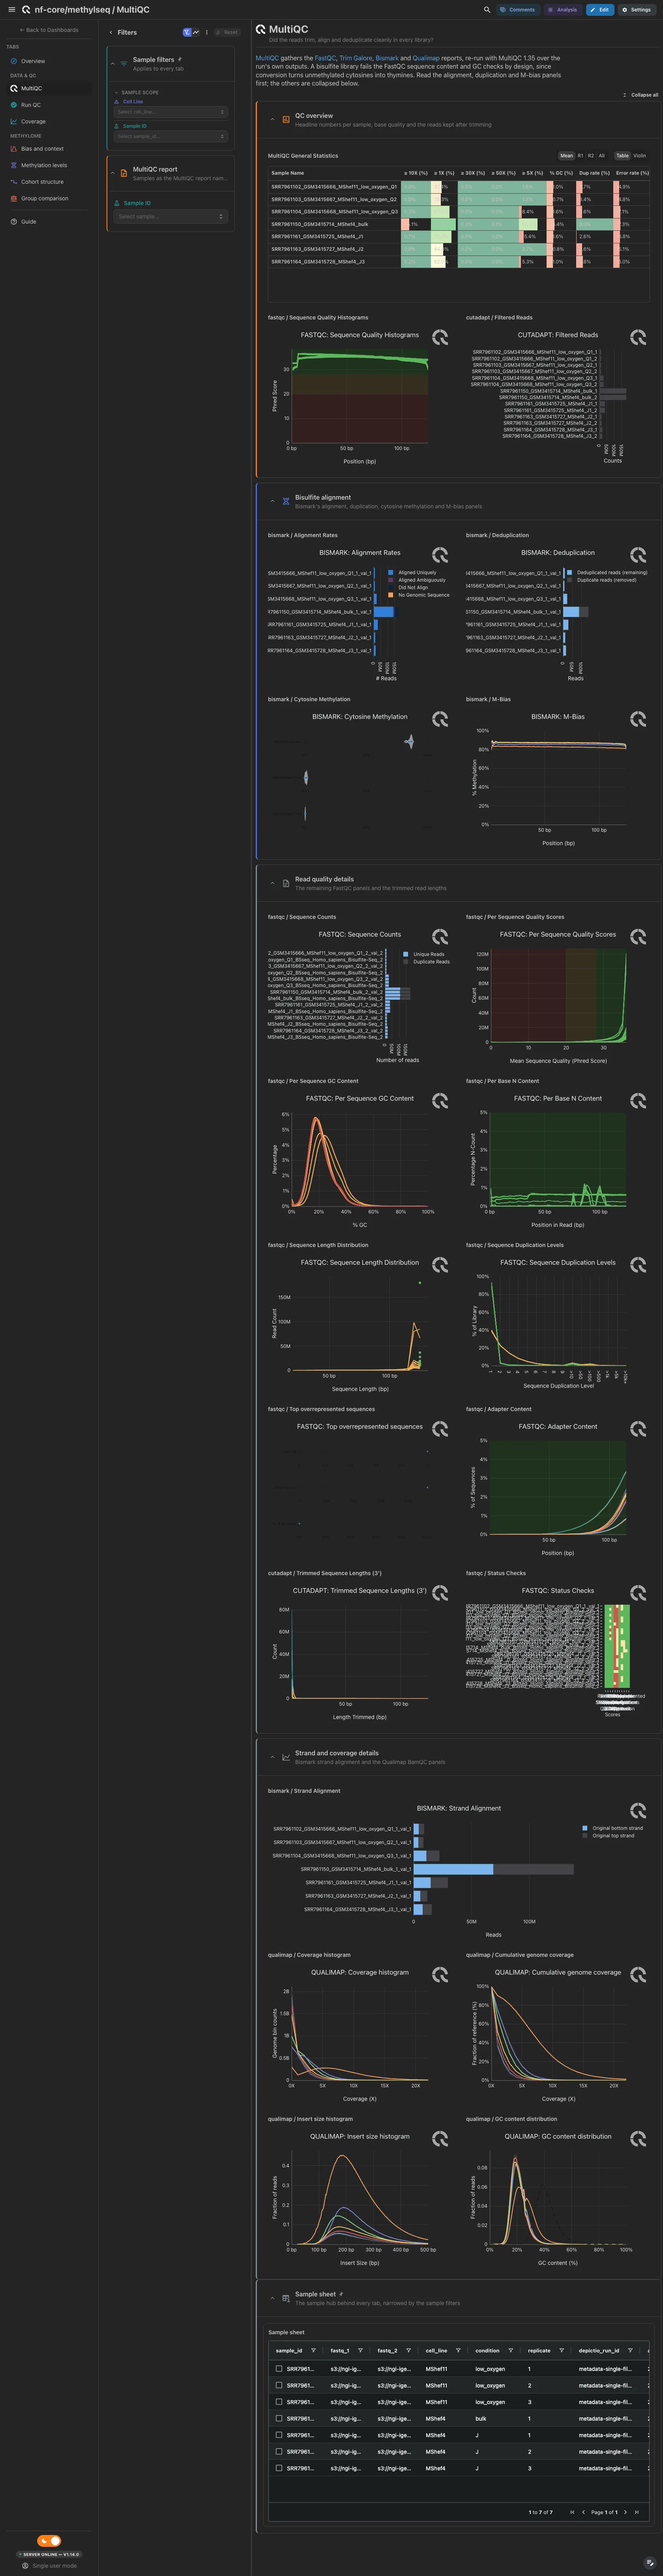
MultiQC panels only, from the report regenerated with MultiQC 1.35. Open: general statistics, FastQC base quality and the reads Cutadapt kept, then Bismark's alignment rates, deduplication, cytosine methylation and M-bias. A bisulfite library fails the FastQC sequence content and GC checks by design, since conversion turns unmethylated cytosines into thymines. The other FastQC panels with the trimmed read lengths, and Bismark's strand alignment with the four Qualimap BamQC panels, are collapsed.
Filters and components
Filters · Sample ID, read from the MultiQC report.
| Section | What it holds |
|---|---|
| QC overview | 3 MultiQC panels |
| Bisulfite alignment | 4 MultiQC panels |
| Read quality details (collapsed) | 10 MultiQC panels |
| Strand and coverage details (collapsed) | 5 MultiQC panels |
Data & QC · Which libraries fail the alignment, duplication or conversion floors?
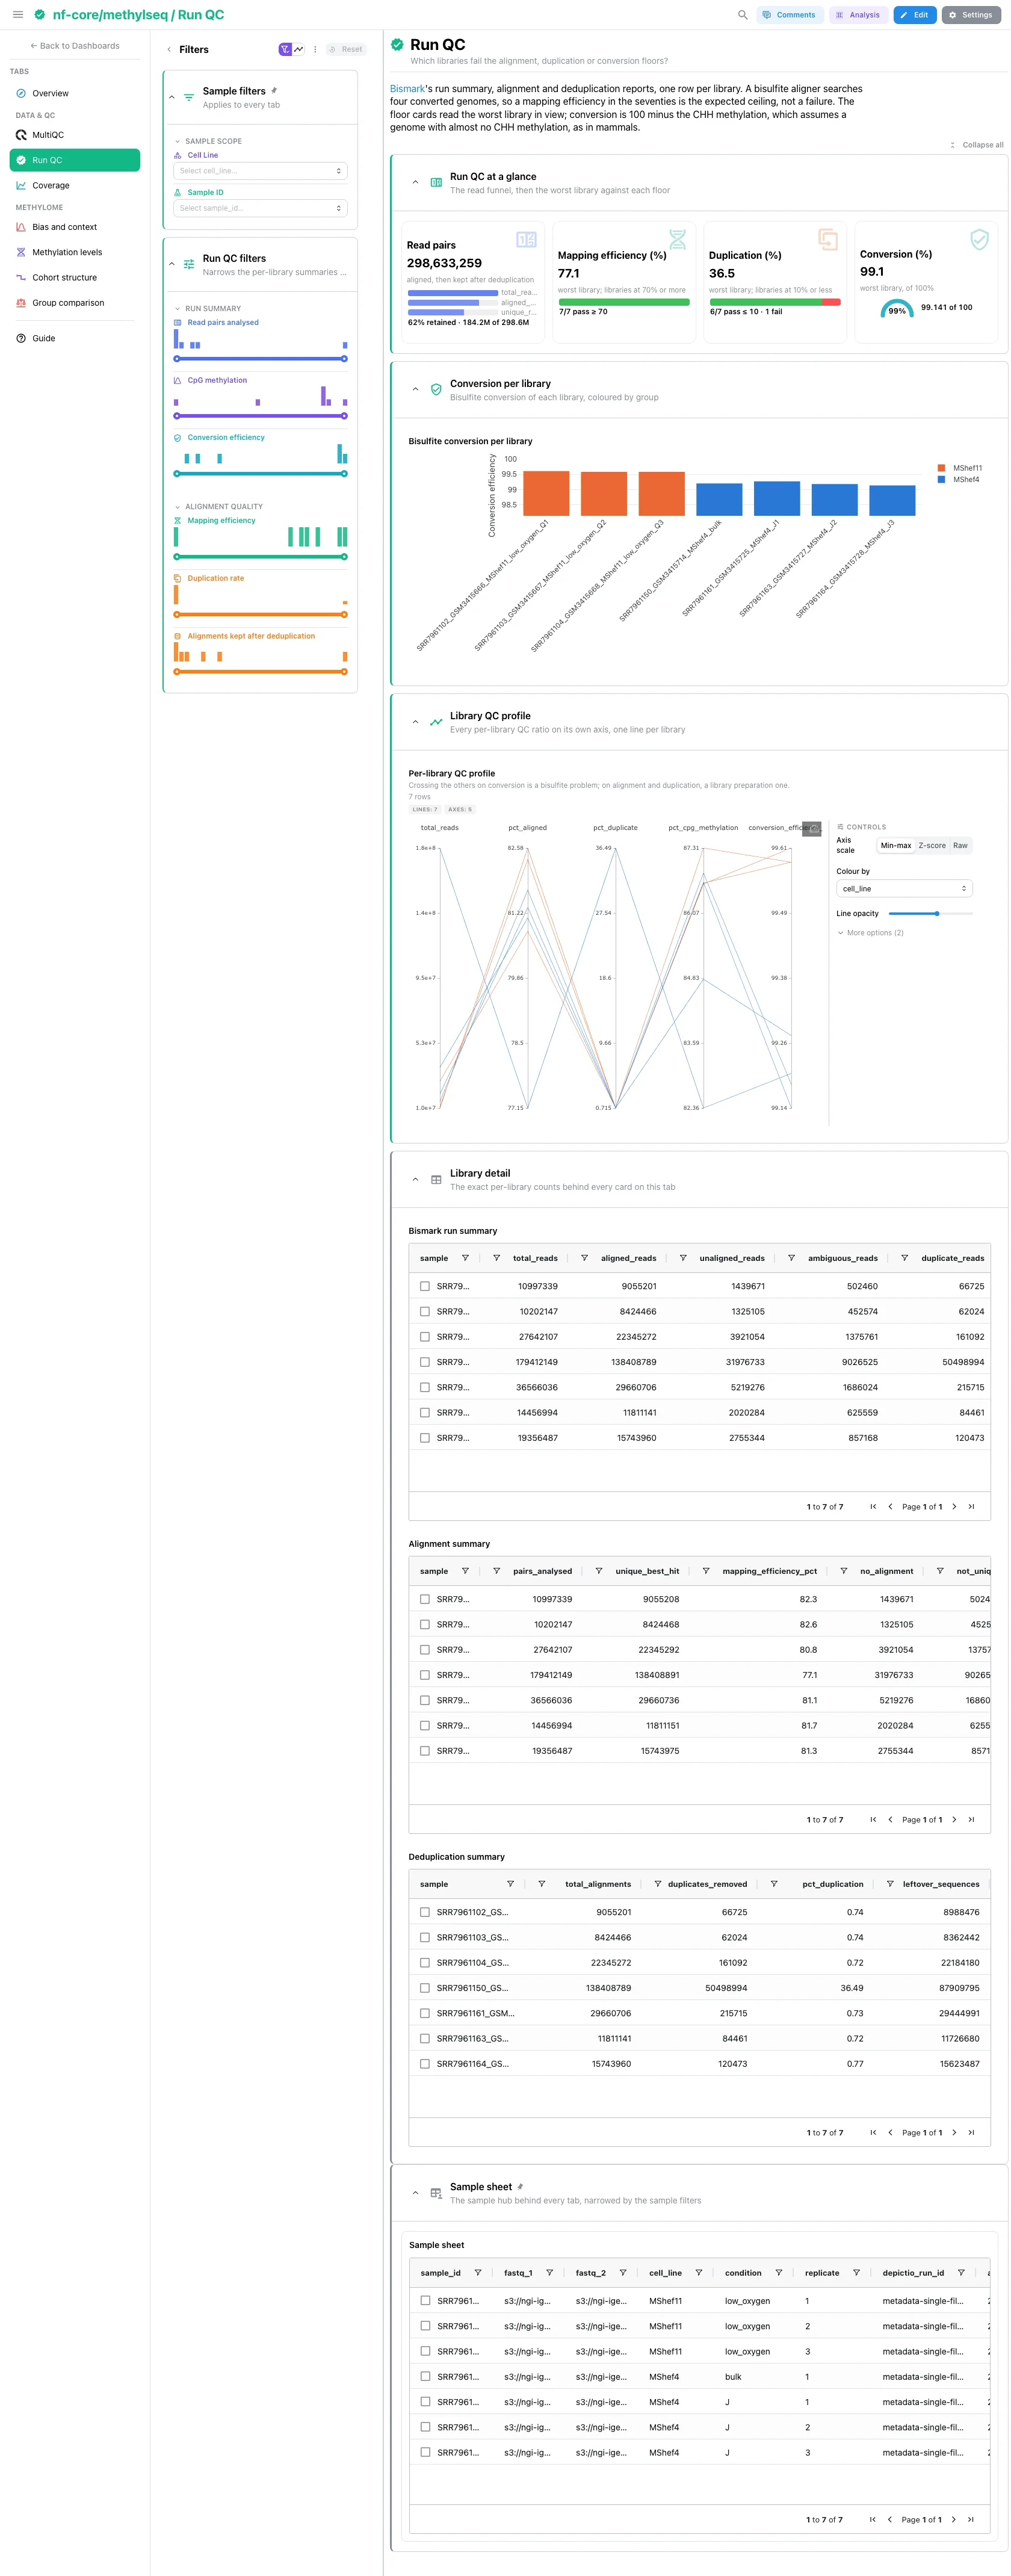
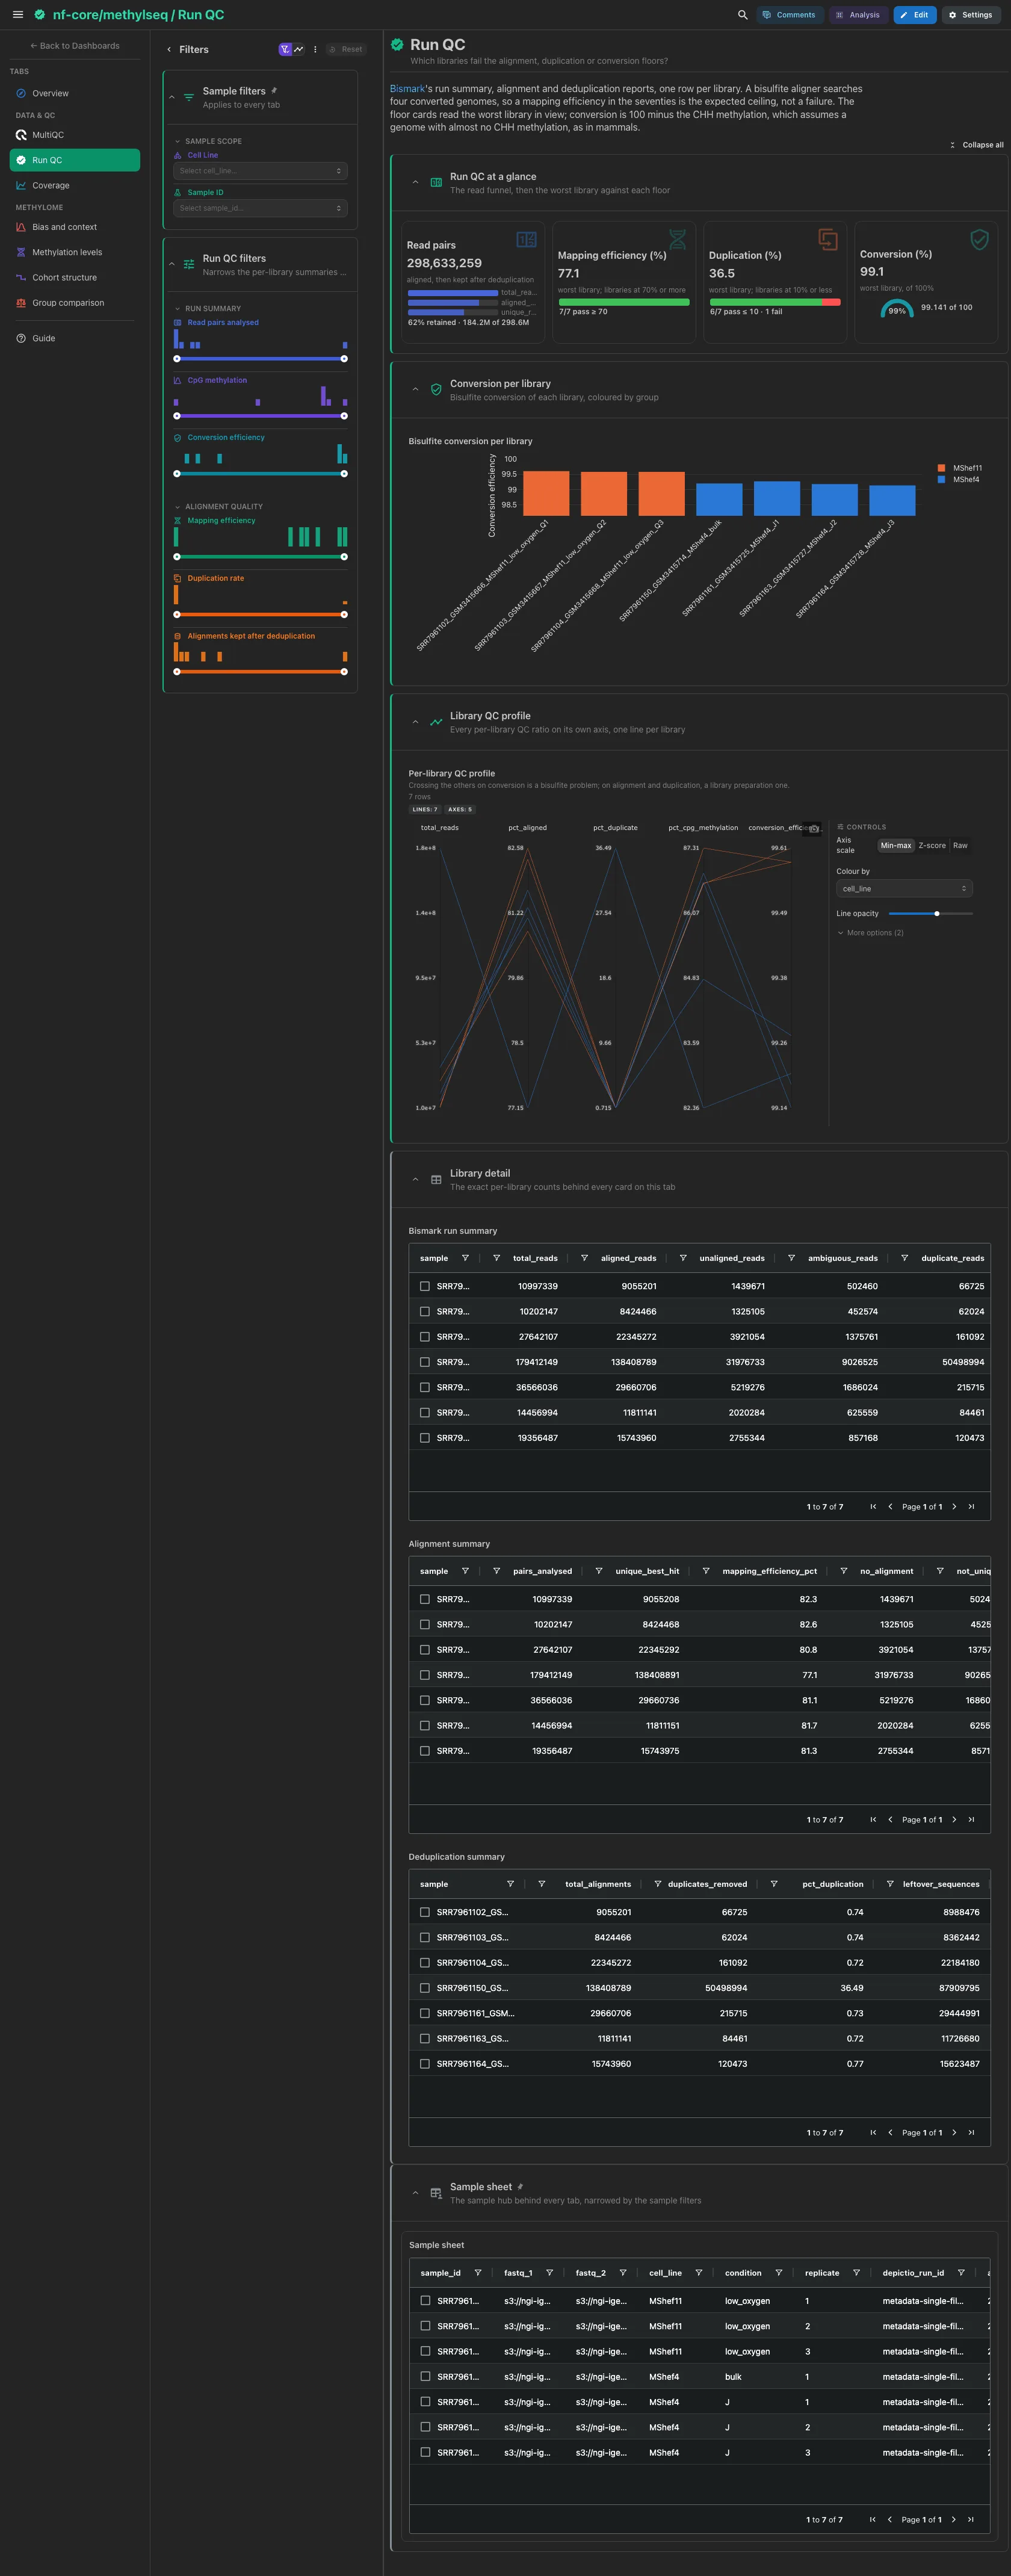
The read pairs Bismark analysed, followed to those aligned and kept; the worst
mapping efficiency, which passes at 70% since a bisulfite aligner tops out in
the seventies; the worst duplication (10% passes) and the worst conversion,
read as 100 - %CHH. Then the conversion per library, coloured by group, and
five run-summary metrics on parallel axes: a library that crosses the others on
conversion is a bisulfite problem, on alignment and duplication a library
preparation one. Bismark's three report tables are collapsed.
Filters and components
Filters · Read pairs analysed, CpG methylation and Conversion
efficiency ranges on bismark_summary_report, Mapping efficiency on
bismark_alignment_summary, and Duplication rate and Alignments kept
after deduplication on bismark_deduplication_summary.
| Section | What it holds |
|---|---|
| Run QC at a glance | 4 cards |
| Conversion per library | Bisulfite conversion per library |
| Library QC profile | 1 advanced visualization |
| Library detail (collapsed) | Bismark run summary, Alignment summary, Deduplication summary |
Data & QC · How deep and how evenly do the alignments cover the reference?
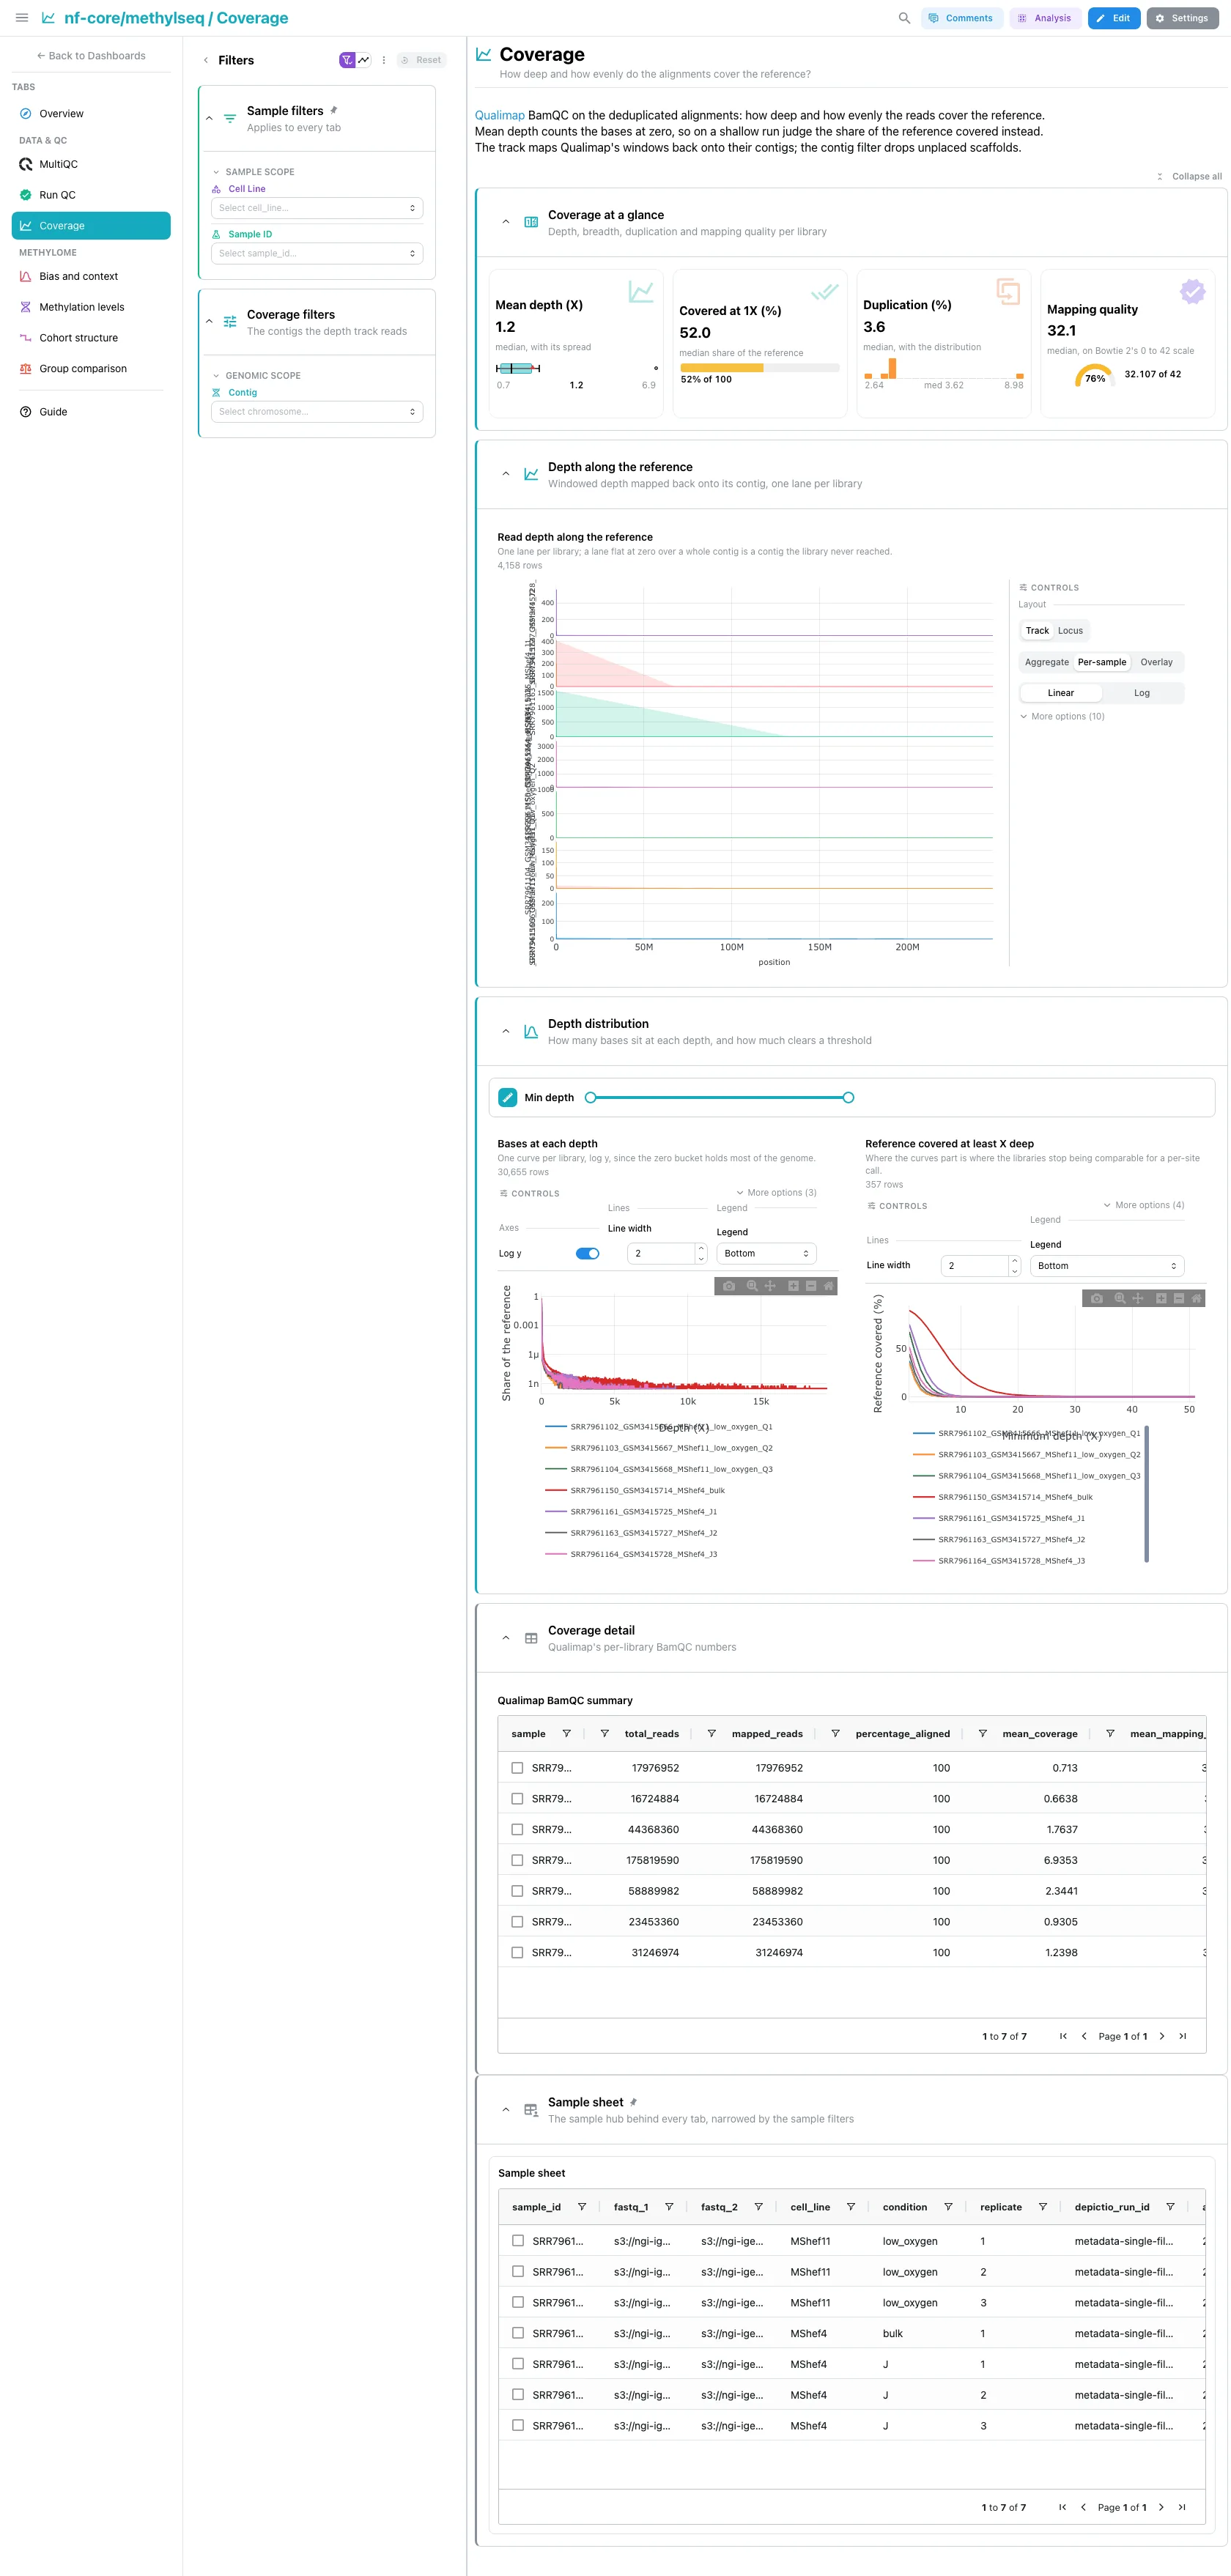
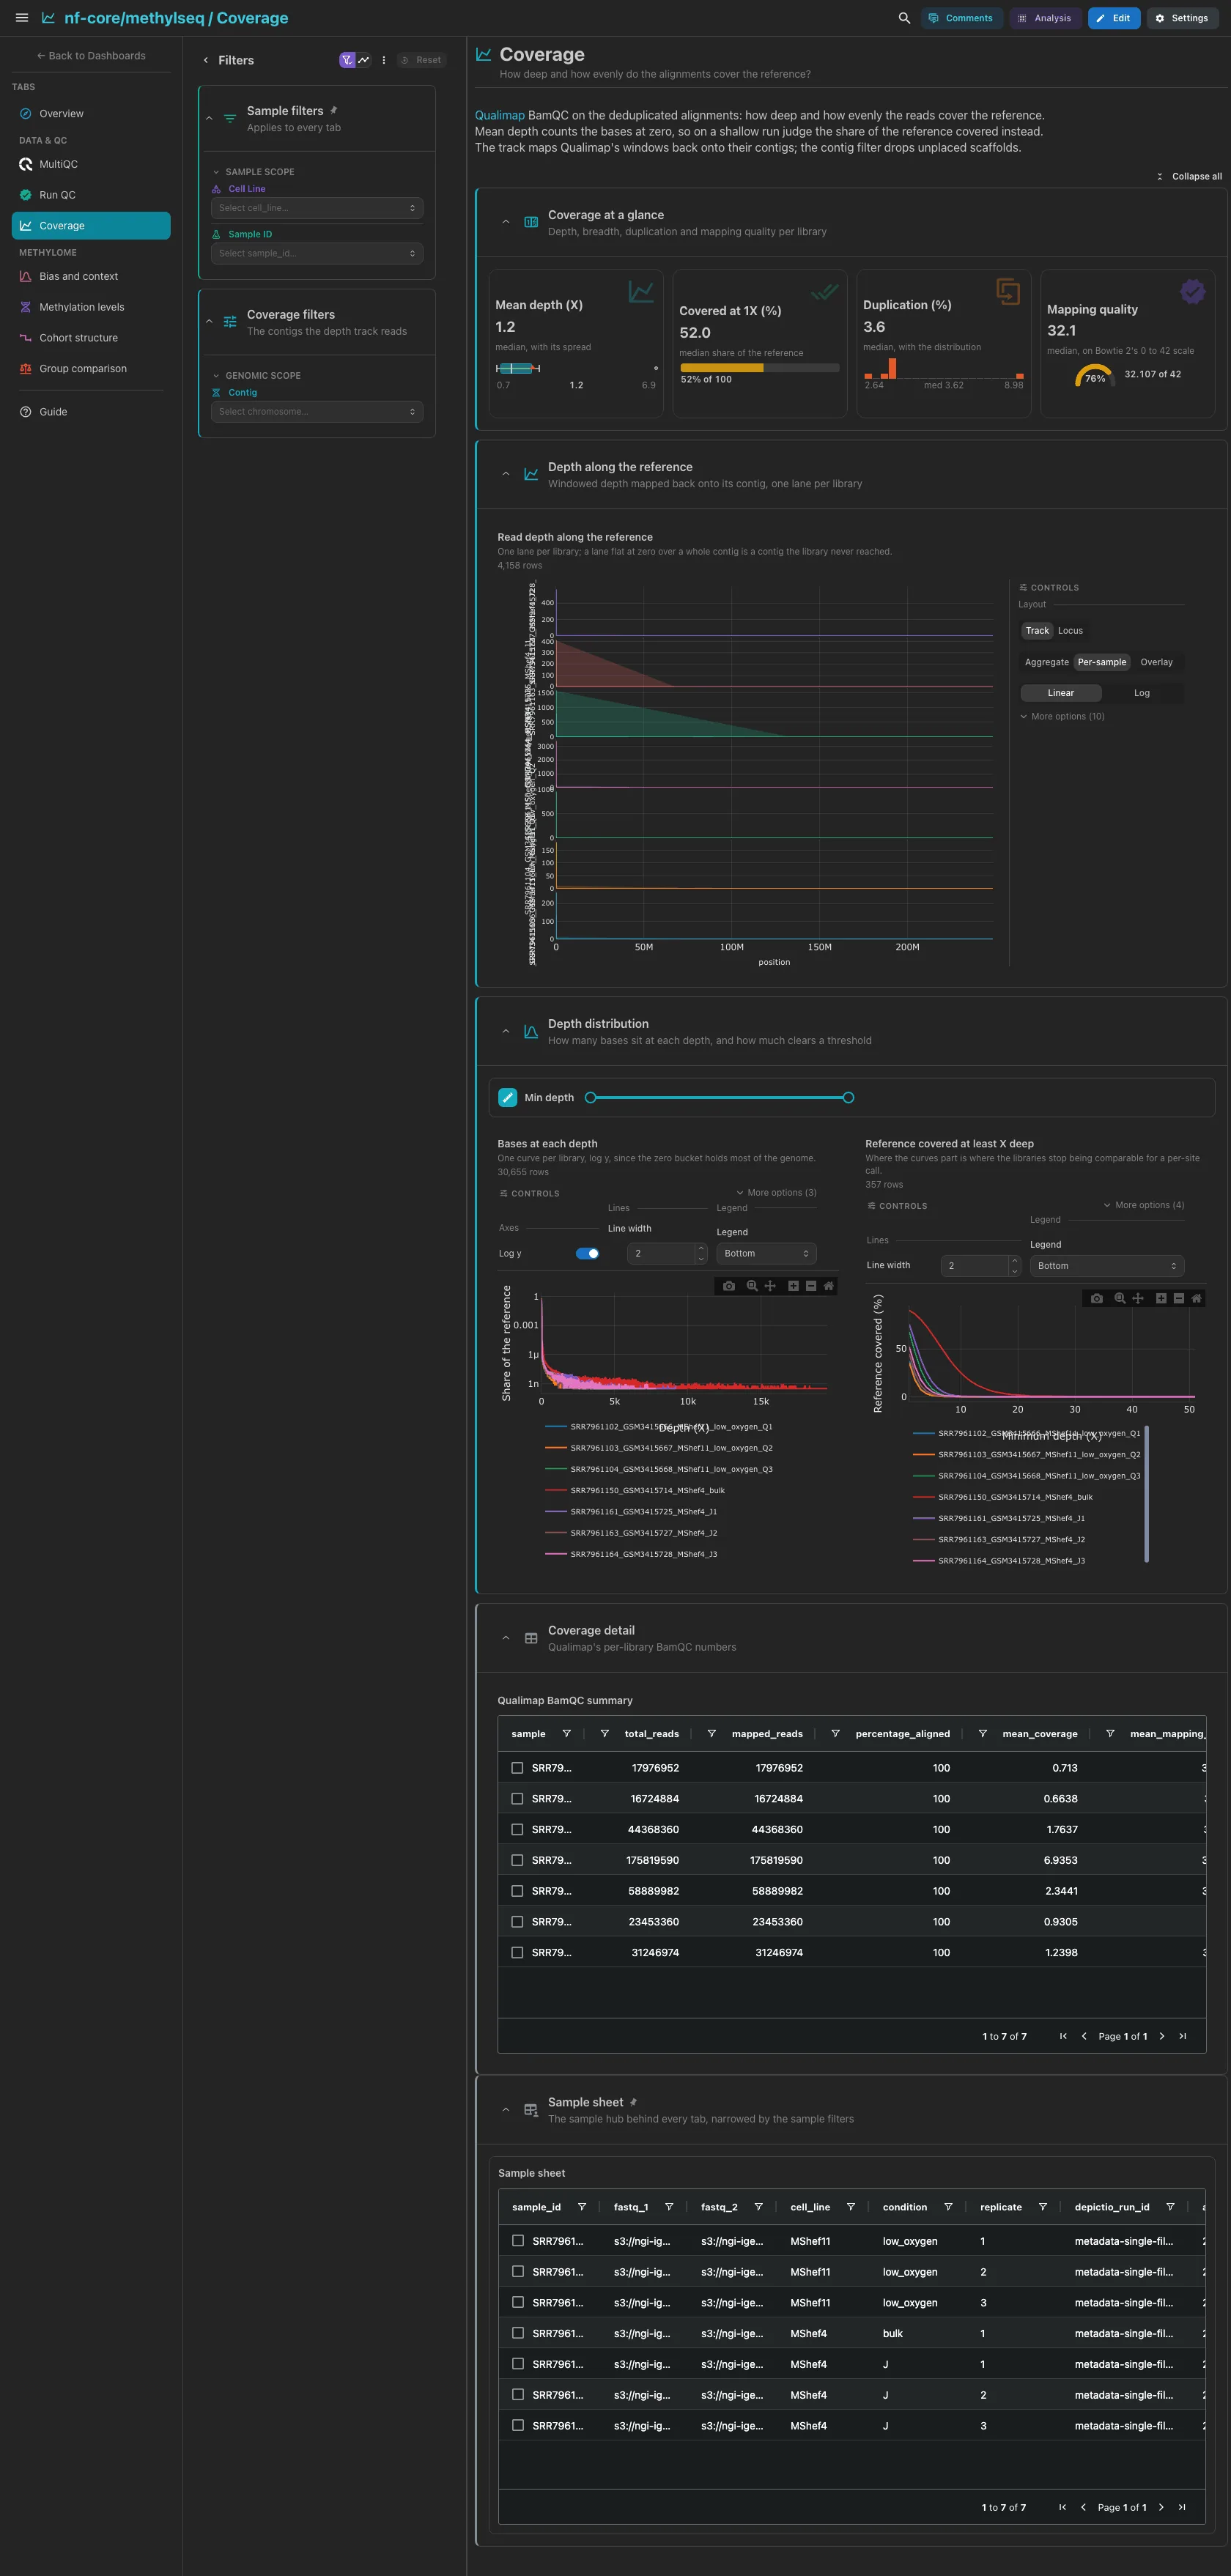
Qualimap BamQC on the deduplicated alignments. The mean depth, the share of the reference covered at least once, Qualimap's duplicate estimate and the mean mapping quality on Bowtie 2's 0 to 42 scale. Mean depth counts the bases at zero, so on a shallow run judge the breadth. Then the depth along the reference, one lane per library, and side by side the bases at each depth and the share of the reference covered at least X deep. The depth threshold in that section's bar narrows that section only. The BamQC table is collapsed.
Filters and components
Filters · Contig on qualimap_coverage_across_reference; the
Depth threshold range sits in the bar of Depth distribution.
| Section | What it holds |
|---|---|
| Coverage at a glance | 4 cards |
| Depth along the reference | 1 advanced visualization |
| Depth distribution | 2 advanced visualizations, under a filter bar |
| Coverage detail (collapsed) | Qualimap BamQC summary |
Methylome · Does the methylation extraction need a read-position trim?
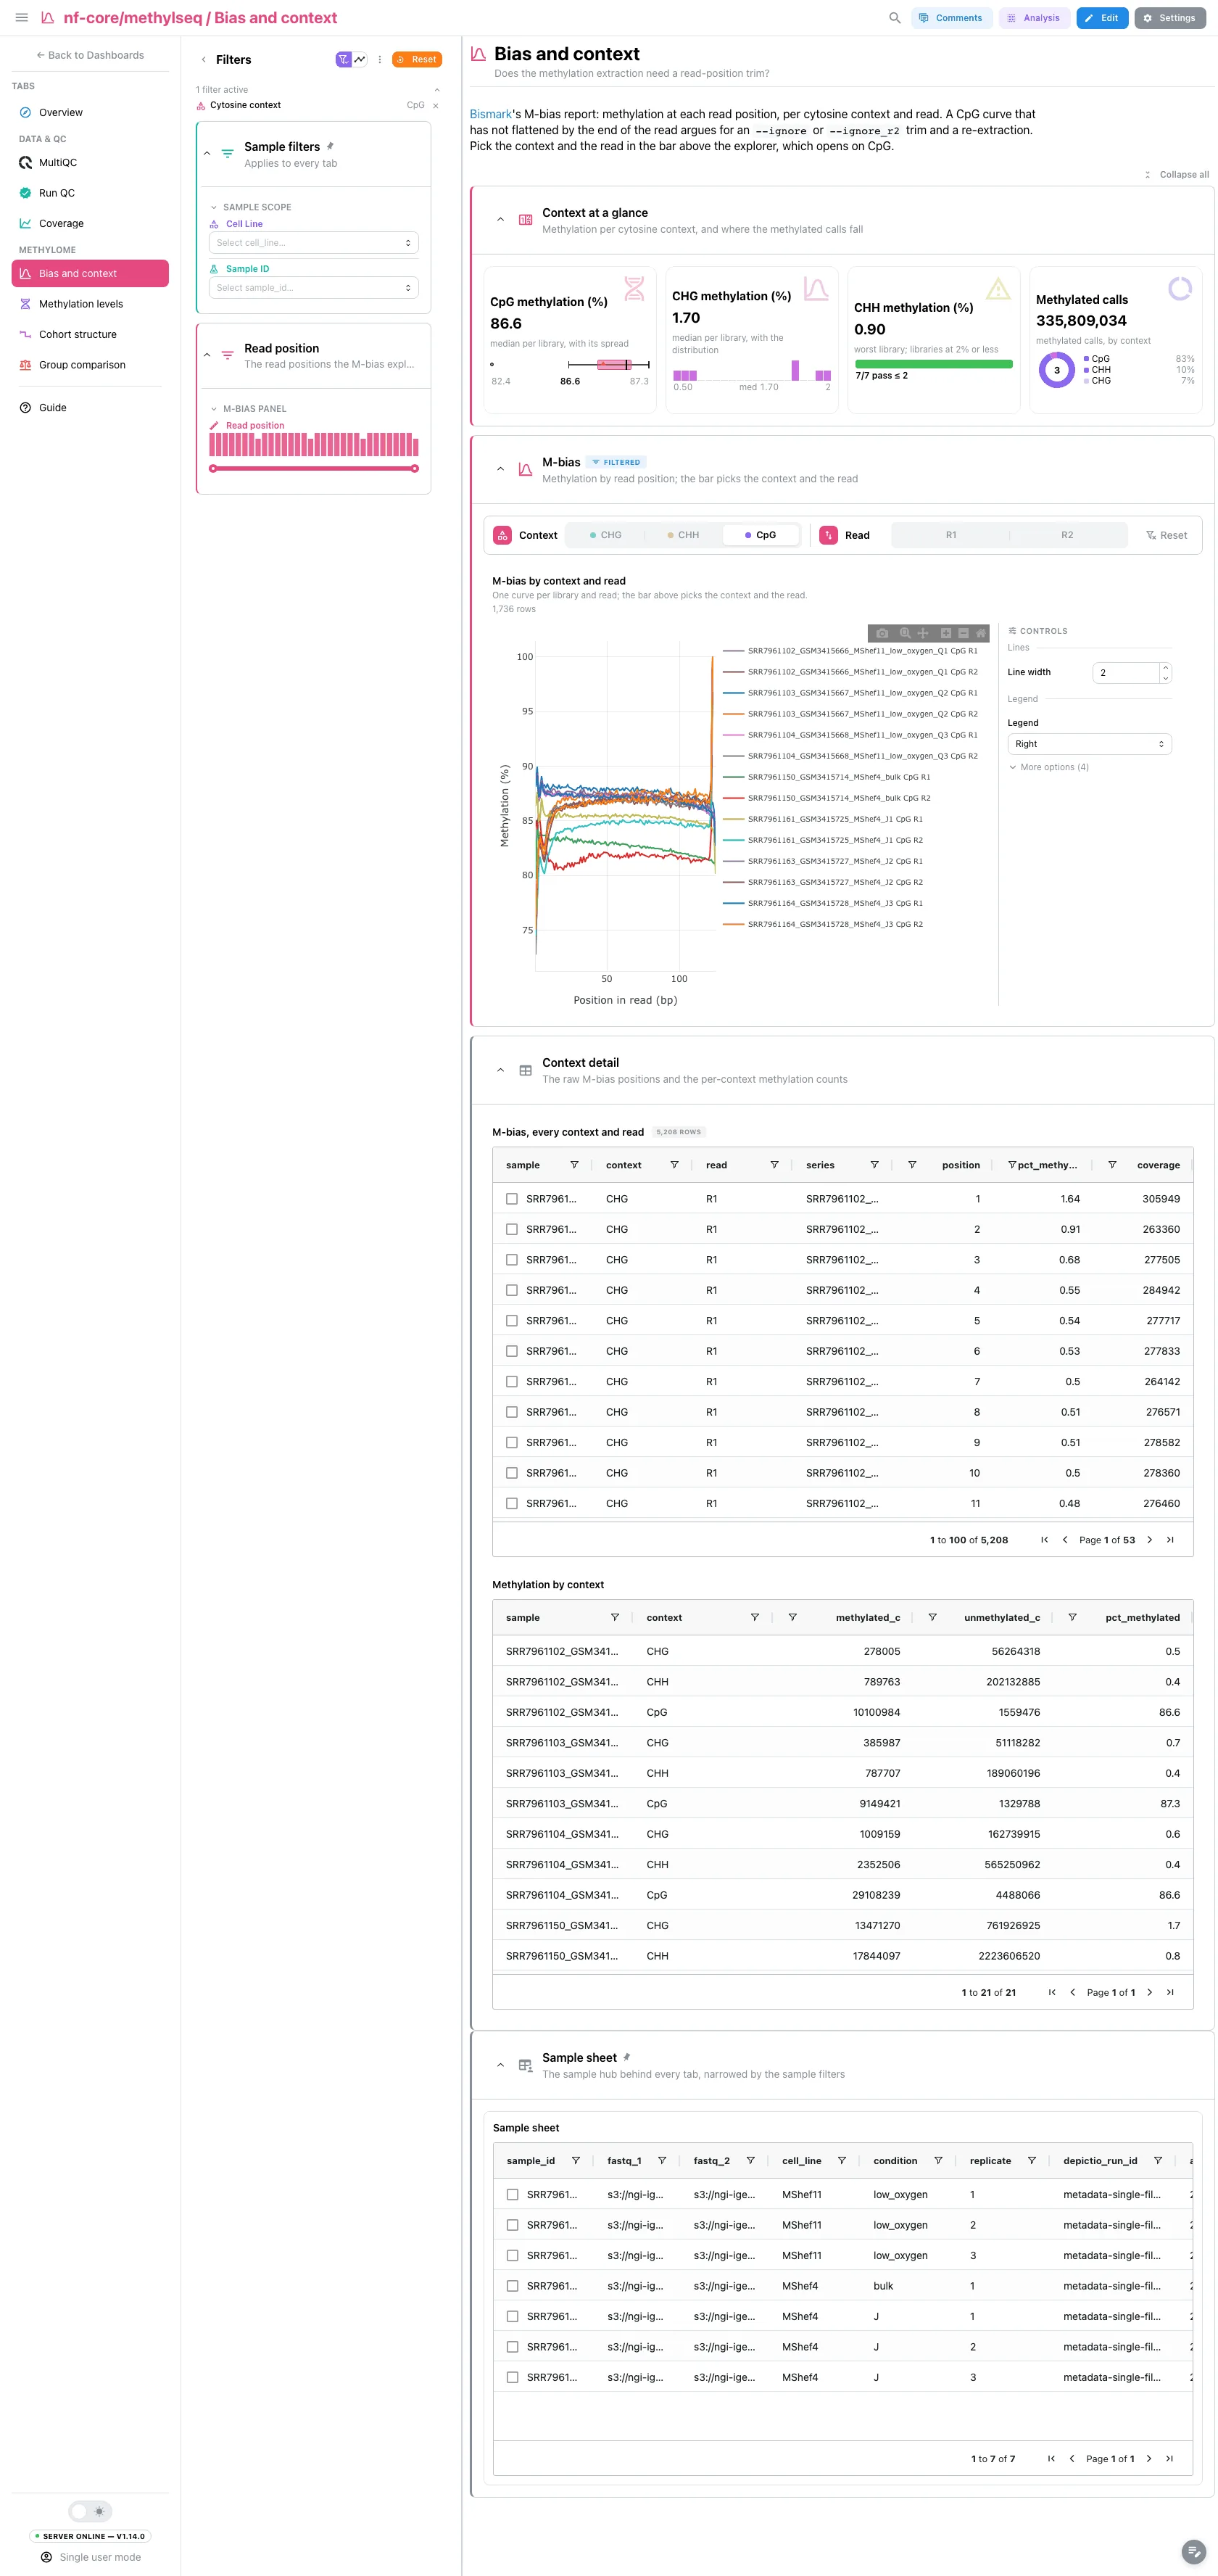
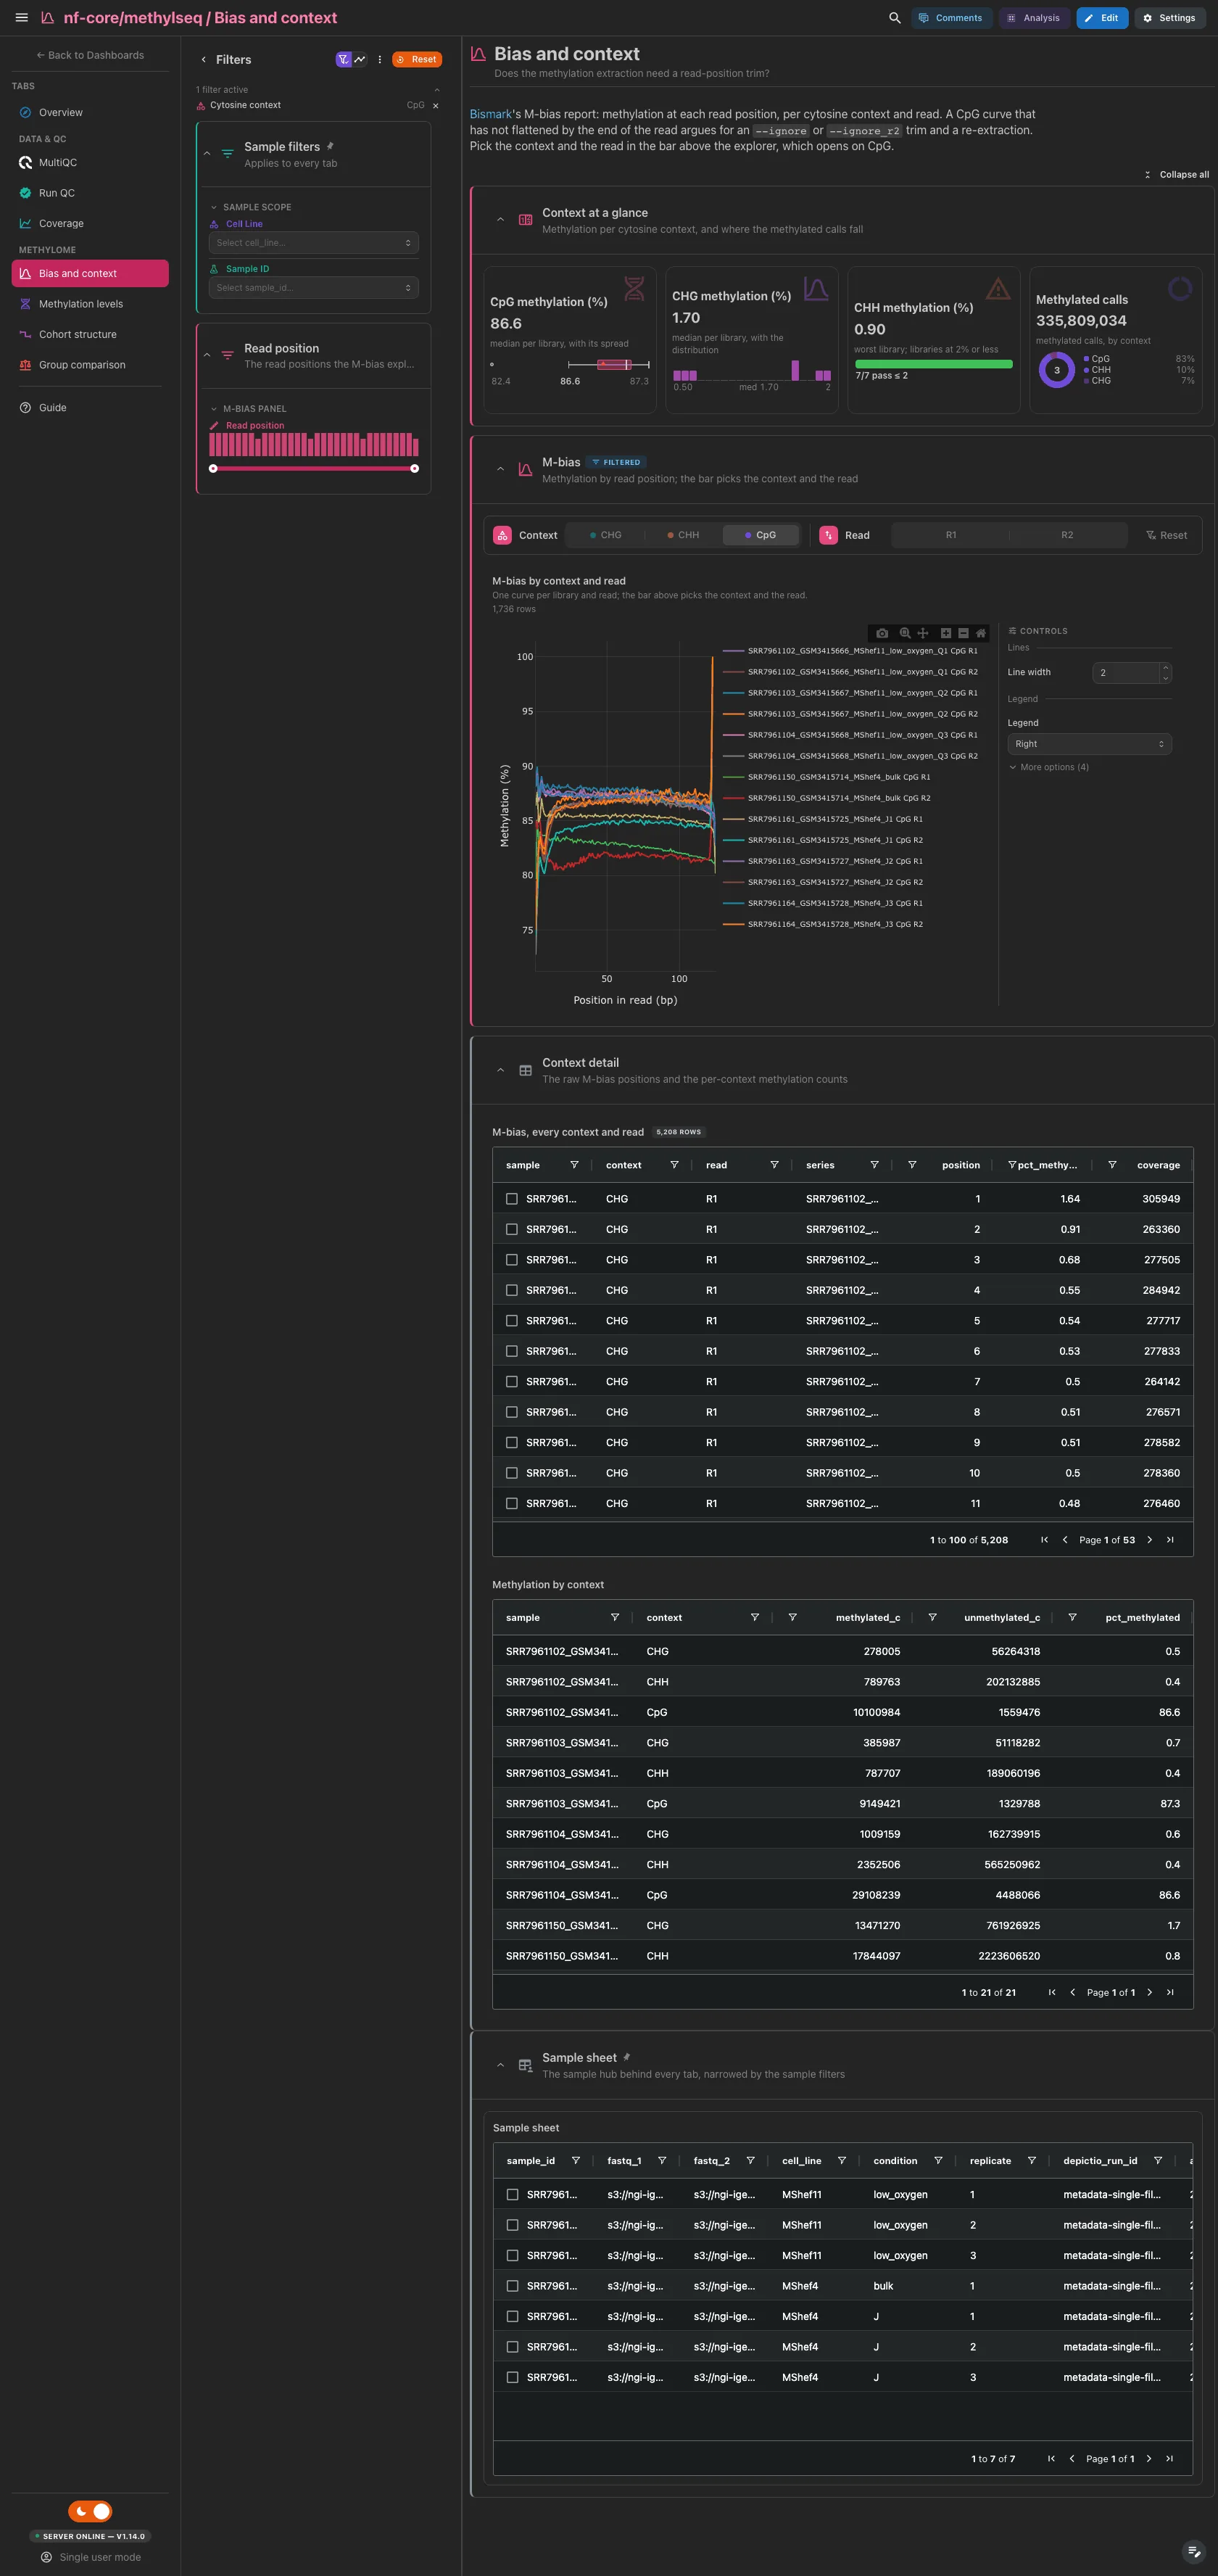
CpG and CHG methylation, the worst CHH methylation against a 2% line (the 98%
conversion floor on a mammalian genome) and the methylated calls by context.
Then one M-bias explorer over the six tables of Bismark's M-bias file; the bar
of its section picks the context and the read, opens on CpG and narrows the
explorer only. A CpG curve that has not flattened by the end of the read calls
for an --ignore or --ignore_r2 trim and a re-extraction. The raw M-bias
positions and the per-context counts are collapsed.
Filters and components
Filters · a Read position range on bismark_mbias_all_contexts;
Cytosine context and Read sit in the bar of M-bias.
| Section | What it holds |
|---|---|
| Context at a glance | 4 cards |
| M-bias | 1 advanced visualization, under a filter bar |
| Context detail (collapsed) | M-bias, every context and read, Methylation by context |
Methylome · Is each methylome bimodal, and are CpG-dense regions unmethylated?
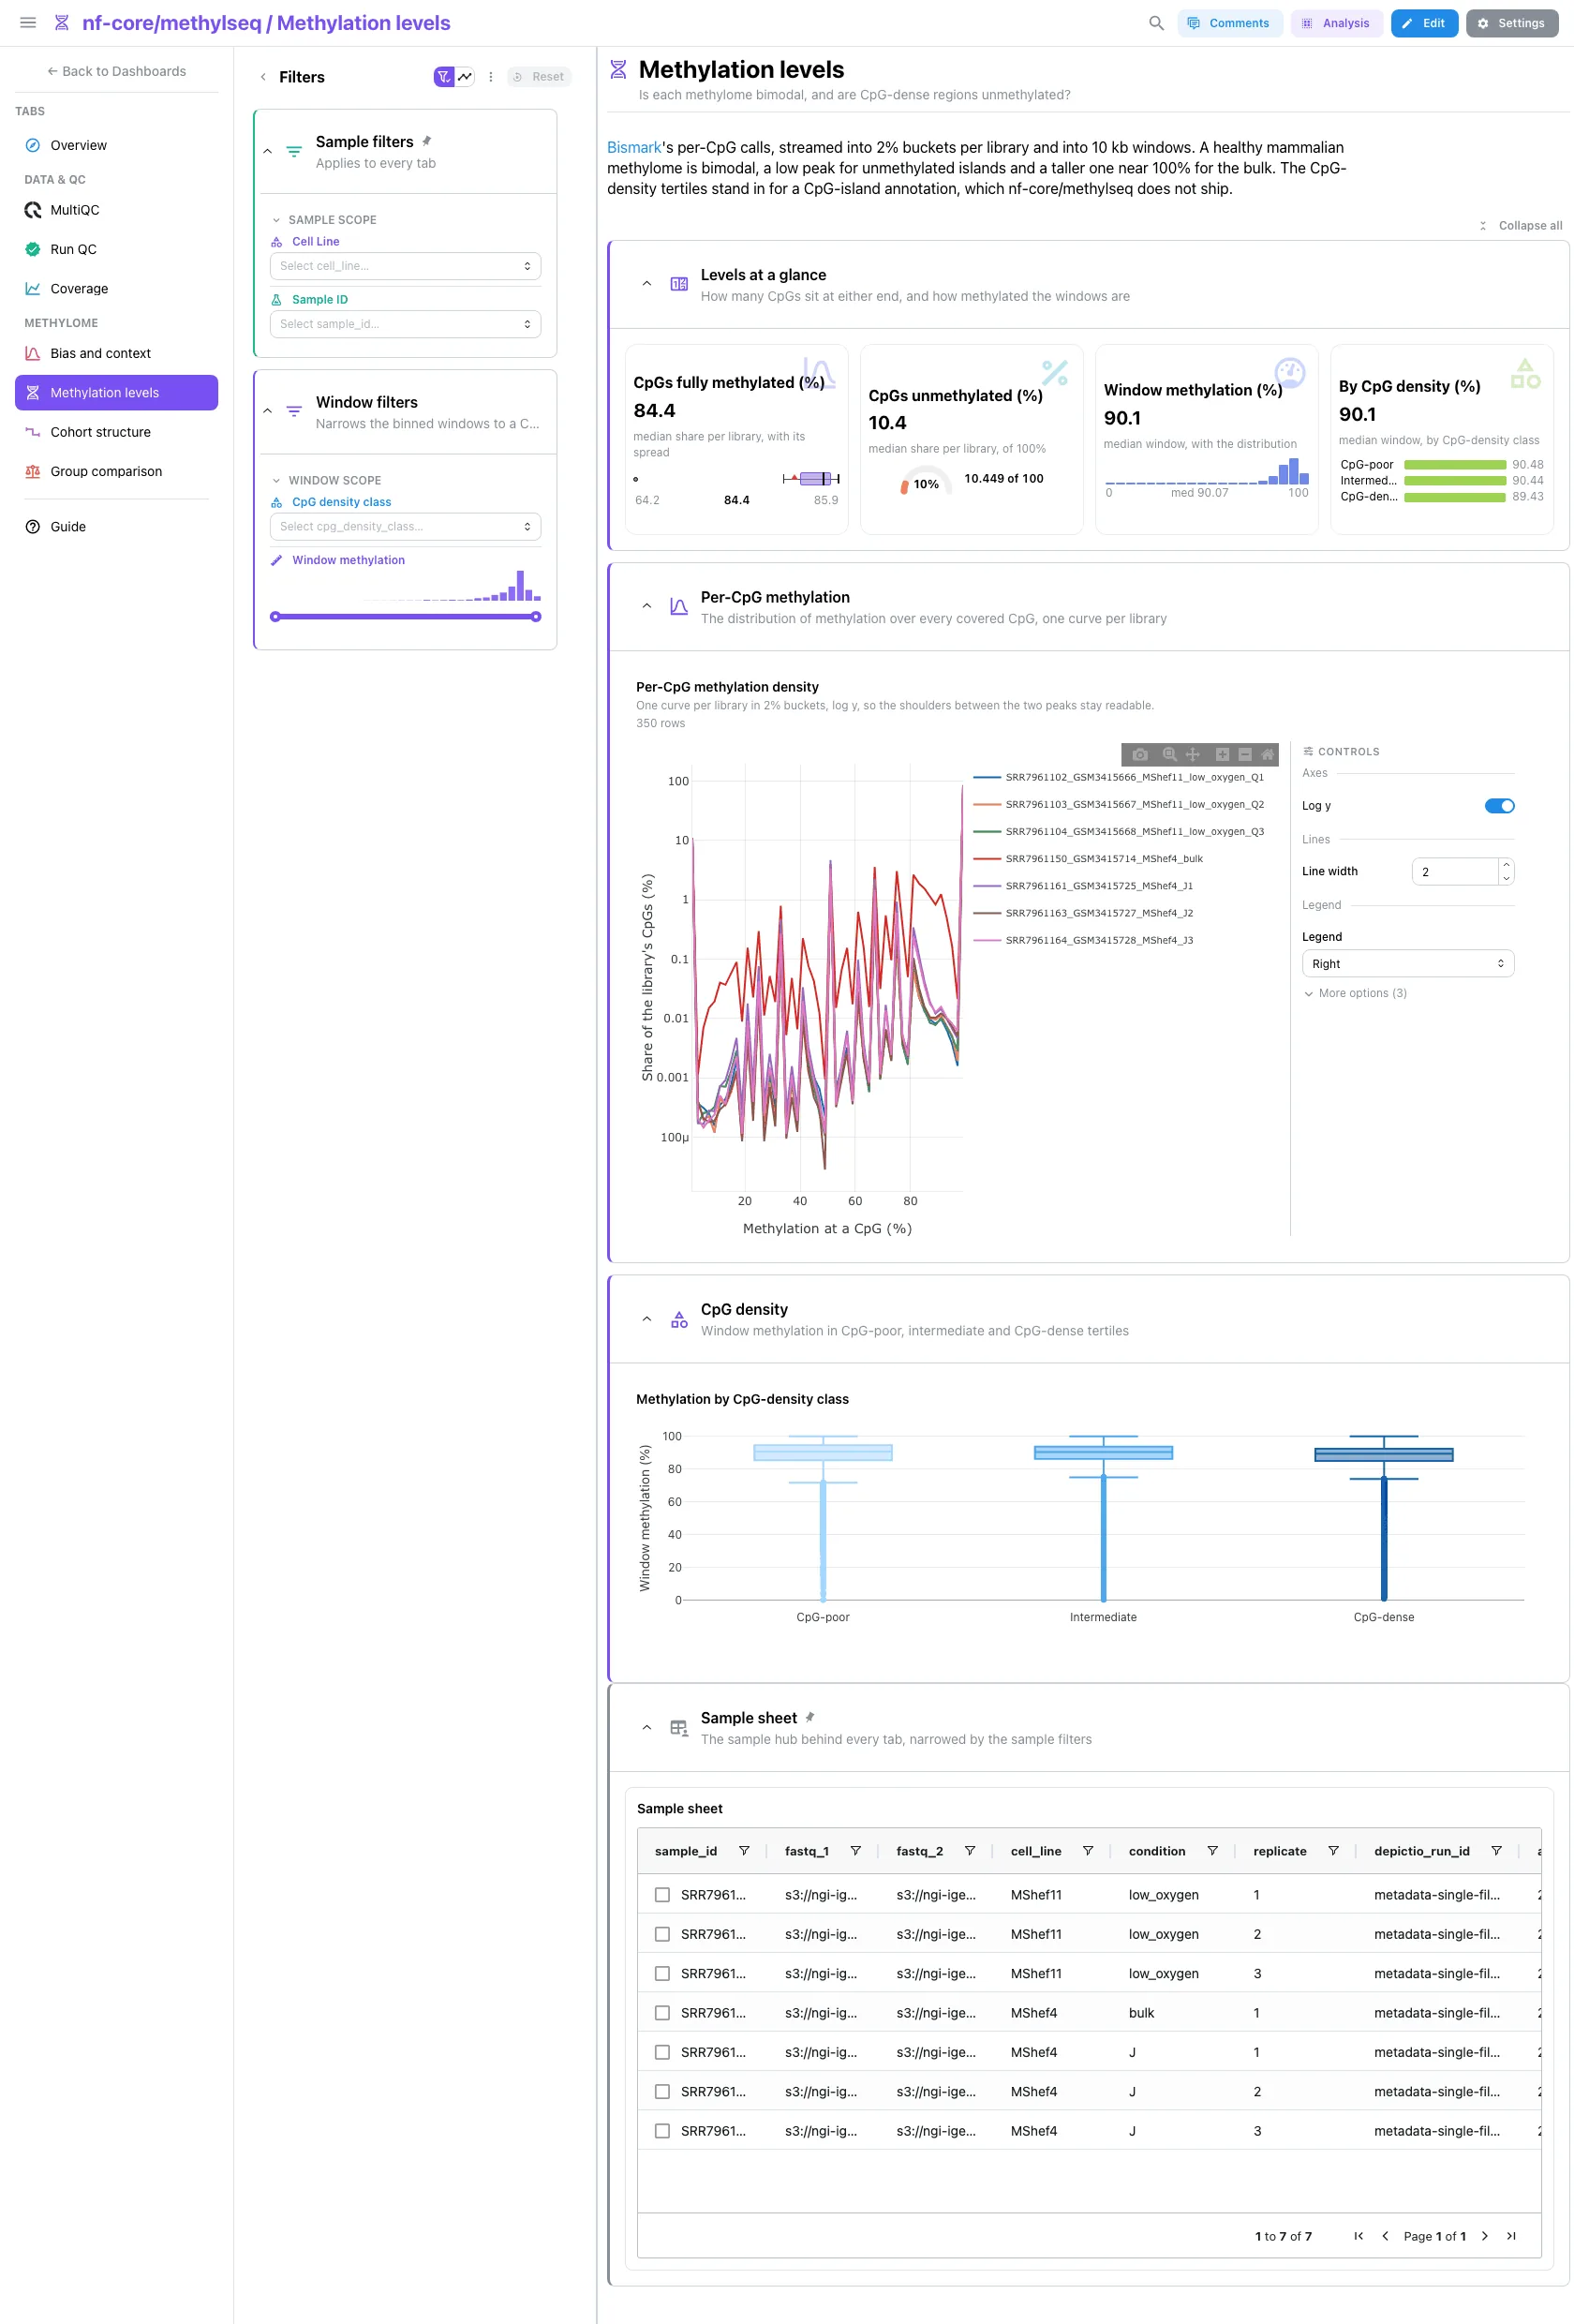
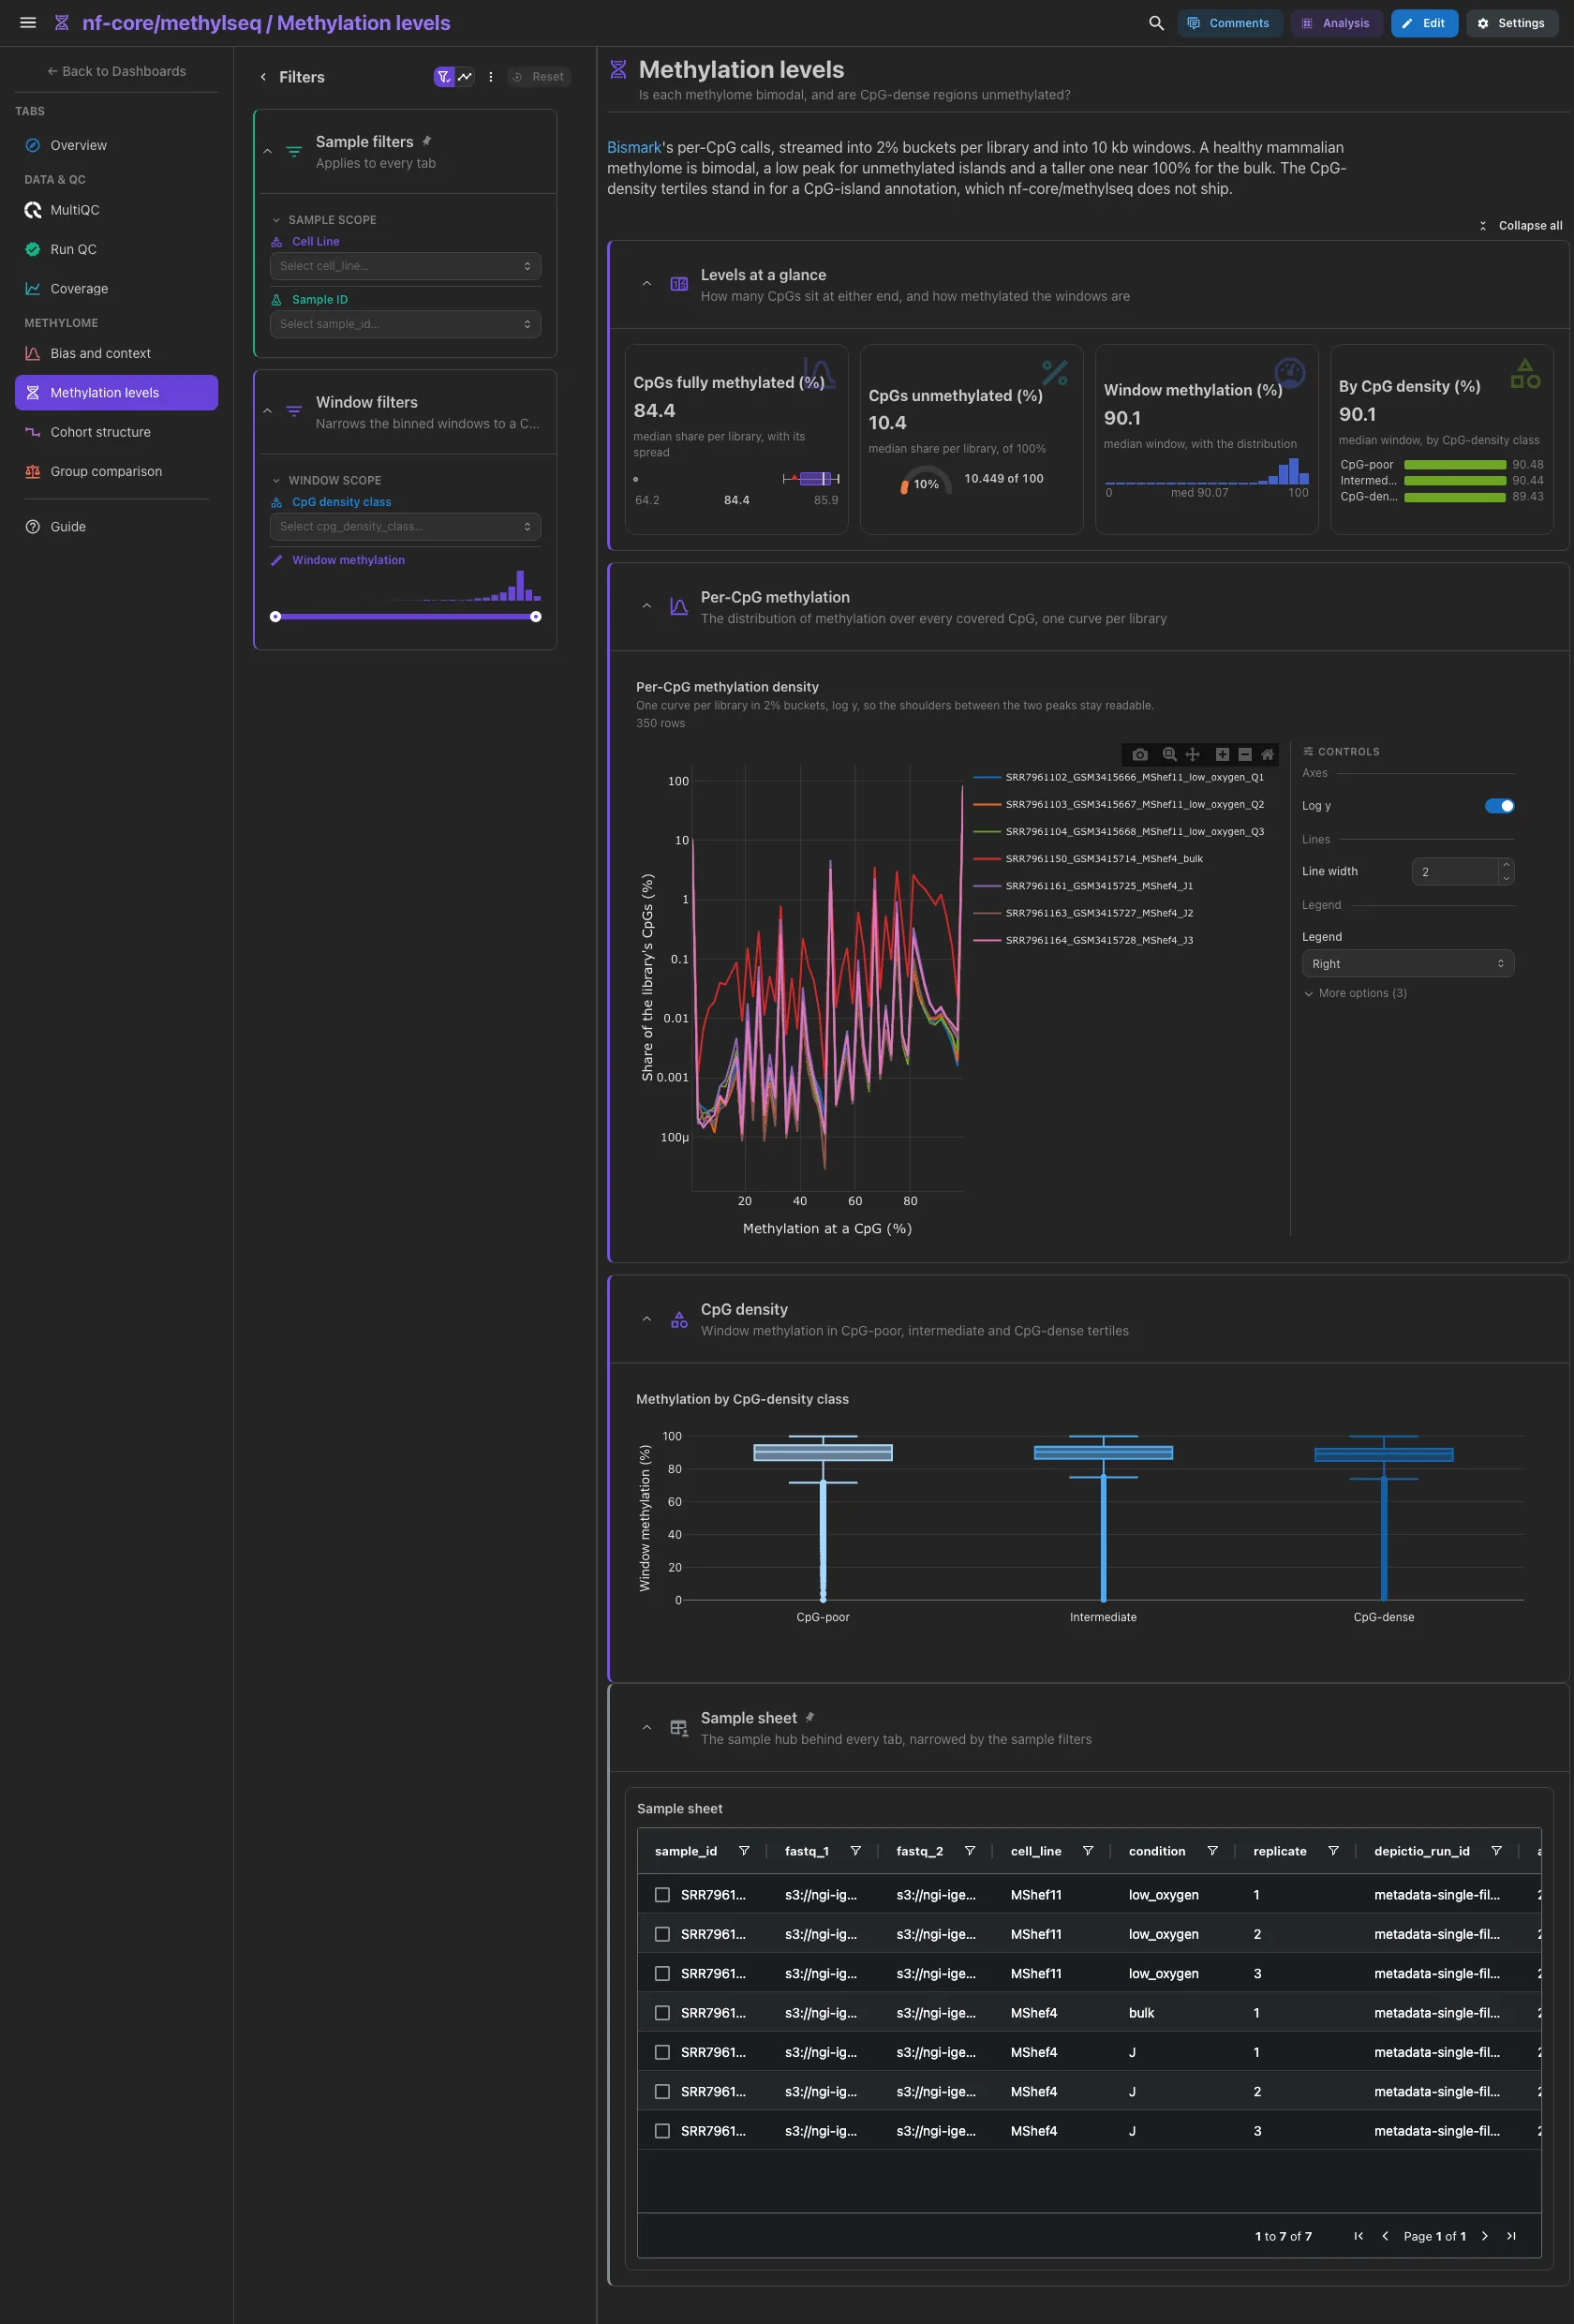
Bismark's per-CpG calls, streamed into 2% buckets per library and into 10 kb windows. The share of CpGs at 98 to 100%, the share at 0 to 2%, the median window methylation and the median window per CpG-density class. Then the per-CpG methylation density, one curve per library, and window methylation by CpG-density class. A healthy mammalian methylome is bimodal. The CpG-density tertiles stand in for a CpG-island annotation, which nf-core/methylseq does not ship. Nothing on this tab is collapsed.
Filters and components
Filters · CpG density class and a Window methylation range on
bismark_binned_methylation.
| Section | What it holds |
|---|---|
| Levels at a glance | 4 cards |
| Per-CpG methylation | 1 advanced visualization |
| CpG density | Methylation by CpG-density class |
Methylome · Do the libraries group by the design?
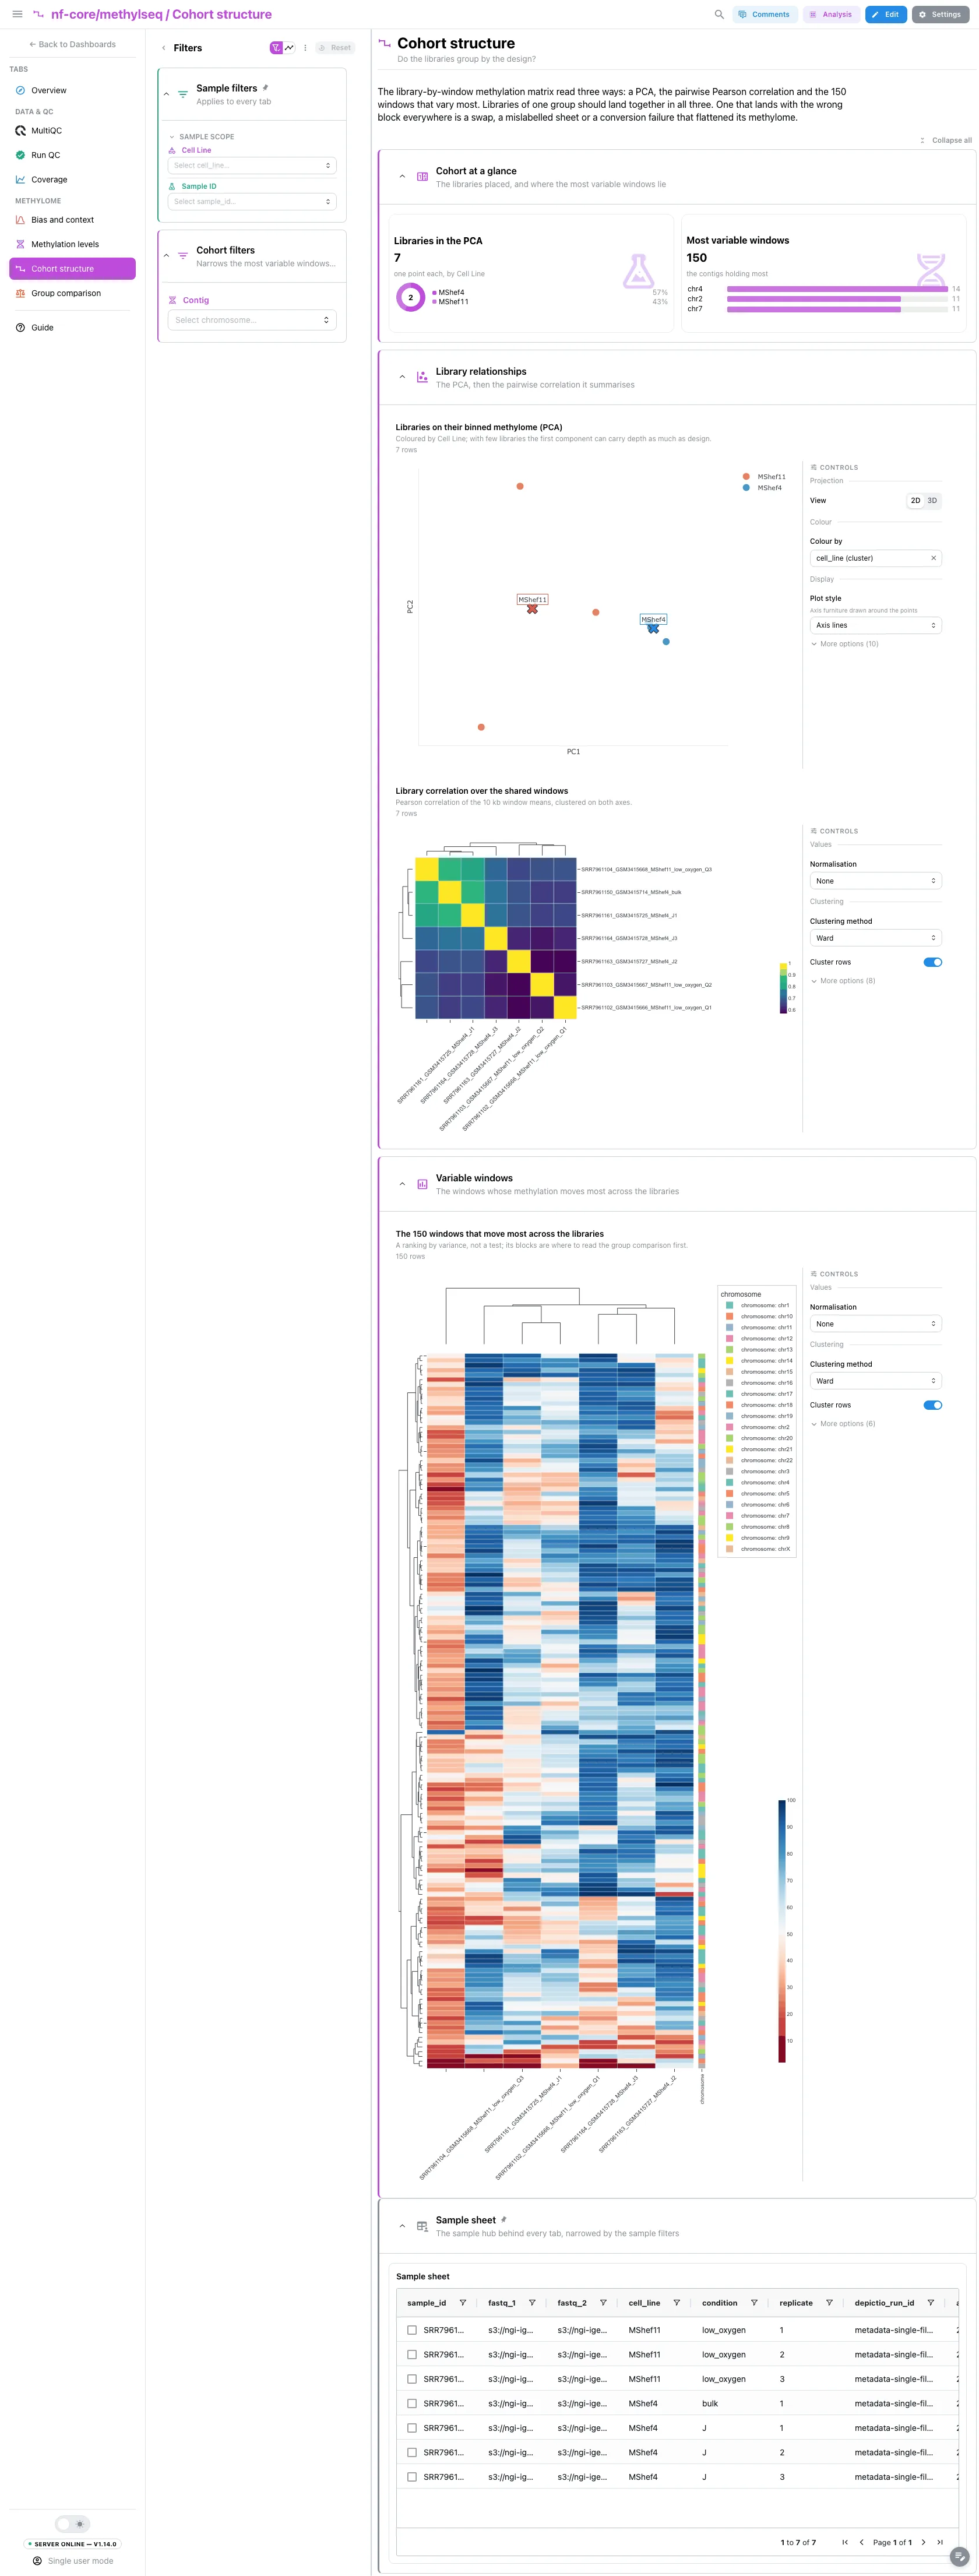
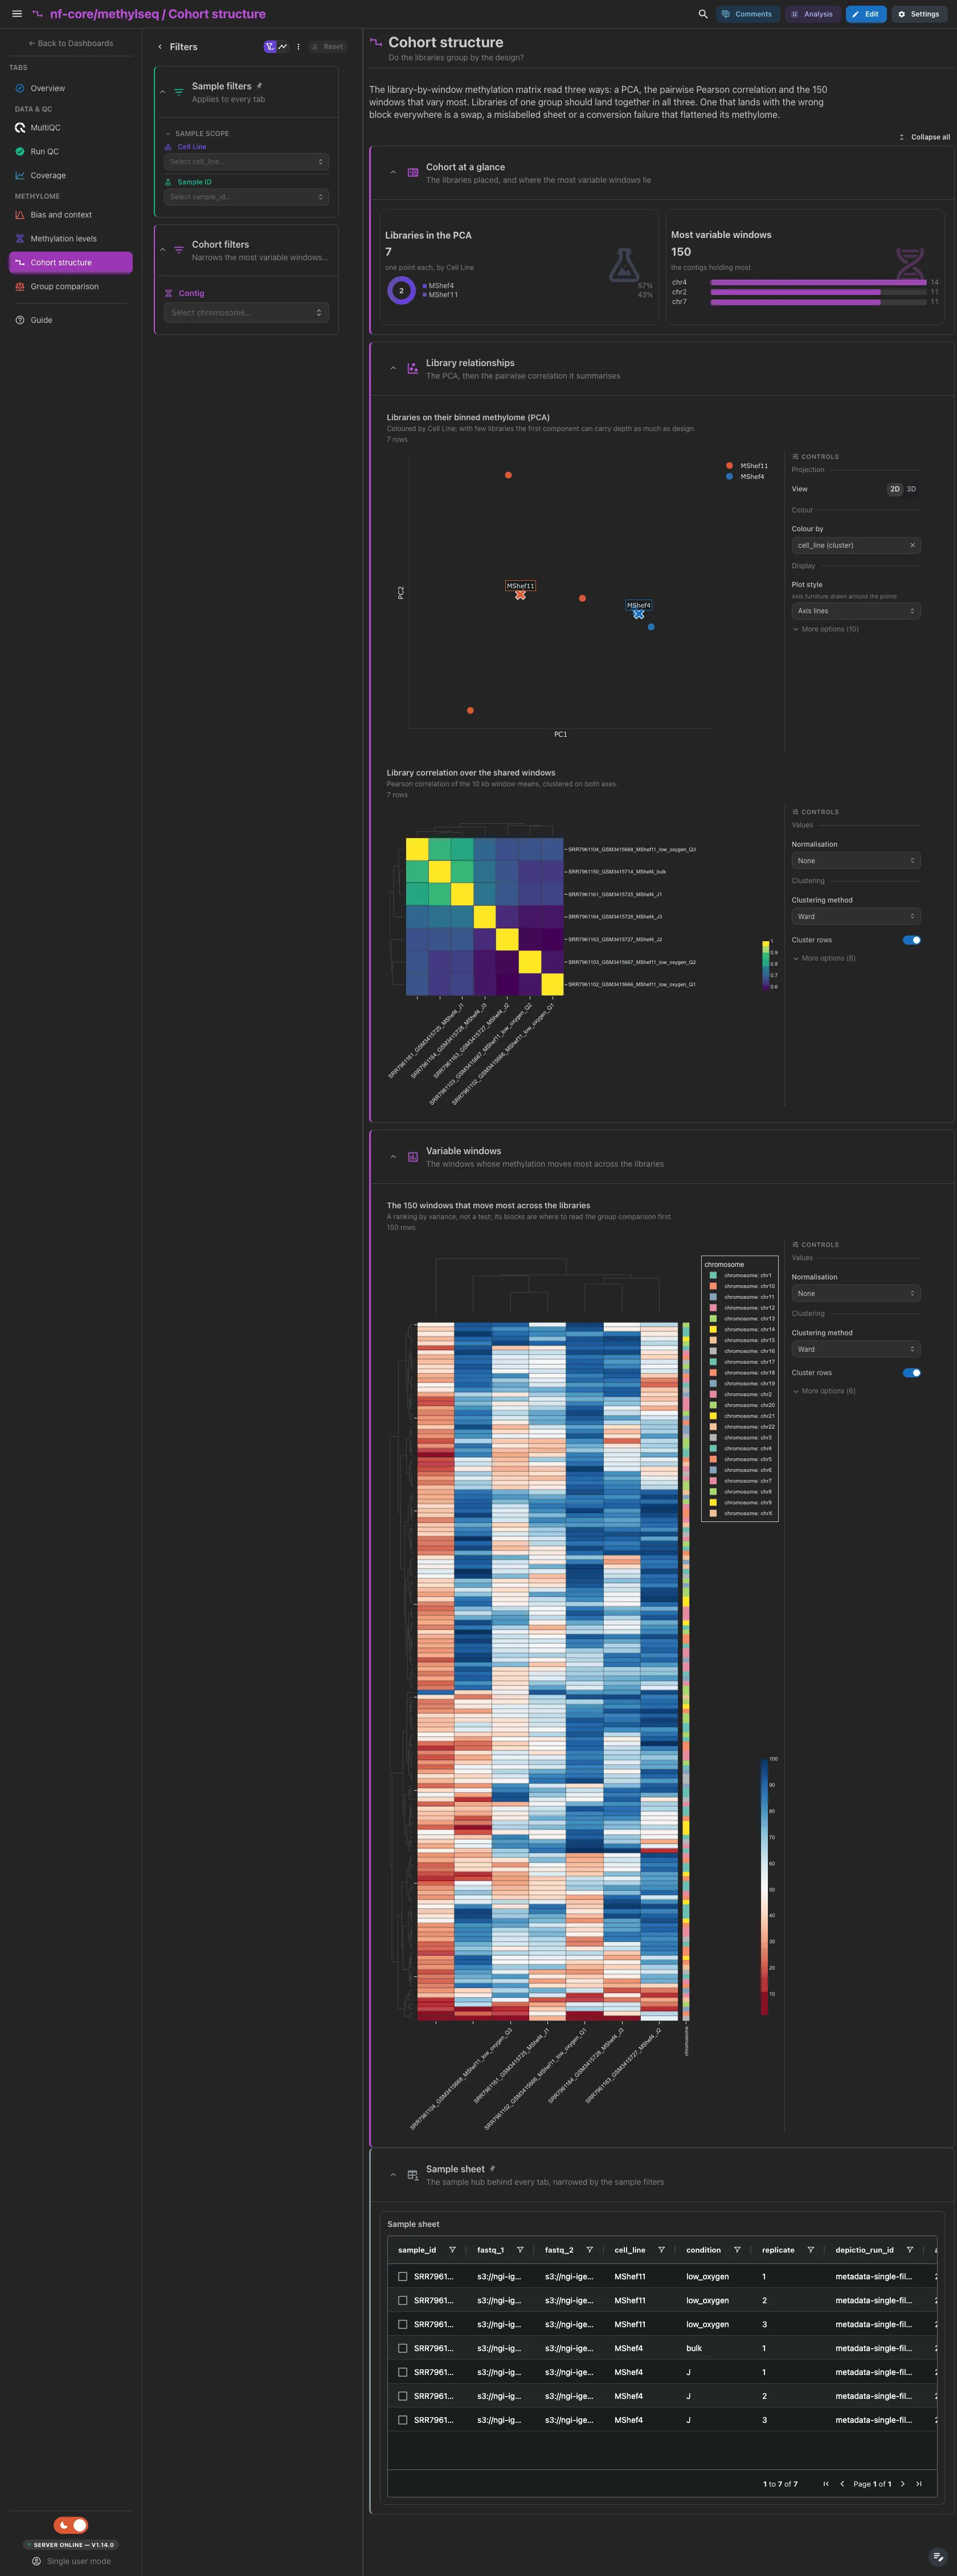
The library-by-window matrix read three ways. The libraries placed by the PCA, as a ring by group, and the 150 most variable windows ranked by contig. Then the PCA coloured by group, where a lasso makes an analysis group, and the pairwise Pearson correlation, clustered. The heatmap of the 150 windows is collapsed, too tall to open by default. A library that lands with the wrong block in all three is a swap, a mislabelled sheet or a conversion failure.
Filters and components
Filters · Contig on bismark_top_variable_windows.
| Section | What it holds |
|---|---|
| Cohort at a glance | 2 cards |
| Library relationships | 2 advanced visualizations |
| Variable windows (collapsed) | 1 advanced visualization |
Methylome · Which windows differ in methylation between the two groups?
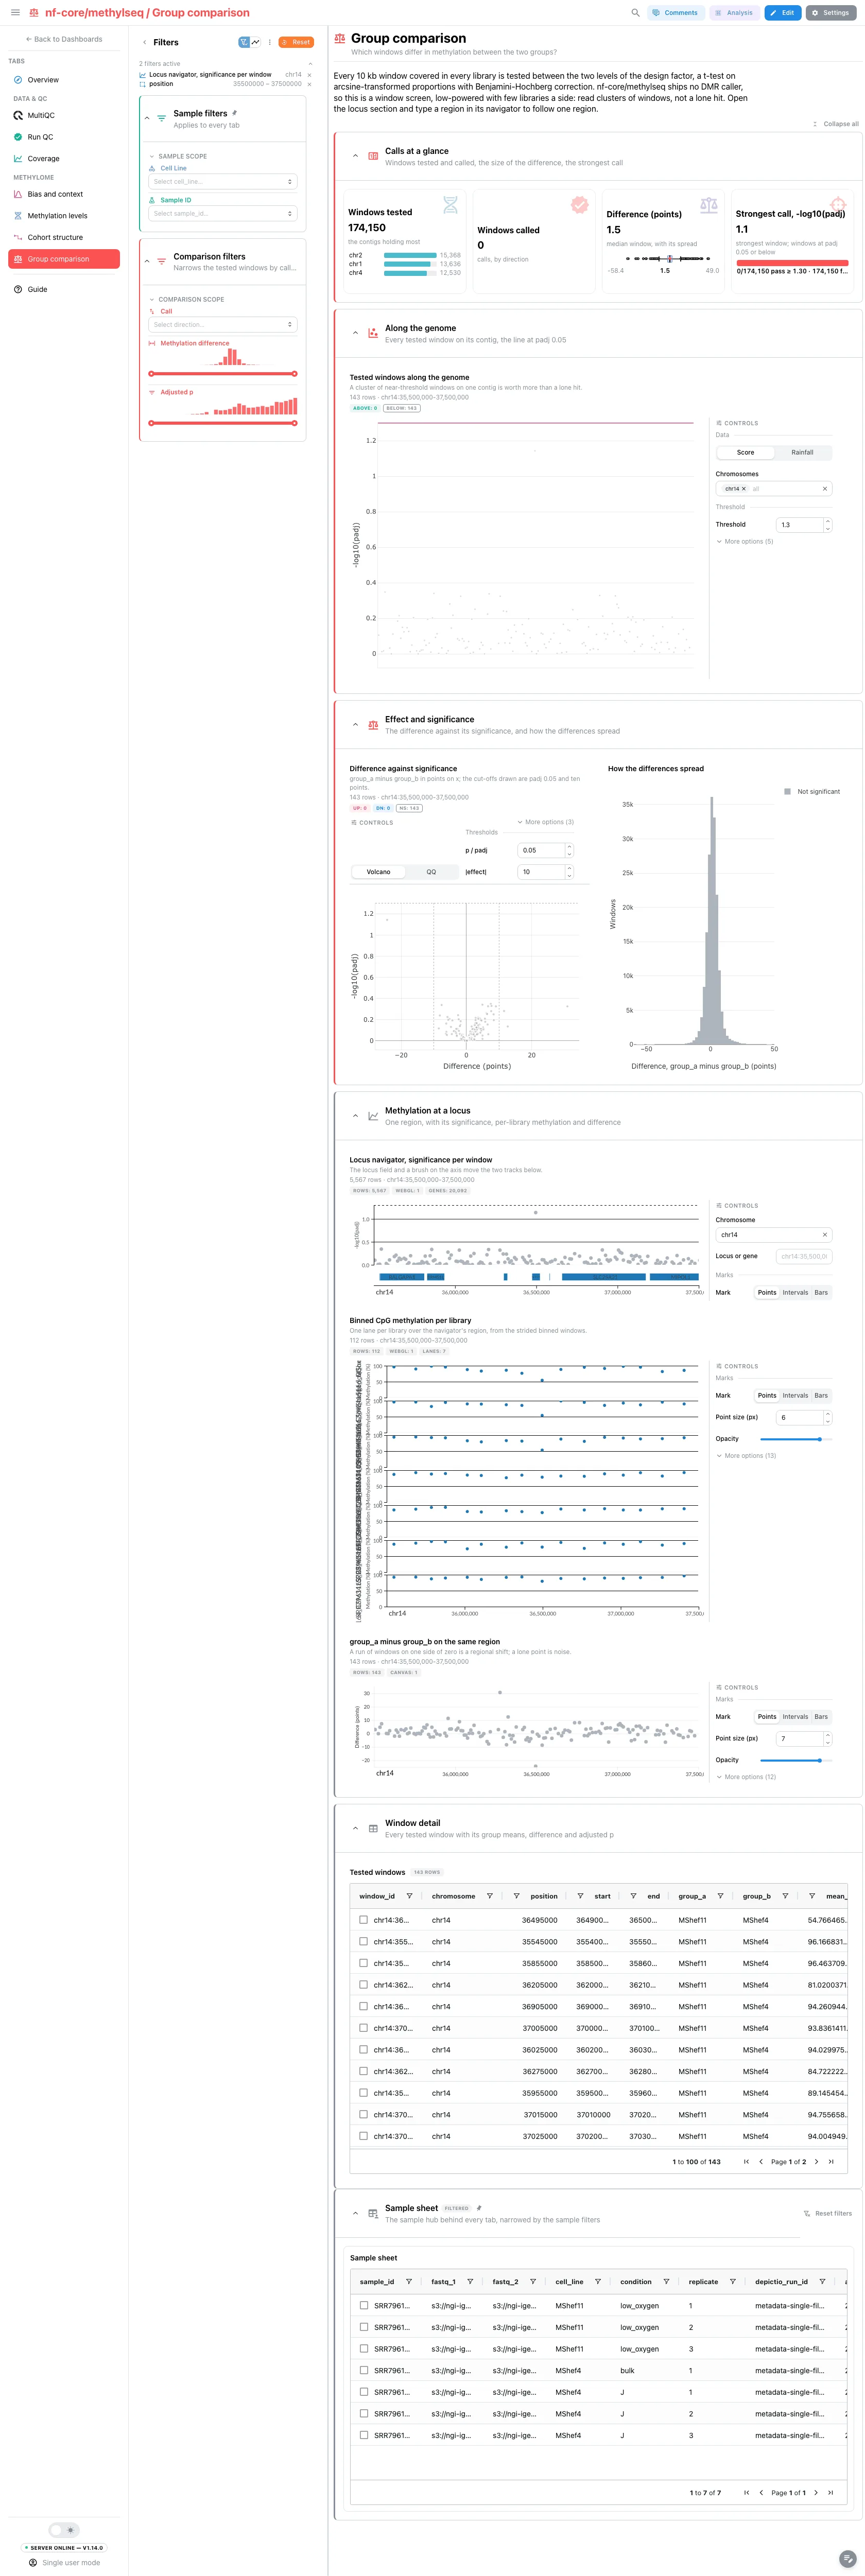
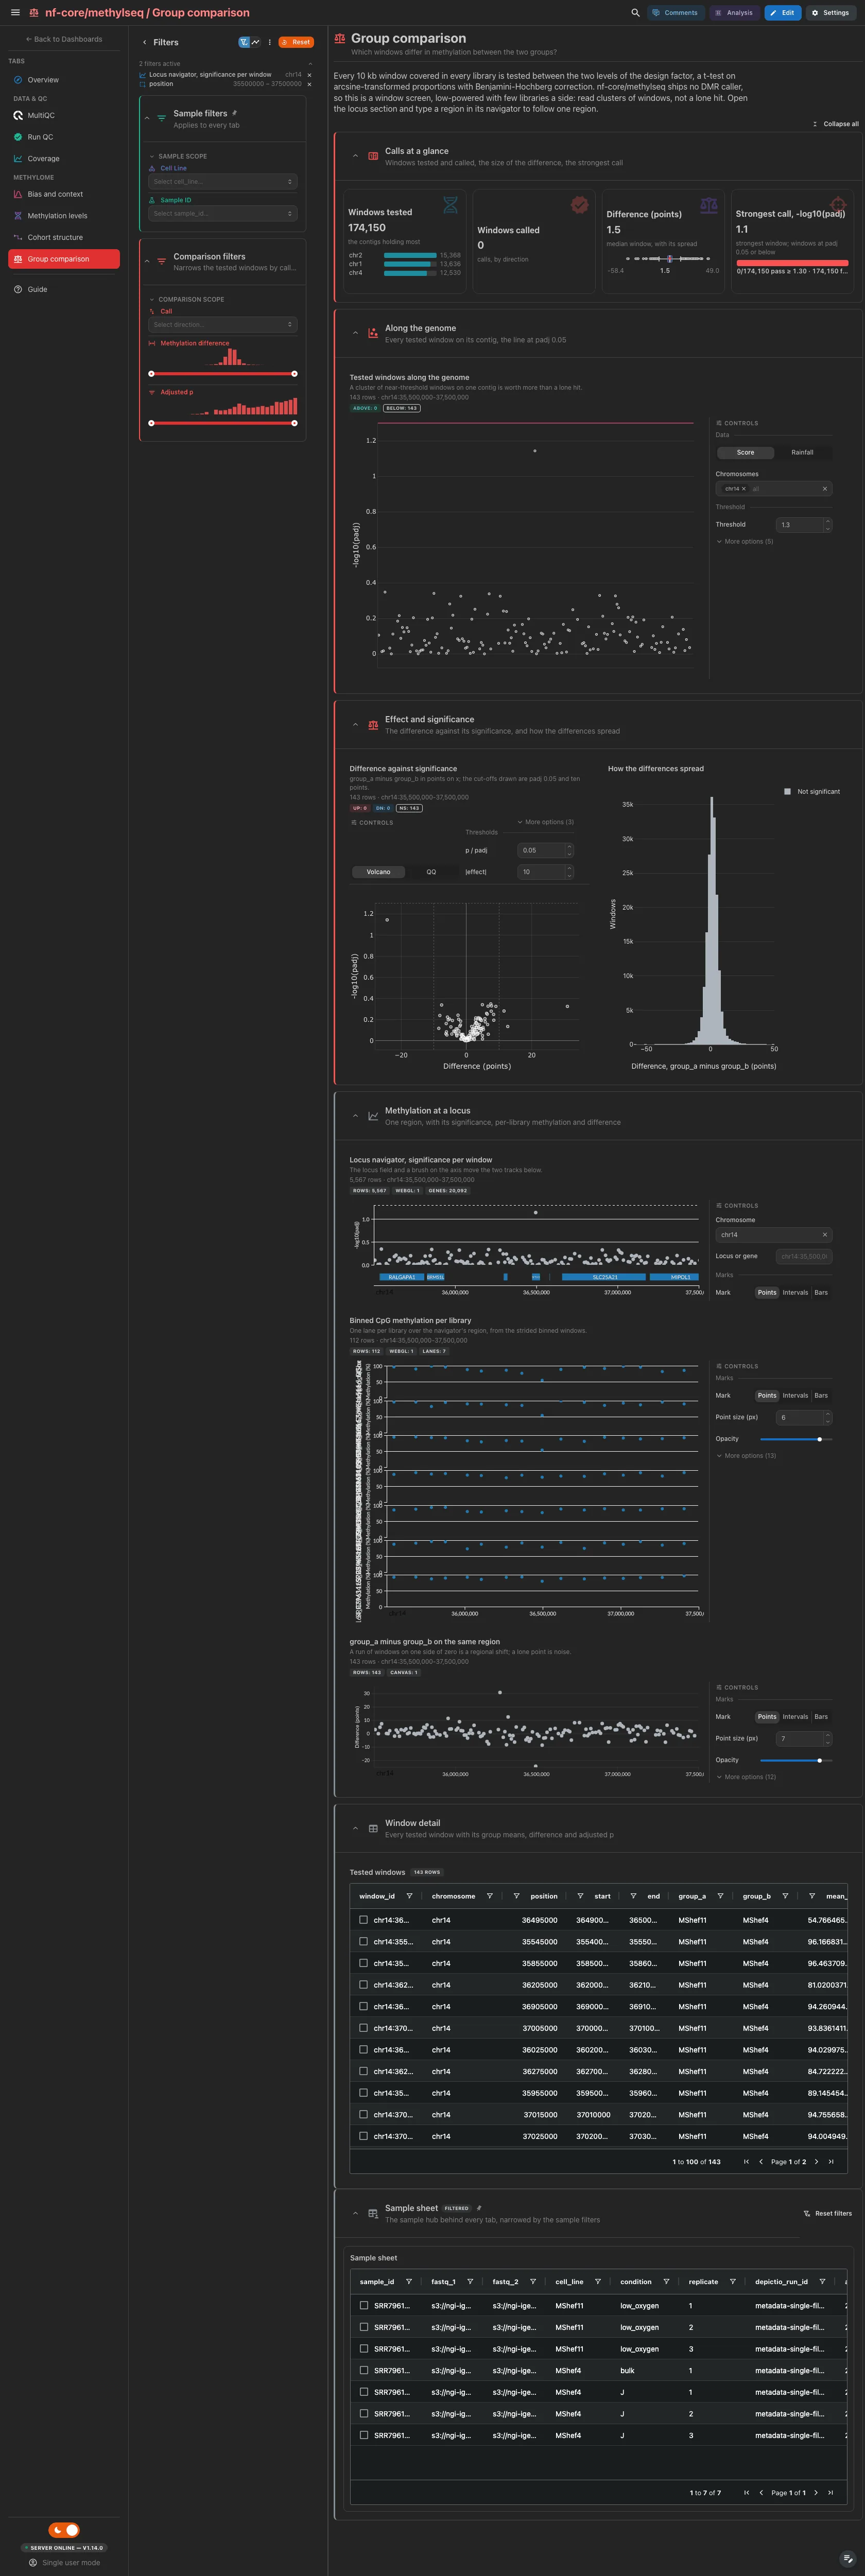
Every 10 kb window covered in every library is tested between the two levels of the design factor, a t-test on arcsine-transformed proportions with Benjamini-Hochberg correction, and called at padj below 0.05 with at least ten points of difference. The windows tested and called, the median difference and the strongest call. Then the Manhattan of every tested window, and the volcano (its View switch draws a QQ plot) beside the spread of the differences. The locus view, a navigator with two tracks on its region, and the window table are collapsed.
Filters and components
Filters · Call, and Methylation difference and Adjusted p
ranges, on bismark_window_group_compare.
| Section | What it holds |
|---|---|
| Calls at a glance | 4 cards |
| Along the genome | 1 advanced visualization |
| Effect and significance | 1 advanced visualization + How the differences spread |
| Methylation at a locus (collapsed) | 3 advanced visualizations: the locus navigator, the binned methylation per library and the group difference on the same region |
| Window detail (collapsed) | Tested windows |
A window screen, not a DMR caller
nf-core/methylseq ships no differential-methylation caller. The unit is a 10 kb window, not a CpG or a called DMR, and with few libraries a side the screen is low-powered by construction: read clusters of windows, not a lone hit. Without a design table, or without a factor of exactly two levels, the comparison is pruned and only the per-library lanes of the locus section remain.
A picked row or point becomes a filter that narrows the other tiles of its
collection and follows the project links to the collections they reach. The
pinned sample sheet selects on sample_id; the Bismark, Qualimap and M-bias
tables and the per-library profiles on sample; the PCA on sample_id; the
tested-window table and the two window tracks on window_id; the Manhattan on
chromosome. The cohort-level collections (correlation, variable windows,
comparison) hold the libraries as columns or test across them, so the sample
filters do not narrow them; their own tab filters do.
Running the pipeline
Depictio reads the output of nf-core/methylseq, it does not run the pipeline. Run the pipeline first on the default Bismark route:
nextflow run nf-core/methylseq -r 2.3.0 \
  --input samplesheet_full.csv \
  --genome GRCh38 \
  -profile docker --outdir results
Then place the samplesheet and a design table beside the results, regenerate the MultiQC report and point Depictio at them:
mkdir -p results/input && cp samplesheet_full.csv design.tsv results/input/
python -m depictio.dev_scripts.multiqc_reprocess --src results/ --dest results/
depictio ingest results/ --template nf-core/methylseq/latest \
  --var METADATA_FILE=results/input/design.tsv
See nf-co.re/methylseq/usage for full pipeline documentation.
Required data structure
Point depictio ingest at the directory holding the pipeline output. Depictio scans
recursively and matches on file name, never on the bismark/ prefix.
<DATA_ROOT>/
├── input/
│   ├── samplesheet_full.csv                   # the hub (required)
│   └── design.tsv                             # METADATA_FILE (optional)
├── pipeline_info/software_versions.yml
├── multiqc/multiqc_data/multiqc.parquet       # written by multiqc_reprocess
├── fastqc/*.zip                               # raw MultiQC inputs
├── trimgalore/*.{txt,zip}
├── bismark/
│   ├── alignments/logs/*_bismark_bt2_PE_report.txt
│   ├── deduplicated/logs/*.deduplication_report.txt
│   ├── methylation_calls/
│   │   ├── splitting_report/*_splitting_report.txt
│   │   ├── mbias/*.M-bias.txt
│   │   └── bedGraph/*.bedGraph.gz             # the methylome and the comparison
│   └── summary/                               # bismark2summary
└── qualimap/<sample>/
    ├── genome_results.txt
    └── raw_data_qualimapReport/*.txt
Validation runs
The template was validated on the nf-core AWS megatest of the 2.3.0 release,
s3://nf-core-awsmegatests/methylseq/results-93bc5811603c287c766a0ff7e03b5b41f4483895/bismark/,
seven paired-end libraries, and the screenshots above come from that run. Its
design table is vendored under the template's input/, built once from the
samplesheet:
DEST=/tmp/methylseq_test
bash depictio/projects/nf-core/methylseq/2.3.0/download_test_data.sh "$DEST"
mkdir -p "$DEST/input" && cp depictio/projects/nf-core/methylseq/2.3.0/input/sample_metadata.tsv "$DEST/input/"
python -m depictio.dev_scripts.multiqc_reprocess --src "$DEST" --dest "$DEST"
depictio ingest "$DEST" --template nf-core/methylseq/latest \
  --var METADATA_FILE="$DEST/input/sample_metadata.tsv"
Do not pass --project when ingesting: the dashboard is attached to the
project by name, so renaming it breaks a later depictio dashboard import.
Re-ingesting accumulates dashboards, so delete the project before repeating a run.
Additional resources
- nf-co.re/methylseq: official pipeline documentation
- nf-co.re/methylseq/2.3.0/results: AWS test results
- Template System Reference: YAML format, variables, conditionals
- Recipes: how to read, test, and write recipes
Authorship
 weber8thomas
Reviewing a template on your own data, or taking over a role here, is a contribution in itself: the contributing guide says what each one involves.