Getting Started with Depictio
This guide will help you get started with Depictio after installation. It covers the basic concepts and workflows to help you begin visualizing your data.
First Steps
Installation
If you haven't installed Depictio yet, please refer to the installation guide for detailed instructions on how to set up Depictio using Docker Compose, or Helm.
Accessing the Web Interface
After installation see the installation guide, you can access the Depictio web interface. If you used Docker Compose or the helm chart with a local setup, the default port is 5080. Open your web browser and navigate to:
Logging In
When you first access Depictio, you'll be prompted to log in with the admin credentials you set before starting the service.
Admin credentials are set at installation time
The initial admin account is created from two environment variables that must be configured before the first start:
DEPICTIO_BOOTSTRAP_ADMIN_EMAIL— the admin email addressDEPICTIO_BOOTSTRAP_ADMIN_PASSWORD— the admin password (≥ 16 characters; the server refuses to start if this is absent or too short)
See the installation configuration guide for details on where and how to set these variables.
Use existing demo data
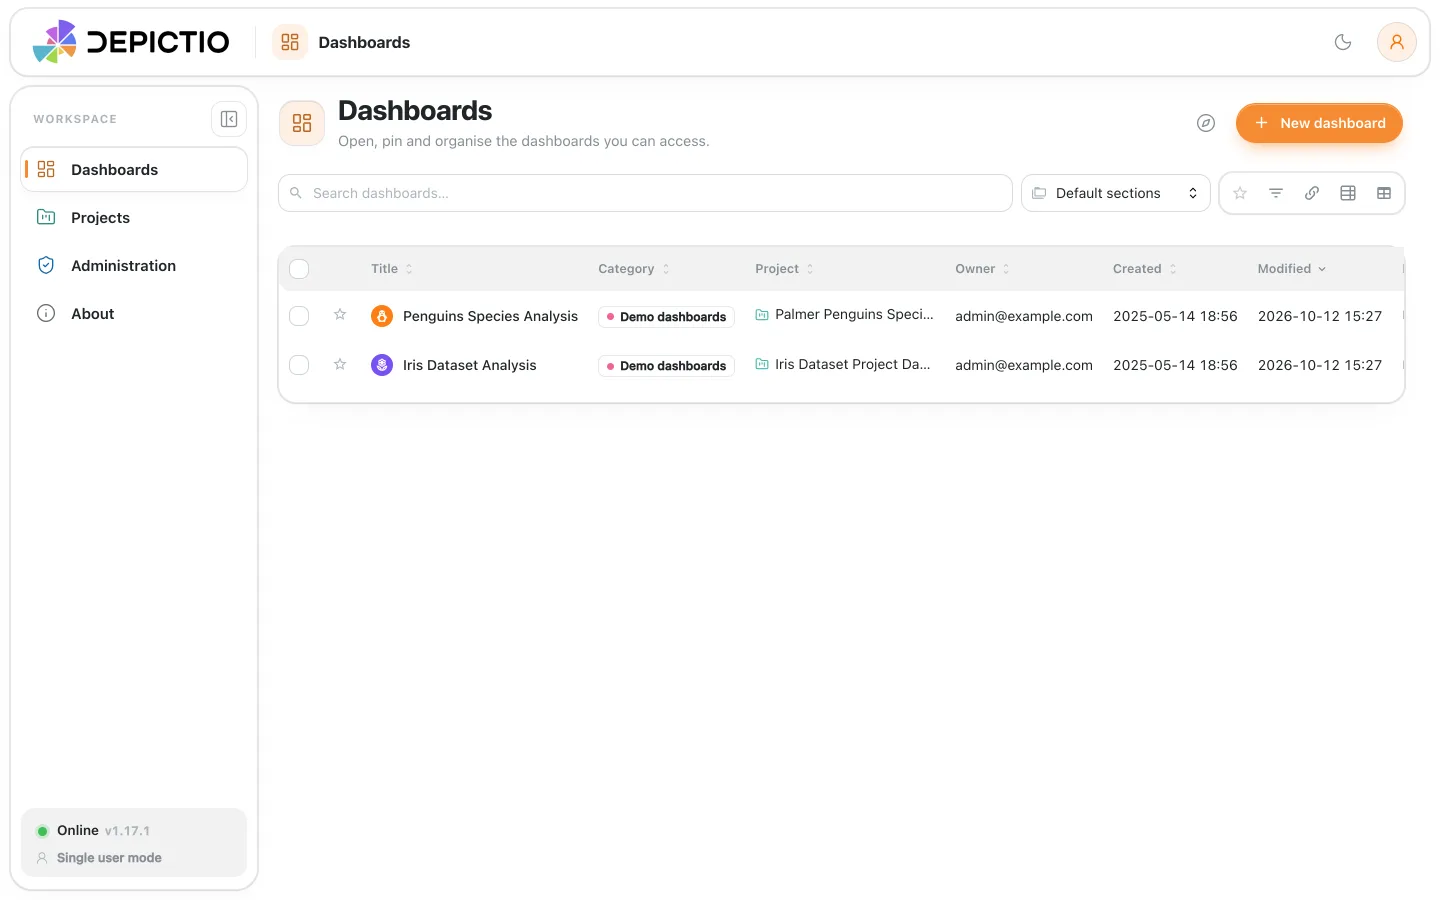
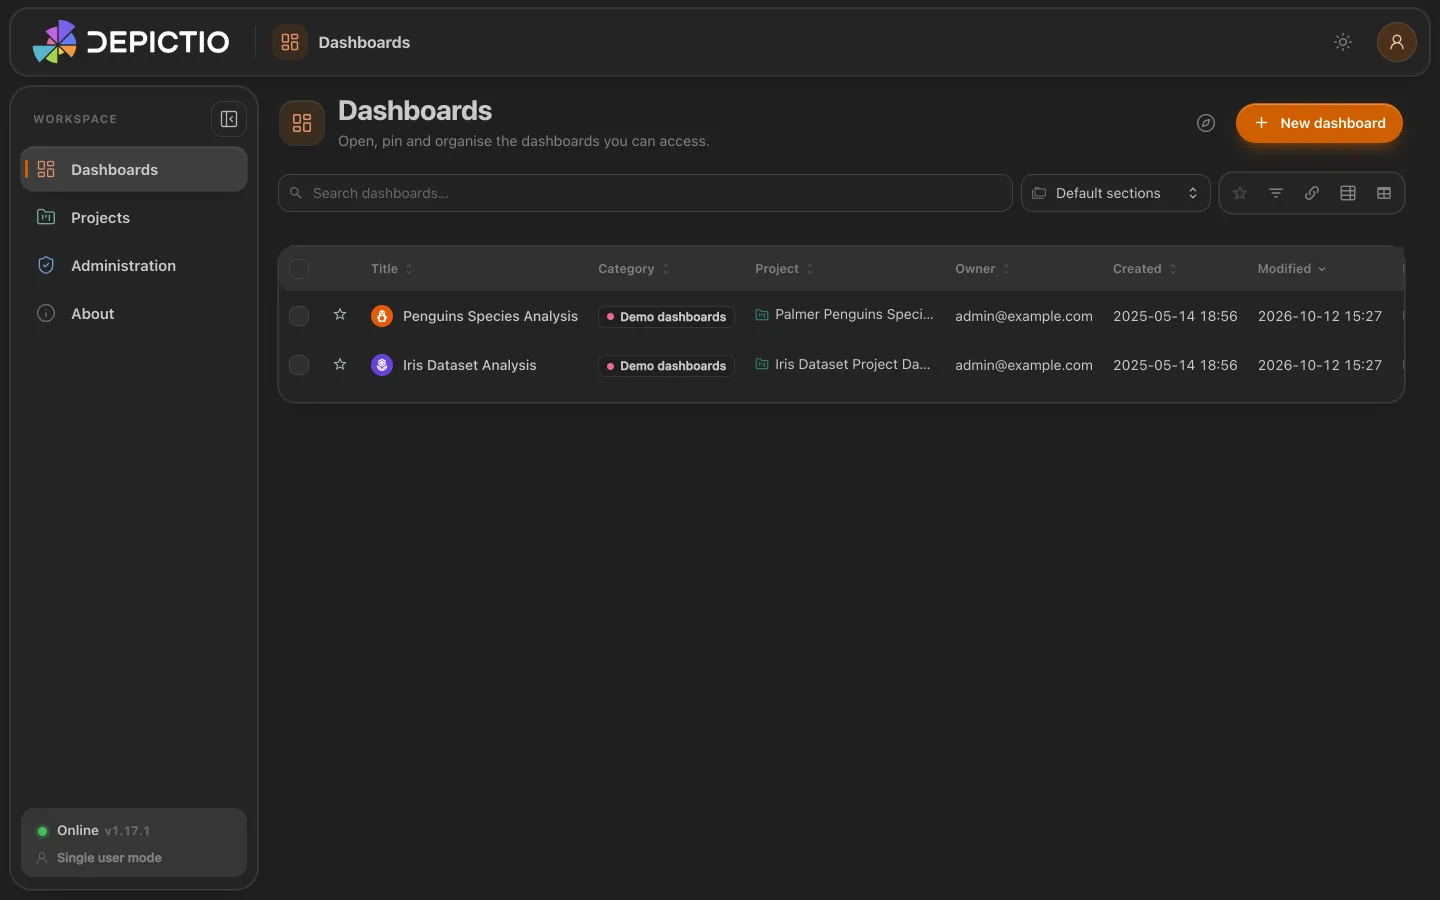
If you want to explore Depictio with existing demo data, you can use the provided registered iris dataset. A demo dashboard is also already created for you to explore. You can access it by clicking on the "Iris Dashboard" on the landing page.
Register your first project
Using the Web Interface
- Open the Projects section: Click on the "Projects" link in the sidebar.
- Click on "Create Project": This will open the project creation form.
-
Select Basic Project and enter project details:
- Project Name: Enter a name for your project.
-
Description: Optionally, provide a description for your project.
- Advanced: For workflow-based projects with multiple data collections.
-
Navigate to the "Data Collections" tab: This is where you will add your data.
-
Add Data Collections:
- Click on the "Create Data Collection" button.
- Enter a name for your data collection.
- Fill in required information such as:
- Data Collection Name: A unique name for your data collection.
- Description: Optionally, provide a description for your data collection.
- File format: Choose the format of your data (e.g., CSV, Parquet).
-
Upload Data:
- Drag and drop your data files or use the file picker to select files from your local system.
- Supported formats include CSV, TSV, Excel, Parquet, and Feather.
🎬 Basic Project Creation: Watch how to create a basic project from scratch - upload data, configure settings, and start visualizing in minutes
Using the CLI
Use the command-line interface to programmatically manage your Depictio projects and data.
Install the CLI
Depictio provides a command-line interface (CLI), the depictio command, for managing data ingestion and other tasks. You can install it by following the CLI installation guide.
Create a CLI configuration
Once you have installed the CLI tool, you need a configuration file to interact with Depictio. It holds the address of your Depictio instance and a long-lived token that signs the CLI in as you.
-
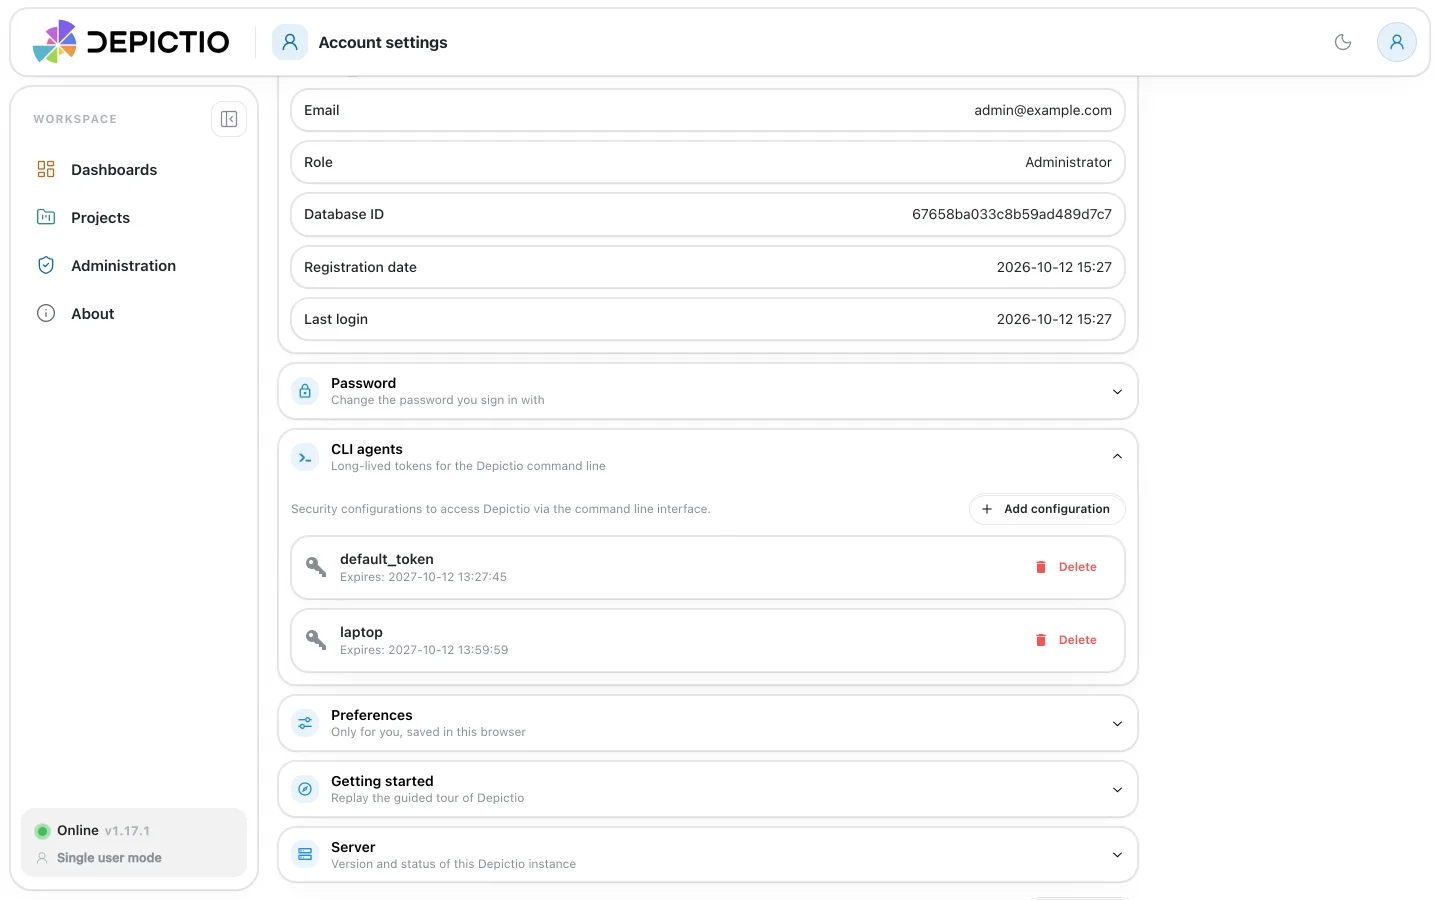
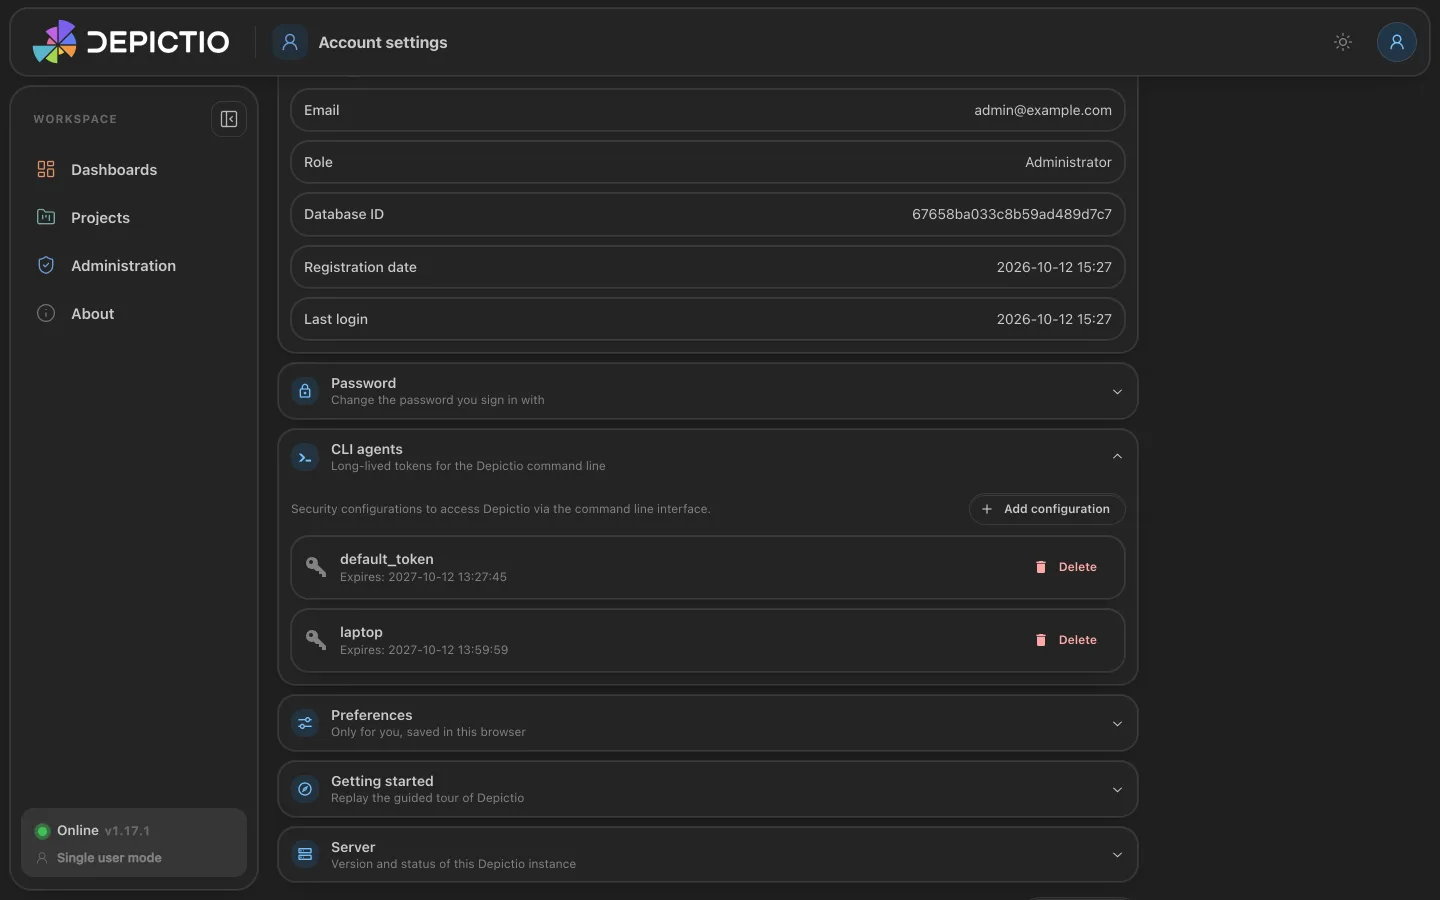
Open Account settings with your avatar in the top bar, and the CLI agents section (v1.17.0+; before, a separate CLI agents page).
-
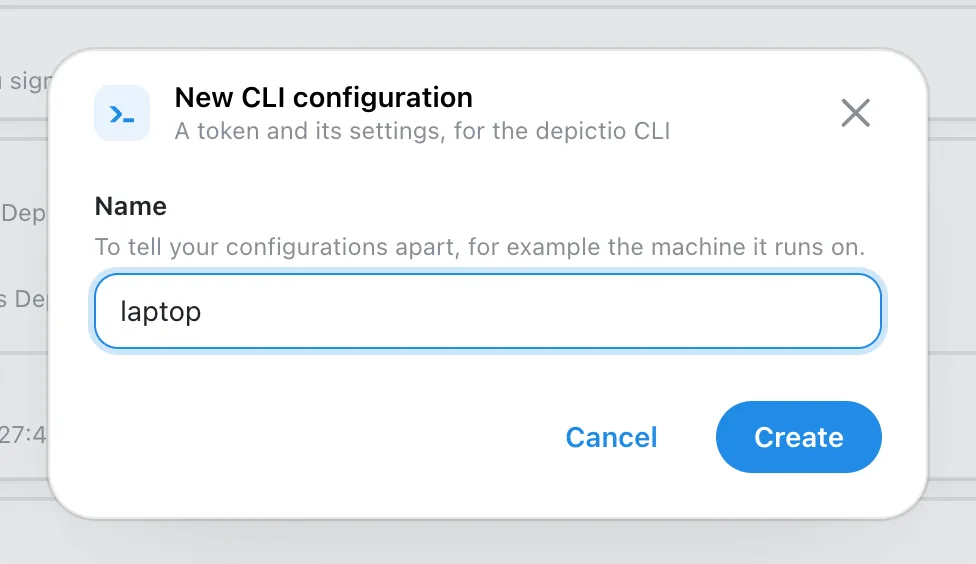
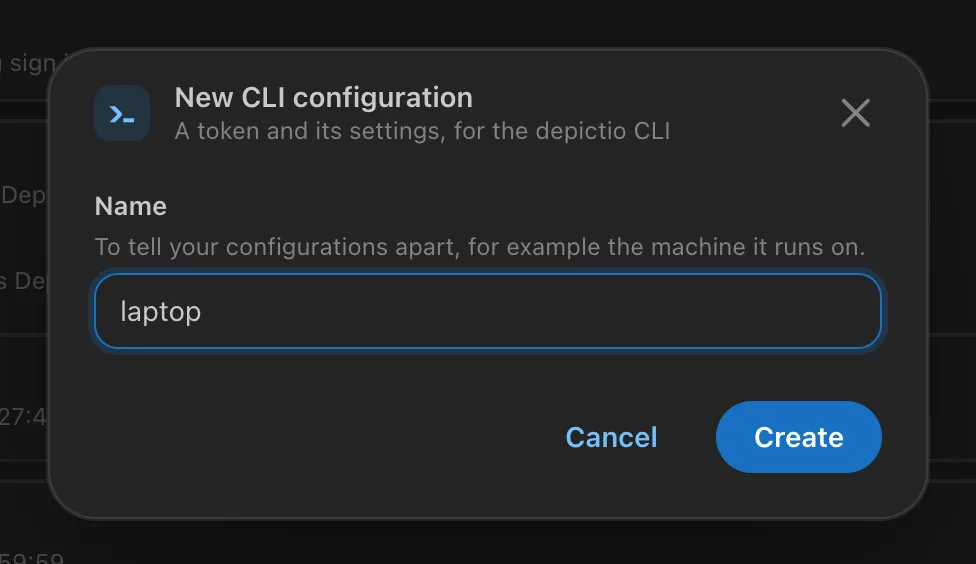
Click Add configuration, give the configuration a name that tells it apart, such as the machine it runs on, and click Create.
-
Save it: Download the file, or Copy it, as
~/.depictio/CLI.yaml. The token is shown only once, and it signs the CLI in as you: keep the file private. -
Check the connection from the machine you saved it on:
The file looks like this (abridged):
# ~/.depictio/CLI.yaml
api_base_url: http://localhost:8058
user:
  id: 67658ba033c8b59ad489d7c7
  email: admin@example.com
  is_admin: true
  token:
    access_token: >-
      eyJhbGciOiJSUzI1NiIsInR5cCI6IkpXVCJ9...
    token_type: bearer
    token_lifetime: long-lived
    expire_datetime: '2027-10-12 13:59:59'
    name: laptop
s3_storage:
  service_name: localhost
  service_port: 9000
  external_host: localhost
  external_port: 9000
  external_protocol: http
  bucket: depictio-bucket
  root_user: minio
  root_password: minio123
Use the CLI tool
You can now use the CLI tool to interact with your Depictio instance. For example, you can list available workflows, upload data collections, and manage your projects. Refer to the CLI usage documentation for detailed usage instructions.
Saved as ~/.depictio/CLI.yaml, the configuration is the one every command uses by default, so none of them needs --server. See Which server a command uses for the other ways to name a server.
With no ~/.depictio/CLI.yaml, the CLI uses the local server: here pipeline results are previewed, then ingested into it:
In that get started guide, you can use the palmer penguins dataset to test the CLI tool. This dataset mimics the palmer penguins dataset, which is a popular dataset for testing data visualization tools.
This command will run the CLI tool with the default configuration file and the specified project configuration file. This will create a new project in Depictio with the palmer penguins dataset, including 2 data collections: physical_features and demographic_data.
Once the data ingested into the system, you can go to the web interface and see the project created in the Project Management section.
Video Tutorial
Creating Your First Dashboard
To create your first dashboard using the palmer penguins dataset, click on + New Dashboard in the top right corner of the web interface.
This will open the dashboard creation modal. Pick the Palmer Penguins Species Comparison project, give the dashboard a name, and confirm.
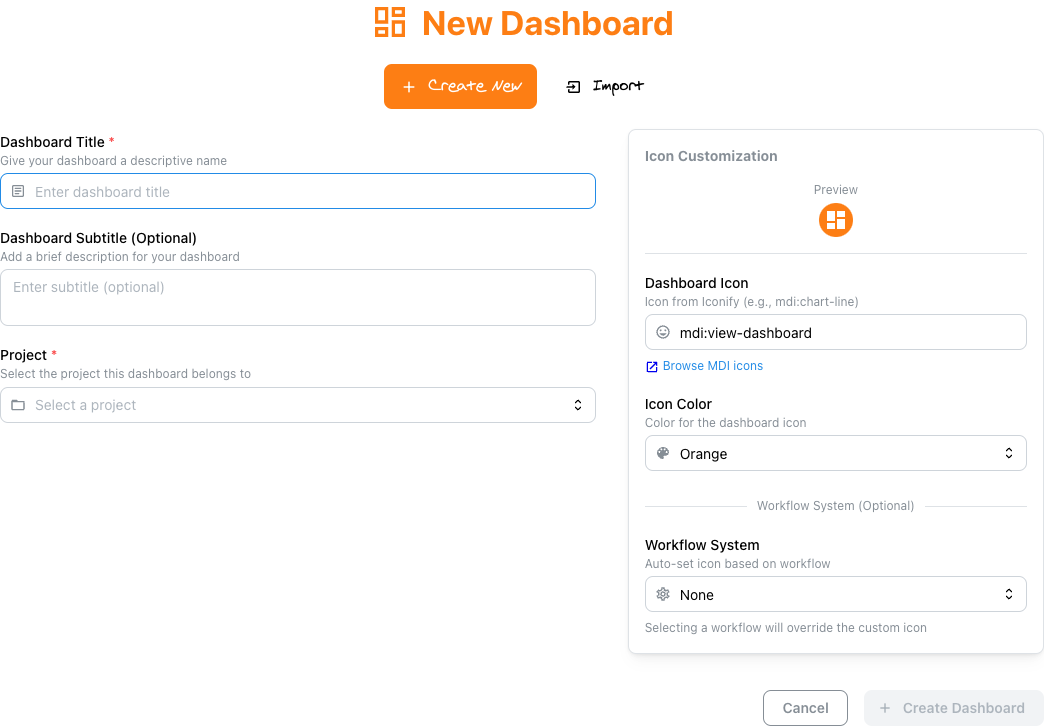
You will land in the editor for the new dashboard, where you can add components. The screenshot below shows the editor against an existing ampliseq dashboard for reference.
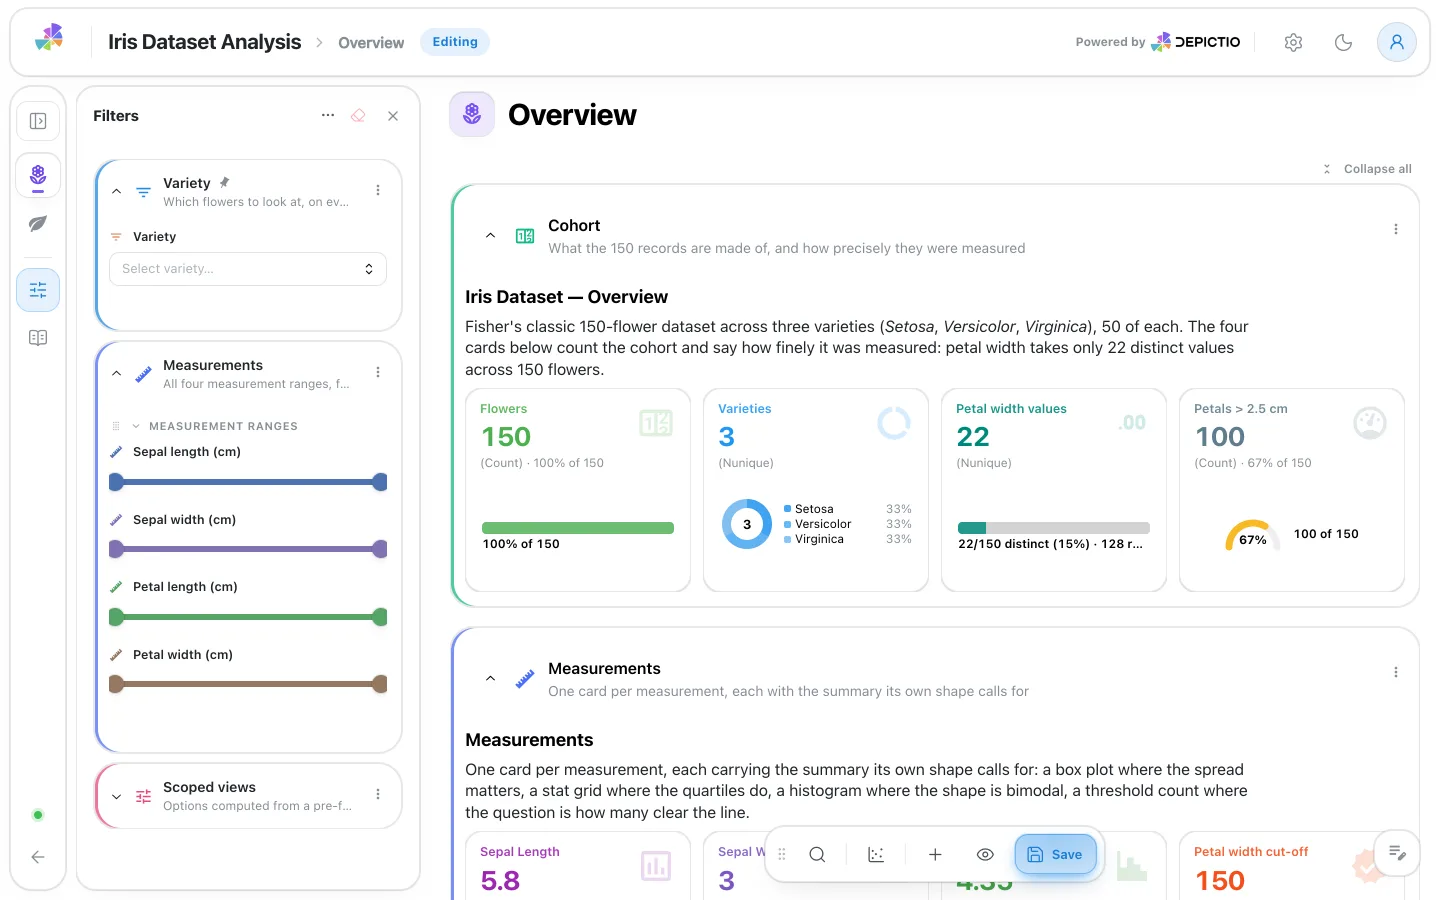
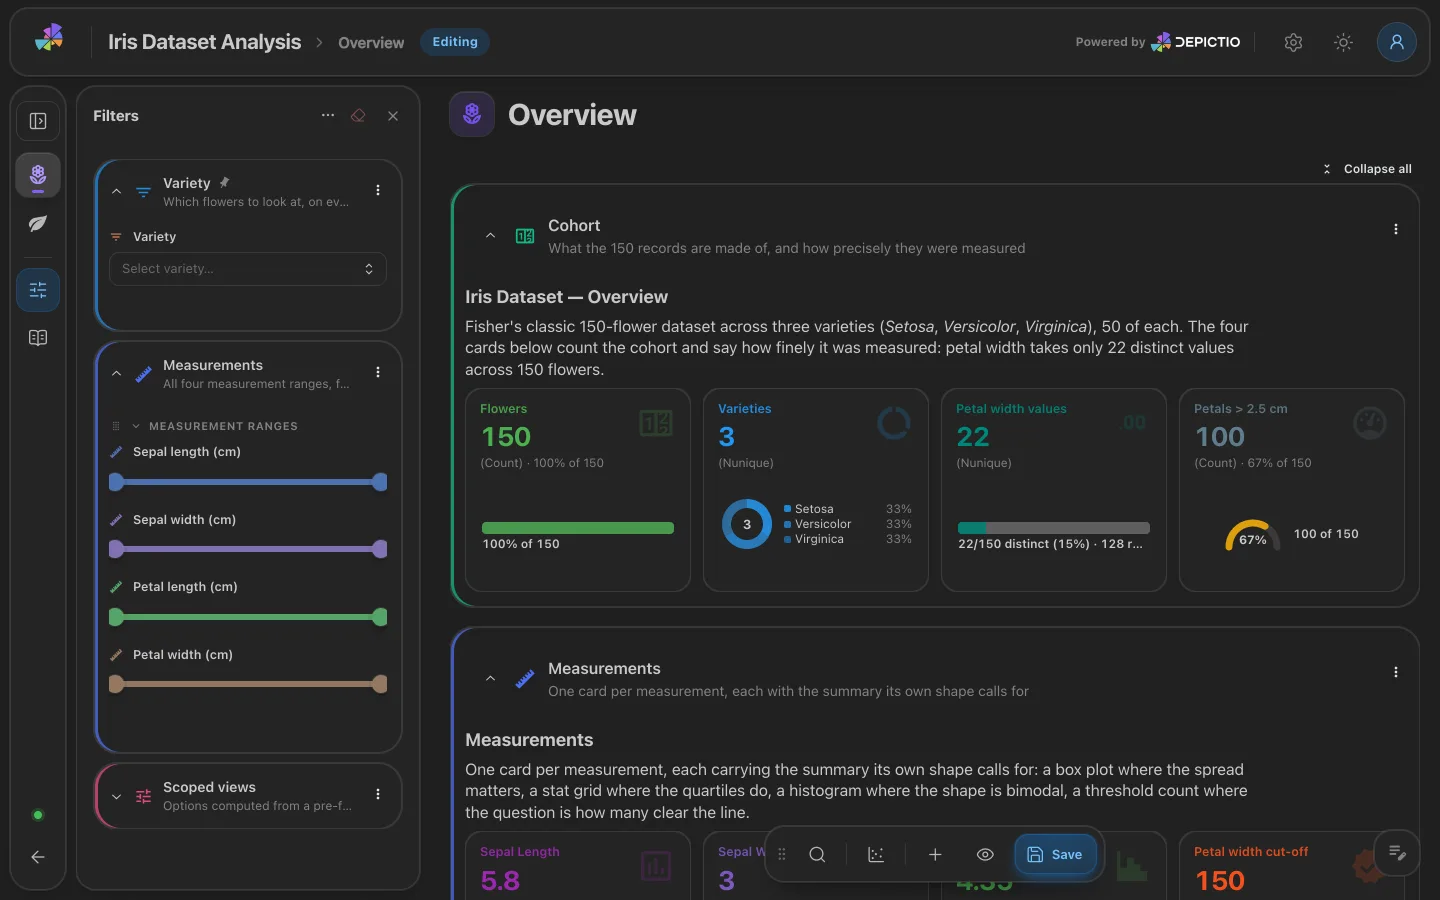
Then follow the dashboard creation guide and dashboard usage guide. These guides will walk you through the process of designing a dashboard, adding components, and configuring interactivity.
Next Steps
Now that you understand the basics, you can:
- Learn more about dashboard creation
- Explore the dashboard components
- Set up the CLI for your own data
- Understand the API for integration
Troubleshooting
If you encounter issues:
- Check the FAQ for common problems and solutions
- Review the logs for error messages
- Ensure your data is in a supported format
- Verify that all services are running correctly
- Report an issue on GitHub for bugs or feature requests