Real-time Events
Real-time events let a dashboard refresh itself over a WebSocket the moment the data behind it changes, with no manual reload and no polling. When new data is ingested into a data collection, subscribed dashboards refetch and re-render automatically: new rows appear, figures recompute, and updated items briefly highlight.
This makes Depictio suitable for live feeds: an instrument streaming acquisitions, a pipeline emitting results batch by batch, or any process that keeps appending to a data collection.
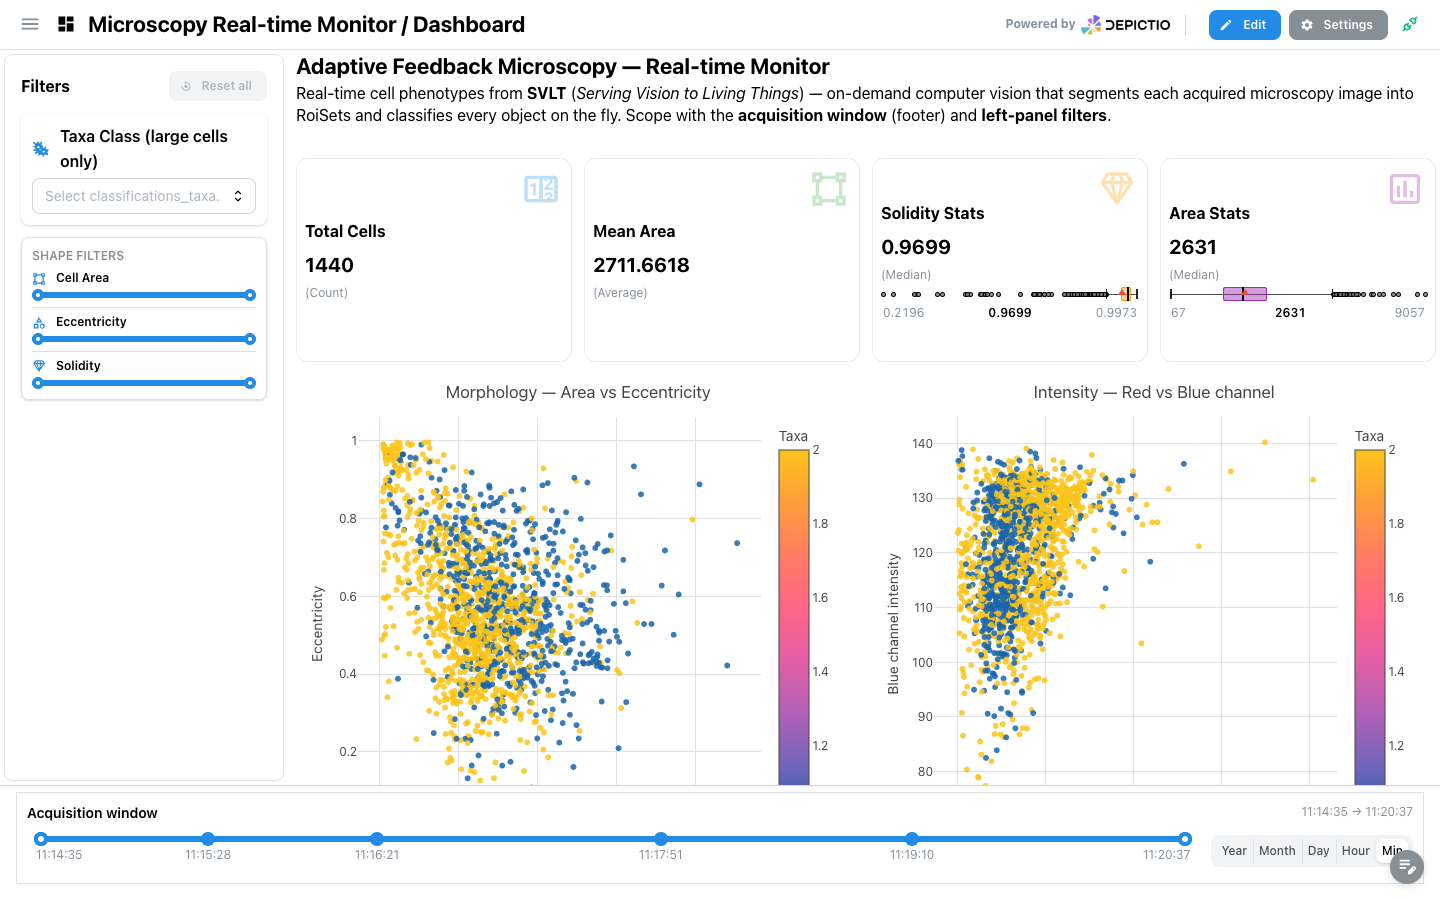
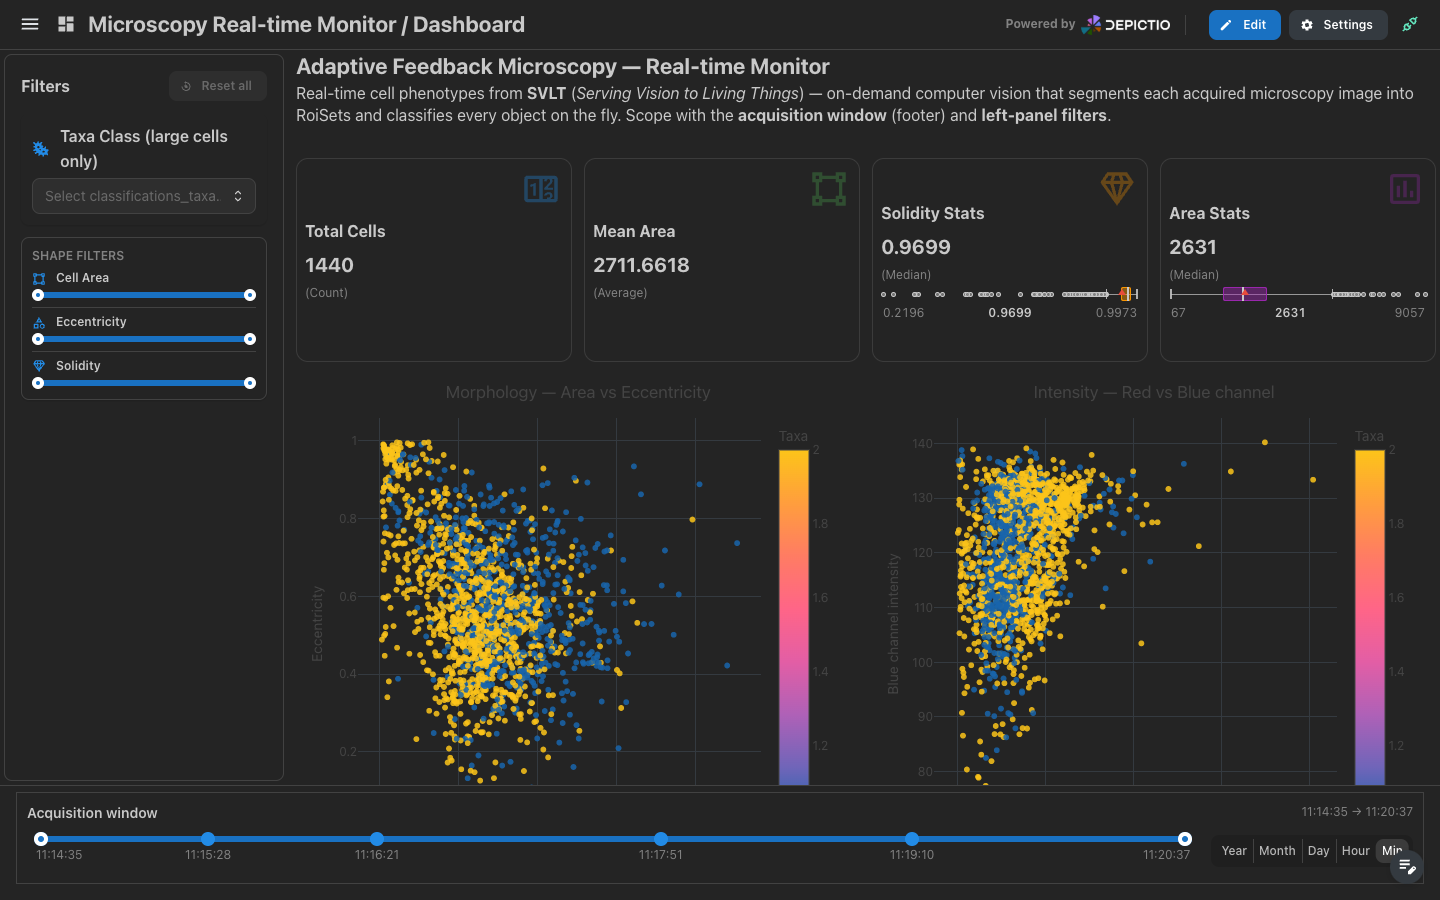
Built with the ALMF at EMBL
This dashboard was designed together with the Advanced Light Microscopy Facility at EMBL, on top of SVLT (Serving Vision to Living Things): on-demand computer vision that segments each acquired image into RoiSets and classifies every object while the experiment is still running. SVLT posts each batch of phenotypes to Depictio, which is what the dashboard above is reacting to.
Video example
🎬 Real-time events in action: a virtual-microscopy simulator streams acquisitions into a live dashboard
In this recording, a virtual-microscopy acquisition simulator stands in for the instrument.
Each acquisition is segmented and pushed to Depictio through /deltatables/upsert, which
broadcasts an event on the WebSocket. The dashboard on the left is open the whole time and is
never reloaded: it refetches on every broadcast, so its figures and cards keep up with the
acquisitions streaming in the terminal on the right.
How it works
The refresh is driven entirely by data ingestion. There is no separate "push" API to call:
producer ingests / upserts a data collection
        │  (depictio ingest …, or a POST to /deltatables/upsert)
        ▼
API re-reads the Delta table, recomputes column specs, bumps its version
        │
        ▼
broadcasts a `data_collection_updated` event on the WebSocket channel
        │  (/depictio/api/v1/events/ws)
        ▼
subscribed dashboards refetch and re-render (updated items highlight)
Any producer that re-ingests or upserts a data collection triggers this. The CLI does it on
every depictio ingest, and an external instrument or pipeline can do the same by POSTing to
the /deltatables/upsert endpoint.
Enable it
Real-time refresh activates only when all of the following hold.
1. Turn the system on (server)
Set the master switch and make sure a Redis instance is reachable (events are fanned out to viewers via Redis pub/sub):
The most relevant variables:
| Variable | Default | Purpose |
|---|---|---|
DEPICTIO_EVENTS_ENABLED |
false |
Master switch; nothing happens until this is true |
DEPICTIO_EVENTS_REDIS_HOST |
redis |
Redis host used for pub/sub |
DEPICTIO_EVENTS_DEBOUNCE_MS |
1000 |
Coalesce bursts of rapid updates (ms) |
See the Environment Variables Reference
for the full DEPICTIO_EVENTS_* list (Redis port/password/db, WebSocket heartbeat and
timeout, change streams).
2. Opt the project in
Real-time is opt-in per project. Add a top-level realtime block to the project's
project.yaml:
Projects without this block never open a WebSocket, and their dashboards show no live indicator.
3. Open the dashboard
Open any dashboard in an opted-in project. A real-time indicator appears in the header and turns green once the viewer has subscribed. From then on the dashboard updates on its own whenever the underlying data collection is re-ingested.


It reads Connecting… while the socket opens, Live once subscribed, and Offline if the connection drops. An orange dot on the icon marks an update you have not taken yet.
Following the stream
Click the indicator to open the Live updates menu.
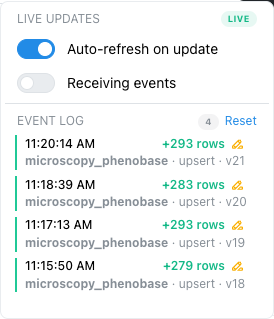
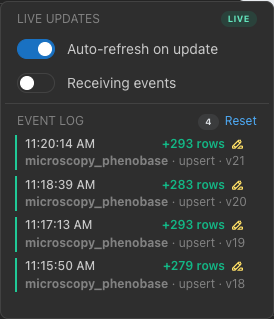
- Auto-refresh on update: on, the dashboard silently refetches on every event. Off, an event only raises a notification and the orange dot, and you refresh when you are ready. Useful when you are reading a figure and don't want it moving under you.
- Receiving events / Paused: pausing stops updates from being applied but keeps the socket open, so nothing is missed from the log.
- Event log: the last 50 events, newest first. It lives in the browser's local storage, so it survives a reload; Reset empties it.
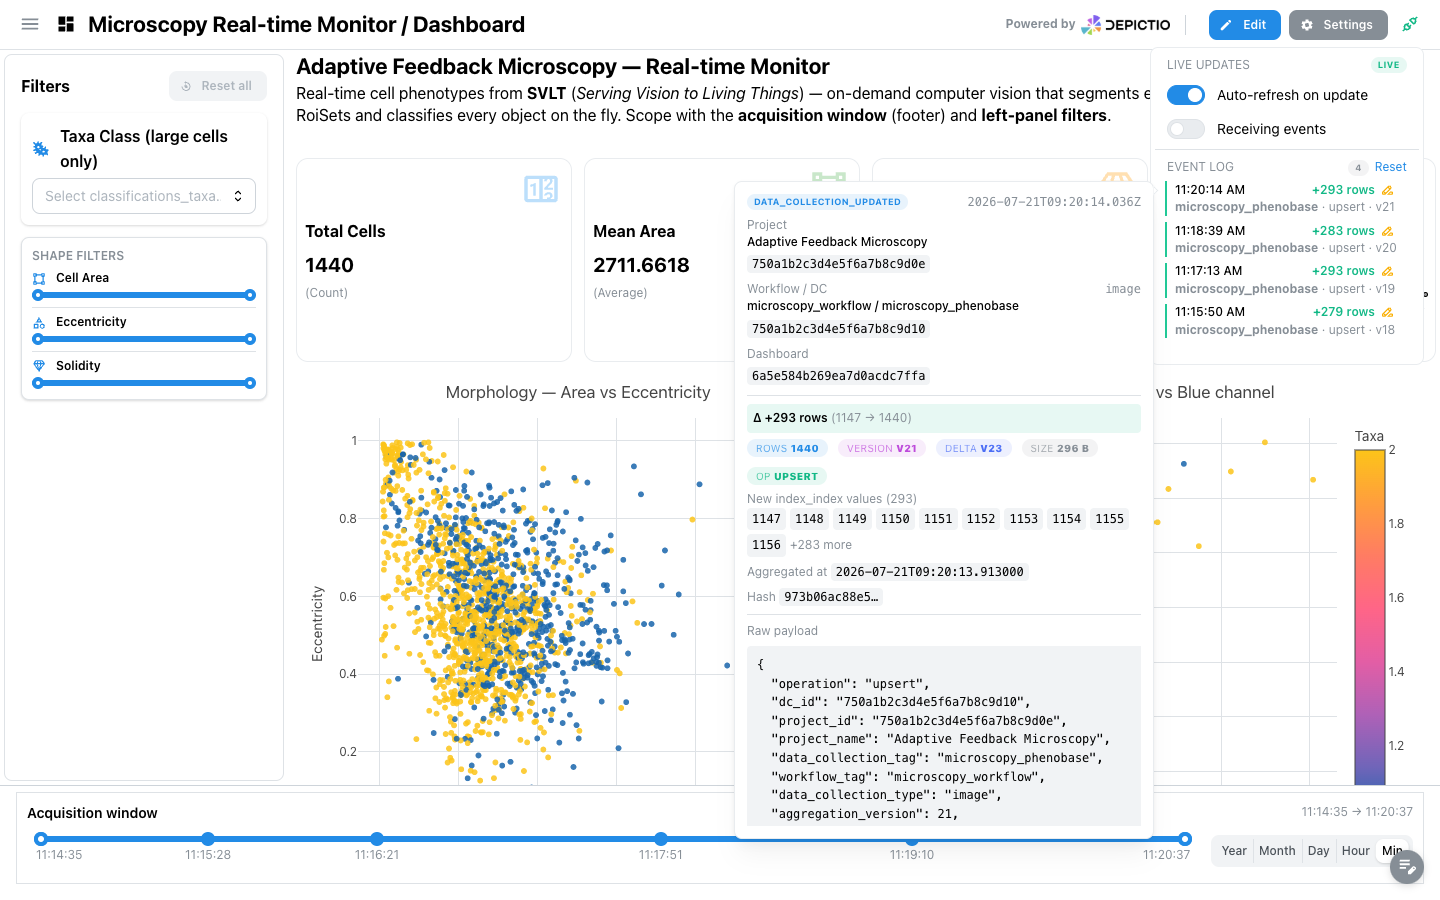
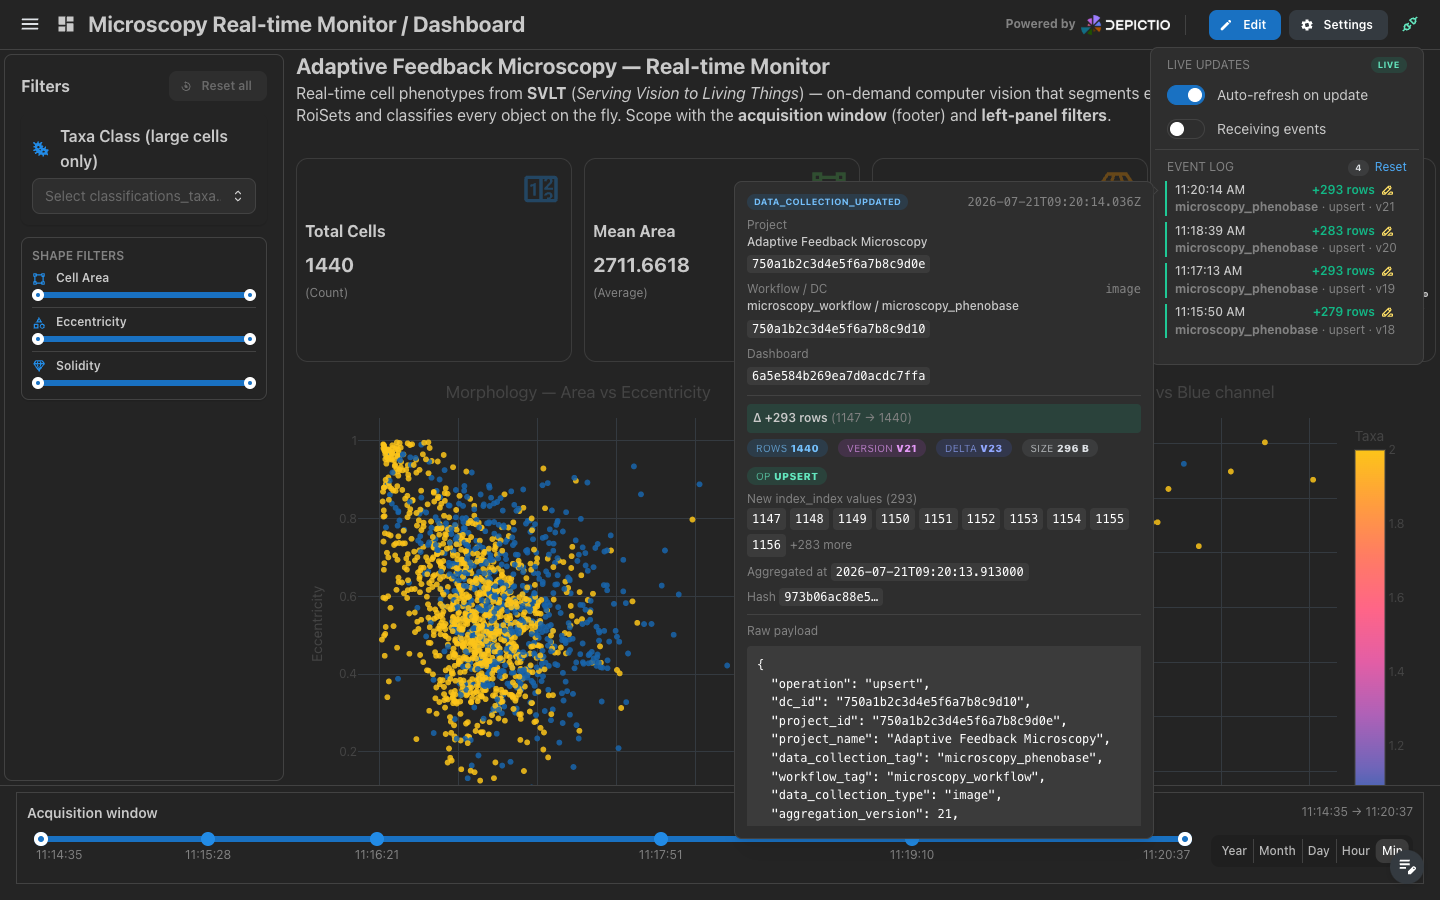
Hover a log row for the whole event.
Re-highlighting a batch
Rows glow briefly as they land, then fade. The highlight button on a log row brings that batch back: every component bound to the collection re-lights exactly the rows that event added, and keeps them lit until you choose another batch or select Clear highlight.
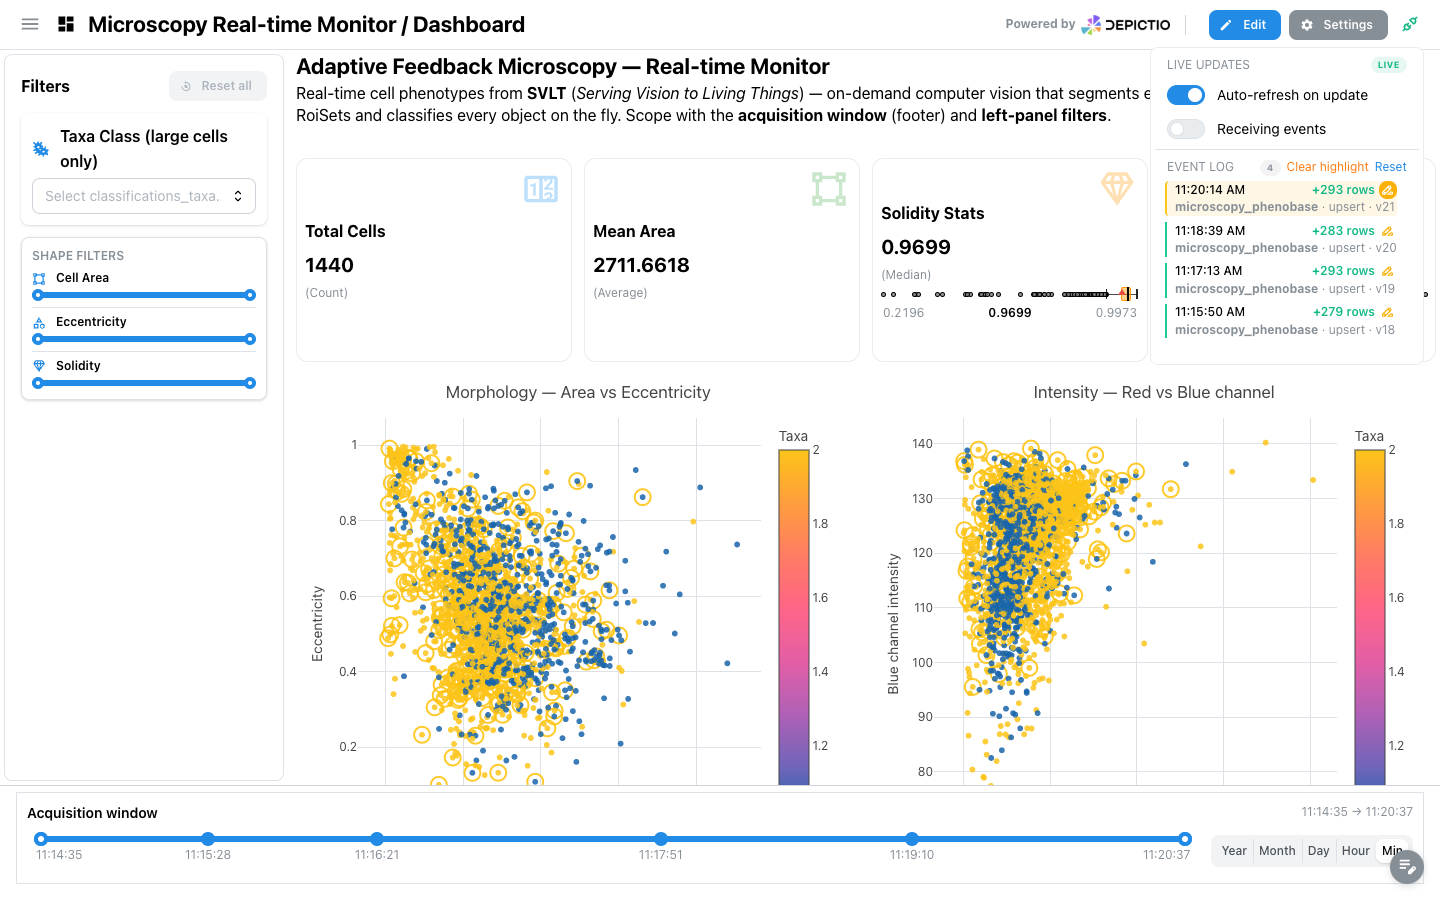
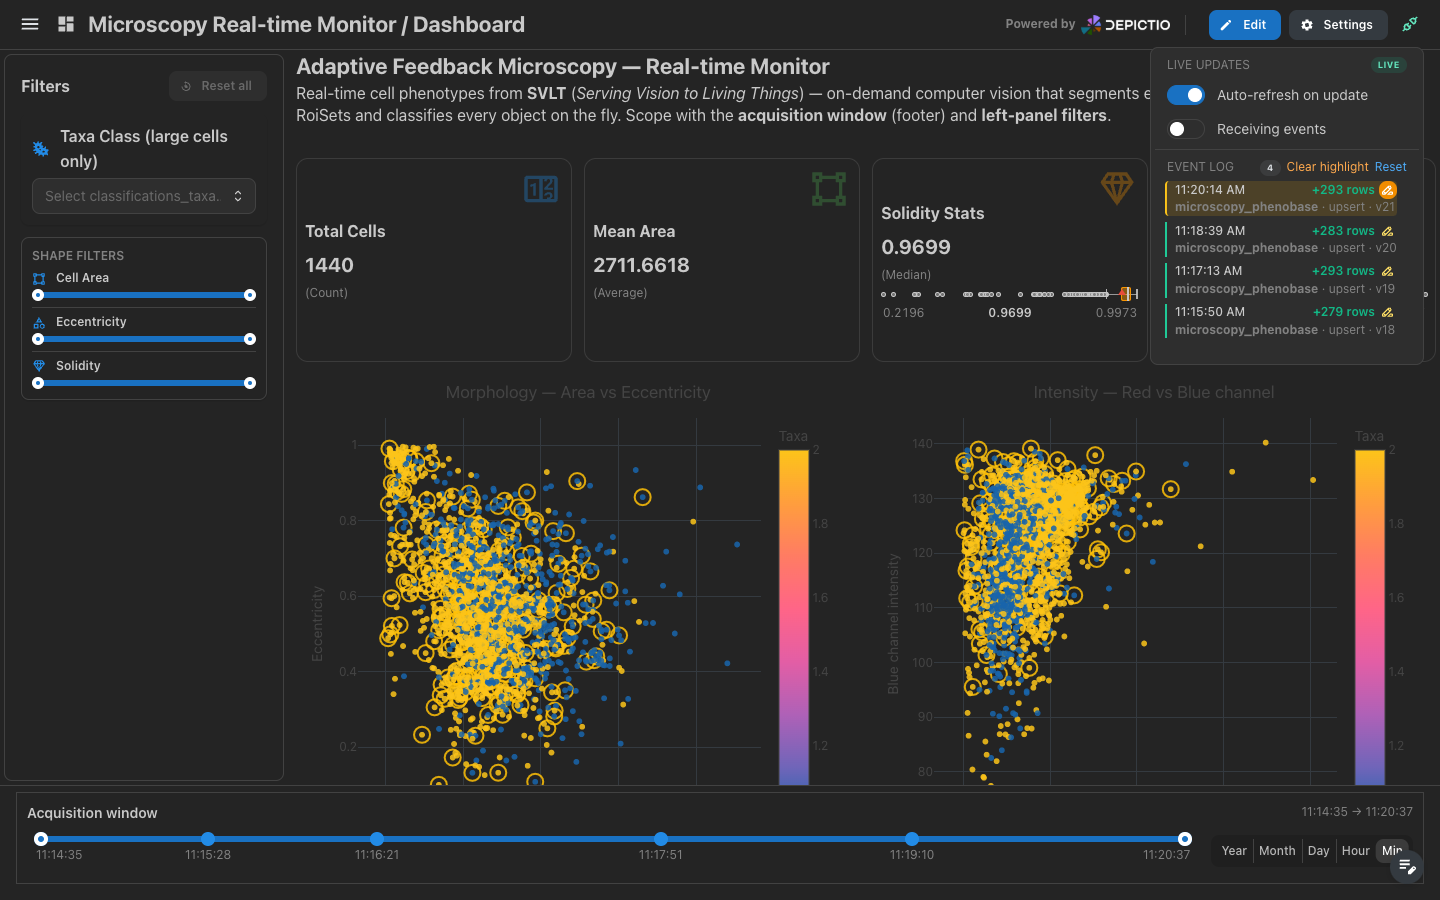
The button only appears on events that carry a list of added ids. The first commit of a collection has nothing to diff against, so there is no batch to pin.
Scoping to an acquisition window
A dashboard that tracks a stream usually places its timeline component in the footer, where it spans the full width below both the filter panel and the components and stays visible as the page scrolls (v1.2.2+).


Drag either handle to narrow the window and every component re-renders against the selection.
The Year … Min buttons do not change the selection itself.
Driving updates
Once enabled, any of these will move a live dashboard:
- Re-ingest with the CLI:
depictio ingest --project-config-path <project.yaml> --update-configrefreshes the project in place: it re-scans and upserts the data collection, which broadcasts the refresh, and keeps the dashboards as edited in the viewer. See Refreshing a project. - An external producer: an instrument or pipeline that POSTs new data to the
/deltatables/upsertAPI endpoint (with a valid token) triggers the same path. This is the intended integration point for a live experimental feed, and how SVLT feeds the dashboard above. - A pipeline that ingests itself (v1.10.0+): a Nextflow
workflow.onCompletehandler runs the CLI on the output directory when the run finishes. With--depictio_attach true, each new run of the pipeline moves the dashboard with no one at a keyboard. See Nextflow trigger.
Try it locally
The bundled adapt_feedb_ms demo project ships with the realtime block already set and a
small synthetic driver that needs no extra dependencies, just the CLI and a token:
cd depictio/projects/test/adapt_feedb_ms
./stream_test.sh reset       # seed a couple of rows and ingest
./stream_test.sh stream 3    # append one row every 3s until Ctrl+C
Open the project's dashboard and watch each tick land live: new gallery items, recomputed cards, and a moving timeline, with no manual refresh.
Requirements & notes
- Redis is required for pub/sub when events are enabled.
- MongoDB change streams (
DEPICTIO_EVENTS_MONGODB_CHANGE_STREAMS_ENABLED, on by default) require MongoDB to run as a replica set. - Reverse proxy: the WebSocket route
/depictio/api/v1/events/wsneeds the HTTP upgrade proxied. If you front Depictio with nginx, forward theUpgradeandConnectionheaders on that path, and allowconnect-src 'self' ws: wss:in your Content-Security-Policy. - Authentication: the WebSocket carries its JWT as a
tokenquery parameter (browsers can't setAuthorizationheaders on WS connections) and is permission-checked against the dashboard's project at viewer level before any events are delivered.