
The drop template follows an nf-core/drop run from the sample sheet to the genes that stand out in a patient's RNA:
- Overview: the run in four key figures, live findings and four figures, each linked to the tab that explains it
- Candidates: each sample's genes ranked by how many analyses call them, with the evidence of each
- Expression: OUTRIDER aberrant expression, as a volcano and the samples and genes with the most hits
- Splicing: FRASER aberrant splicing, as a volcano and what the hit junctions do
- Mono-allelic: heterozygous variants read from one allele only
- Locus: the called genes on the genome, with a browser on the reads and genotypes
The persistent Sample filters (group, sample) and Gene filters (gene symbol) sit
in the left panel and narrow every tab through the project links.
A small run calls nothing
OUTRIDER and FRASER need about 30 samples per group. Below that every adjusted p-value tends to 1 and zero calls is the expected answer. The tables therefore also carry a nominal status (raw p-value of 0.05 or less, not called): a lead to check in the reads, never a finding.
Give the volcanoes a cloud
A default run writes only the rows that pass the cut-offs, so a volcano
shows its hits and nothing behind them. Run the pipeline with
--ae_padj_cutoff 1 --ae_z_score_cutoff 0 --as_padj_cutoff 1 --as_delta_psi_cutoff 0
to keep every tested gene and junction. A default run still works.
Quick start
The results directory is the only thing you have to pass, with one
exception: drop does not publish the sample sheet it ran on. The template
looks for it at {DATA_ROOT}/input/samplesheet.tsv; copy it there, or point
to it:
depictio ingest /path/to/drop_results \
--template nf-core/drop/latest \
--var SAMPLESHEET=/path/to/samplesheet.tsv
| Variable | Default | Role |
|---|---|---|
SAMPLESHEET |
input/samplesheet.tsv |
the sample sheet given to --input |
GROUP_COL |
drop_group |
column the dashboard groups and filters samples by |
GENOME |
hg38 |
UCSC assembly the browser and the locus links open on |
TRACKS_URI |
unset | s3:// or https:// folder that relative BAM and VCF paths of the sheet are read under, in place |
AE_PADJ, AS_PADJ, MAE_PADJ |
0.05, 0.1, 0.05 |
adjusted p-value cut-offs of an OUTRIDER, FRASER and mono-allelic call |
Further cut-offs (AE_MIN_Z, AS_MIN_DPSI, MAE_MIN_RATIO, NOMINAL_P,
BACKGROUND_ROWS, CANDIDATES_PER_SAMPLE) are listed in the reference below.
depictio config nextflow --install     # once per machine
nextflow run nf-core/drop -r 1.0.0 -profile docker --outdir results
No depictio ingest, and no template named: the pipeline ingests its own
output directory when it finishes and resolves this template from its own
manifest. See Nextflow trigger. The
trigger passes no --var, so put a copy of the sample sheet at
results/input/samplesheet.tsv before the run.
Reference
The template reads the OUTRIDER, FRASER and mono-allelic result tables, the gene
name mapping that gives expression calls a position, the sample sheet and the run
parameters. Each analysis is optional (--ae_skip, --as_skip, --mae_skip):
the collections of a skipped one are pruned with their tiles, and a tab left
without data is dropped. DROP renders its report from R rather than MultiQC
modules, so the template has no MultiQC tab; the same answers are rebuilt from the
result tables.
A sample can belong to several DROP groups. The sample hub keeps the most specific
one (the group the fewest samples share) as drop_group. OUTRIDER and FRASER write
only the rows that pass their cut-offs, so the expression and splicing recipes keep
a row when it is called, when its adjusted p-value is 0.5 or less, or when it is one
of the BACKGROUND_ROWS (300) most significant of its sample. The calls are read
before that trim and do not change with it, but the kept rows are not a fair sample
of the tests, so the dashboard draws no QQ view for these two analyses.
| Cut-off variable | Default | Role |
|---|---|---|
AE_MIN_Z |
0 |
minimum absolute z-score of an OUTRIDER call |
AS_MIN_DPSI |
0.3 |
minimum absolute delta PSI of a FRASER call |
MAE_MIN_RATIO |
0.8 |
minimum allele share of a mono-allelic call |
NOMINAL_P |
0.05 |
raw p-value at or below which a row is a nominal hit |
BACKGROUND_ROWS |
300 |
background rows kept per sample by the expression and splicing tables |
CANDIDATES_PER_SAMPLE |
25 |
best-supported genes per sample kept in the triage list besides the called ones |
Self-adapting layout
The dashboard adapts to whatever the run actually produced: components bound to pruned or unparsed data collections are hidden, tabs left with no real visualizations are dropped entirely, and the remaining components are re-packed so there are no empty rows. The per-sample table is always built, so the Overview key figures survive any combination of analyses.
Template variables
Variables you provide when running the template: DATA_ROOT is the results directory given to depictio ingest, the others are set with --var NAME=value:
| Variable | Required | Description |
|---|---|---|
DATA_ROOT |
✓ | Root directory of one DROP run (the outdir: processed_results/, pipeline_info/ ...) |
SAMPLESHEET |
— | The sample sheet the run was given as --input (TSV with RNA_ID, DROP_GROUP and the optional columns). Relative to DATA_ROOT, or an absolute path or URL. |
GROUP_COL |
— | Sample-hub column the group filter, cards and colouring read: the sample's most specific DROP_GROUP. |
GROUP_COL_DISPLAY |
— | Title-cased GROUP_COL for display. |
GENOME |
— | UCSC assembly name the genome browser opens on (the genome the alignments were made against). |
TRACKS_URI |
— | s3:// or https:// folder to read relative track paths of the sample sheet under, in place, instead of uploading them from DATA_ROOT. Paths that are already URLs are always read in place. |
AE_PADJ |
— | Adjusted p-value at or below which an OUTRIDER gene is called an outlier. |
AE_MIN_Z |
— | Absolute z-score at or above which an OUTRIDER gene is called an outlier (0 keeps every gene the run reported). |
AS_PADJ |
— | Gene-level adjusted p-value at or below which a FRASER gene is called an outlier. |
AS_MIN_DPSI |
— | Absolute change in splicing usage (delta PSI, 0 to 1) at or above which a FRASER junction is called. |
NOMINAL_P |
— | Raw (uncorrected) p-value at or below which an OUTRIDER gene or FRASER junction is shown as a nominal hit. A run too small to pass the adjusted cut-offs calls nothing; the nominal hits are then the leads, to be read with care. |
BACKGROUND_ROWS |
— | Rows per sample the expression and splicing tables keep besides the called ones and those with an adjusted p-value of 0.5 or less, taken from the most significant by raw p-value. They are the background of the volcano. A negative value keeps every row. |
CANDIDATES_PER_SAMPLE |
— | Best-supported genes per sample kept in the triage list besides the genes an analysis calls. |
MAE_PADJ |
— | Adjusted p-value at or below which a heterozygous variant is called mono-allelic. |
MAE_MIN_RATIO |
— | Share of the reads (0.5 to 1) the dominant allele needs for a mono-allelic call. |
Data collections
9 data collections — 4 required 5 optional · 5 direct 4 derived.
Origin tells you whether a collection is real pipeline data or a reshape of it: direct = a pipeline output (scanned, or a recipe that reads raw files); derived = a recipe that reshapes one or more direct collections into the layout a visualization needs (no new measurement). Reads shows what produces it: a recipe .py transform, or a raw file scanned off disk. (A direct collection can still have a recipe — one that merely parses/cleans the raw file; derived means the recipe reshapes another collection.)
| Tag | Origin | Type | Reads | Status |
|---|---|---|---|---|
samples |
direct | Table | recipe |
required |
group_membership |
direct | Table | recipe |
required |
expression_outliers |
direct | Table | recipe |
optional |
splicing_outliers |
direct | Table | recipe |
optional |
mae_variants |
direct | Table | recipe |
optional |
sample_outliers |
derived | Table | recipe |
required |
outlier_genes |
derived | Table | recipe |
optional |
gene_evidence |
derived | Table | recipe |
optional |
tracks |
derived | genomic_tracks | recipe |
required |
Conditional routes
Rows are data collections; columns are the variables you set or params.json flags auto-detected from the run. Each filled cell is the effect of setting that variable; an empty cell means that variable leaves the collection unchanged. (8 collections are unaffected by any variable — present on every run.)
+ included− removed⇄ repointed
| Data collection | TRACKS_URI |
|---|---|
tracks |
⇄ |
Cross-DC links
12 links — selecting a value in the source collection filters the target. The join column is shown after the source.
| Source · column | Target | Filters | |
|---|---|---|---|
samples · sample |
→ | group_membership |
Filter the group memberships by sample selection |
samples · sample |
→ | sample_outliers |
Filter the outliers per sample by sample selection |
samples · sample |
→ | expression_outliers |
Filter the OUTRIDER calls by sample selection |
samples · sample |
→ | splicing_outliers |
Filter the FRASER calls by sample selection |
samples · sample |
→ | mae_variants |
Filter the mono-allelic variants by sample selection |
samples · sample |
→ | outlier_genes |
Filter the triage list by sample selection |
expression_outliers · gene_name |
→ | splicing_outliers |
Carry a gene selection from the expression calls onto the splicing calls |
expression_outliers · gene_name |
→ | mae_variants |
Carry a gene selection from the expression calls onto the mono-allelic variants |
expression_outliers · gene_name |
→ | outlier_genes |
Carry a gene selection from the expression calls onto the triage list |
expression_outliers · gene_name |
→ | gene_evidence |
Carry a gene selection from the expression calls onto the gene by analysis grid |
samples · sample |
→ | tracks |
Show the genome tracks of the samples picked in the left panel |
tracks · sample |
→ | samples |
Filter the dashboard by the samples whose tracks are picked in the genome browser |
Recipes
Each recipe reshapes raw pipeline output into a tidy table. The name links to its source; Output lists the validated OUTPUT_SCHEMA columns.
| Recipe | Transforms | Output |
|---|---|---|
nf-core/drop/expression_outliers.py |
Aberrant expression calls of nf-core/drop: OUTRIDER outliers, one row per sample and gene. | call_id, sample, gene_id, gene_name, annotation, drop_group, status, p_value, padj, z_score, abs_z_score, l2fc, neg_log10_p, neg_log10_padj, avg_log_count, raw_count, expected_count, mean_count, significant, nominal, direction, hpo_match, chrom, start, end |
nf-core/drop/gene_evidence.py |
The genes with the strongest evidence over the cohort, one row per gene and one column per analysis. | gene_name, Expression, Splicing, Mono-allelic, best_support, samples_called, samples_listed, evidence, phenotype_gene |
nf-core/drop/group_membership.py |
nf-core/drop analysis groups, one row per sample and group it belongs to. | sample, drop_group, count_source, has_dna |
nf-core/drop/mae_variants.py |
Mono-allelic expression calls of nf-core/drop: heterozygous SNVs, one row per sample and variant. | call_id, sample, gene_name, drop_group, annotation, chrom, start, end, locus, variant_id, ref_allele, alt_allele, ref_count, alt_count, total_count, alt_ratio, p_value, padj, neg_log10_padj, avg_log_count, log2fc, mono_allelic, call, rare |
nf-core/drop/outlier_genes.py |
One row per sample and gene across the three DROP analyses: the triage list. | call_id, sample, drop_group, gene_name, expression_outlier, splicing_outlier, mae_outlier, n_analyses, n_nominal, support, called_in, phenotype_gene, phenotype, significance, sample_rank, expression_score, splicing_score, mae_score, z_score, l2fc, expression_padj, delta_psi, splicing_padj, alt_ratio, mae_padj, chrom, start, end, locus |
nf-core/drop/sample_outliers.py |
Outliers per sample across the three DROP analyses: the sample-level quality read. | sample, drop_group, count_source, expression_outliers, over_expressed, under_expressed, splicing_outliers, mae_calls, mae_variants_tested, total_outliers, expression_nominal, splicing_nominal, nominal_hits, phenotype_matches, has_outlier |
nf-core/drop/samples.py |
The nf-core/drop sample hub: one row per RNA sample of the run's sample sheet. | sample, drop_group, drop_groups, n_groups, group_size, count_source, strandedness, read_type, count_mode, has_dna, n_hpo_terms, annotation, genome |
nf-core/drop/splicing_outliers.py |
Aberrant splicing calls of nf-core/drop: FRASER outliers, one row per sample and gene. | call_id, sample, gene_name, annotation, drop_group, status, p_value, padj_gene, delta_psi, chrom, start, end, locus, strand, psi_type, psi_value, abs_delta_psi, padj, neg_log10_p, neg_log10_padj, avg_log_reads, split_reads, total_reads, significant, nominal, direction, hpo_match |
nf-core/drop/tracks.py |
Genome-browser track manifest: the alignments and genotypes the sample sheet points at. | track_id, sample, drop_group, kind, format, uri, index_uri, name, category, order |
Dashboard tabs
One dashboard: the Overview, then five child tabs in two groups, read as a funnel from the run to the genes that stand out in a sample. Each tab below carries the same icon and colour the dashboard gives it, so the page and the app read alike.
| Group | Tabs |
|---|---|
| Triage | Candidates |
| Analyses | Expression, Splicing, Mono-allelic, Locus |
Each child tab opens with a short intro and a strip of four cards, then at most three open sections; tables follow, collapsed. The Sample sheet is pinned, collapsed, to the bottom of every child tab.
RNA outliers, from the reads to the genes that stand out.
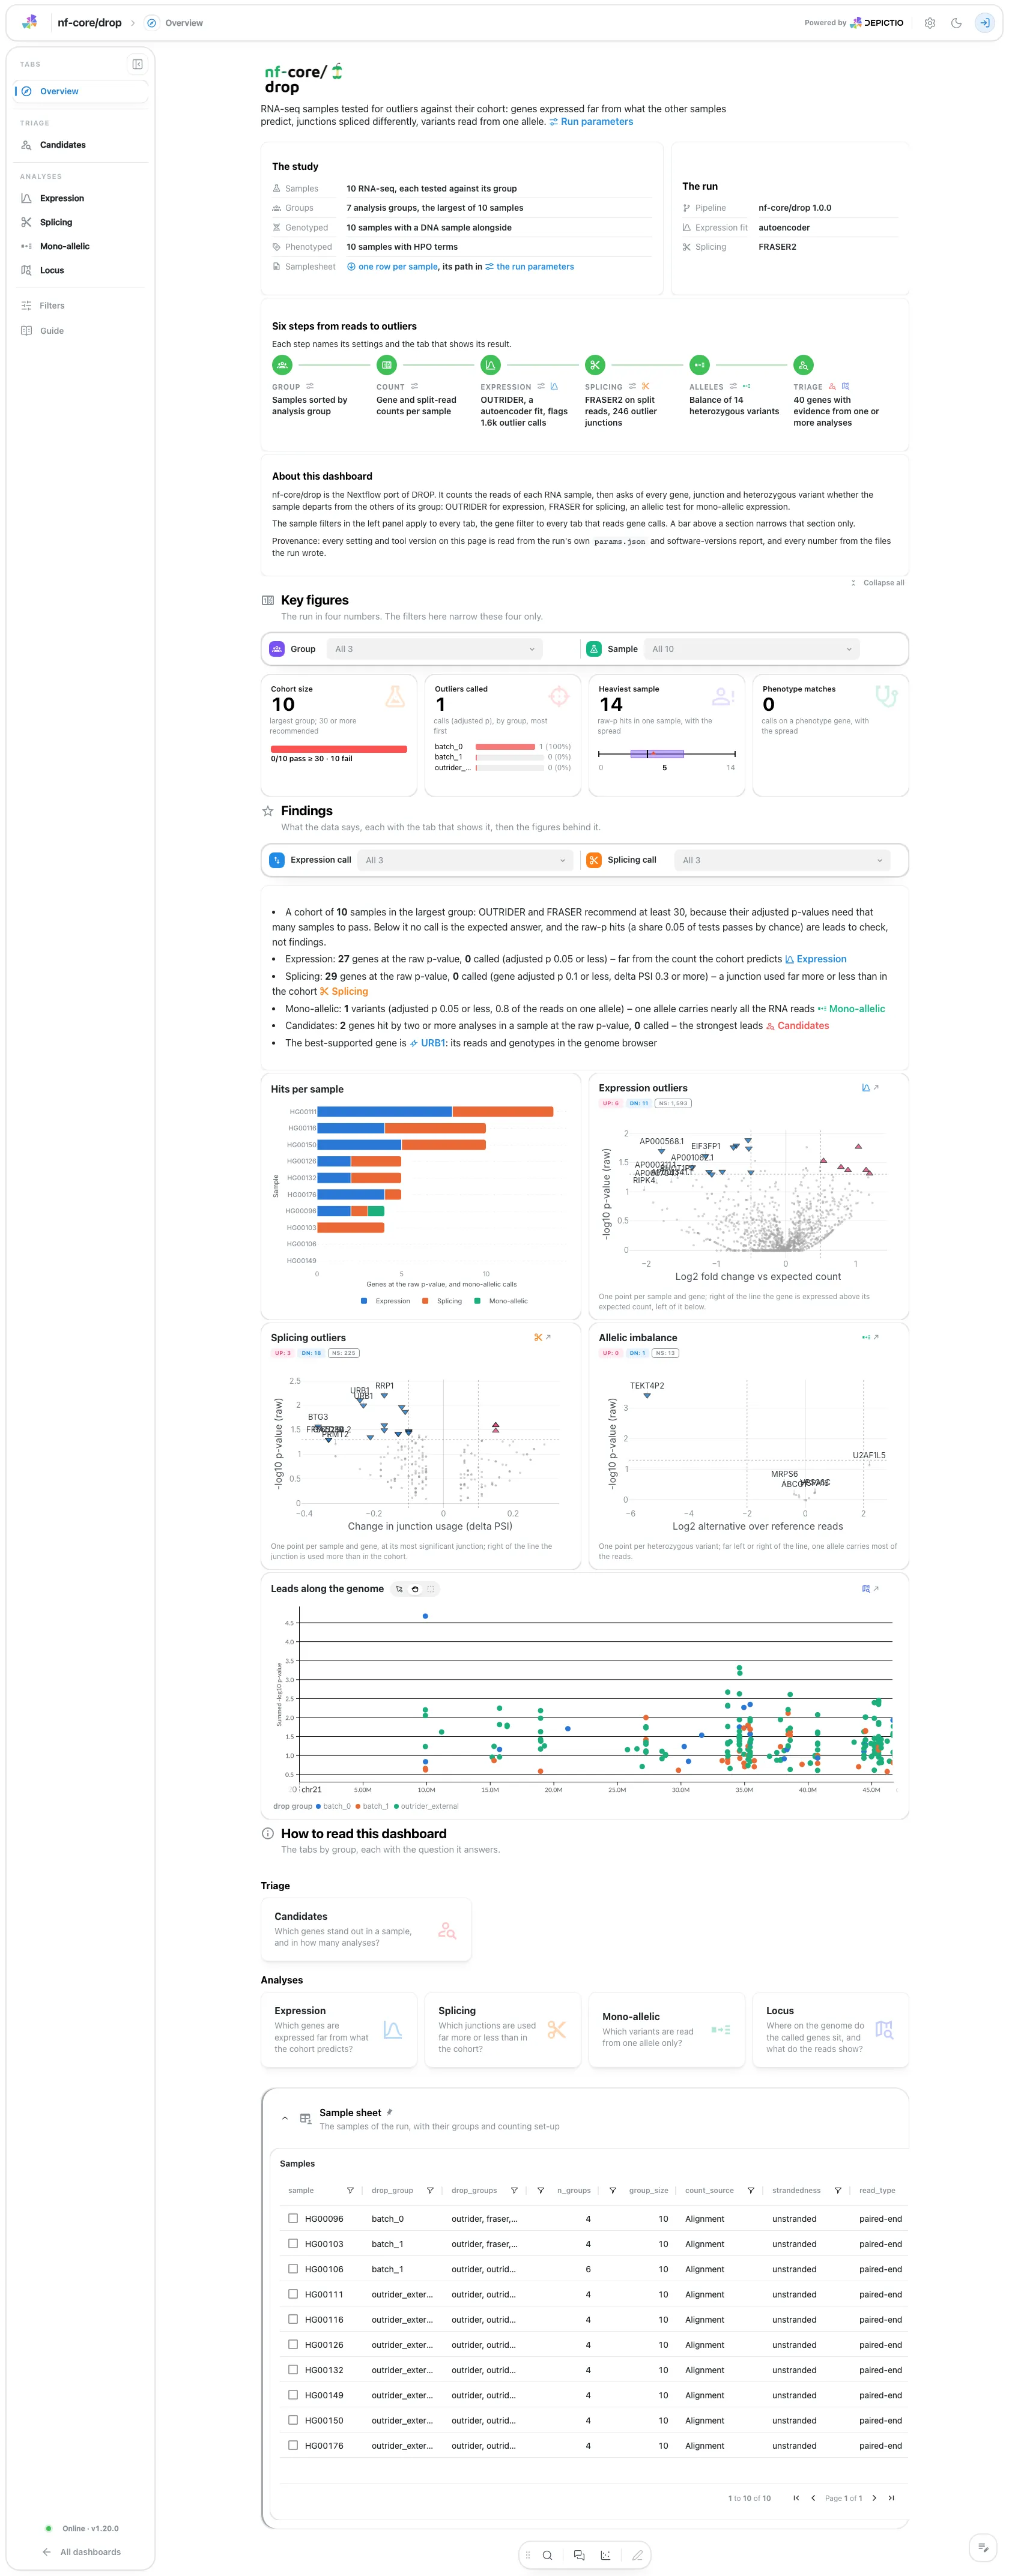
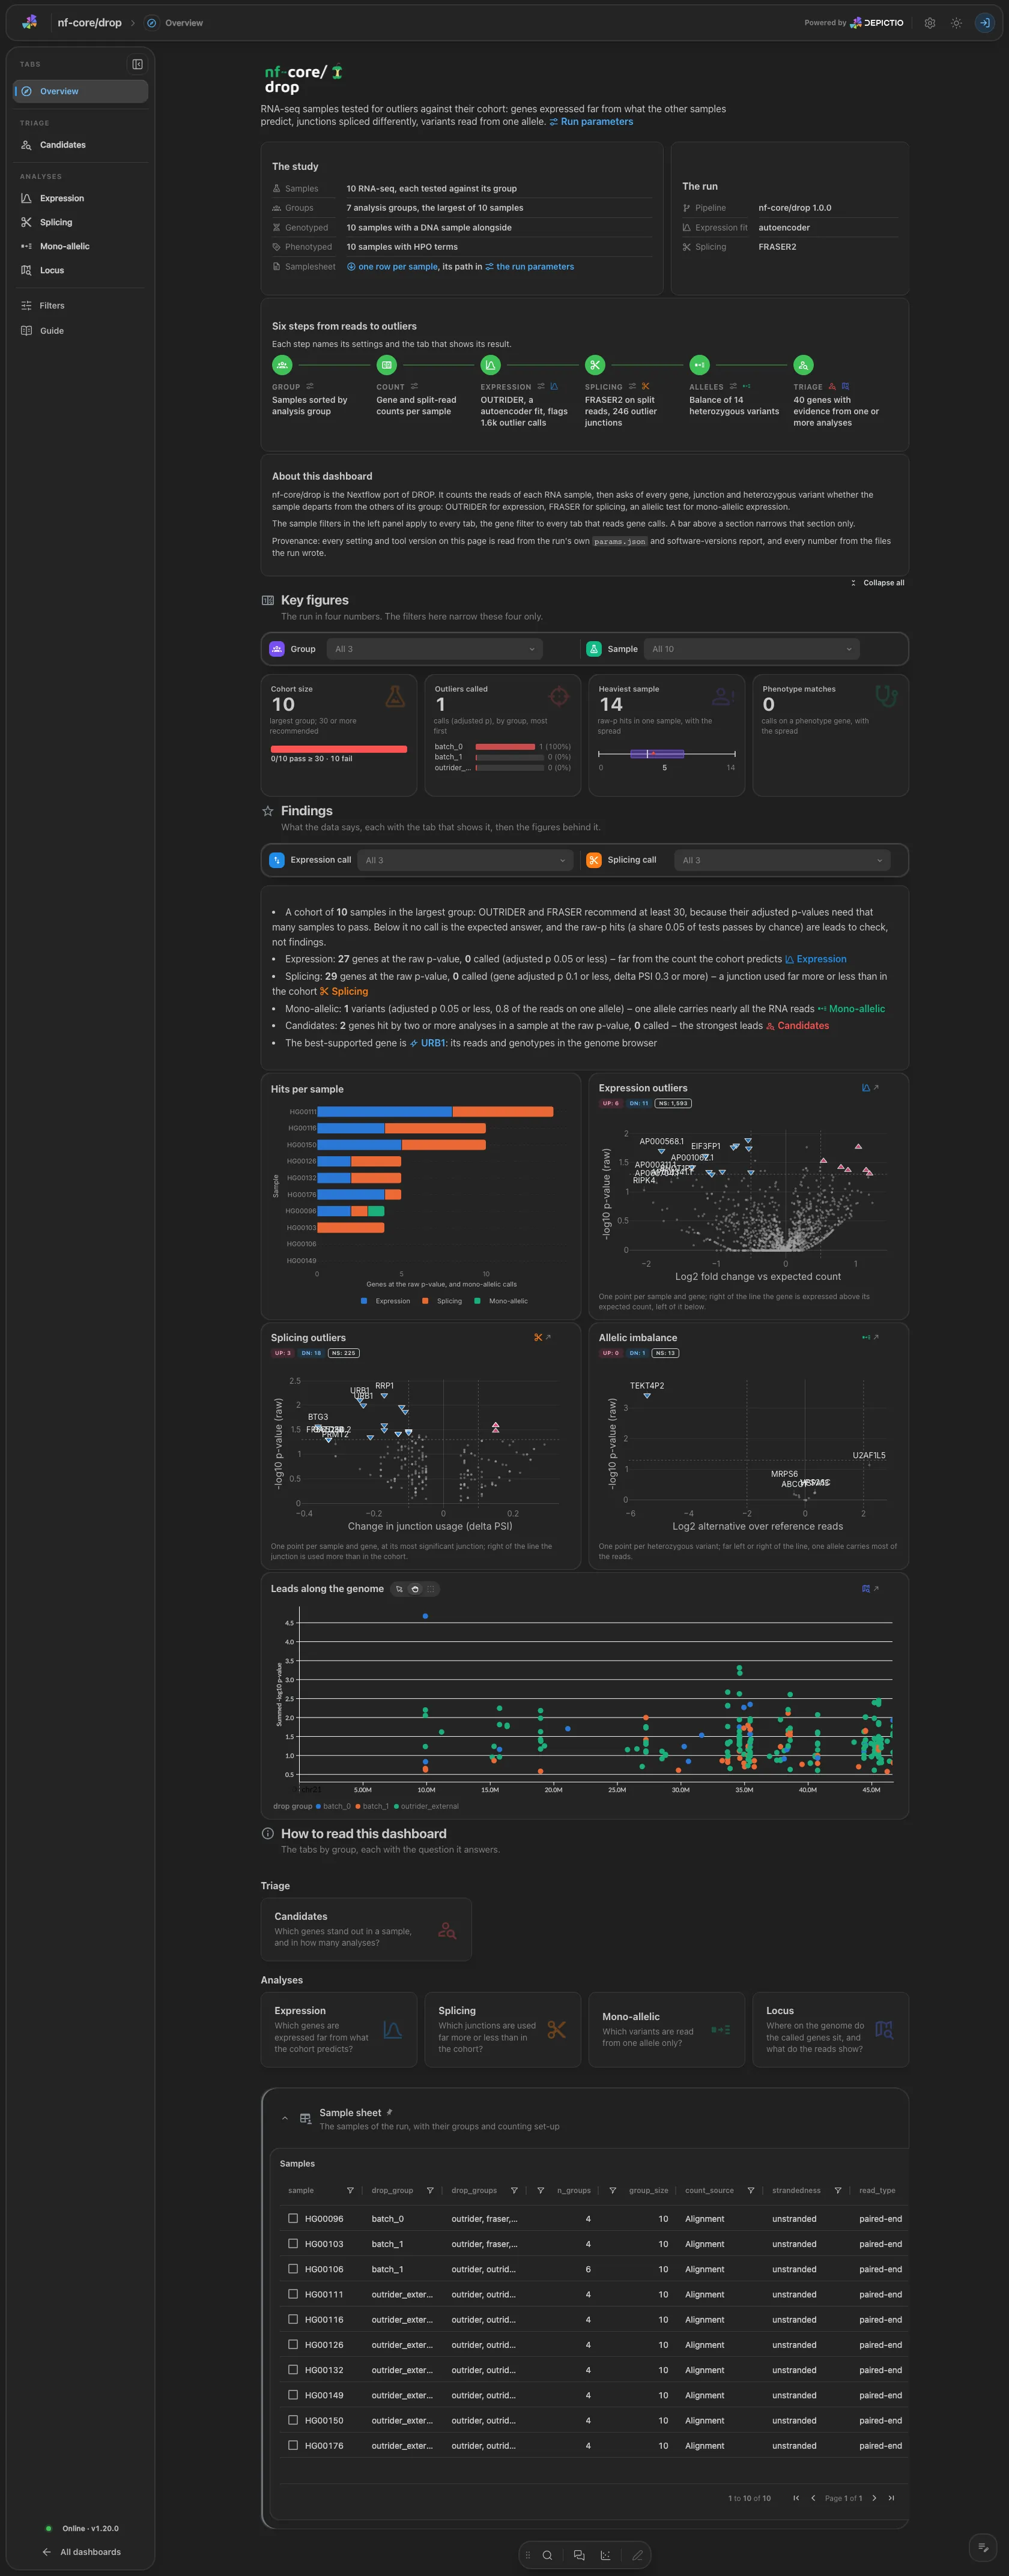
Cards for the run (samples, groups, the OUTRIDER and FRASER implementations) and a six-step Pipeline (group, count, expression, splicing, alleles, locate), each linked to its parameters and its tab. Four key figures: the cohort size, the outliers called, the heaviest sample and the calls on a phenotype gene. The findings are live values that follow the filters, with the nominal hits beside the calls, then the hits in each sample and the three volcanoes.
Triage · Which genes stand out in a sample, and in how many analyses?
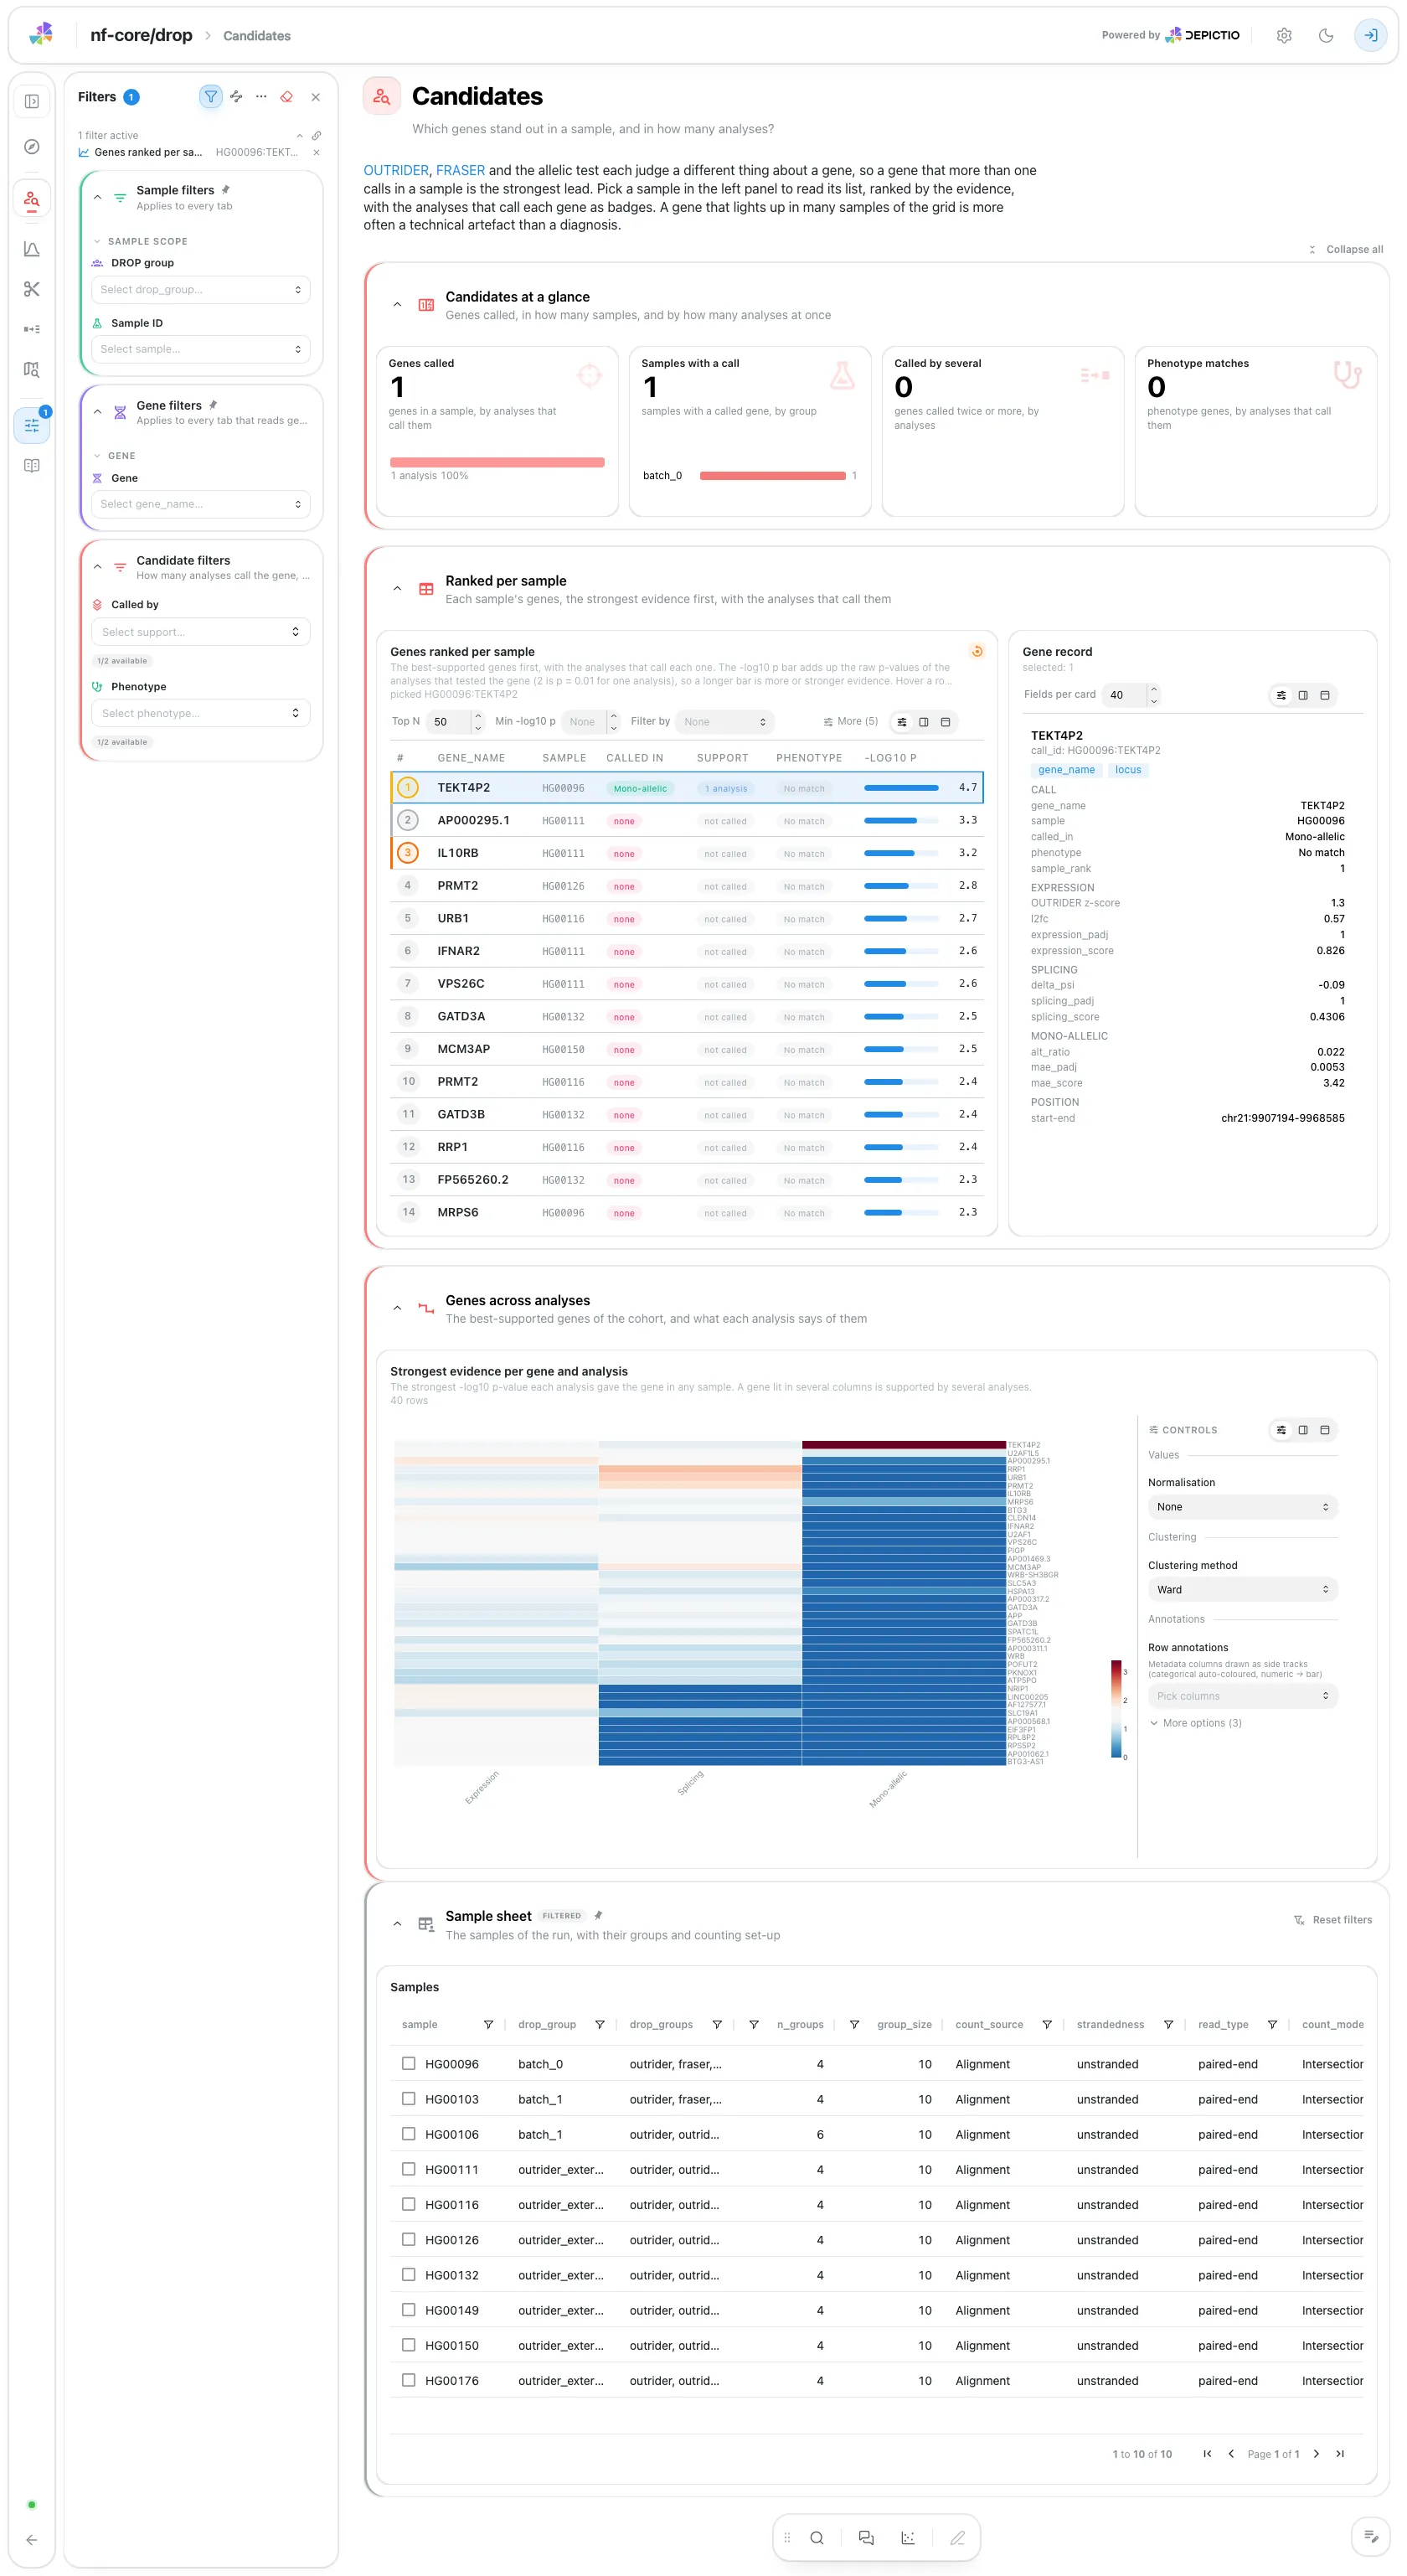
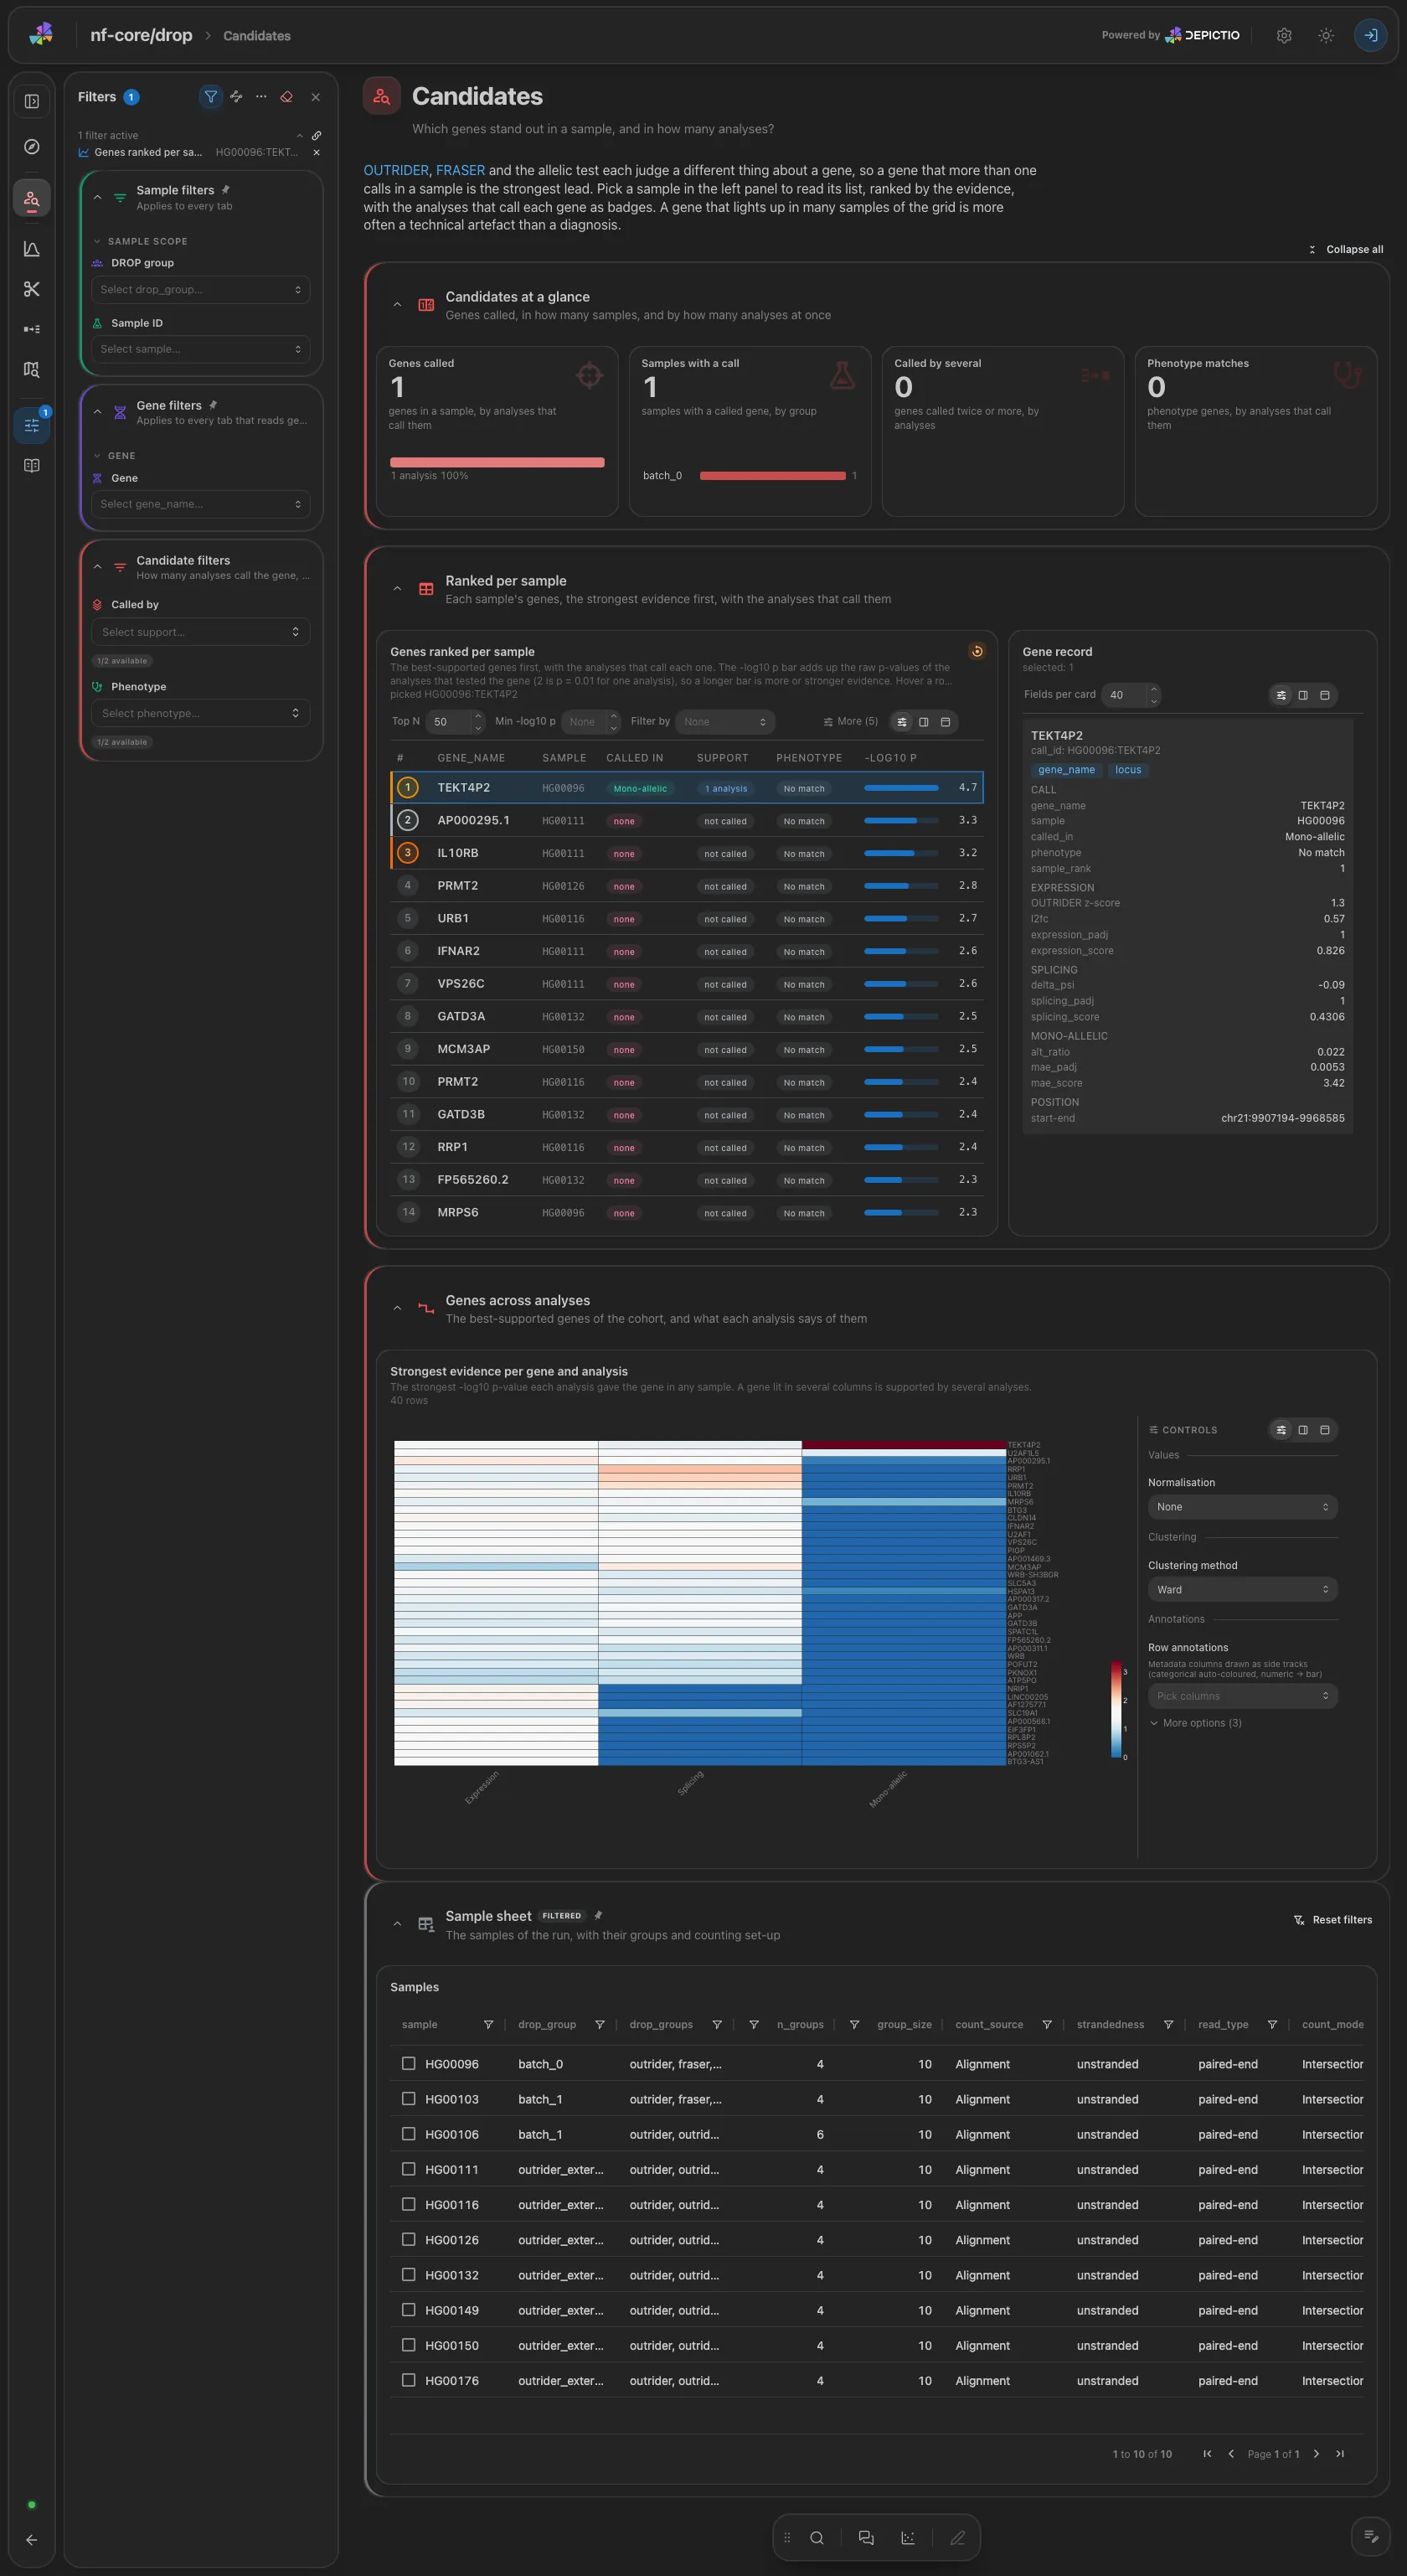
A ranked list of the genes of the picked sample, the strongest evidence first (the analyses that call each gene, the support, the phenotype match), beside a record card for the picked gene. Below, a gene by analysis grid of the cohort's best-supported genes: a gene lit in one column only has one analysis behind it. Filters: how many analyses call the gene, and the phenotype match.
Analyses · Which genes are expressed far from what the cohort predicts?
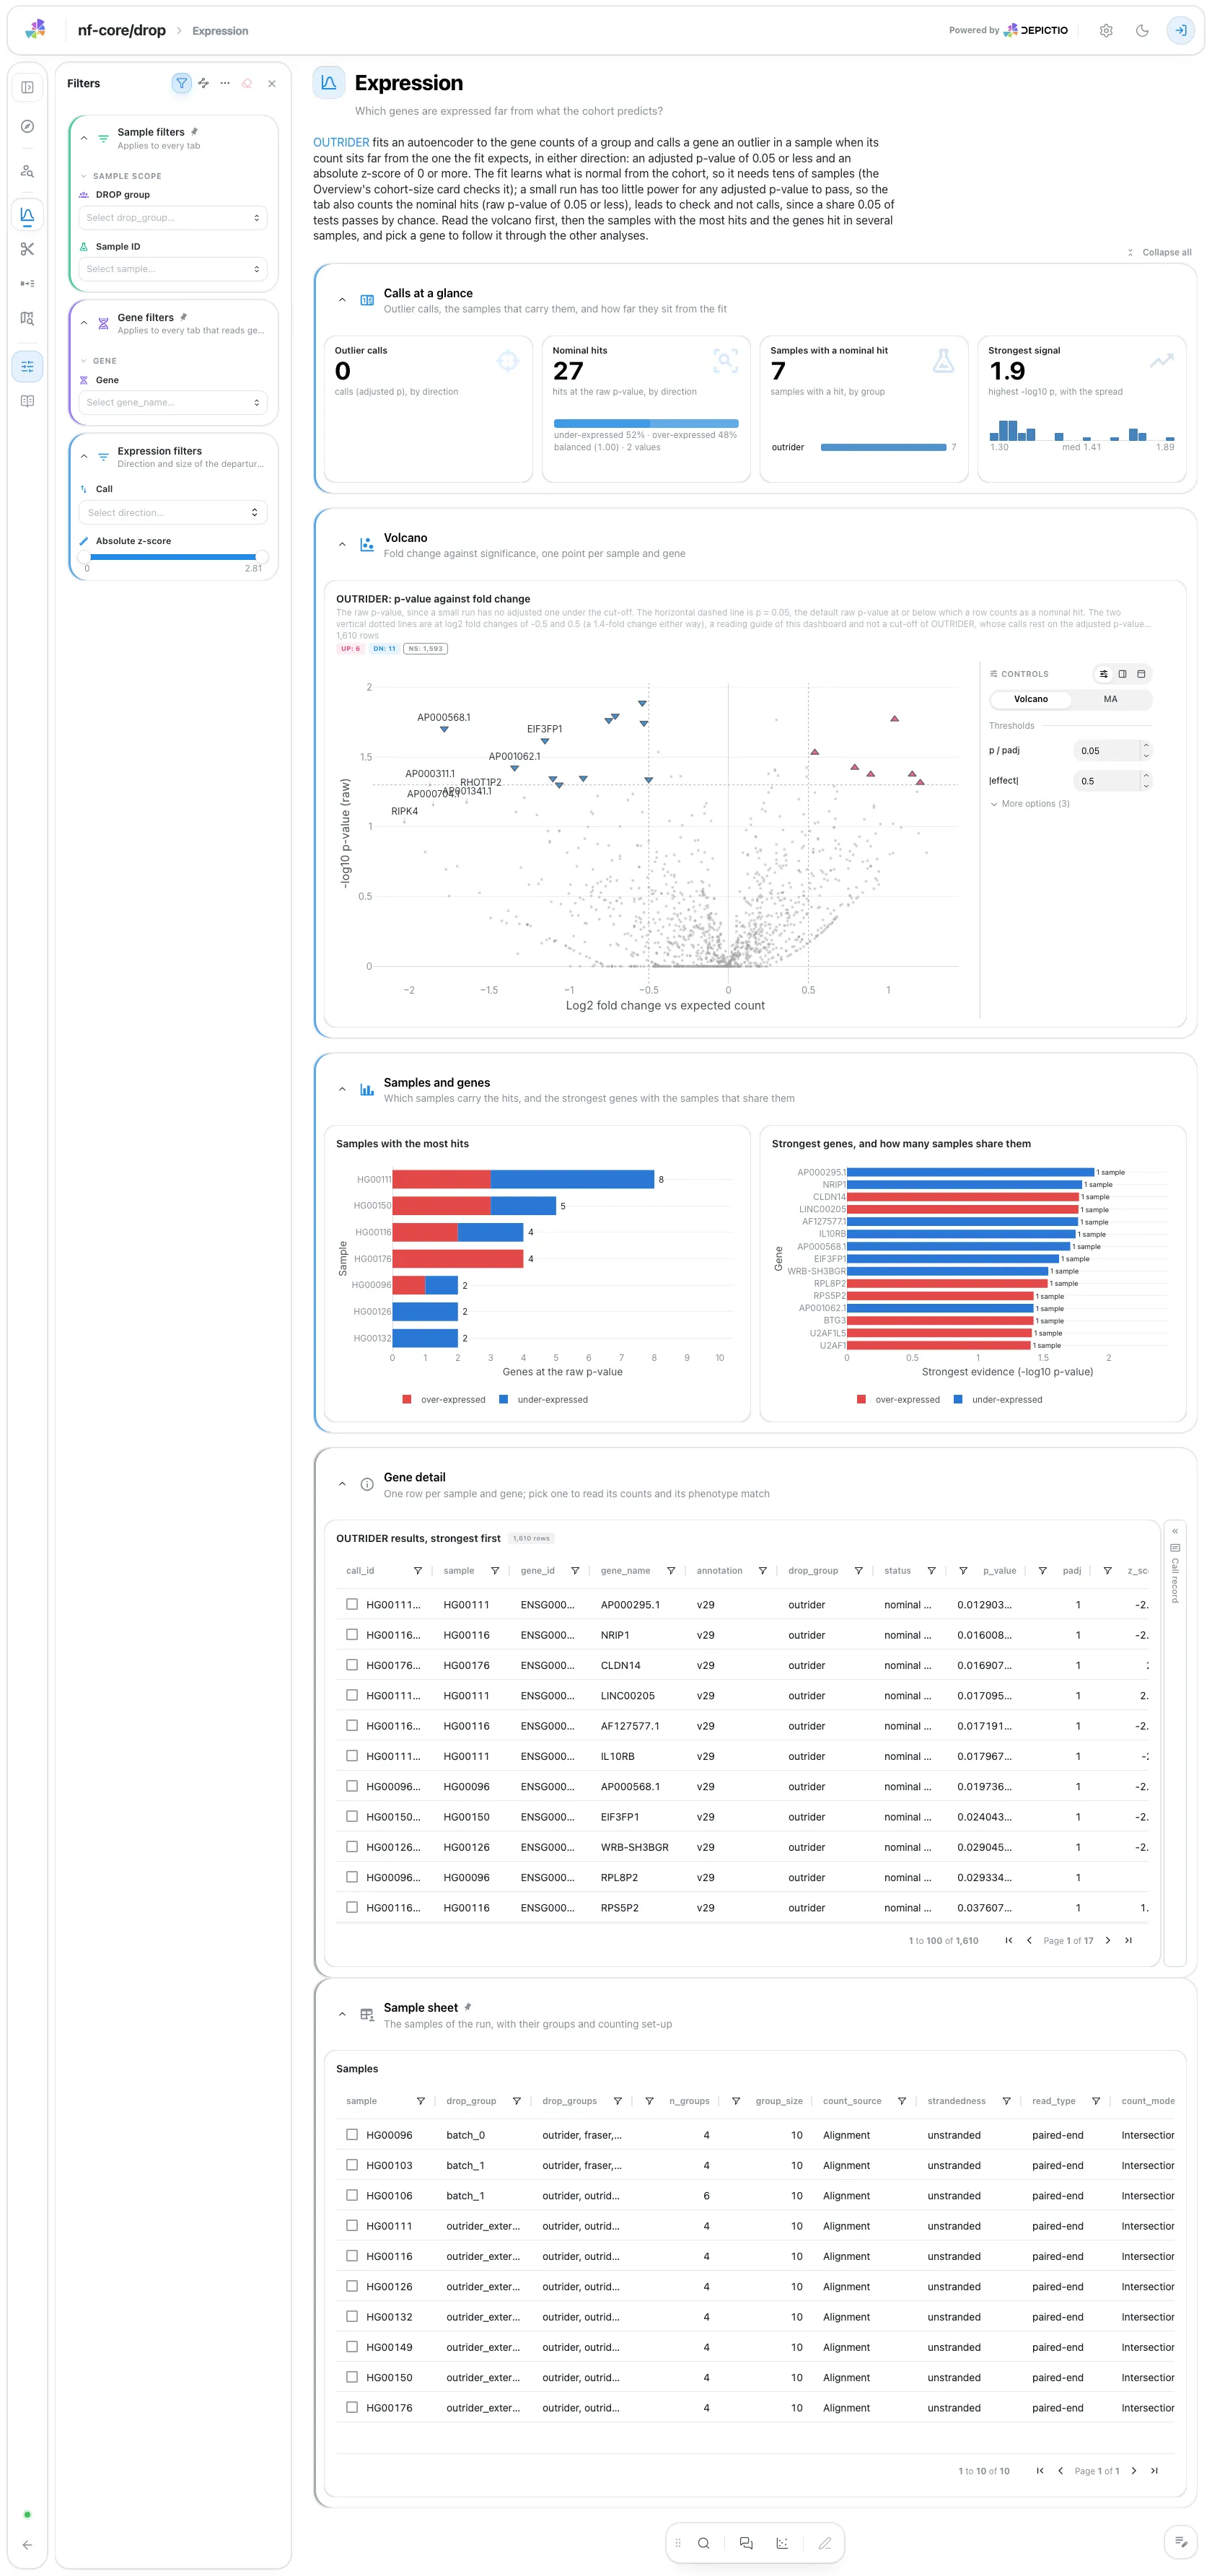
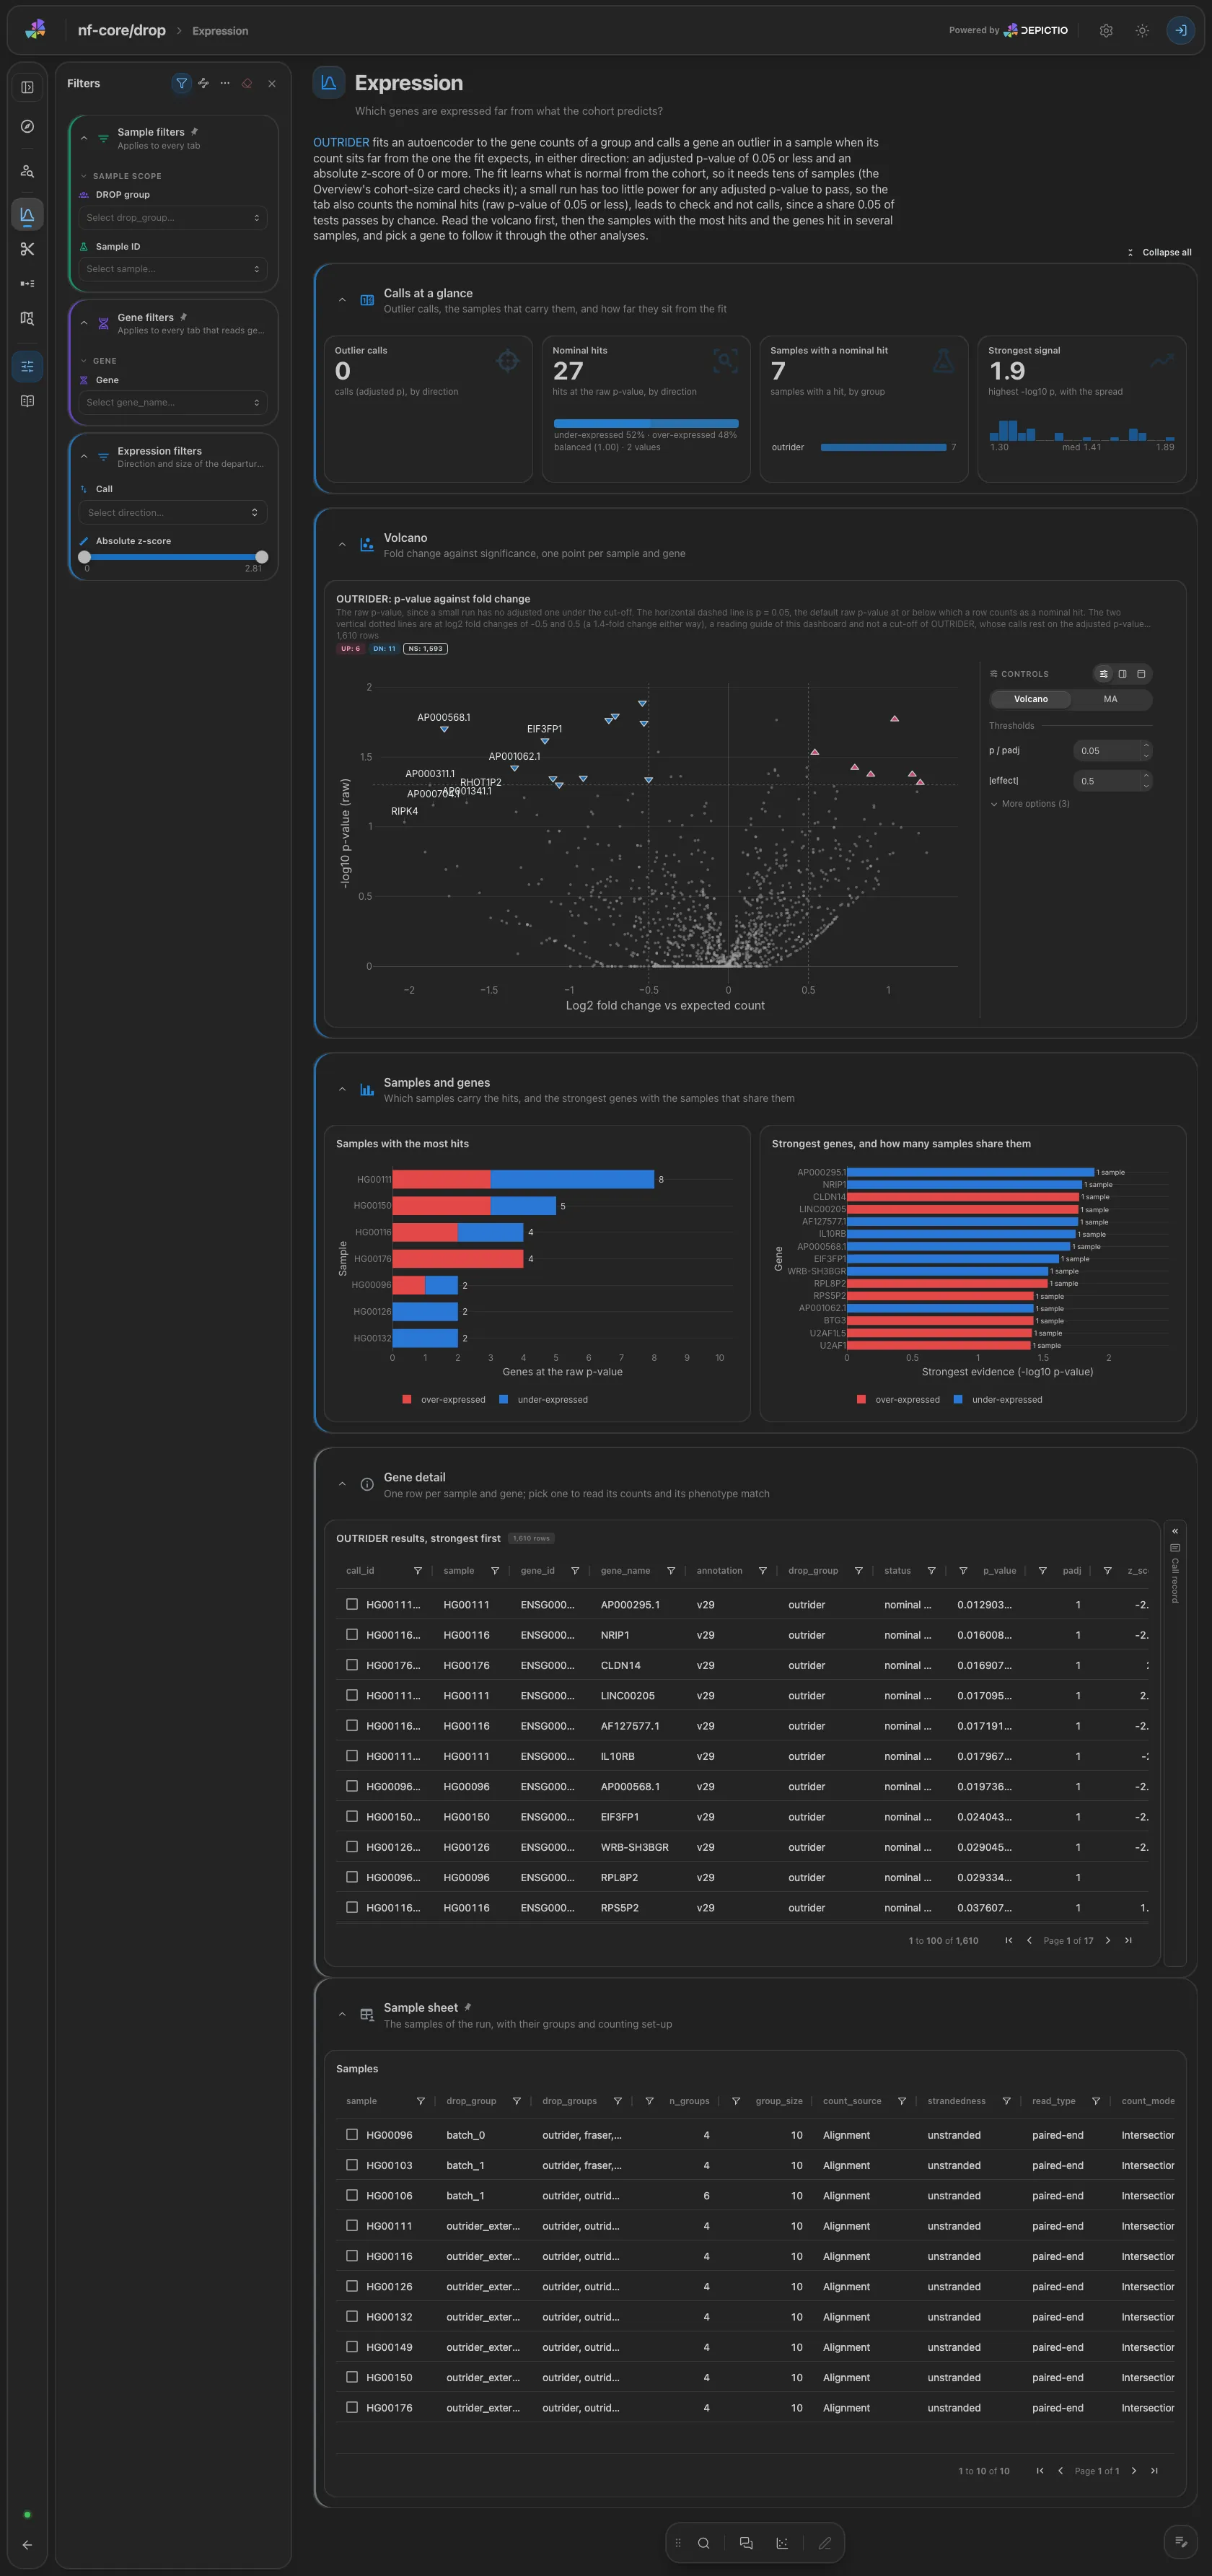
The OUTRIDER volcano of fold change against the raw p-value, coloured by status (called, nominal only, not significant), then the samples with the most hits and the genes hit in the most samples, which are more often technical. The result table and its record card are collapsed. Filters: call direction and absolute z-score.
Analyses · Which junctions are used far more or less than in the cohort?
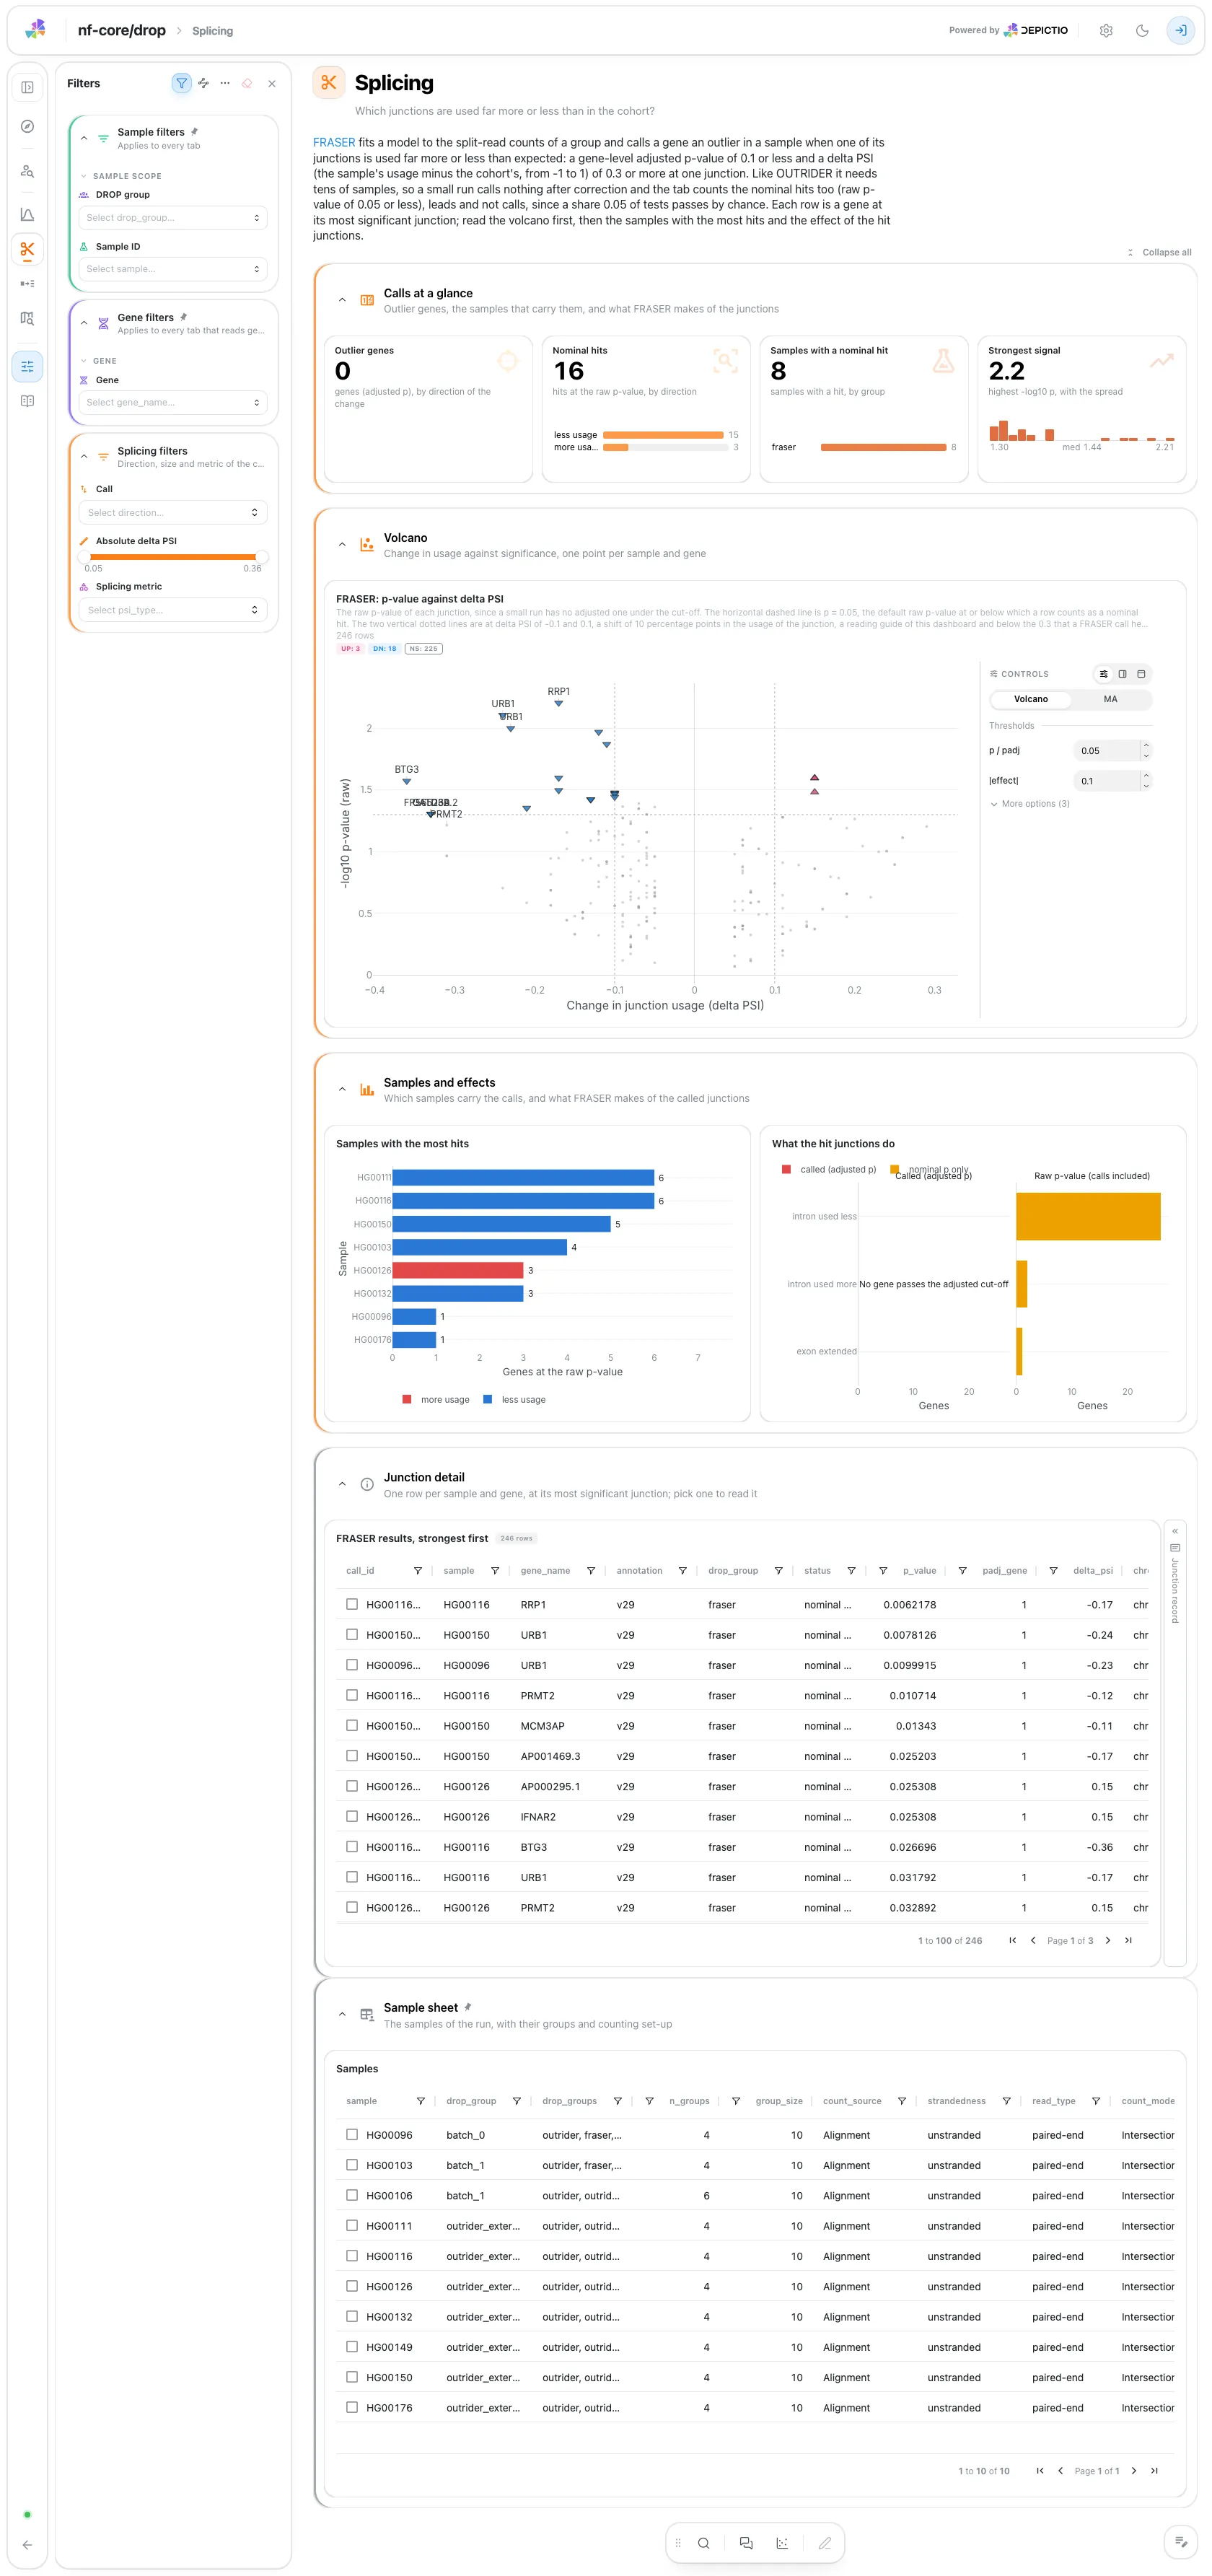
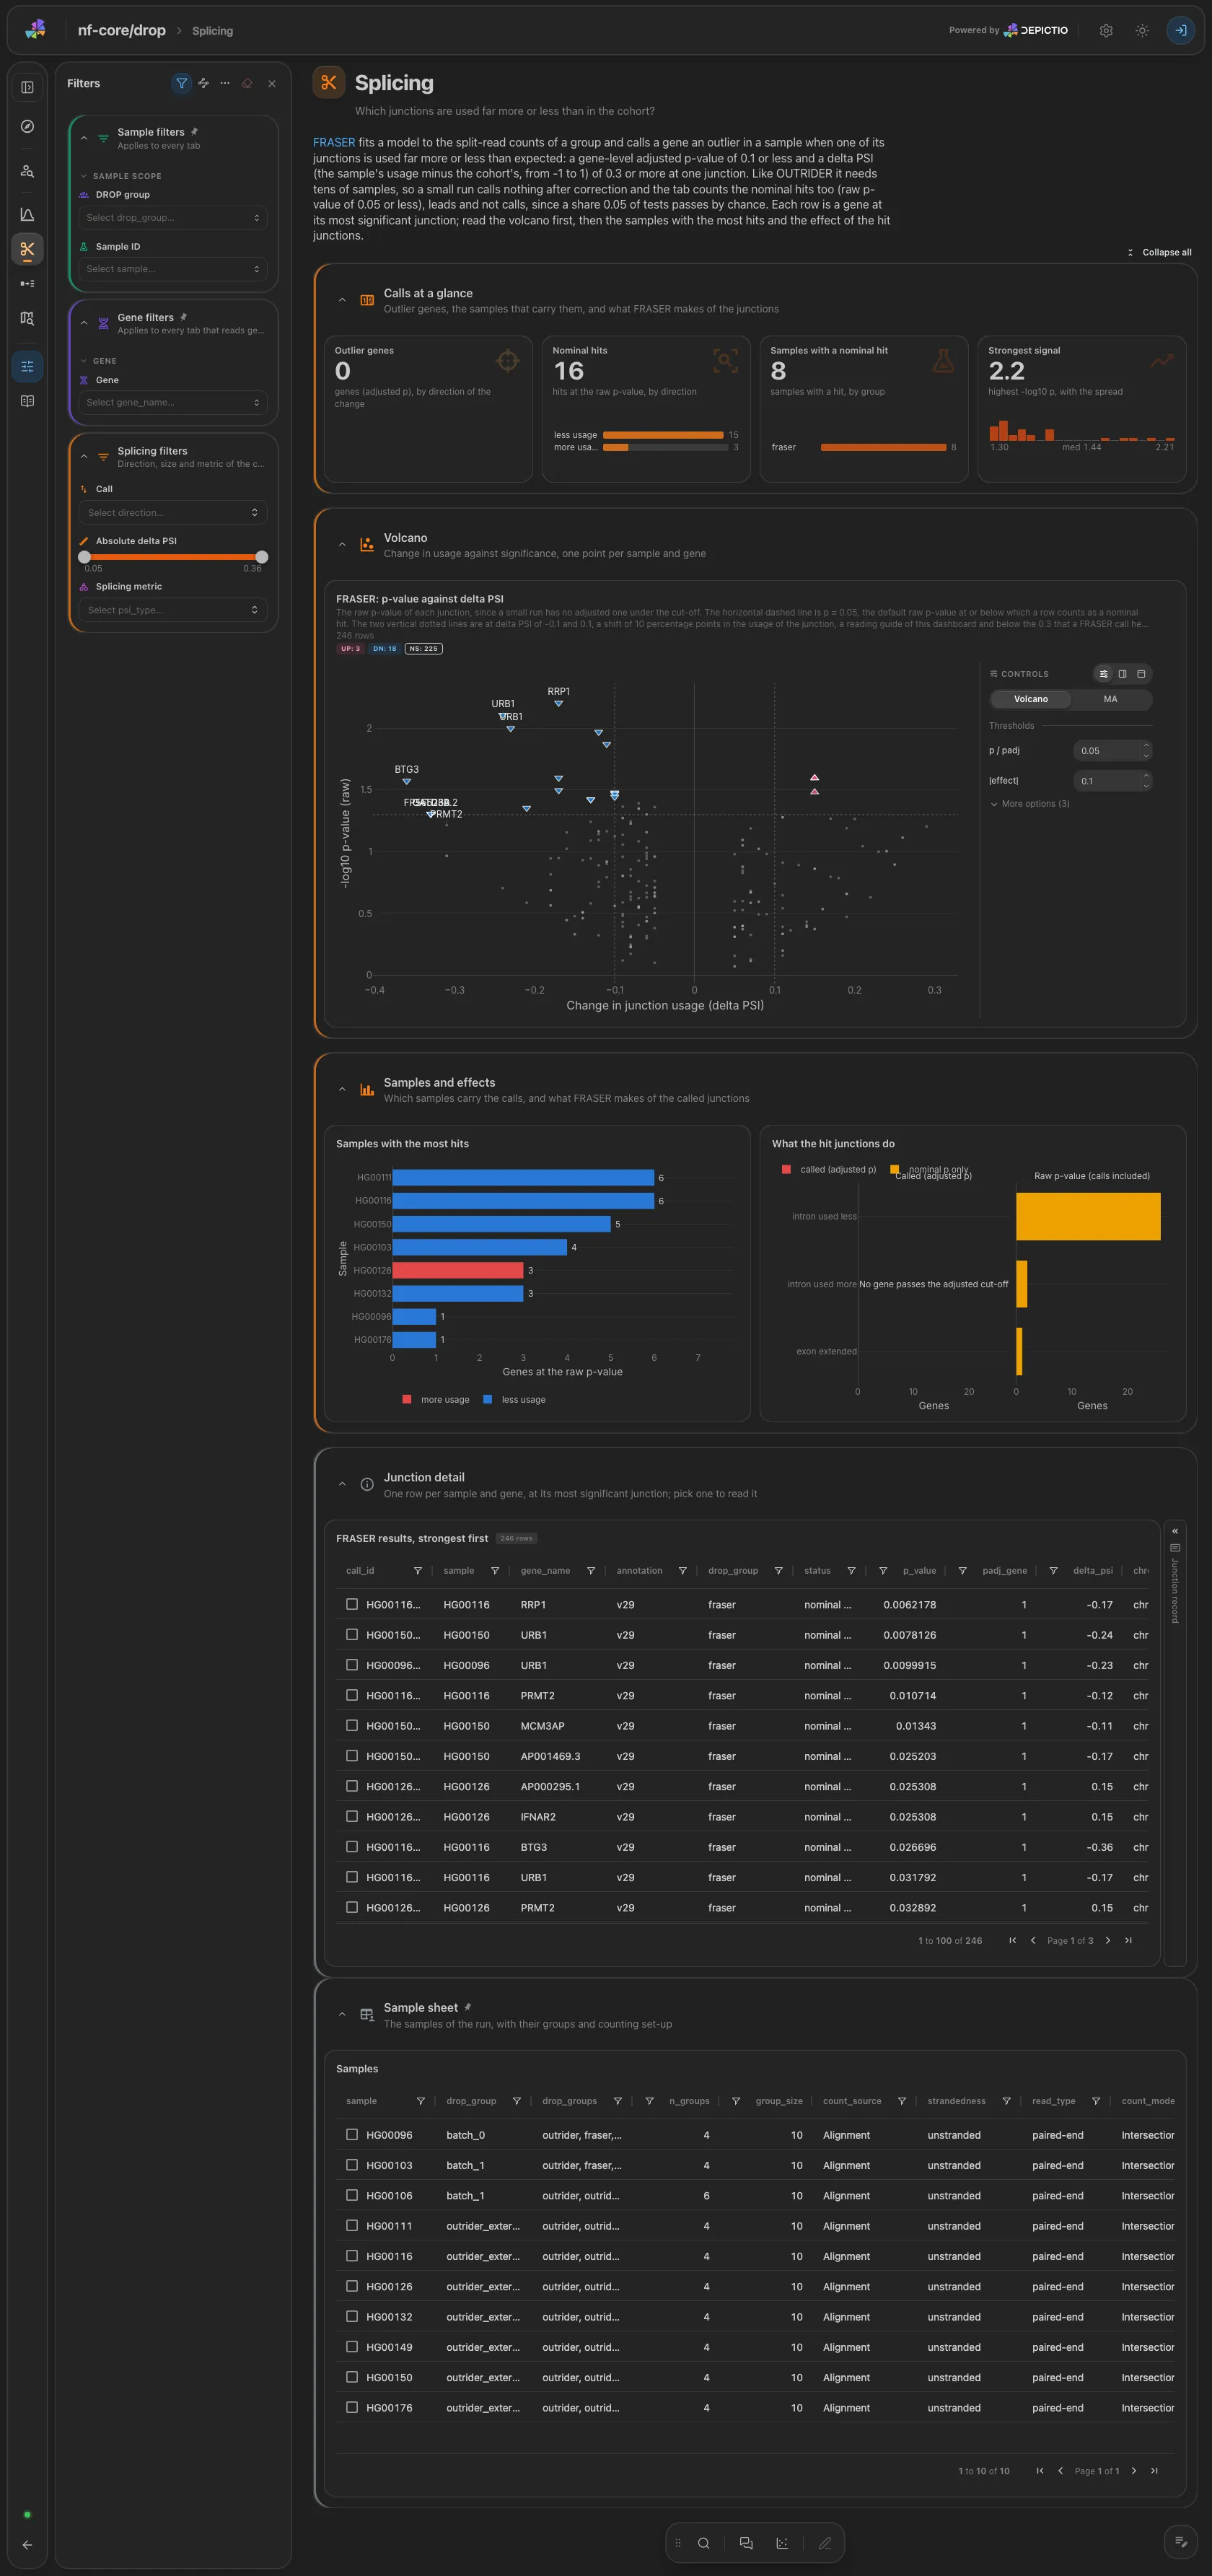
The FRASER volcano of delta PSI against the raw p-value, the samples with the most hits, and what the hit junctions do (an intron used less or more, an exon extended or shortened), for the genes called and for every hit at the raw p-value. The junction table is collapsed. Filters: call direction, absolute delta PSI and splicing metric.
Analyses · Which variants are read from one allele only?
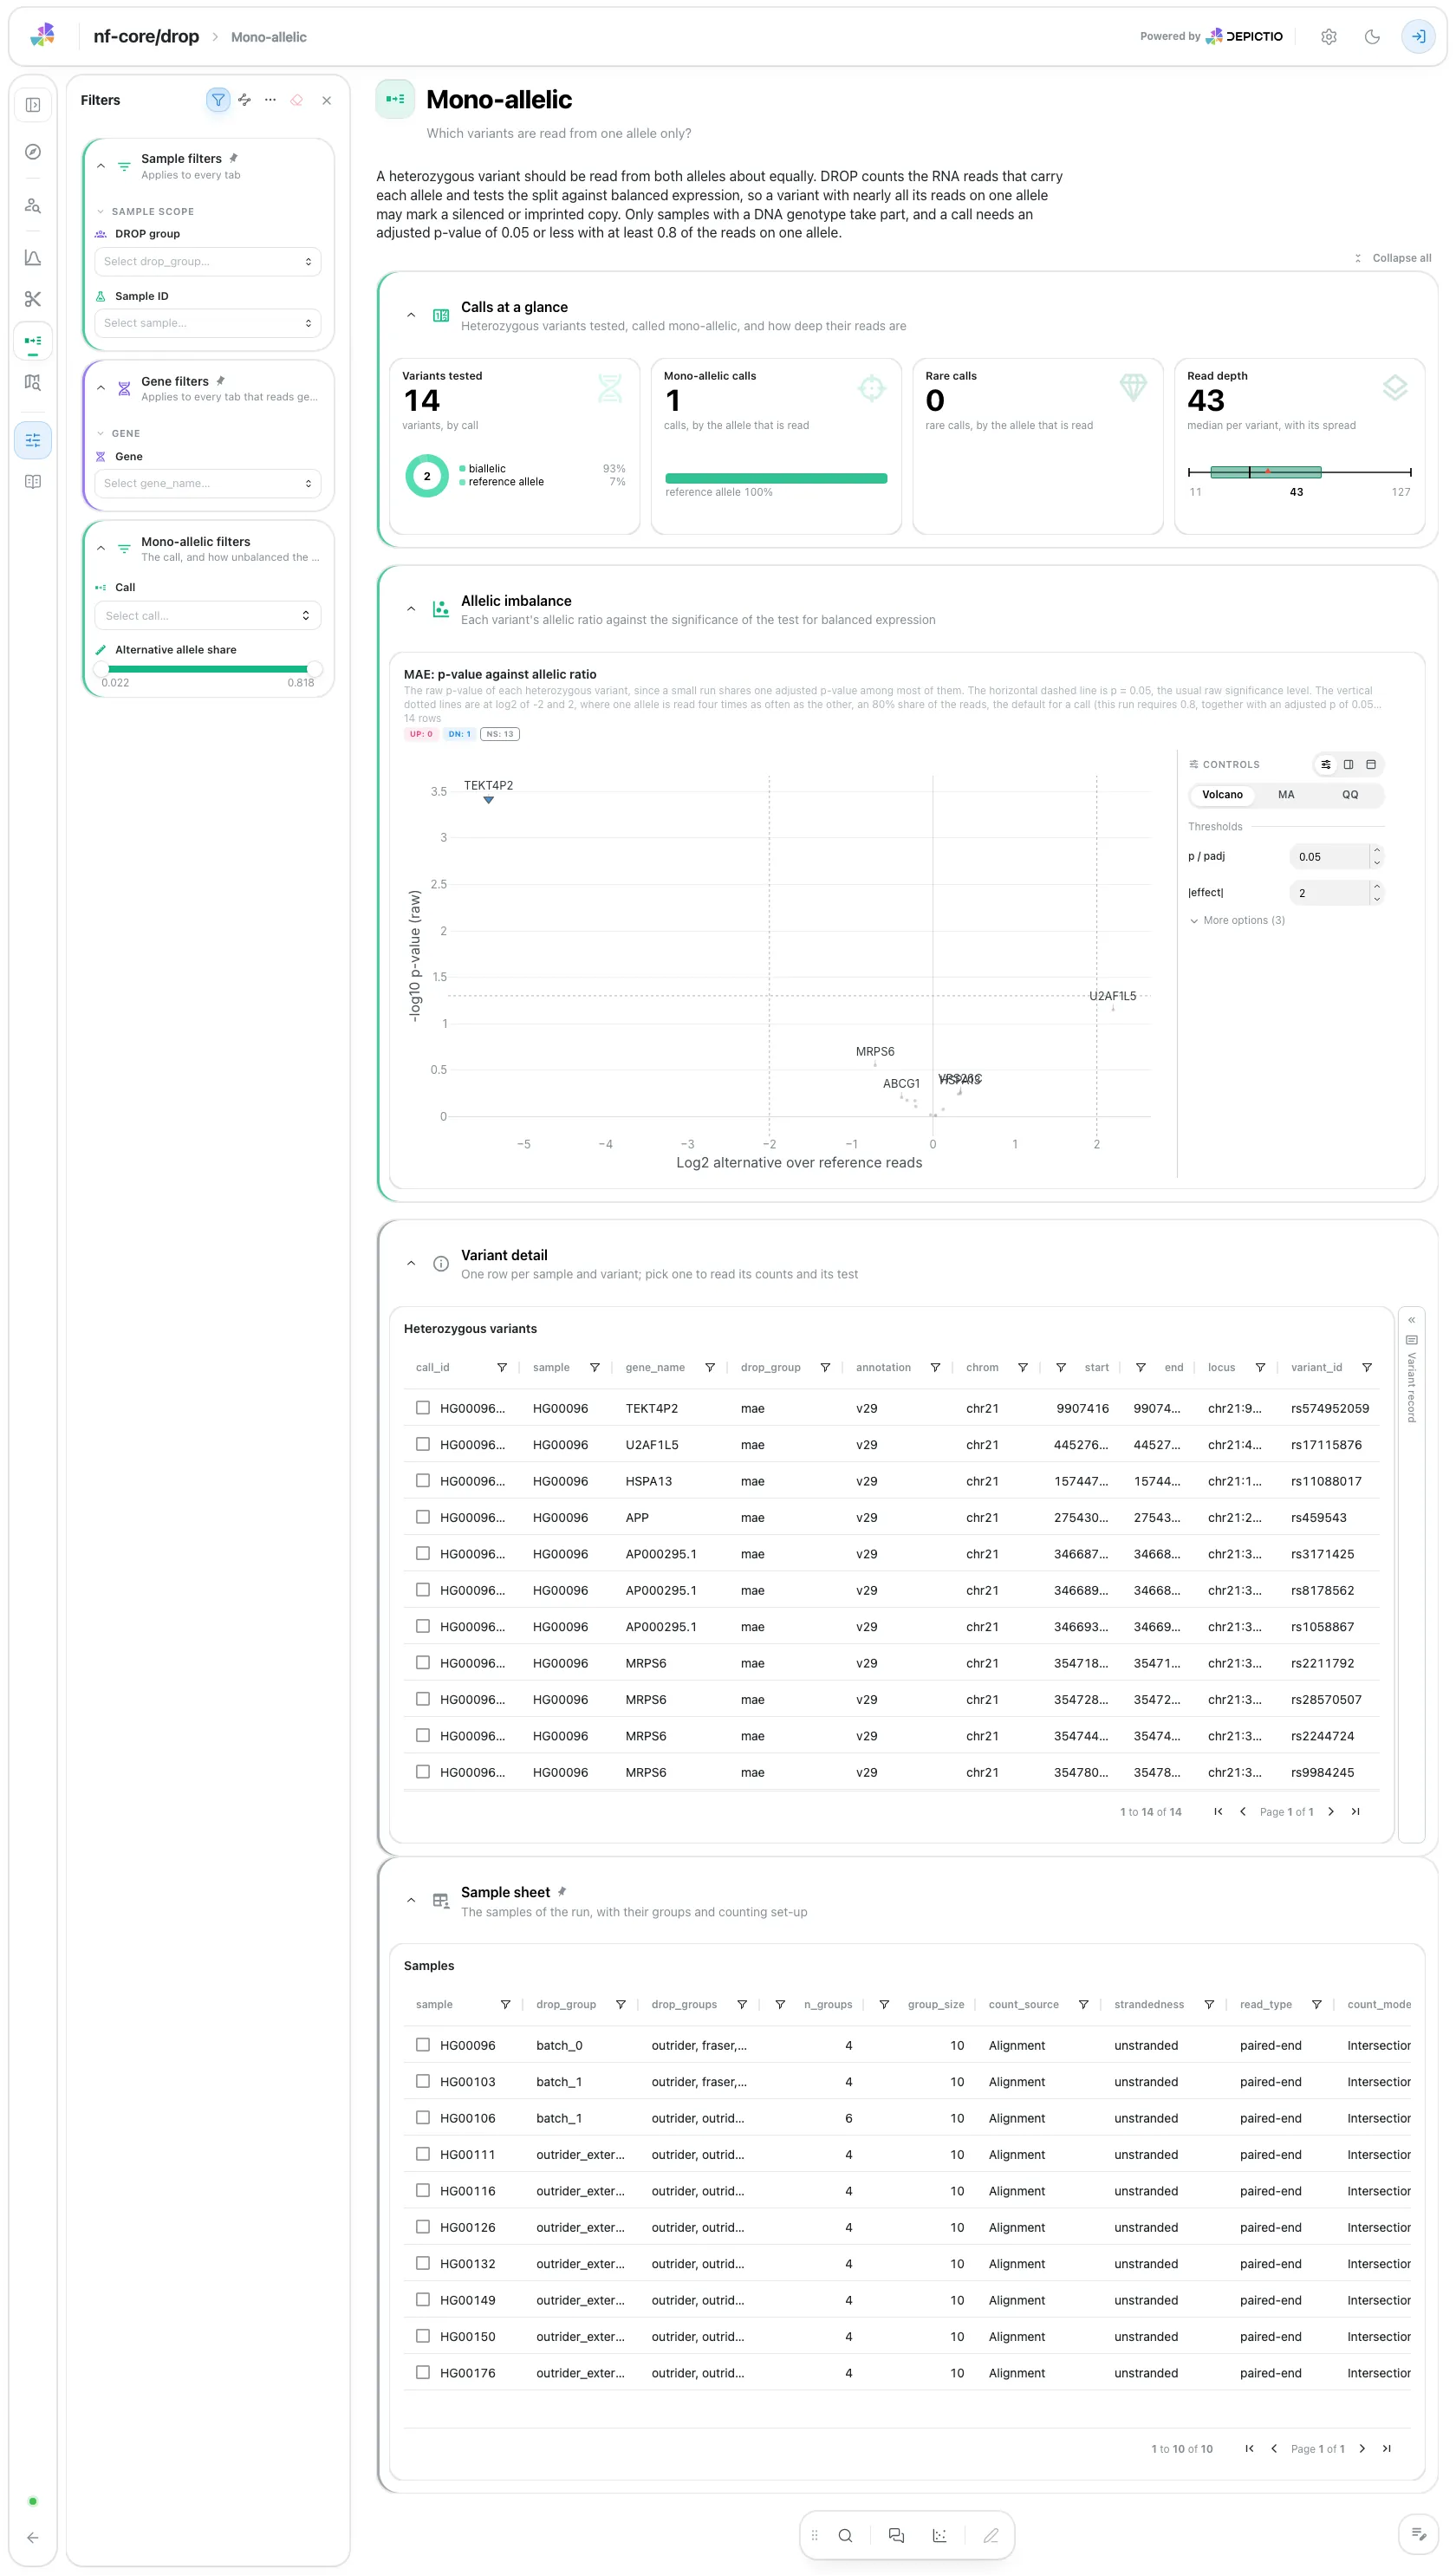
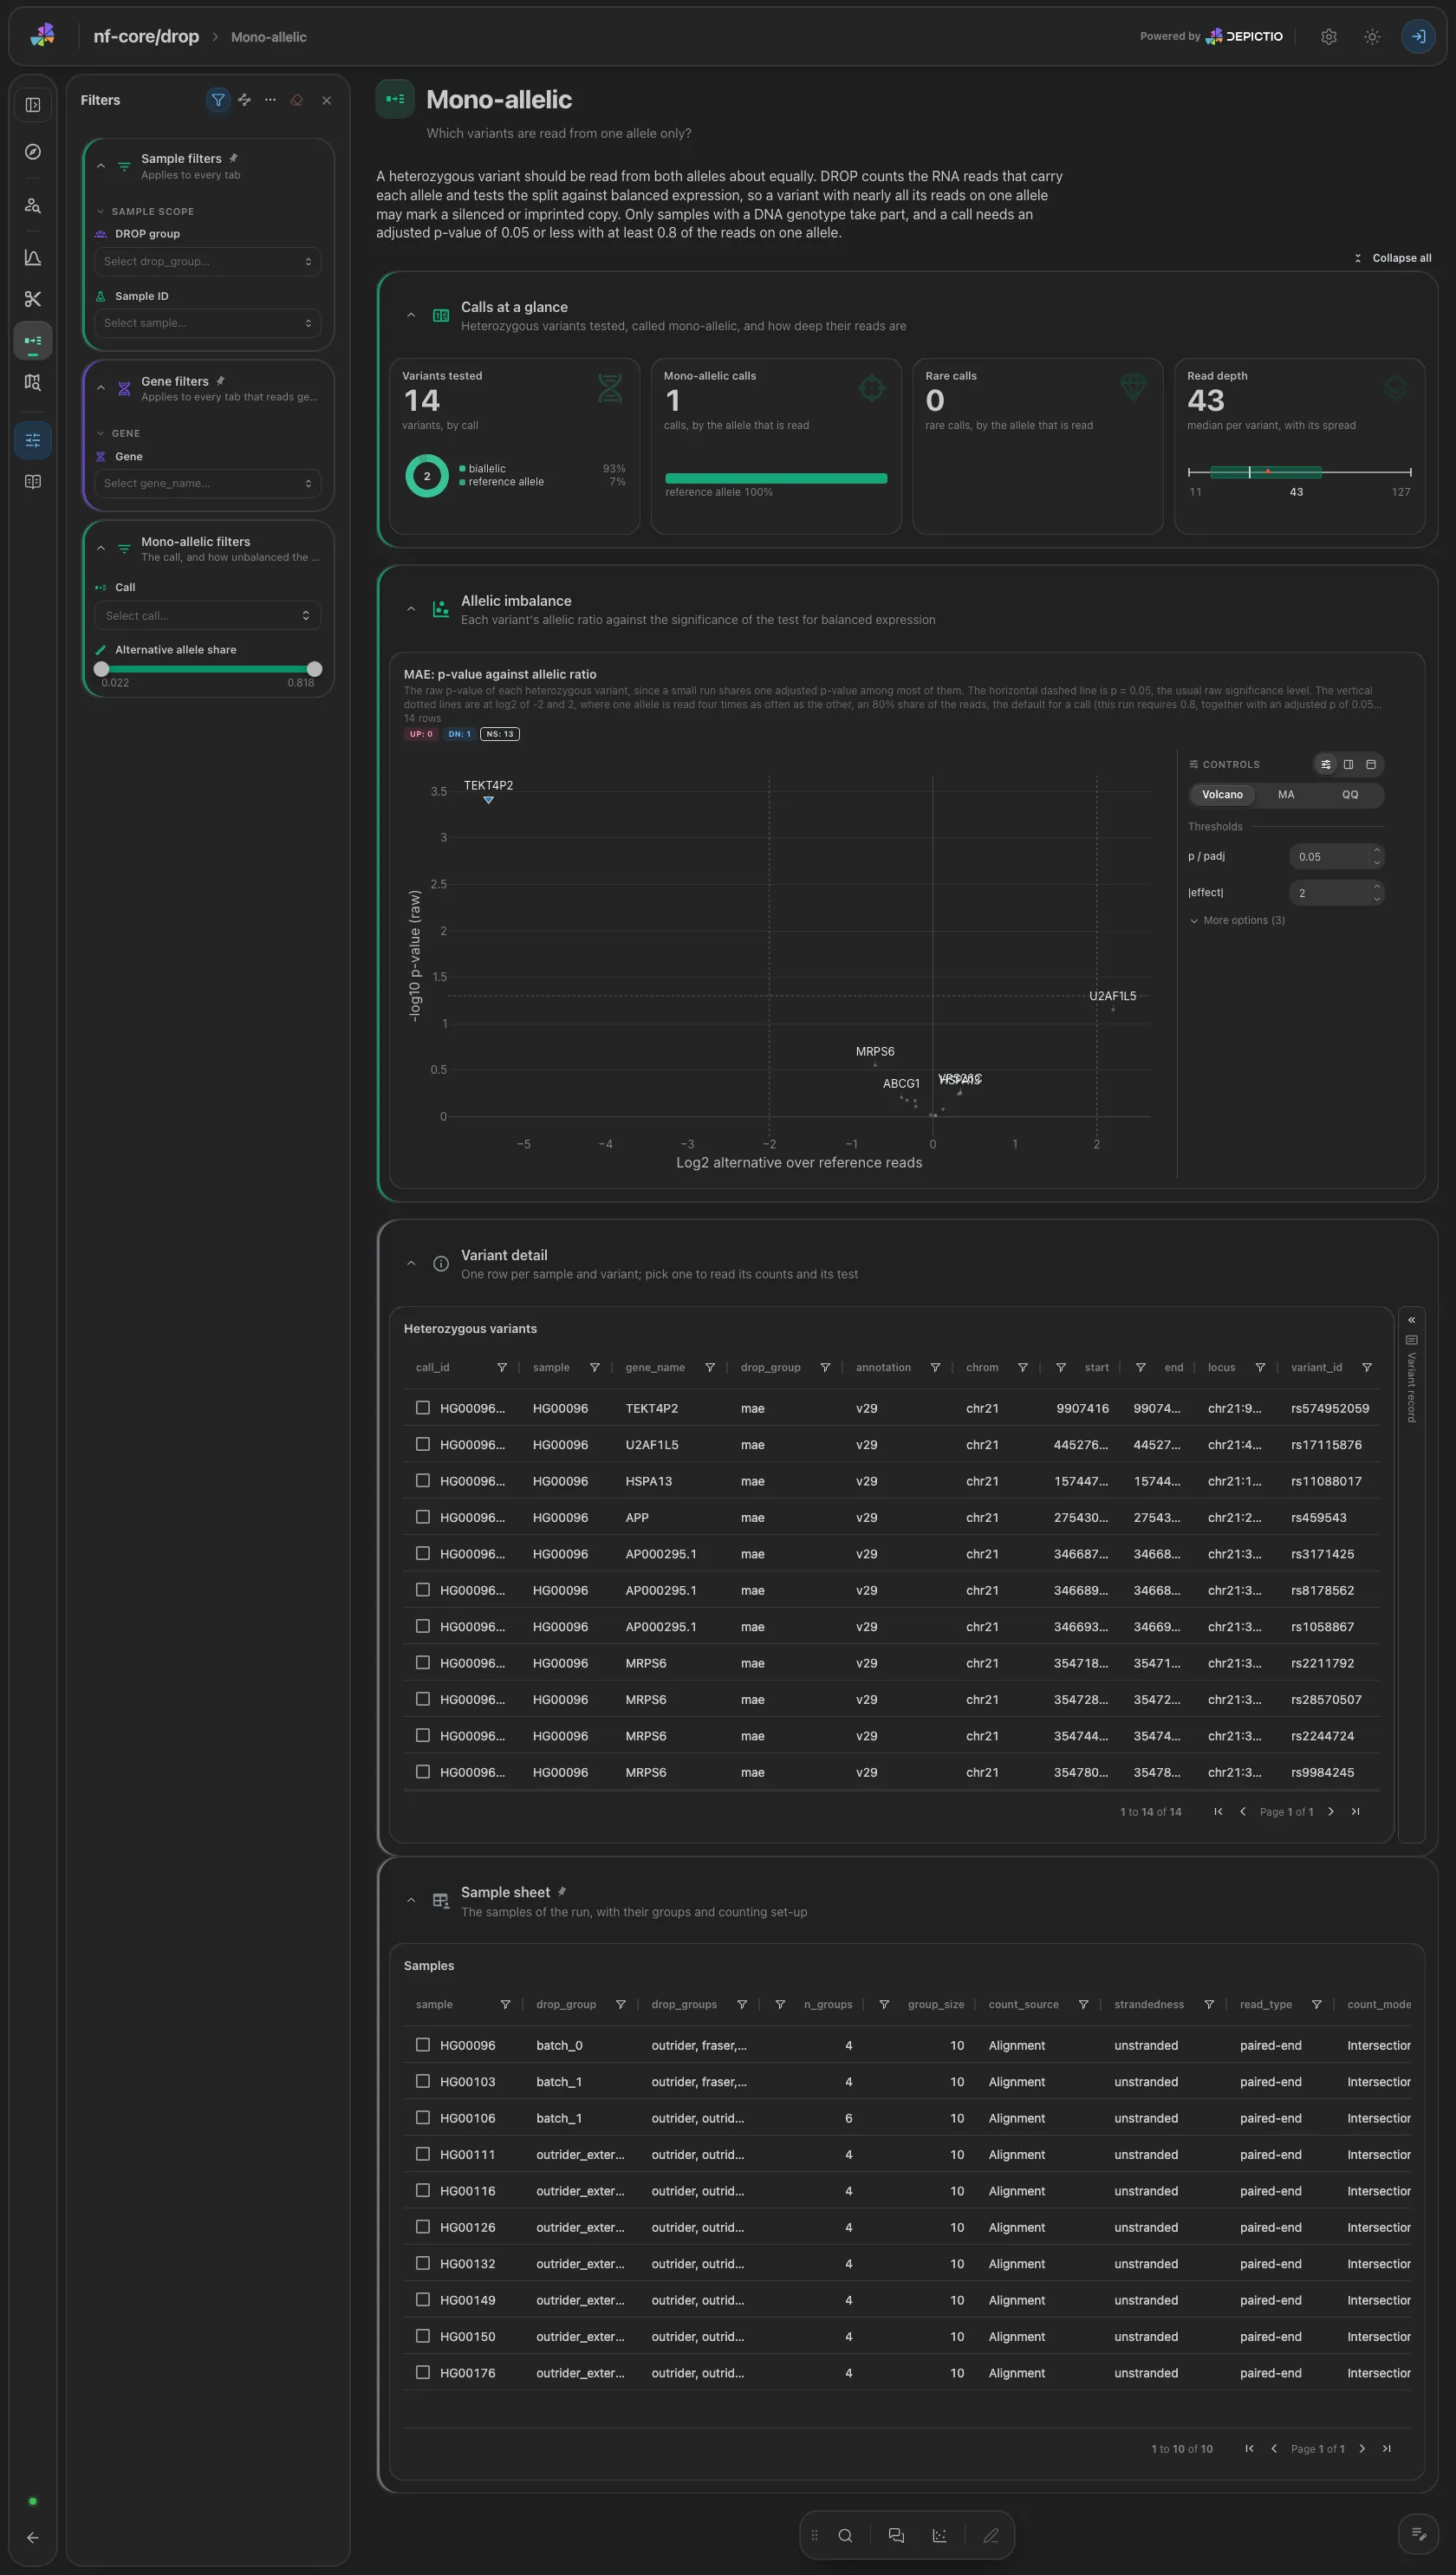
The volcano of the allelic ratio against the raw p-value, full width. The variant table and its record card are collapsed. Only samples with a DNA genotype take part, so a cohort without one drops the tab. Filters: call and alternative allele share.
Analyses · Where on the genome do the called genes sit, and what do the reads show?
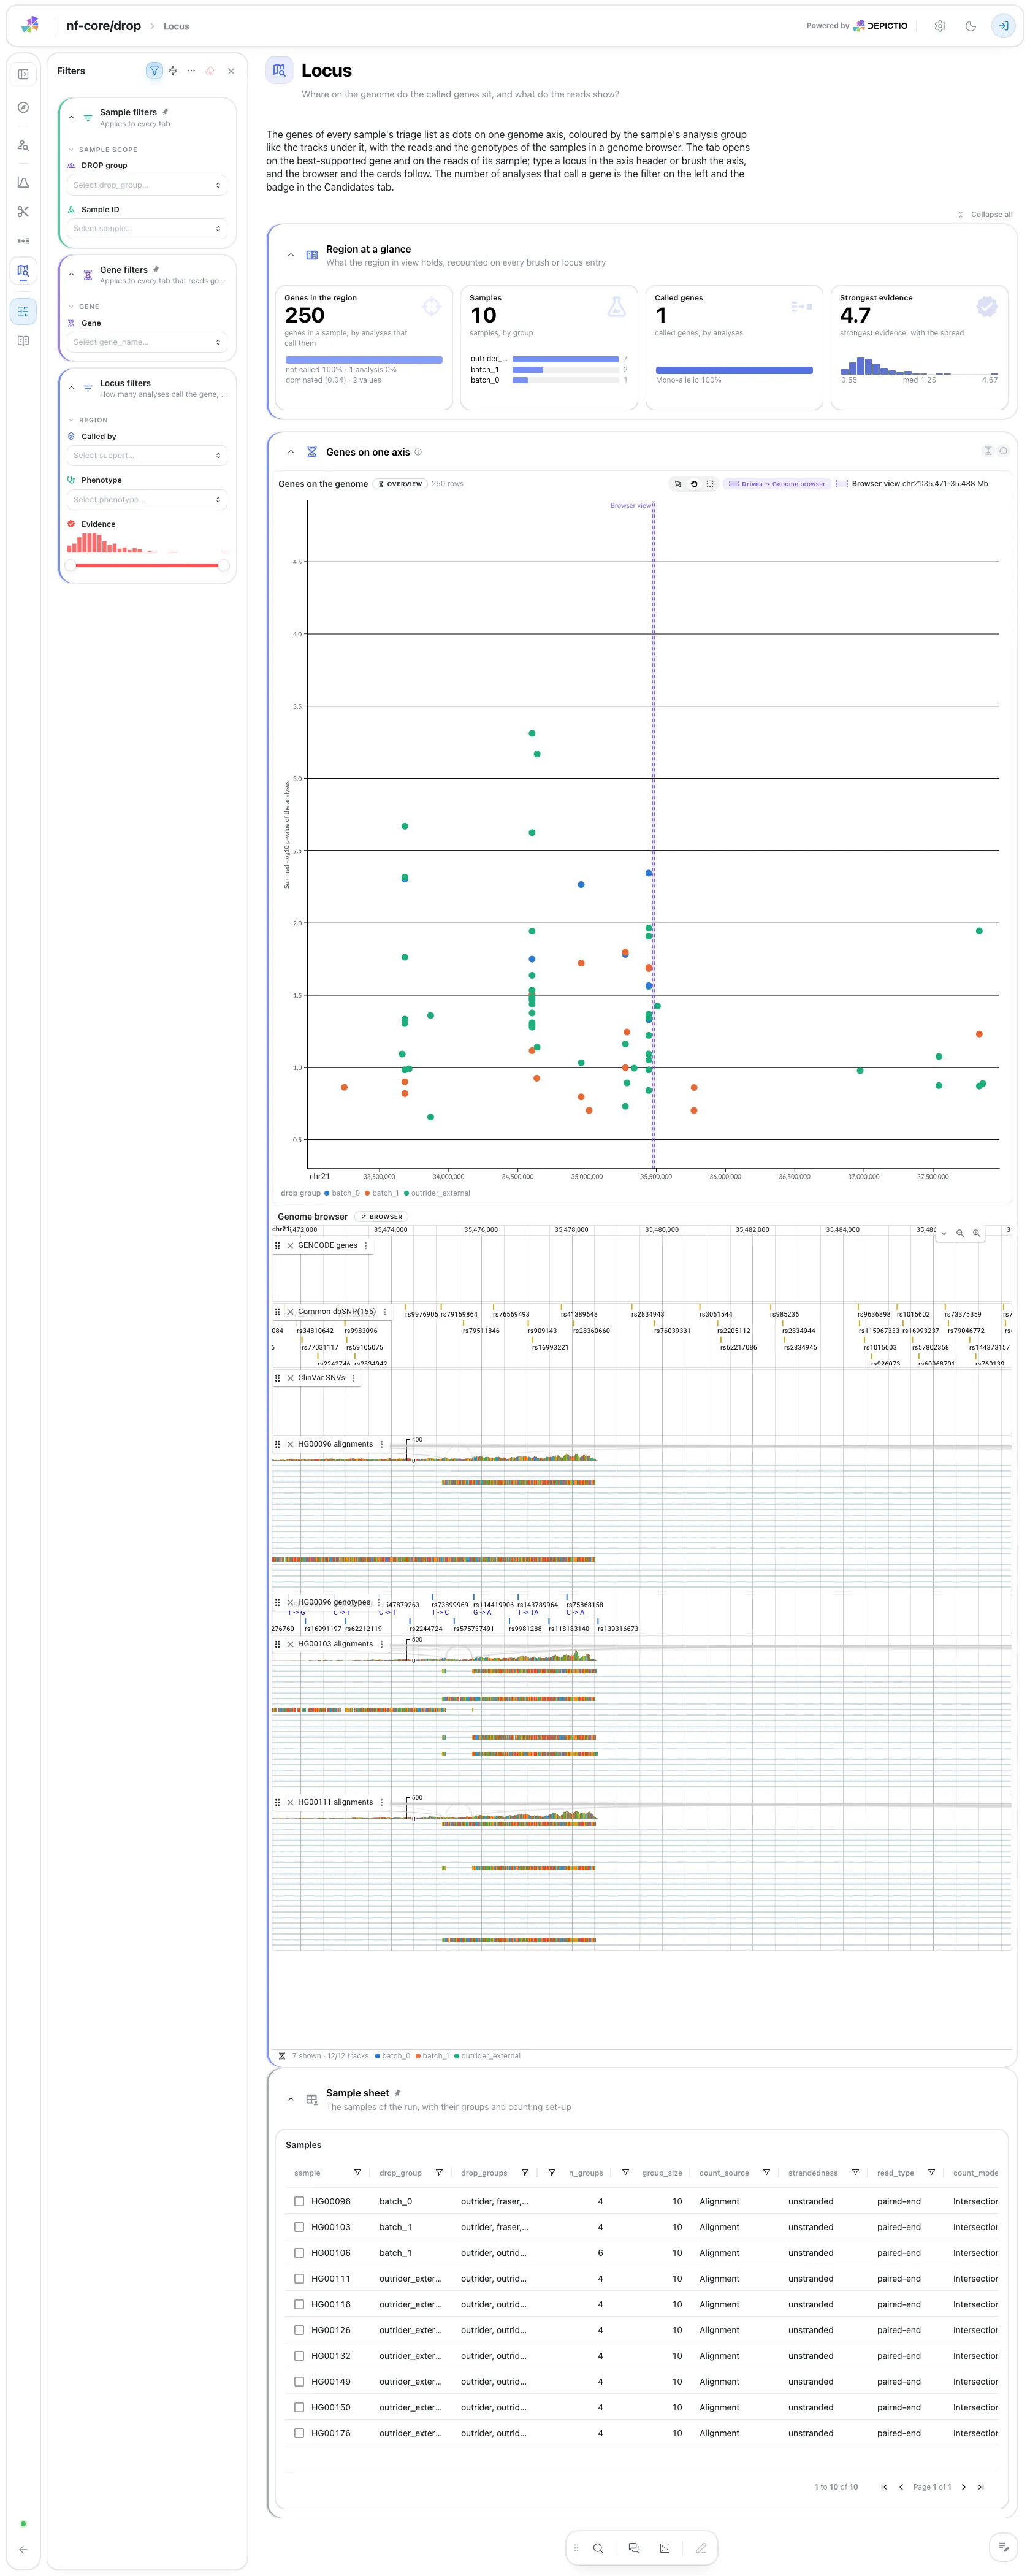
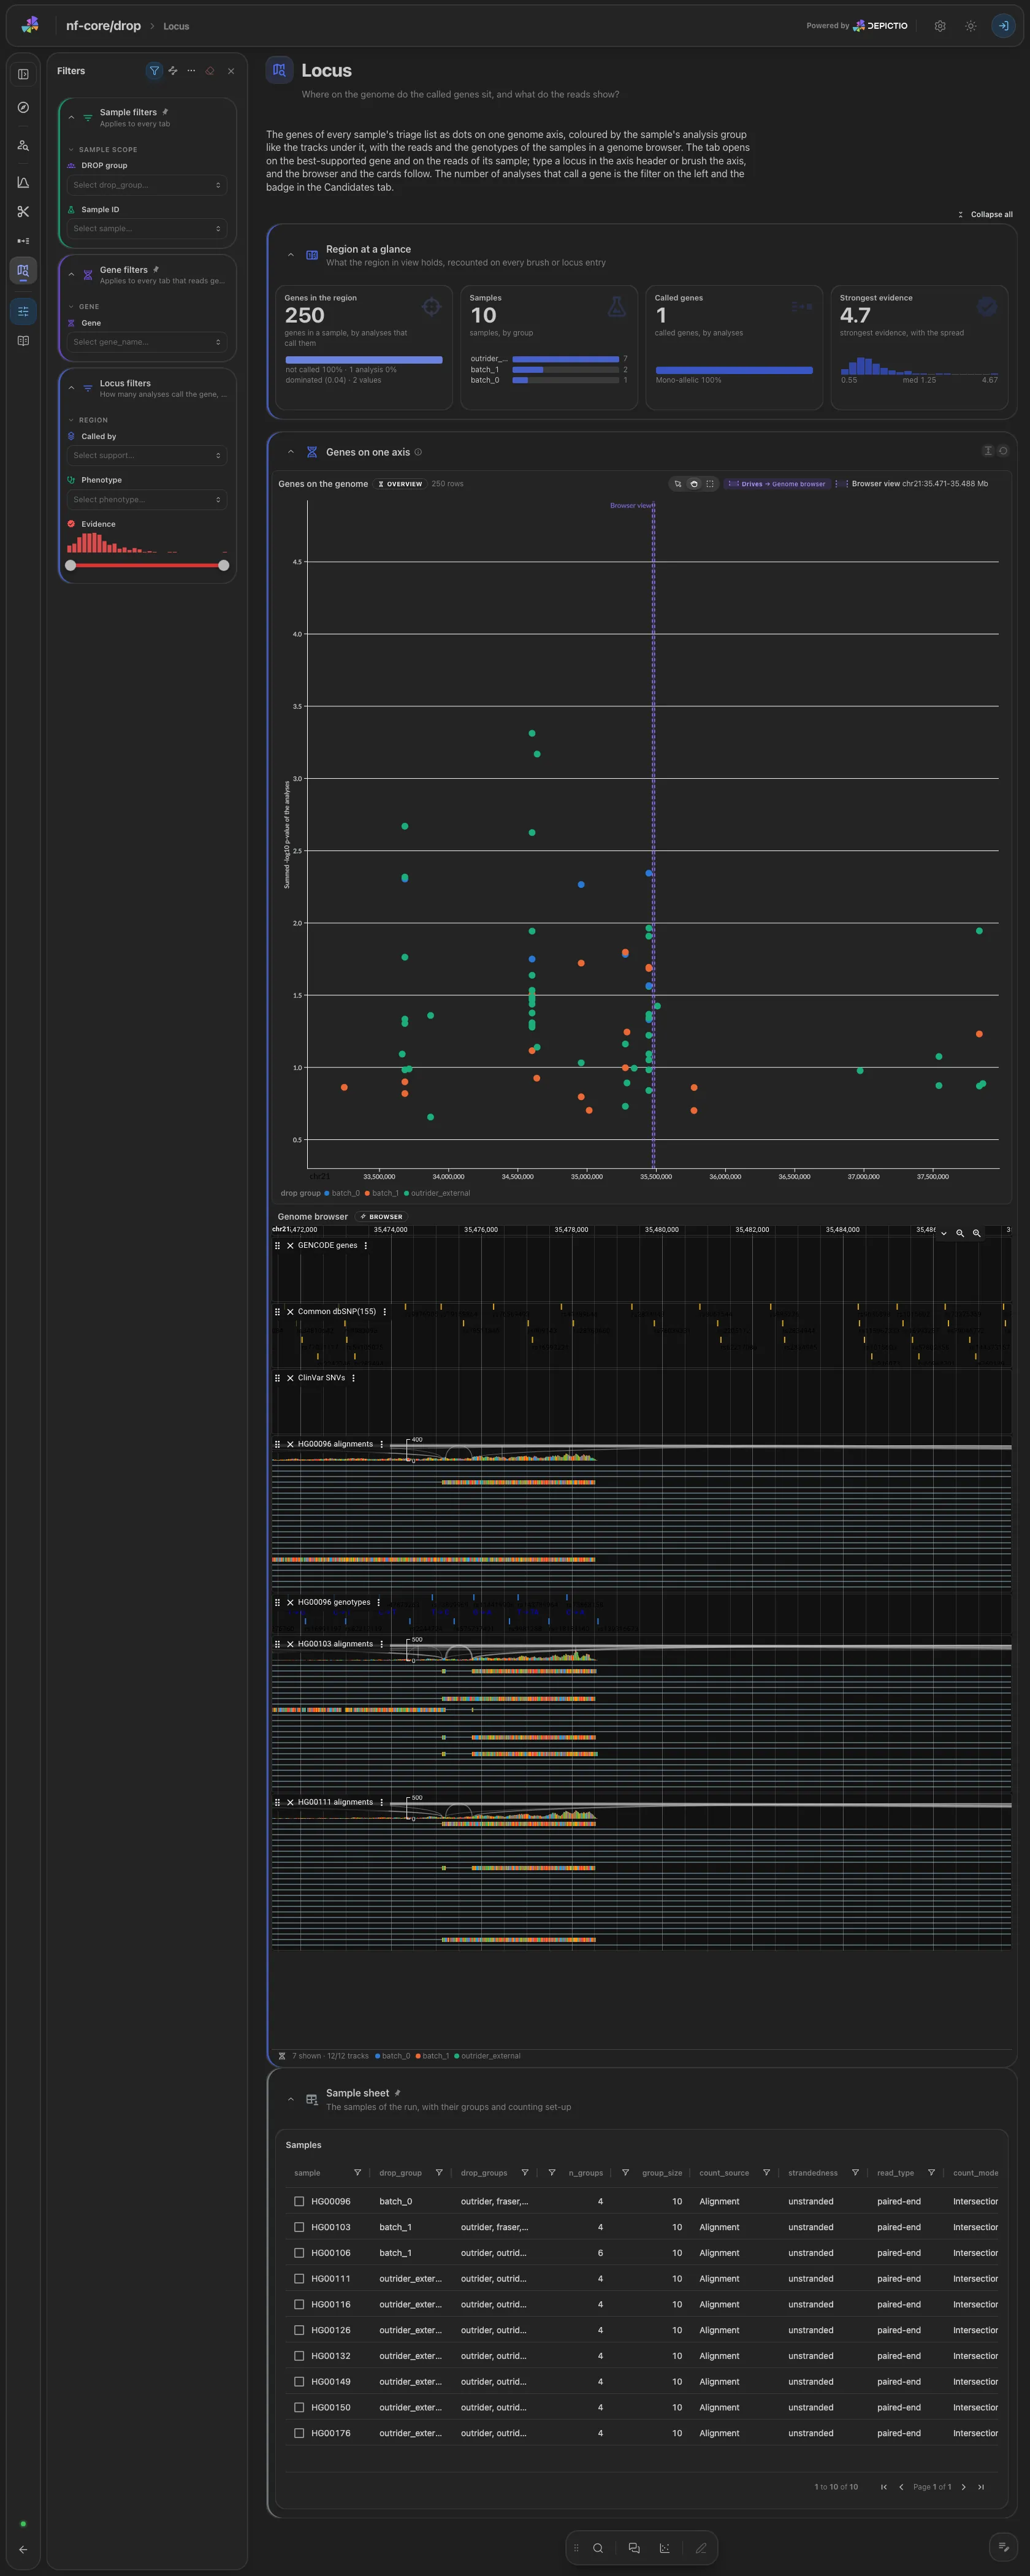
One navigator carries the genes of every sample's triage list on a genome axis, one lane per sample coloured by group, linked to a genome browser with the alignments (with splice-junction arcs) and genotypes of the samples in view. A brush, a pan or a typed locus moves the browser, and the cards recount on the region. The volcanoes of the three analysis tabs open genes in this browser.
Tables select rows: on sample in the sample sheet and on call_id in the triage
list and the three call tables. A pick narrows the other tiles of its collection
and follows the project links to the rest.
Running the pipeline
Depictio reads the output of nf-core/drop, it does not run the pipeline. Run the pipeline first:
Then point Depictio at the results, naming the sample sheet the pipeline did not publish:
See nf-co.re/drop/usage for full pipeline documentation.
Required data structure
Point depictio ingest at the directory holding the pipeline output. Depictio scans
recursively and matches on file name.
<DATA_ROOT>/
├── input/
│   └── samplesheet.tsv                         # --var SAMPLESHEET (not published by the pipeline)
├── pipeline_info/params_*.json
└── processed_results/
    ├── aberrant_expression/<annotation>/outrider/<group>/OUTRIDER_results.tsv
    ├── aberrant_splicing/results/<annotation>/fraser/<group>/results.tsv
    └── mae/
        ├── <group>/MAE_results_all_<annotation>.tsv.gz
        └── gene_name_mapping_<annotation>.tsv  # optional: gives expression calls a locus
The Locus tab reads the alignments (RNA_BAM_FILE) and genotypes (DNA_VCF_FILE)
that the sample sheet points at, not pipeline outputs. Paths under DATA_ROOT are
uploaded at ingestion; https:// and s3:// paths are read in place.
Validation runs
The AWS megatest bucket publishes no result tables for drop, so the template was
validated on the real DROP outputs of the pipeline's own small test run, published
in the nf-core/test-datasets drop branch.
download_test_data.sh
lays them out the way the pipeline writes them (about 55 MB) and copies the
vendored sample sheet into input/:
bash depictio/projects/nf-core/drop/1.0.0/download_test_data.sh /tmp/drop_test
depictio ingest /tmp/drop_test --template nf-core/drop/latest
That run is degenerate on purpose (ten samples, no significant call), so it exercises the recipes and the layout rather than the statistics.
Additional resources
- nf-co.re/drop: official pipeline documentation
- Template System Reference: YAML format, variables, conditionals
- Recipes: how to read, test, and write recipes
Authorship
 weber8thomas
Reviewing a template on your own data, or taking over a role here, is a contribution in itself: the contributing guide says what each one involves.