

The taxprofiler template covers the standardised outputs of an nf-core/taxprofiler run, whichever classifiers it used:
- Overview: the run in four key figures, live findings and four figures, each linked to the tab that explains it
- Data & QC: FastQC and fastp, host removal, nanopore read stats and coverage redundancy from the MultiQC report, and the sequencing depth Nonpareil models
- Communities: the composition per profiling run beside sylph containment and melon genome copies, and the diversity of each profile
- Classifiers: a Bray-Curtis ordination over every profiling run, the classifier overlap as an UpSet, the taxonomic flow, and sylph containment identity
Whatever profilers your run used
taxprofiler runs an arbitrary subset of its profilers, chosen by the database
sheet and the run_* flags. The template deliberately does not gate each
profiler behind a variable: every profiler-specific data collection is
optional, and the self-adapting layout drops whatever a run did not produce.
One template covers a two-profiler run and a fifteen-profiler run alike.
taxpasta is the hub
One data collection per profiler would make the template's shape depend on
the run's flags, so instead every taxpasta/*.tsv is melted into one long
profiler, database, sample and taxon frame, and the presence matrix, the
Bray-Curtis PCoA ordination, the concordance matrix and the per-sample
summary all read it back. Two tools sit beside it because taxpasta has no
parser for either: sylph (containment ANI) and melon (genome copies from
nanopore marker genes). MetaPhlAn reuses an existing catalog entry.
Quick start
The results directory is the only thing you have to pass. The samplesheet is
auto-detected from {DATA_ROOT}/input/; pass --var SAMPLESHEET_FILE=...
to point elsewhere. The run_* flags come from pipeline_info/params.json.
depictio config nextflow --install     # once per machine
nextflow run nf-core/taxprofiler -r 2.0.1 -profile docker --outdir results
No depictio ingest, and no template named: the pipeline ingests its own
output directory when it finishes and resolves this template from its own
manifest. See Nextflow trigger.
Reference
The template reads the taxpasta standardised tables, the profilers' own report
files, sylph's containment tables, melon's genome-copy tables and the pipeline's
MultiQC parquet. Profiler and database ids are recovered from the taxpasta file
names, so no profiler variable is needed. A project-local recipe repairs the
taxon names that taxprofiler's --add-name false taxpasta invocation drops,
joining them back from the kraken2, krakenuniq and centrifuge reports.
Self-adapting layout
The dashboard adapts to whatever the run actually produced: components bound to pruned or unparsed data collections are hidden, tabs left with no real visualizations are dropped entirely, and the remaining components are re-packed so there are no empty rows. A profiler that ran but assigned nothing drops out the same way.
Template variables
Variables you provide when running the template: DATA_ROOT is the results directory given to depictio ingest, the others are set with --var NAME=value:
| Variable | Required | Description |
|---|---|---|
DATA_ROOT |
✓ | Root directory containing taxprofiler pipeline output (multiqc/, taxpasta/, one directory per profiler) |
SAMPLESHEET_FILE |
— | Path to the taxprofiler samplesheet (sample, run_accession, instrument_platform, fastq_1, fastq_2, fasta). Auto-detected from {DATA_ROOT}/input/ when omitted; supplies the sample ids and the sequencing platform the profiles are annotated with. |
Data collections
15 data collections — 7 required 8 optional · 7 direct 8 derived.
Origin tells you whether a collection is real pipeline data or a reshape of it: direct = a pipeline output (scanned, or a recipe that reads raw files); derived = a recipe that reshapes one or more direct collections into the layout a visualization needs (no new measurement). Reads shows what produces it: a recipe .py transform, whose name links to its source on GitHub, or a raw file scanned off disk. (A direct collection can still have a recipe — one that merely parses/cleans the raw file; derived means the recipe reshapes another collection.)
| Tag | Origin | Type | Reads | Status |
|---|---|---|---|---|
samplesheet |
direct | Table | file {SAMPLESHEET_FILE} |
optional |
database_sheet |
direct | Table | file (?:./)?database..csv$ |
optional |
taxon_names |
direct | Table | recipe nf-core/taxprofiler/taxon_names.py |
optional |
taxpasta_profiles |
derived | Table | recipe taxpasta/profiles.py |
required |
taxpasta_lineage |
derived | Table | recipe taxpasta/lineage.py |
required |
taxpasta_matrix |
derived | Table | recipe taxpasta/matrix.py |
required |
taxpasta_embedding |
derived | Table | recipe taxpasta/embedding.py |
required |
taxpasta_presence |
derived | Table | recipe taxpasta/presence.py |
required |
taxpasta_sample_summary |
derived | Table | recipe taxpasta/sample_summary.py |
required |
sylph_ani |
direct | Table | recipe sylph/ani.py |
optional |
sylph_profile |
direct | Table | recipe sylph/profile.py |
optional |
melon_ranks |
direct | Table | recipe melon/ranks.py |
optional |
nonpareil_summary |
derived | Table | recipe nonpareil/summary.py |
optional |
nonpareil_curves |
derived | Table | recipe nonpareil/curves.py |
optional |
multiqc_data |
direct |  MultiQC MultiQC |
file (?:.*/)?multiqc(?:/[^/]+)?/multiqc_data/multiqc.parquet$ |
required |
Cross-DC links
17 links — selecting a value in the source collection filters the target. The join column is shown after the source.
| Source · column | Target | Filters | |
|---|---|---|---|
samplesheet · sample |
→ | multiqc_data |
Filter MultiQC by samplesheet samples |
samplesheet · sample |
→ | taxpasta_profiles |
Filter the cross-profiler abundances by selected samples |
samplesheet · sample |
→ | taxpasta_sample_summary |
Filter the per-run statistics by selected samples |
samplesheet · sample |
→ | taxpasta_presence |
Filter the profiler-overlap matrix by selected samples |
samplesheet · sample |
→ | taxpasta_lineage |
Filter the widened lineages by selected samples |
samplesheet · sample |
→ | sylph_ani |
Filter the sylph containment table by selected samples |
samplesheet · sample |
→ | sylph_profile |
Filter the sylph clade composition by selected samples |
samplesheet · sample |
→ | nonpareil_summary |
Filter the Nonpareil per-library statistics by selected samples |
samplesheet · sample |
→ | nonpareil_curves |
Filter the Nonpareil coverage curves by selected samples |
taxpasta_profiles · database |
→ | database_sheet |
Narrow the database sheet to the databases in scope |
taxpasta_profiles · name |
→ | taxpasta_matrix |
Narrow the heatmap rows to the taxa in scope |
taxpasta_embedding · profiler_db |
→ | taxpasta_sample_summary |
Cross-select the ordination and the per-run statistics on the profiling run |
taxpasta_sample_summary · profiler_db |
→ | taxpasta_embedding |
Cross-select the per-run statistics and the ordination on the profiling run |
samplesheet · sample |
→ | taxpasta_embedding |
Filter the ordination by selected samples |
taxpasta_profiles · profiler |
→ | taxpasta_lineage |
Narrow the lineage rings to the classifiers in scope |
taxpasta_profiles · database |
→ | taxpasta_lineage |
Narrow the lineage rings to the databases in scope |
taxpasta_embedding · profiler_db |
→ | taxpasta_lineage |
Narrow the taxonomic flow to the profiling runs picked in the ordination |
Recipes
Each recipe reshapes raw pipeline output into a tidy table. The name links to its source; Output lists the validated OUTPUT_SCHEMA columns.
| Recipe | Transforms | Output |
|---|---|---|
melon/ranks.py |
Melon genome-copy estimates, one row per full seven-rank lineage. | superkingdom, phylum, class, order, family, genus, species, copy_number, abundance, identity_mean, lineages |
nf-core/taxprofiler/taxon_names.py |
taxonomy_id -> (name, rank) harvested from the profilers' own report files. | taxonomy_id, name, rank |
nonpareil/curves.py |
Nonpareil redundancy summaries -> the coverage curve each of them stands for. | sample, library, platform, sequencing_effort, coverage, observed_effort, projected_effort, diversity |
nonpareil/summary.py |
Nonpareil's per-library fit, tidied into one row per sequencing library. | sample, library, platform, kappa, coverage, observed_effort, model_fit, projected_effort, diversity, effort_multiple |
sylph/ani.py |
sylph per-genome containment: ANI against abundance and coverage. | sample, genome, contig_name, taxonomic_abundance, abundance_frac, sequence_abundance, adjusted_ani, naive_ani, eff_cov, median_cov, containment_frac, kmers_reassigned |
sylph/profile.py |
sylph-tax merged profile -> long sample x rank x taxon composition. | sample_id, clade_name, taxon, rank, abundance |
taxpasta/embedding.py |
Bray-Curtis PCoA over every profiling run in the taxpasta collection. | sample_id, dim_1, dim_2, sample, profiler, database, profiler_db, platform |
taxpasta/lineage.py |
taxpasta profiles widened into one column per NCBI rank, for sunburst and sankey. | profiler, database, profiler_db, sample, platform, taxonomy_id, name, rank, root, superkingdom, phylum, class, order, family, genus, species, count, rel_abundance |
taxpasta/matrix.py |
Taxon x (sample, profiler) relative-abundance matrix for the clustered heatmap. | taxon, rank |
taxpasta/presence.py |
Which profilers detected which taxon, as an UpSet membership matrix. | sample, taxonomy_id, taxon, rank, n_profilers |
taxpasta/profiles.py |
taxpasta standardised profiles -> one long cross-profiler abundance table. | profiler, database, profiler_db, sample, platform, taxonomy_id, name, rank, count, rel_abundance |
taxpasta/sample_summary.py |
One row per profiling run: how much each profiler found, and how evenly. | sample, profiler, database, profiler_db, platform, taxa_observed, assigned_count, top_taxon, top_taxon_fraction, shannon, evenness |
Dashboard tabs
One dashboard: the Overview, then six child tabs in three groups, read as a funnel from the reads to the taxa the classifiers agree on. Each tab below carries the same icon and colour the dashboard gives it, so the page and the app read alike.
| Group | Tabs |
|---|---|
| Data & QC | MultiQC, Sequencing depth |
| Communities | Profiles, Diversity |
| Classifiers | Concordance, Confidence |
A profiling run is a sample, a classifier and a database, so most tiles show one value per run, and the classifier and the sequencing platform take the place of a design column. Each child tab opens with a short intro and a strip of four cards, then at most three open sections; tables and details follow, collapsed. The persistent Sample filters (platform, sample, sequencing run) sit in the left panel and narrow every tab. The Sample sheet and Database sheet sections are pinned, collapsed, to the bottom of every child tab.
Many classifiers, one community, from reads to the taxa they agree on.
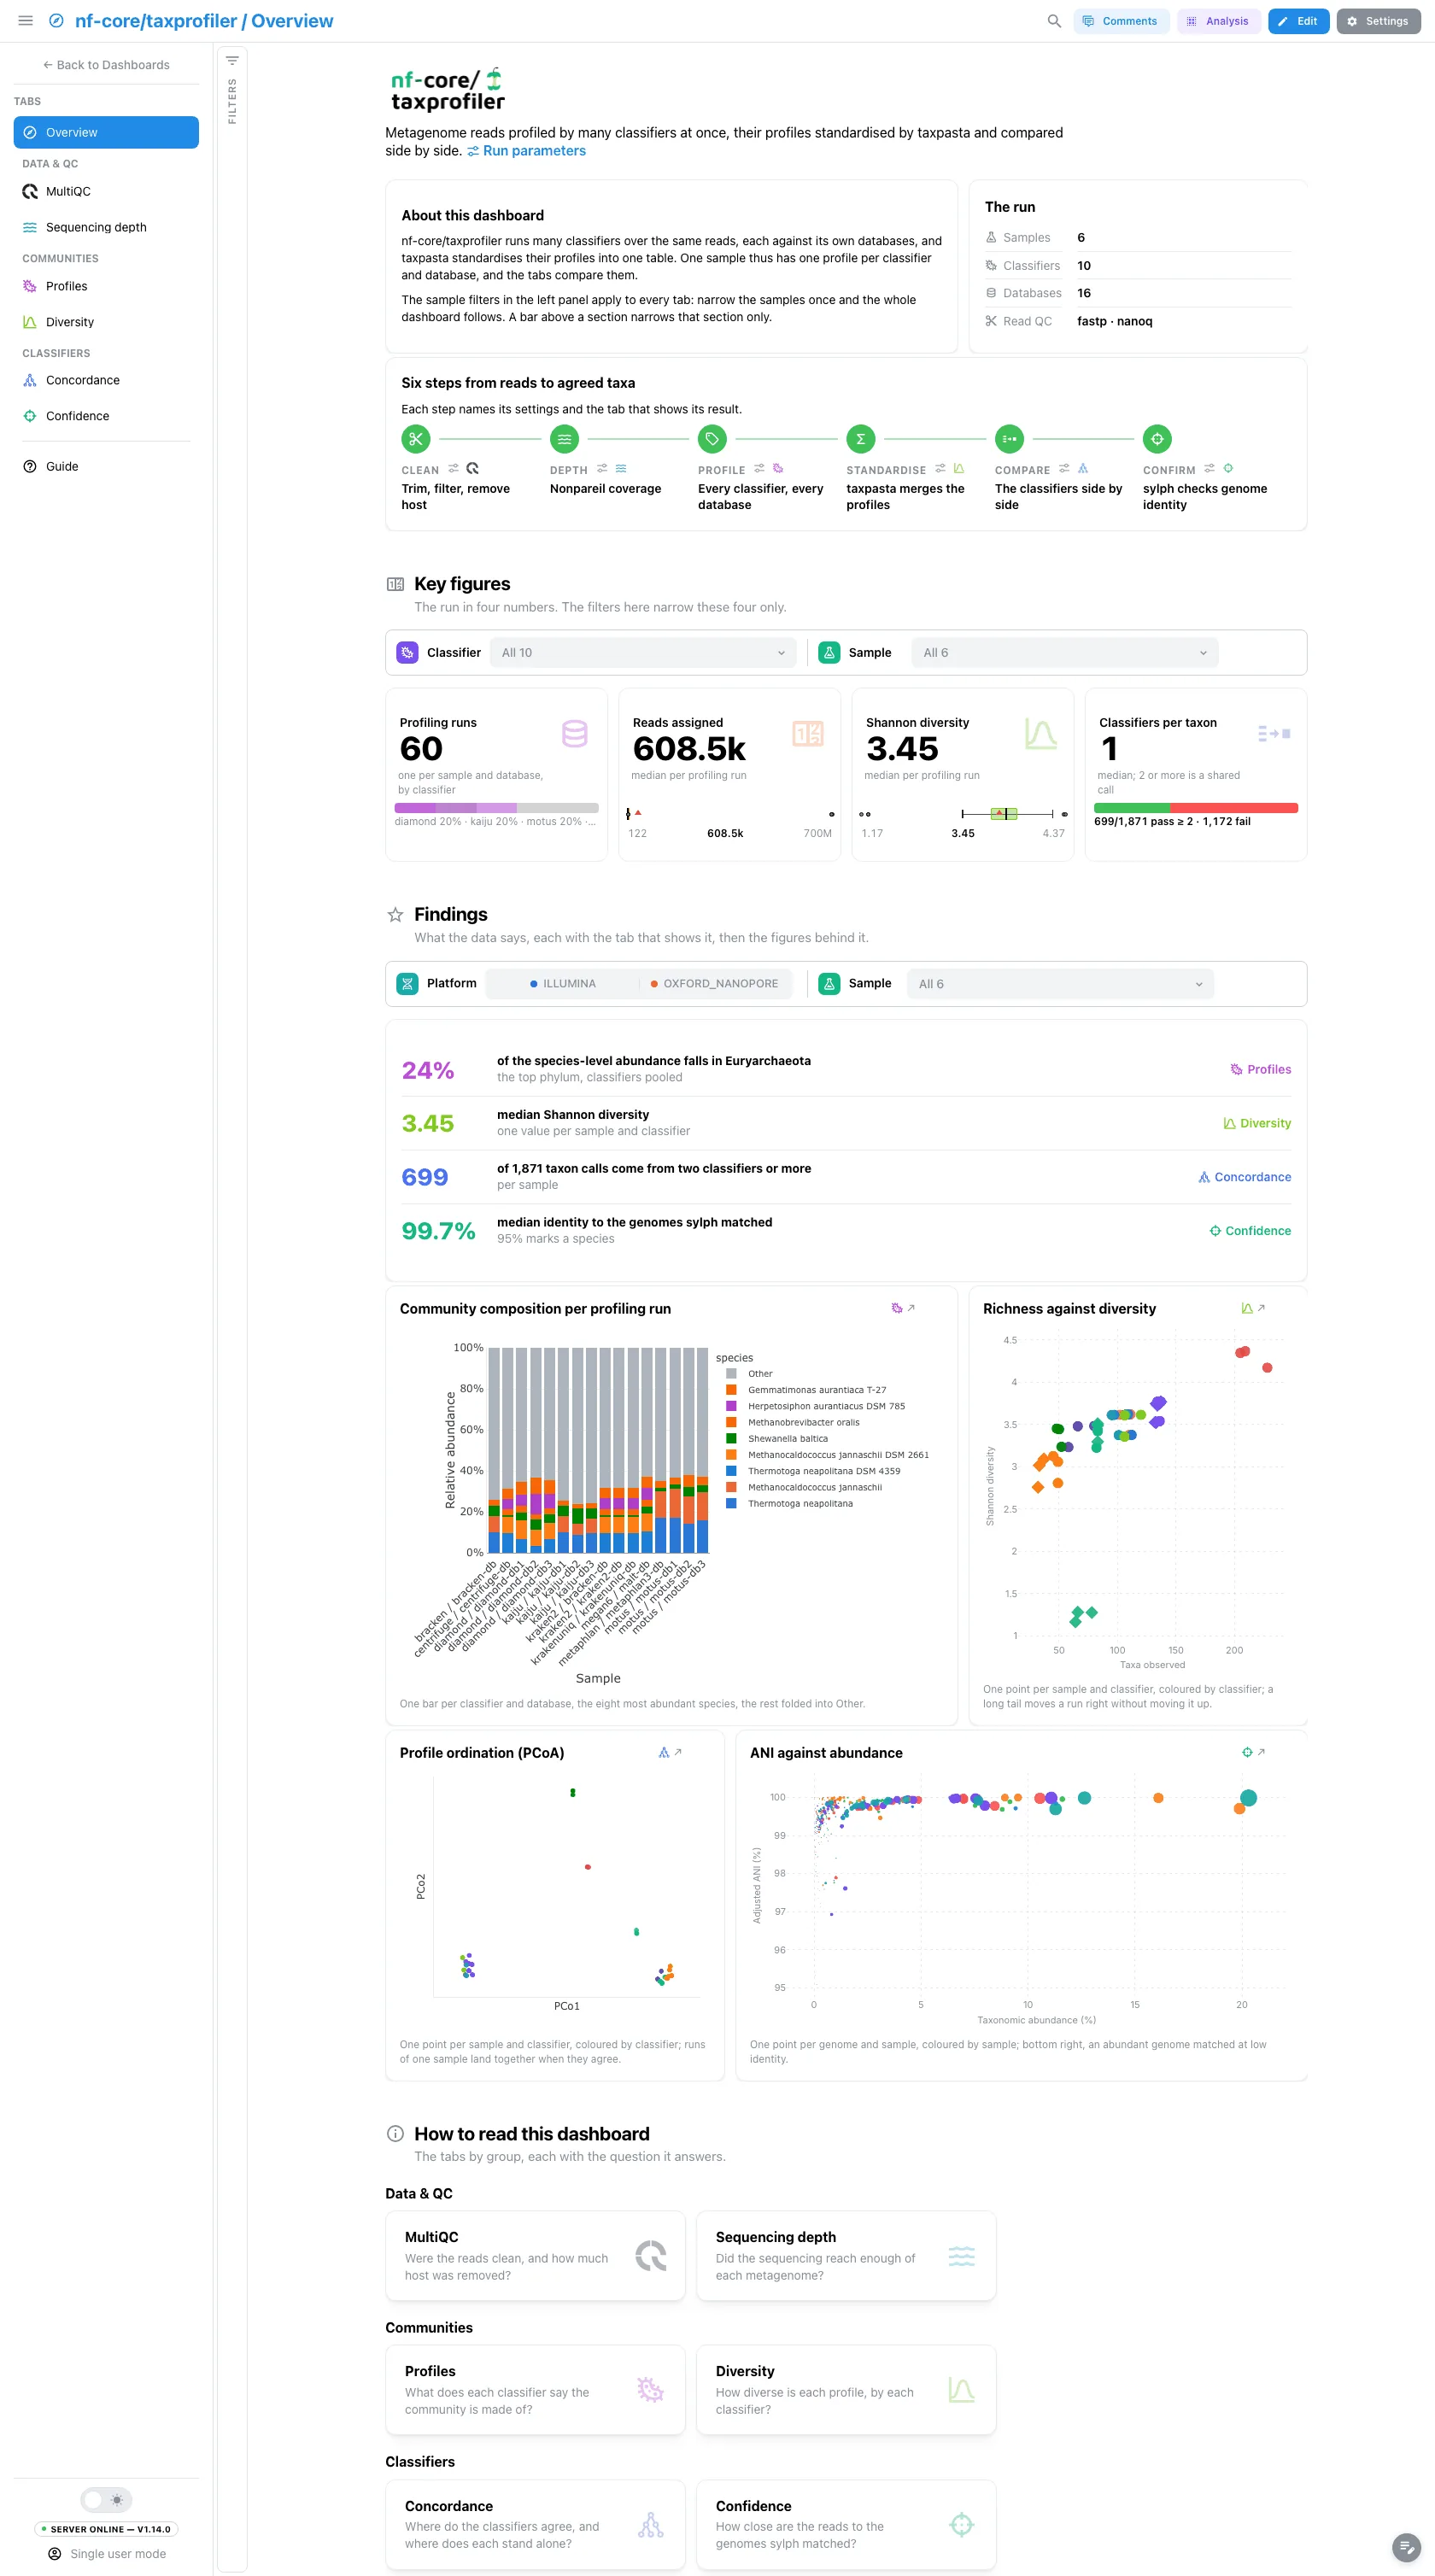
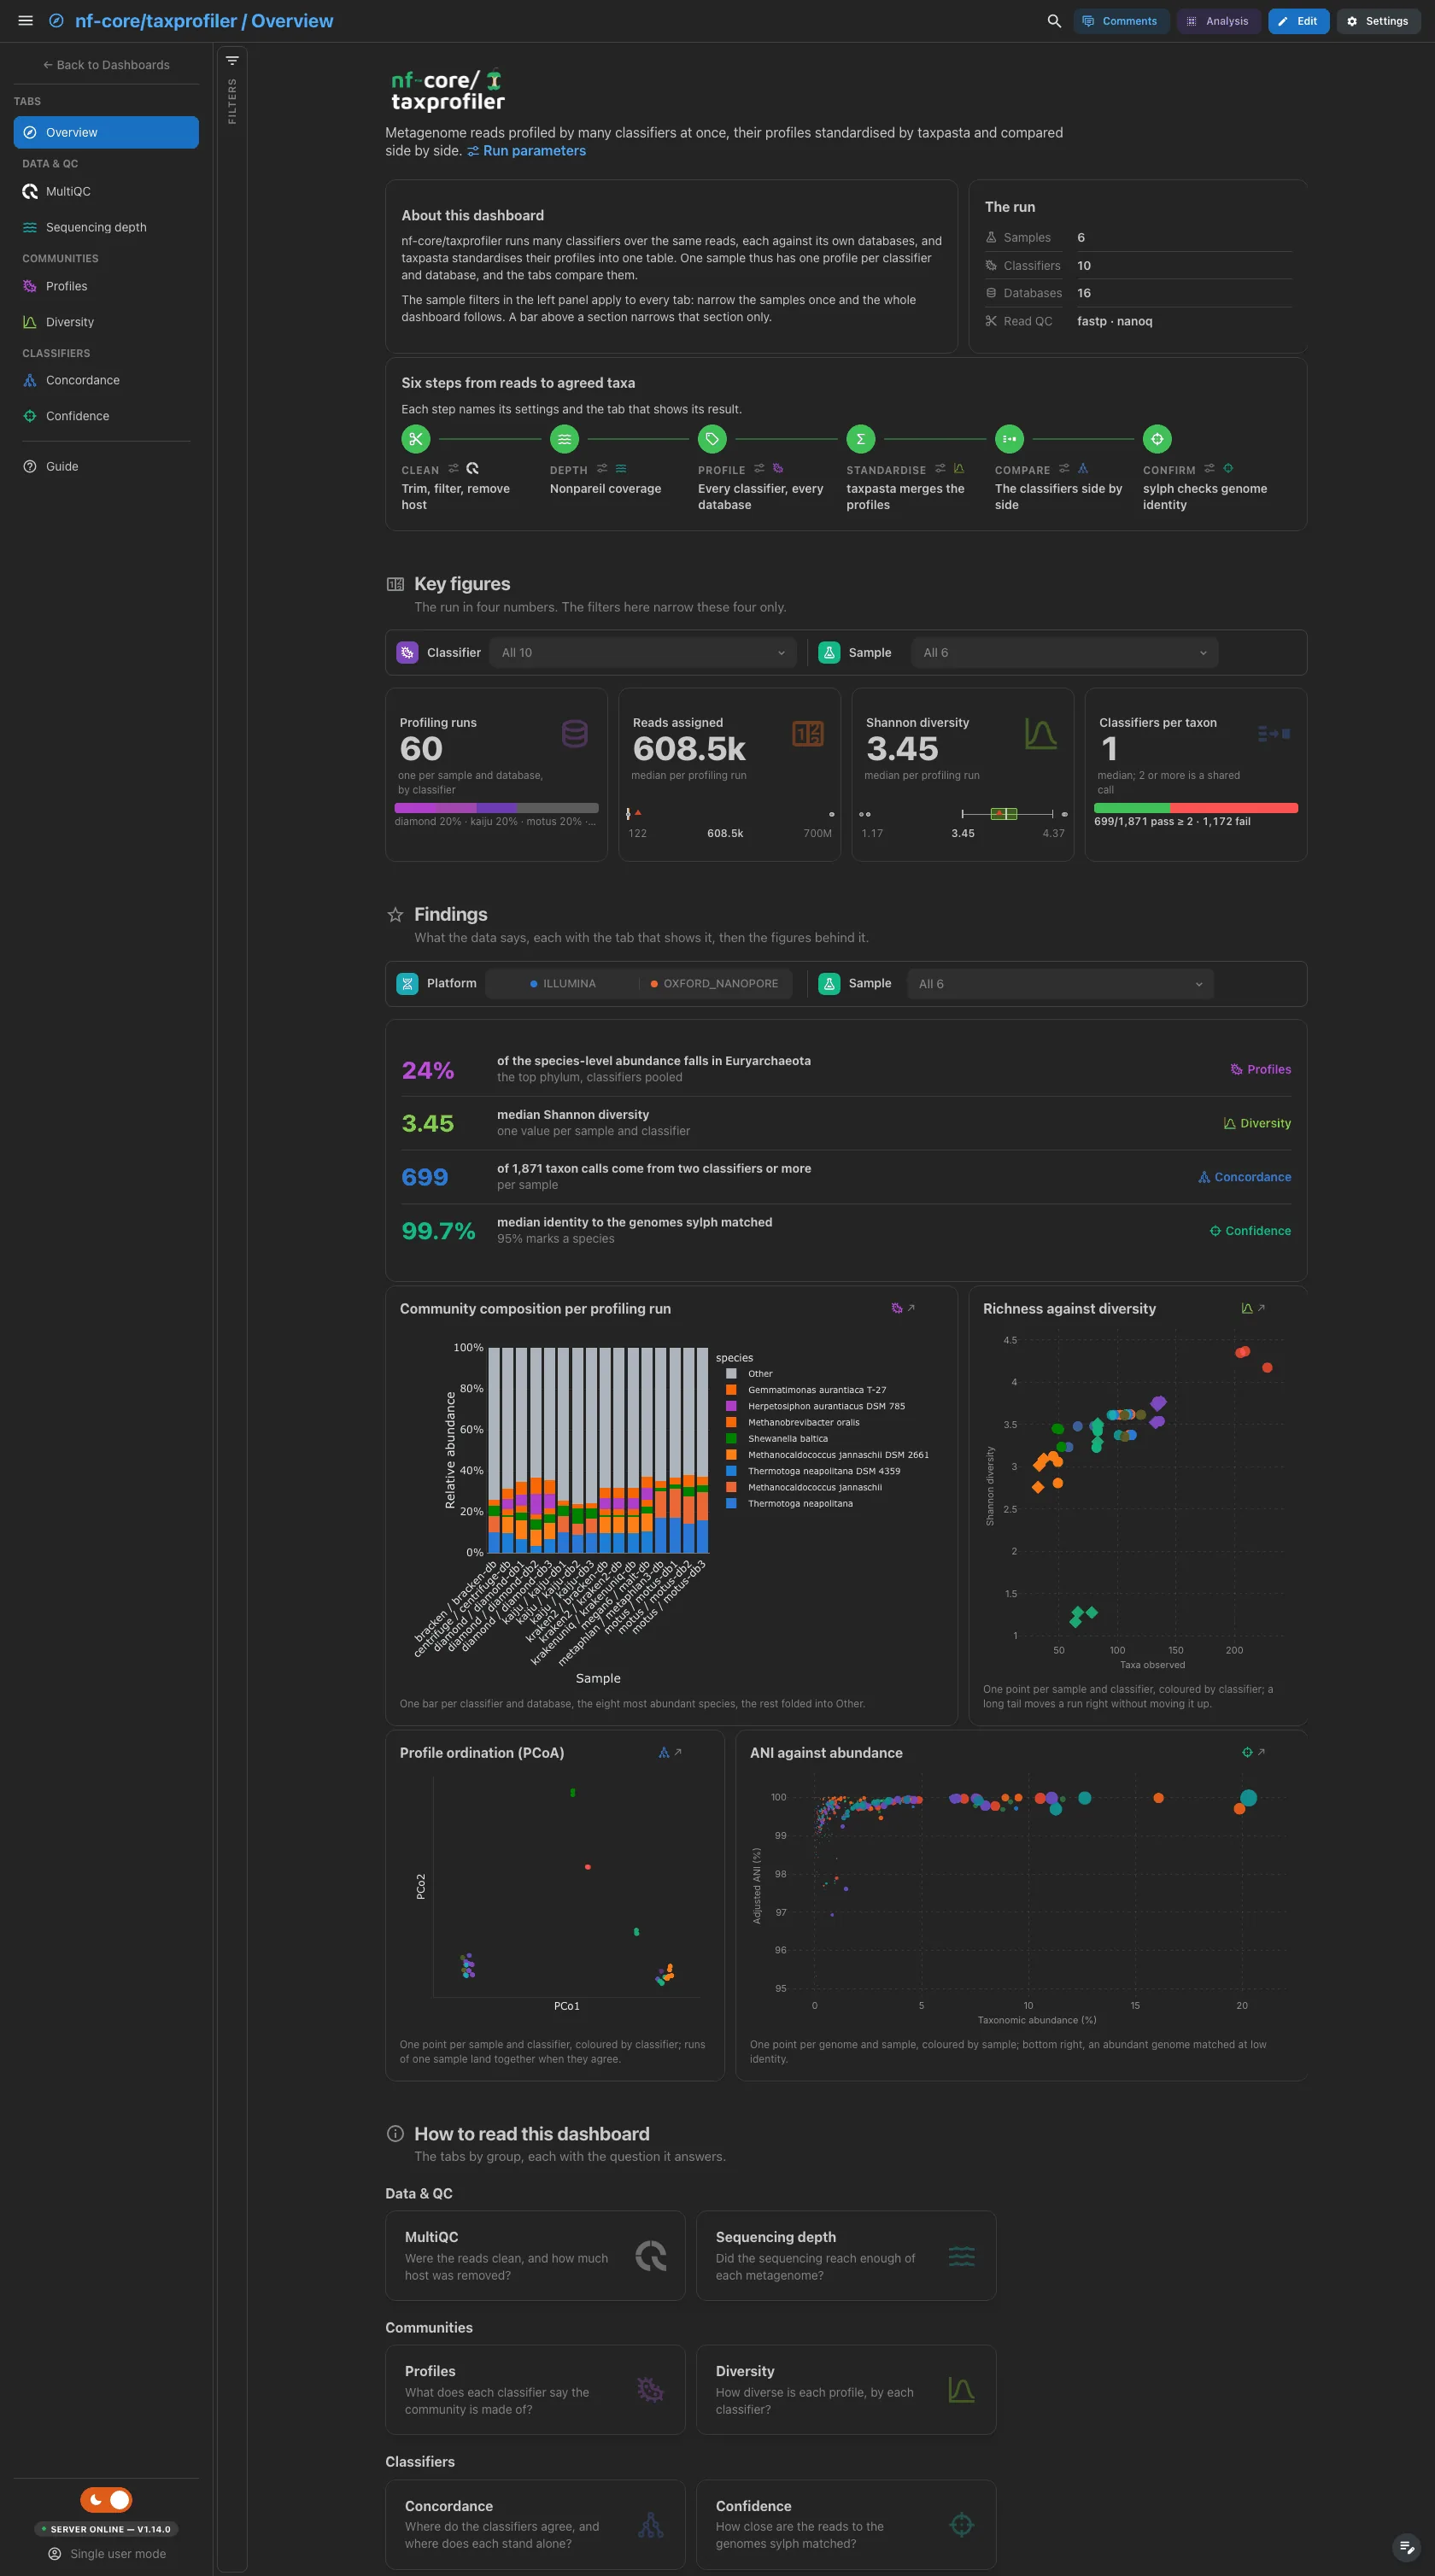
A short hero links the run parameters. About this dashboard says how to move through the tabs, The run lists the samples, classifiers, databases and read QC tools, and Pipeline walks the six steps from cleaning the reads to confirming the calls, each linked to its parameters and its tab. The key figures read the taxpasta collections every run writes, so no classifier subset leaves a gap.
Filters and components
Filters · the left panel starts collapsed. Key figures has its own filter bar (the classifier and the sample), and so does Findings (the platform and the sample): each narrows its own section only.
| Section | What it holds |
|---|---|
| Top | Hero, About this dashboard, The run, Pipeline |
| Key figures | 4 headline cards: profiling runs, reads assigned, Shannon diversity, classifiers per taxon |
| Findings | Live result rows, then 4 figures: the composition per profiling run, richness against diversity, the PCoA of the profiles and sylph identity against abundance |
| How to read this dashboard | The tabs by group, each with its question |
Data & QC · Were the reads clean, and how much host was removed?
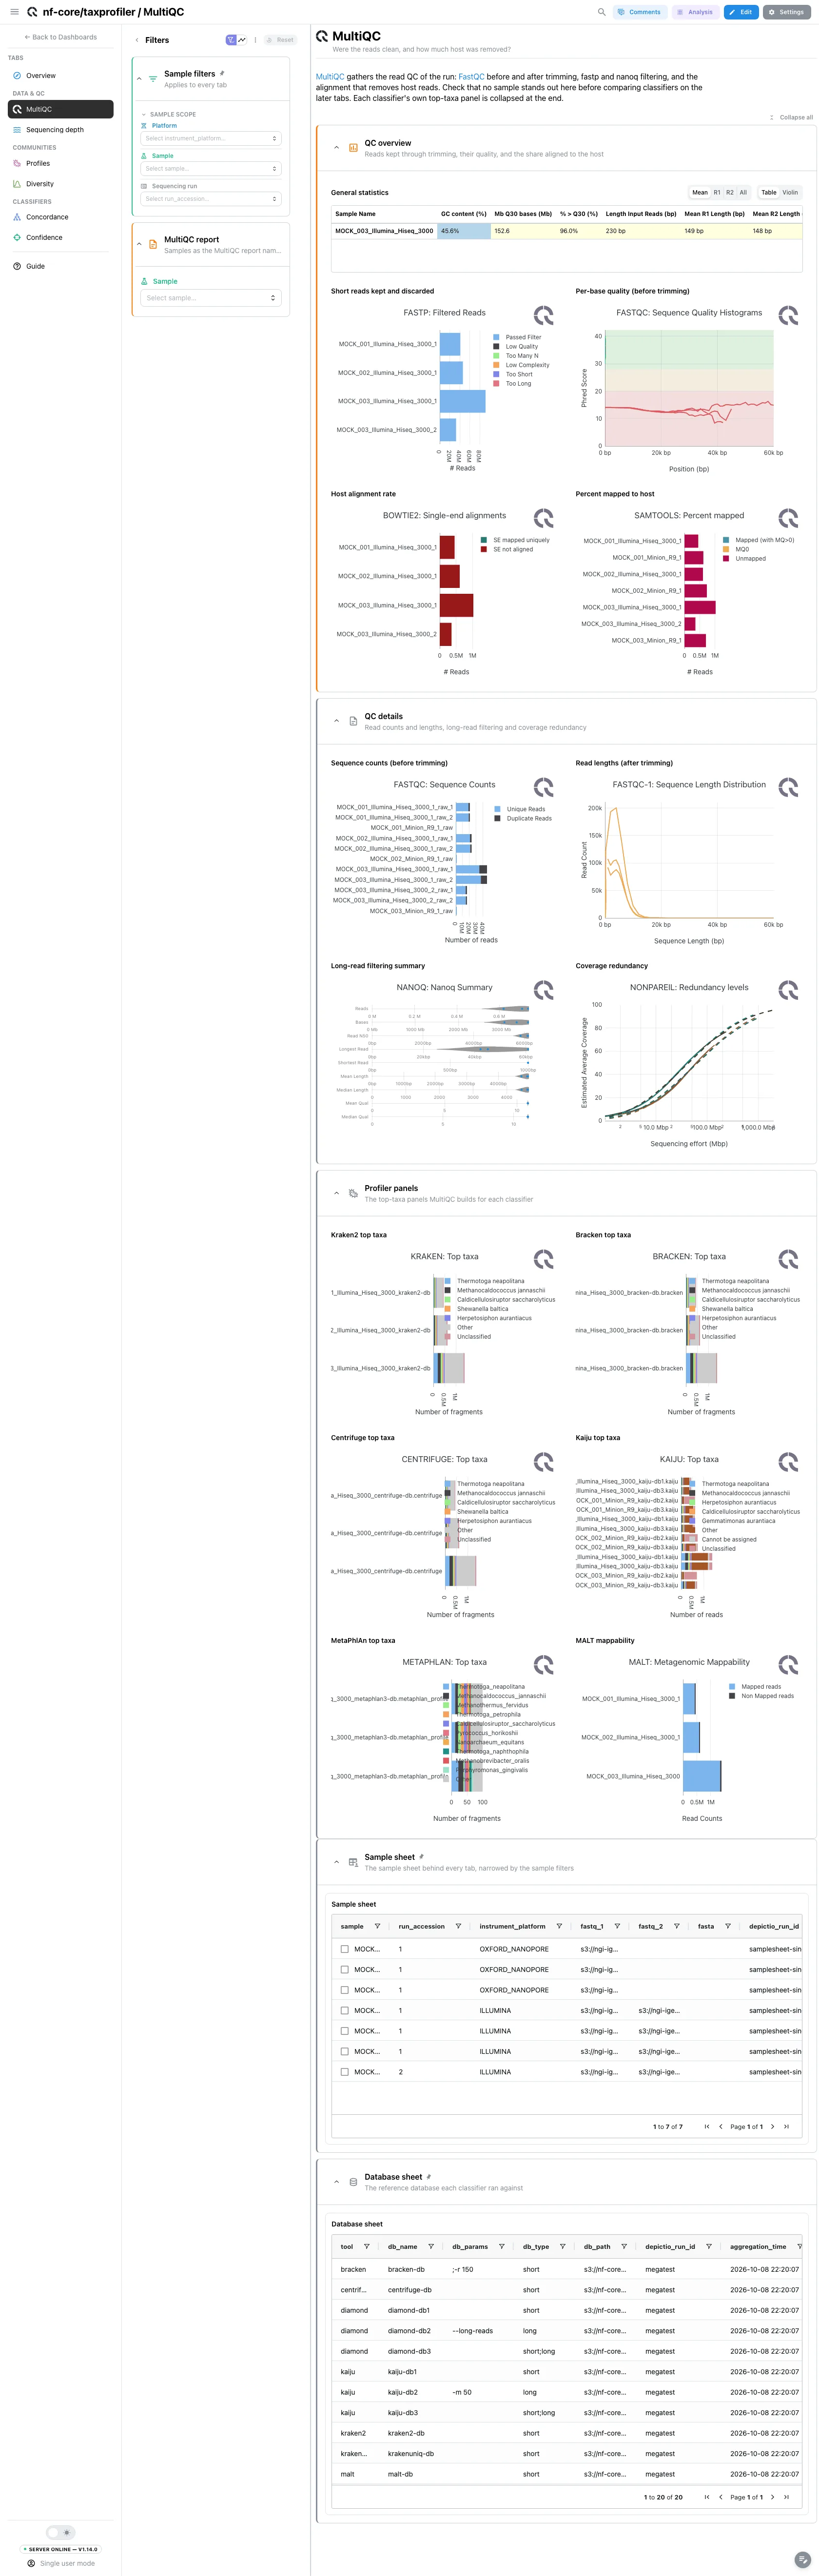
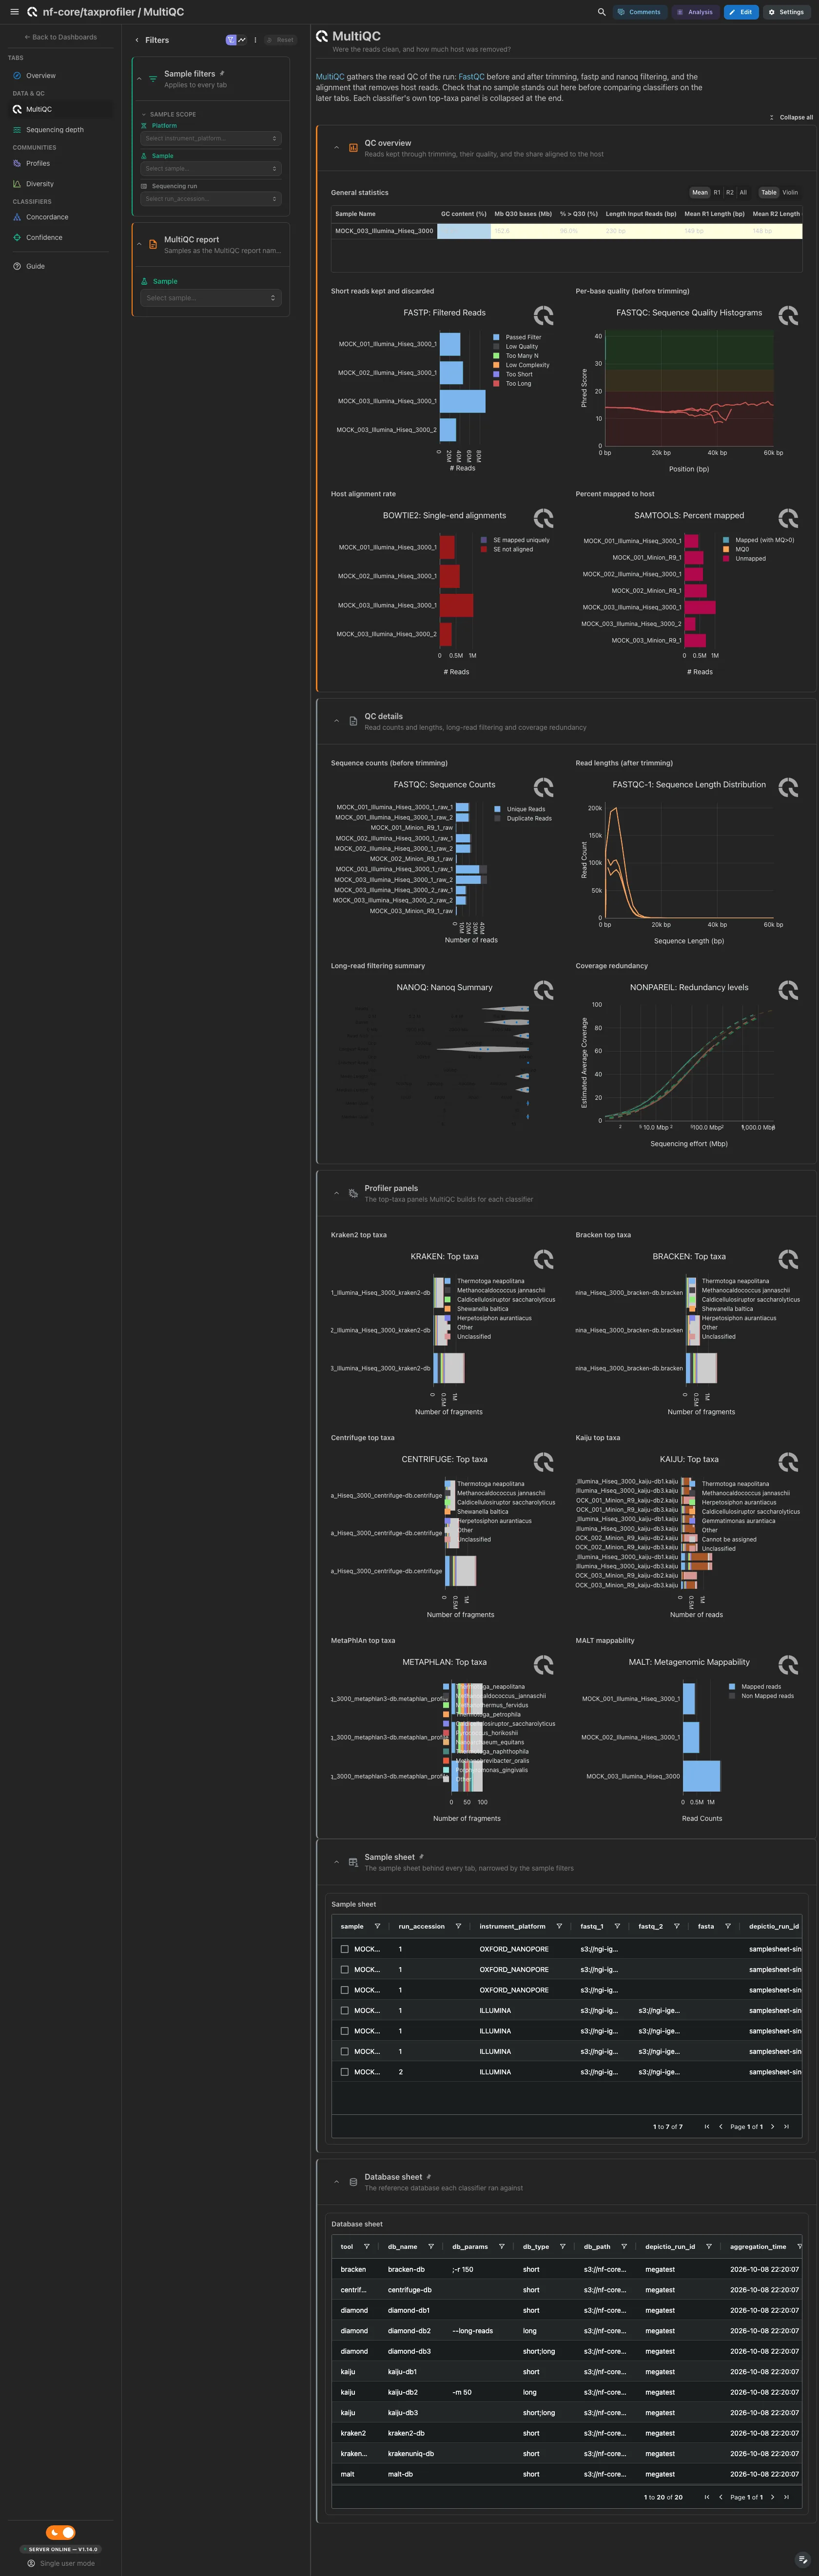
MultiQC panels only: general statistics, fastp filtered reads, FastQC quality
before trimming, then the host alignment and the share mapped to the host. The
read counts and lengths, nanoq's long-read summary and Nonpareil's redundancy
are collapsed, and so is each classifier's own top-taxa panel. MultiQC has no
Bracken or Centrifuge module, so nf-core/taxprofiler runs the kraken module
three times behind path_filters.
Filters and components
Filters · Sample, read from the MultiQC report.
| Section | What it holds |
|---|---|
| QC overview | 5 MultiQC panels |
| QC details (collapsed) | 4 MultiQC panels |
| Profiler panels (collapsed) | 6 MultiQC panels |
Data & QC · Did the sequencing reach enough of each metagenome?
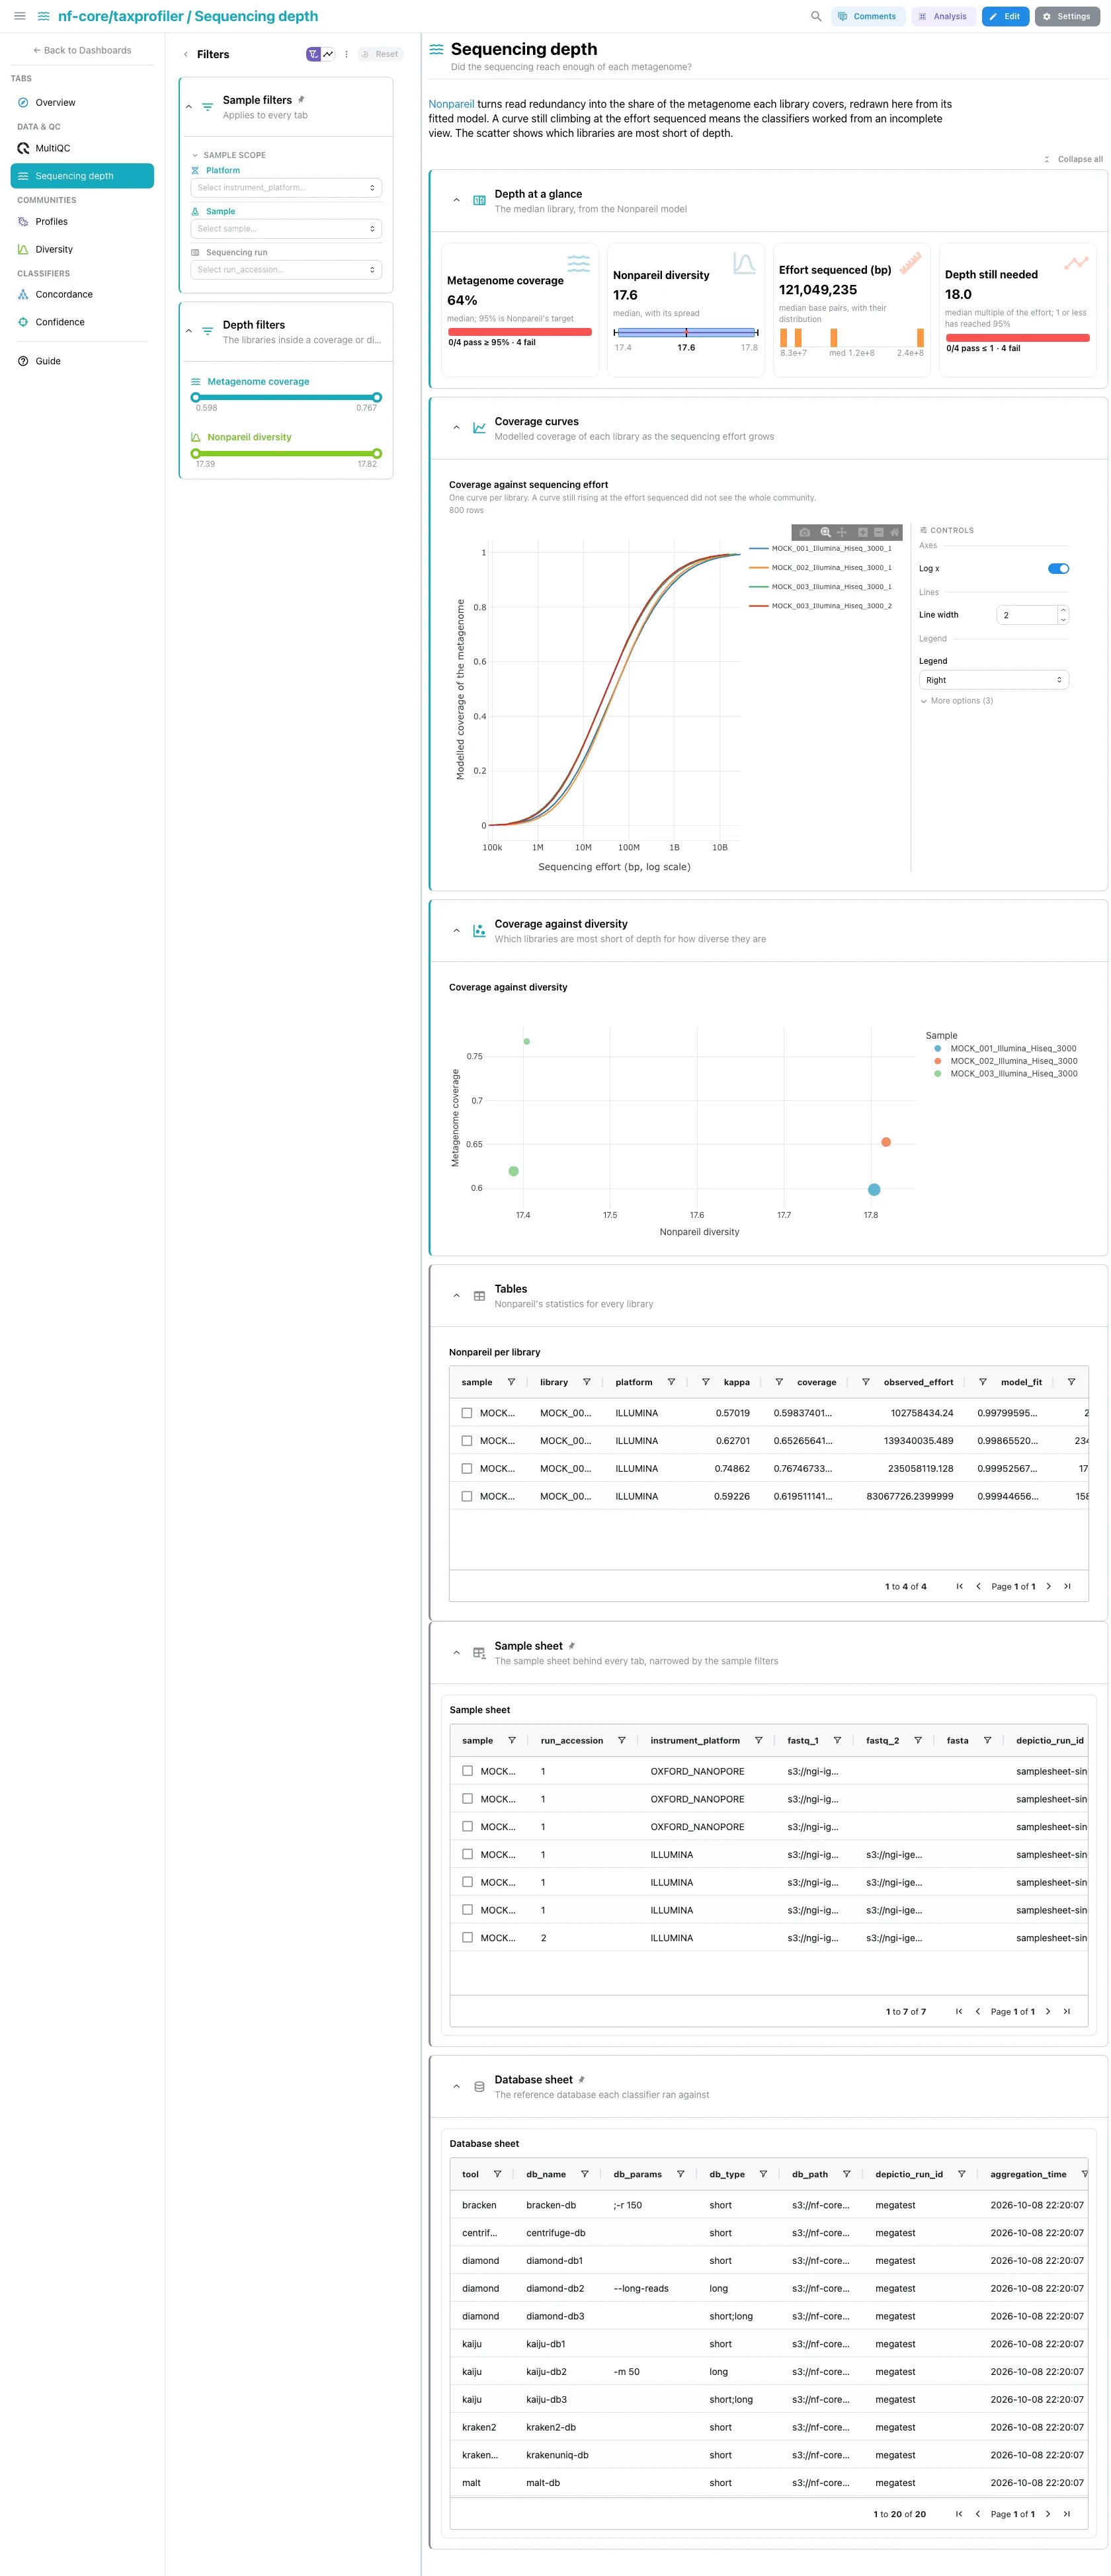
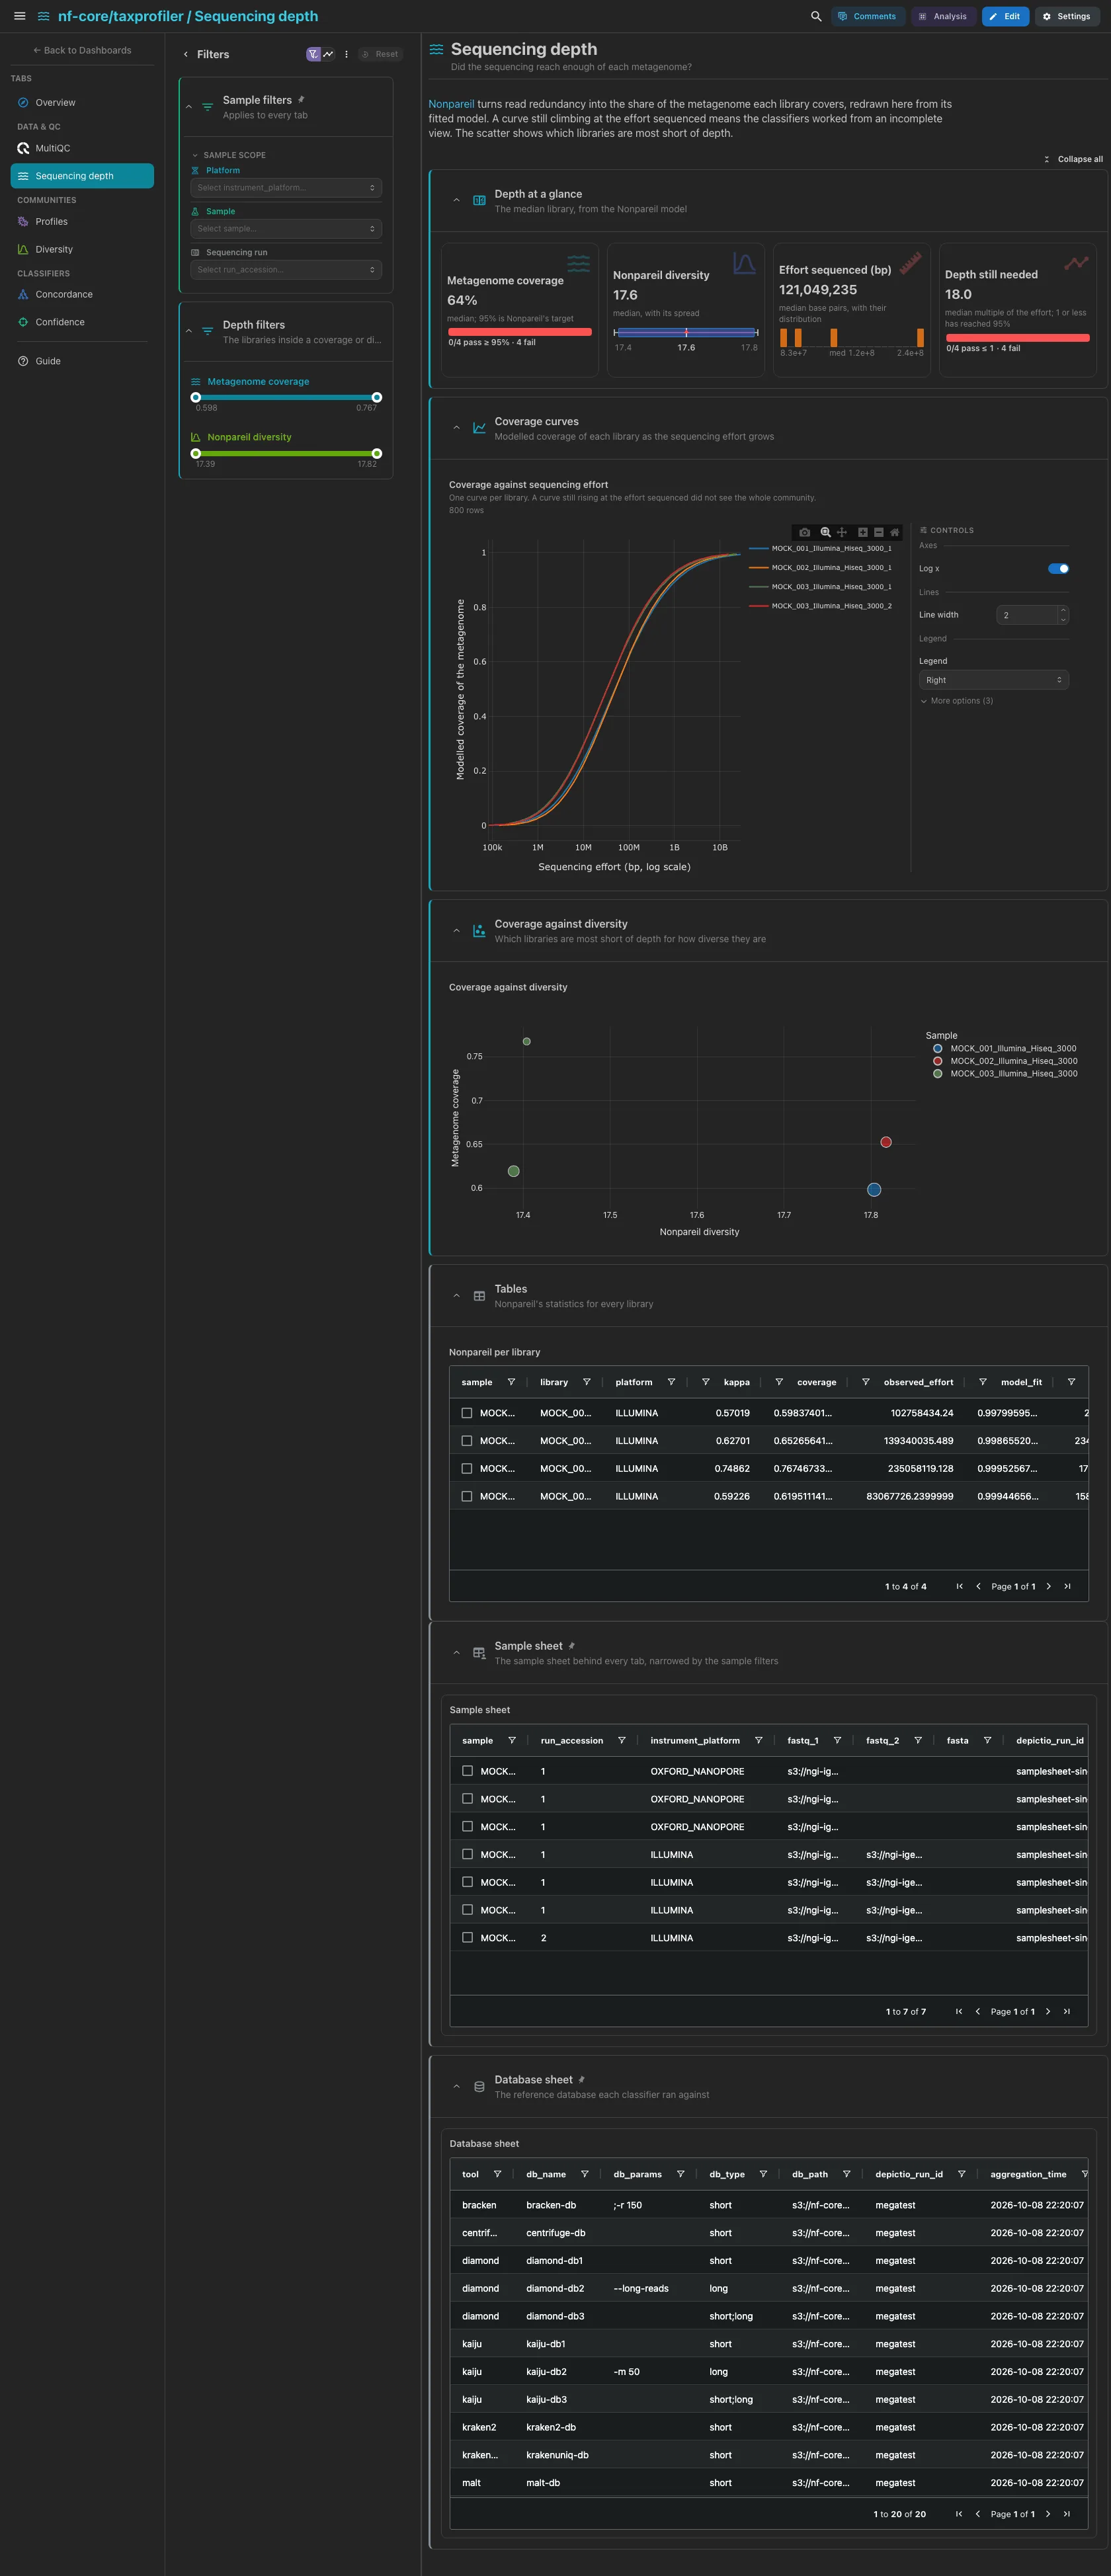
Nonpareil turns read redundancy into the share of the metagenome each library covers. The cards give the median coverage against Nonpareil's 0.95 target, the diversity, the effort sequenced and how much deeper the median library would have to go. Then the coverage curve of each library, rebuilt from the fitted model, and coverage against diversity. Nonpareil runs on the short reads only.
Filters and components
Filters · Metagenome coverage and Nonpareil diversity ranges on
nonpareil_summary, plus the sample filters.
| Section | What it holds |
|---|---|
| Depth at a glance | 4 cards |
| Coverage curves | 1 advanced visualization |
| Coverage against diversity | Coverage against diversity |
| Tables (collapsed) | Nonpareil per library |
The Sequencing depth tab needs nonpareil
The two nonpareil collections are optional and only written by a
short-read run with --perform_shortread_redundancyestimation. Without
them the Sequencing depth tab is dropped.
Communities · What does each classifier say the community is made of?
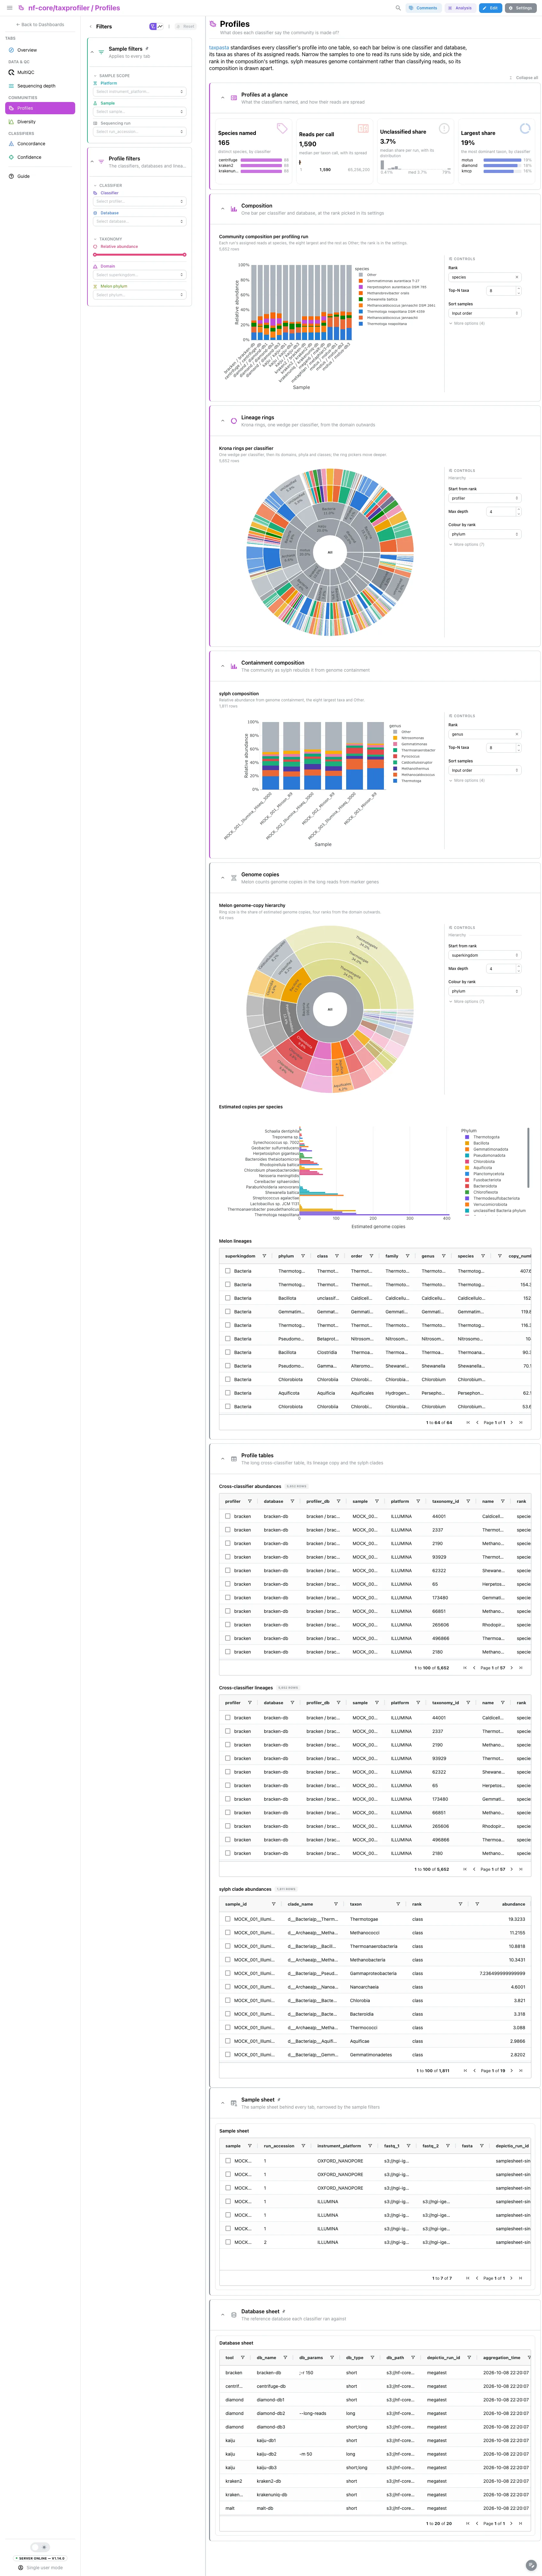
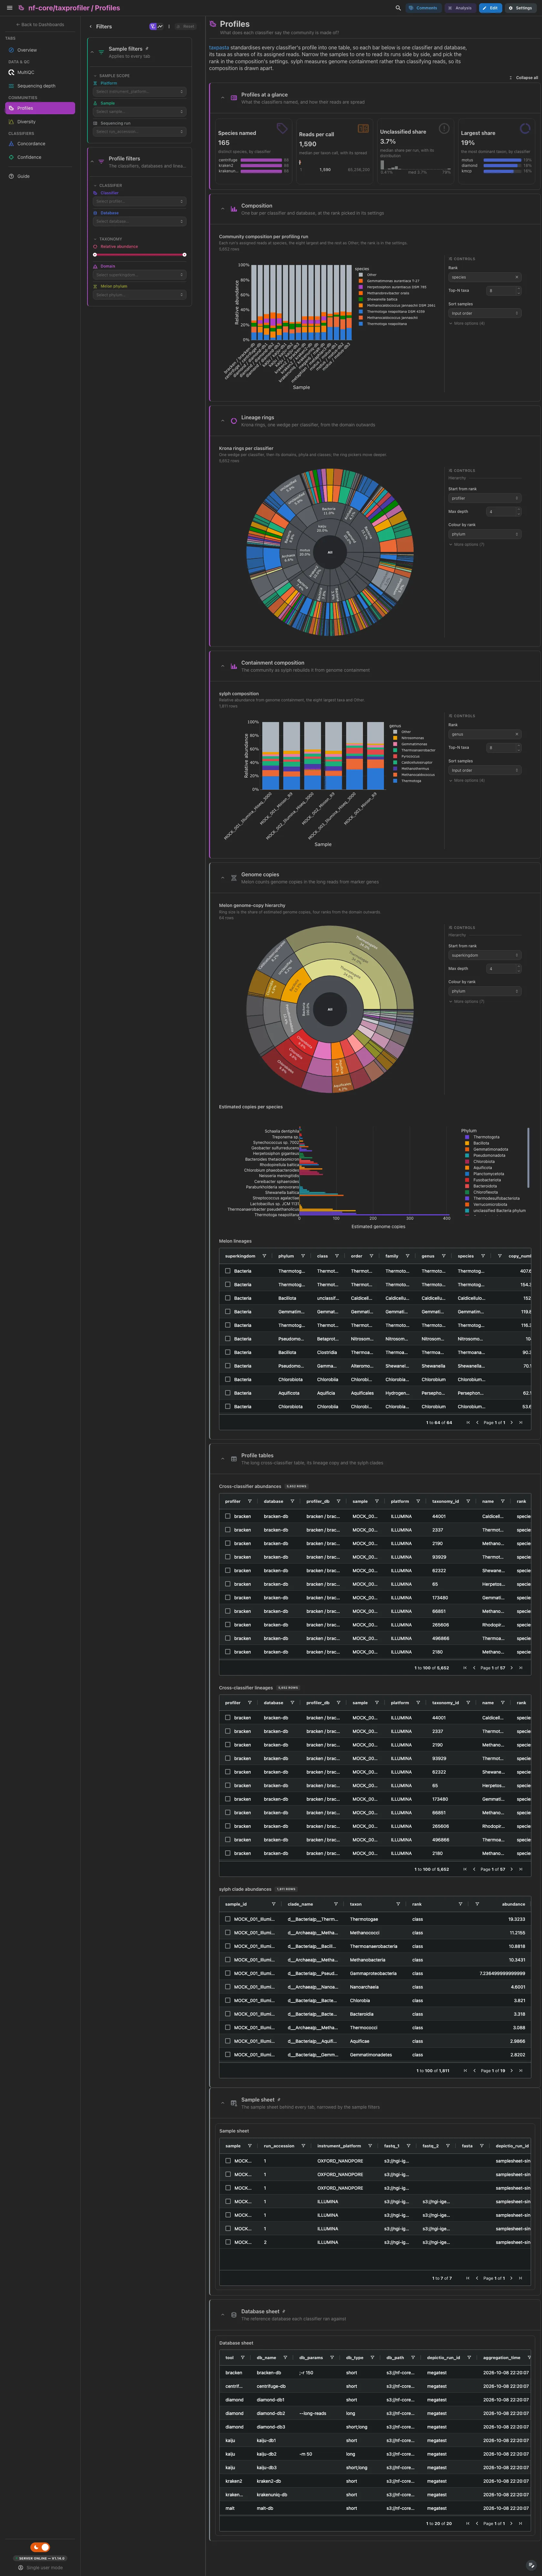
taxpasta standardises every classifier's profile into one table. The composition draws one bar per profiling run, so a bar never mixes two naming vocabularies: species by default, the eight largest taxa and Other, the rank in the tile's settings. Then the Krona rings, one wedge per classifier, and the community as sylph rebuilds it from genome containment. melon's genome copies, pooled over the long-read samples, and the profile tables are collapsed.
Filters and components
Filters · Classifier, Database and a relative-abundance range on
taxpasta_profiles, Domain on taxpasta_lineage, and Melon phylum,
the only filter that reaches melon's pooled table.
| Section | What it holds |
|---|---|
| Profiles at a glance | 4 cards |
| Composition | 1 advanced visualization |
| Lineage rings | 1 advanced visualization |
| Containment composition | 1 advanced visualization |
| Genome copies (collapsed) | 1 advanced visualization, Estimated copies per species, Melon lineages |
| Profile tables (collapsed) | Cross-classifier abundances, Cross-classifier lineages, sylph clade abundances |
Communities · How diverse is each profile, by each classifier?
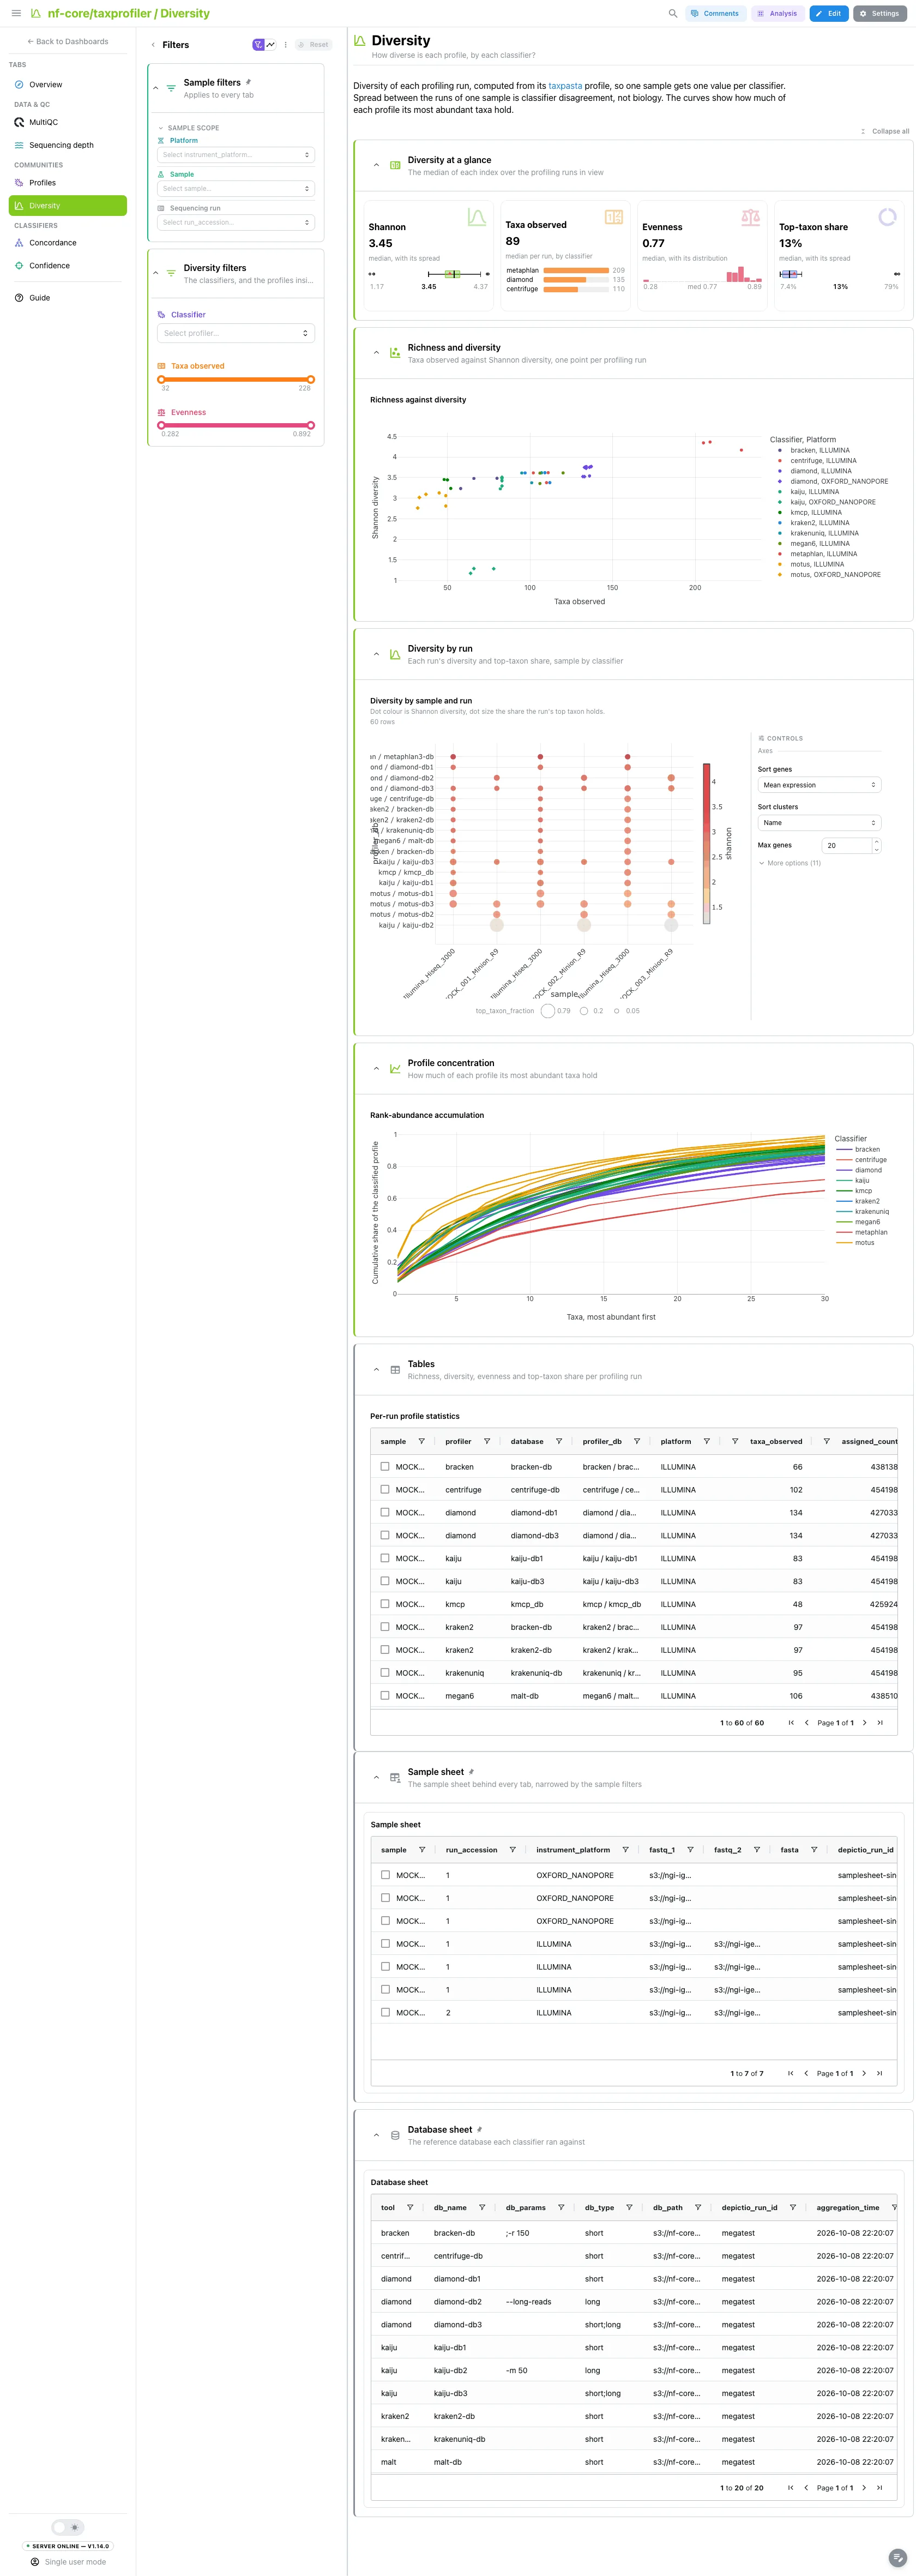
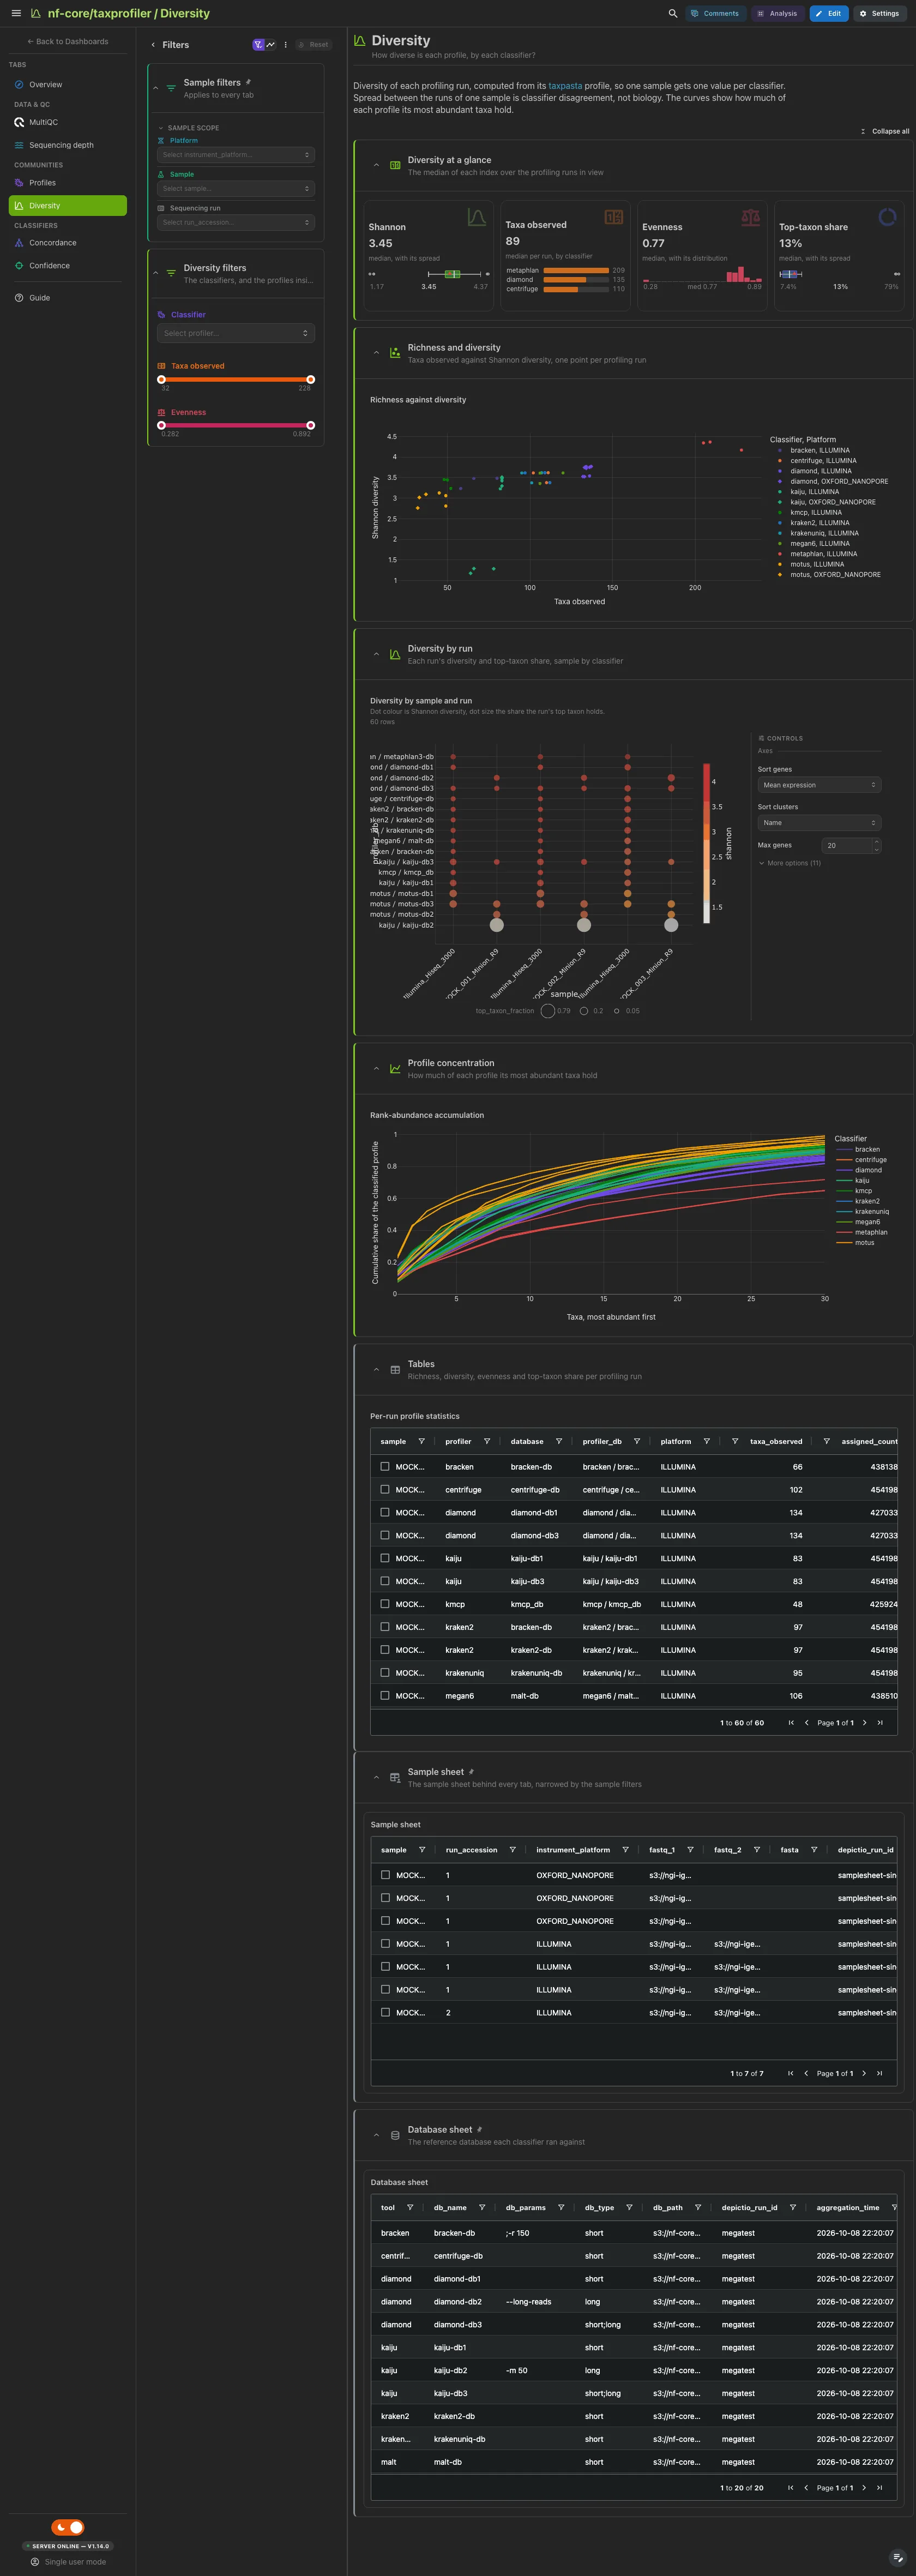
Diversity is computed per profiling run, so one sample has one value per classifier, and the spread between them is classifier disagreement. Richness against Shannon diversity comes first, then each run's diversity and top-taxon share, and the rank-abundance accumulation: a curve that reaches one after a handful of taxa is a profile carried by a few organisms.
Filters and components
Filters · Classifier, plus Taxa observed and Evenness ranges, on
taxpasta_sample_summary.
| Section | What it holds |
|---|---|
| Diversity at a glance | 4 cards |
| Richness and diversity | Richness against diversity |
| Diversity by run | 1 advanced visualization |
| Profile concentration | Rank-abundance accumulation |
| Tables (collapsed) | Per-run profile statistics |
Classifiers · Where do the classifiers agree, and where does each stand alone?
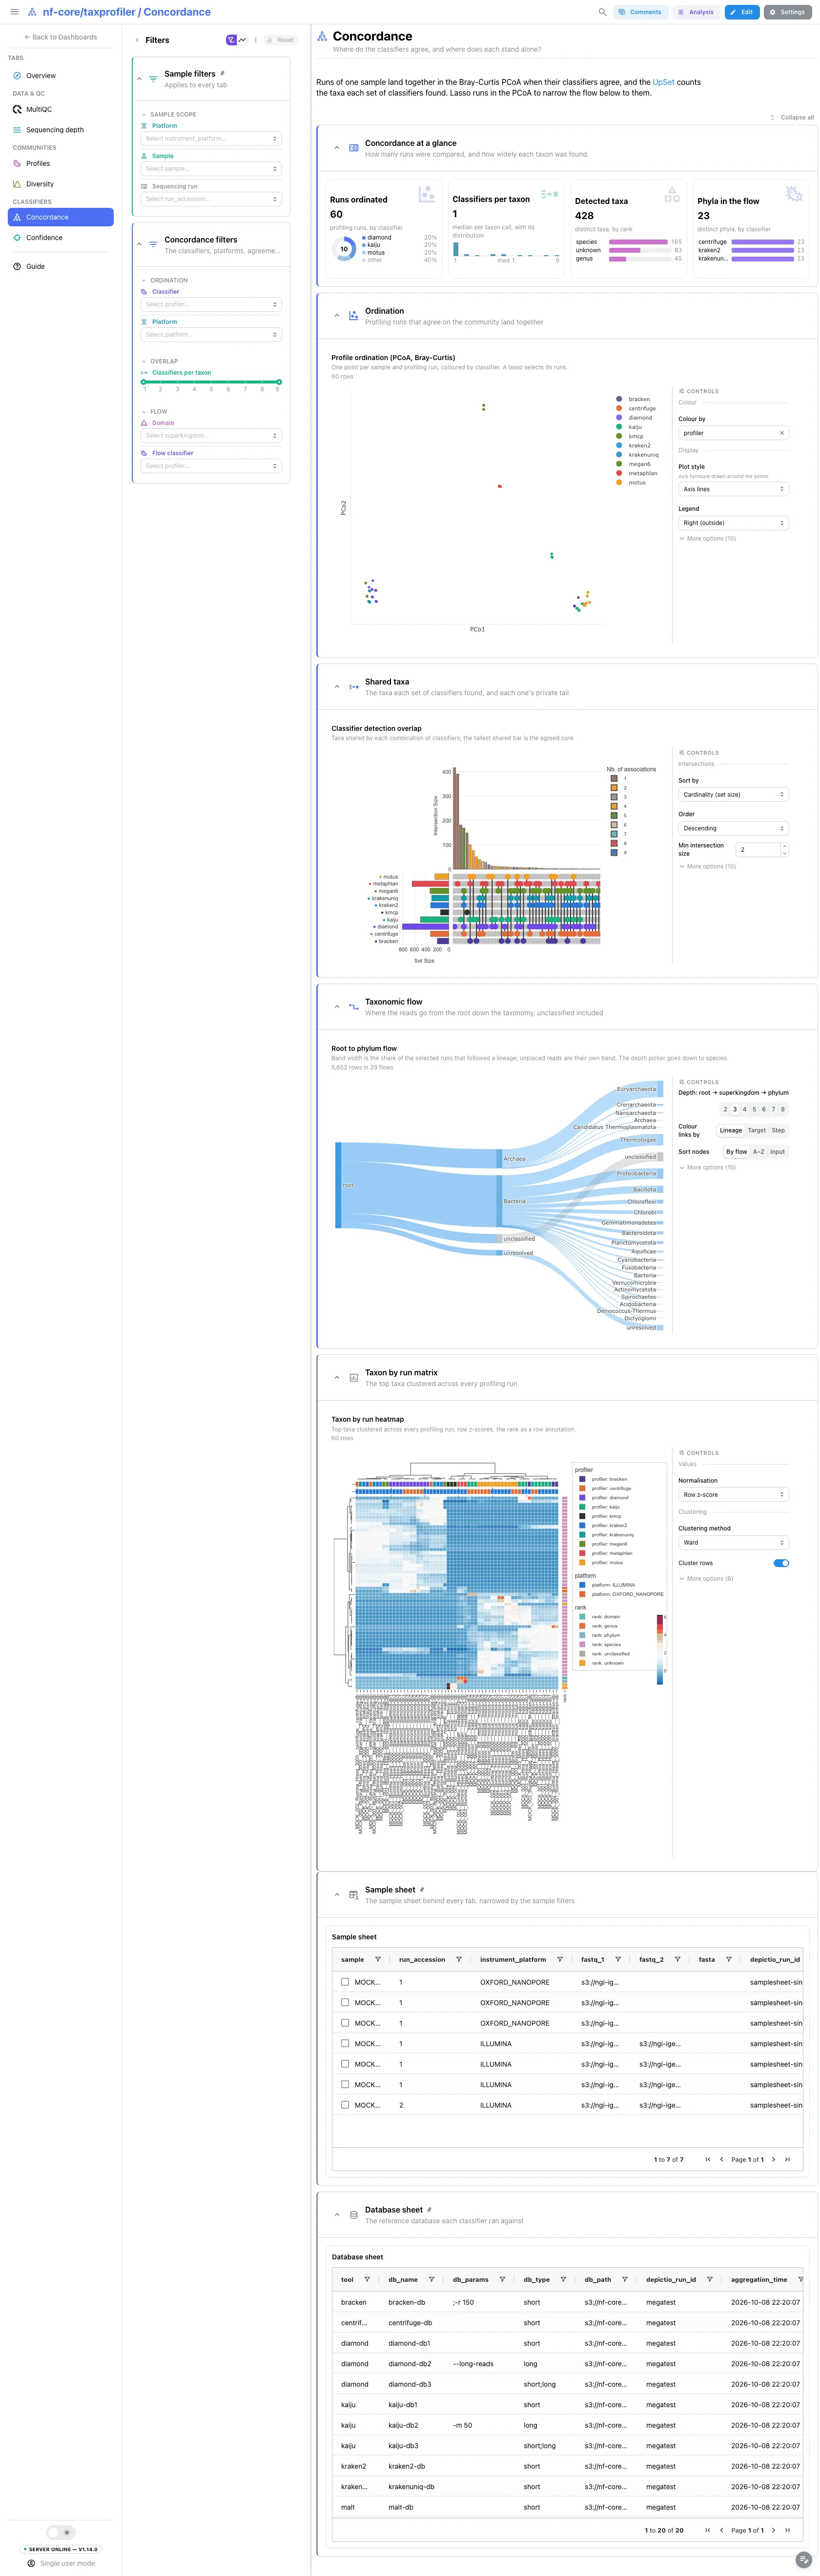
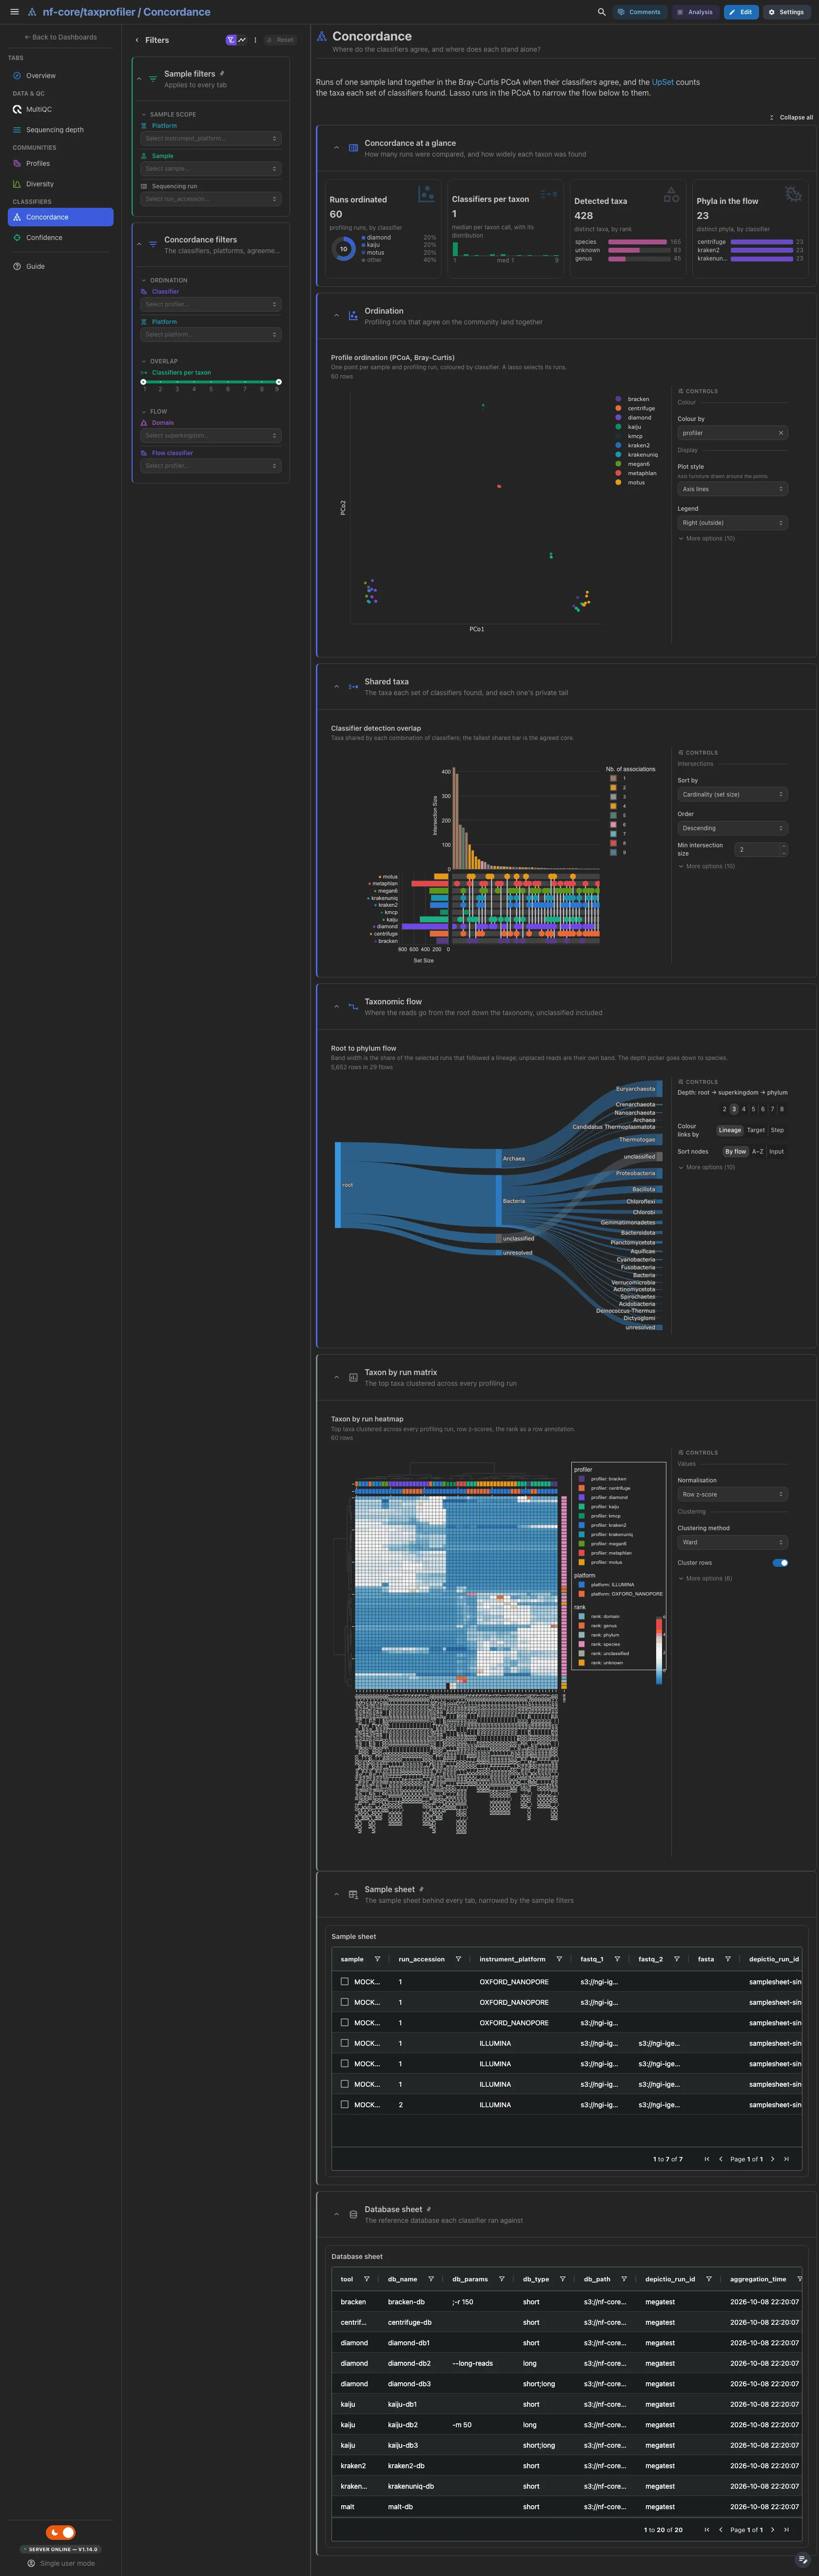
The Bray-Curtis PCoA puts one point per profiling run, so runs of one sample land together when their classifiers agree; a lasso narrows the flow below to the runs it picks. The UpSet counts the taxa each set of classifiers found, and the taxonomic flow follows the reads from the root down to the phylum, unclassified reads included. The taxon by run heatmap is collapsed.
Filters and components
Filters · Classifier and Platform on taxpasta_embedding, a
Classifiers per taxon range on taxpasta_presence, and Domain and
Flow classifier on taxpasta_lineage.
| Section | What it holds |
|---|---|
| Concordance at a glance | 4 cards |
| Ordination | 1 advanced visualization |
| Shared taxa | 1 advanced visualization |
| Taxonomic flow | 1 advanced visualization |
| Taxon by run matrix (collapsed) | 1 advanced visualization |
Classifiers · How close are the reads to the genomes sylph matched?
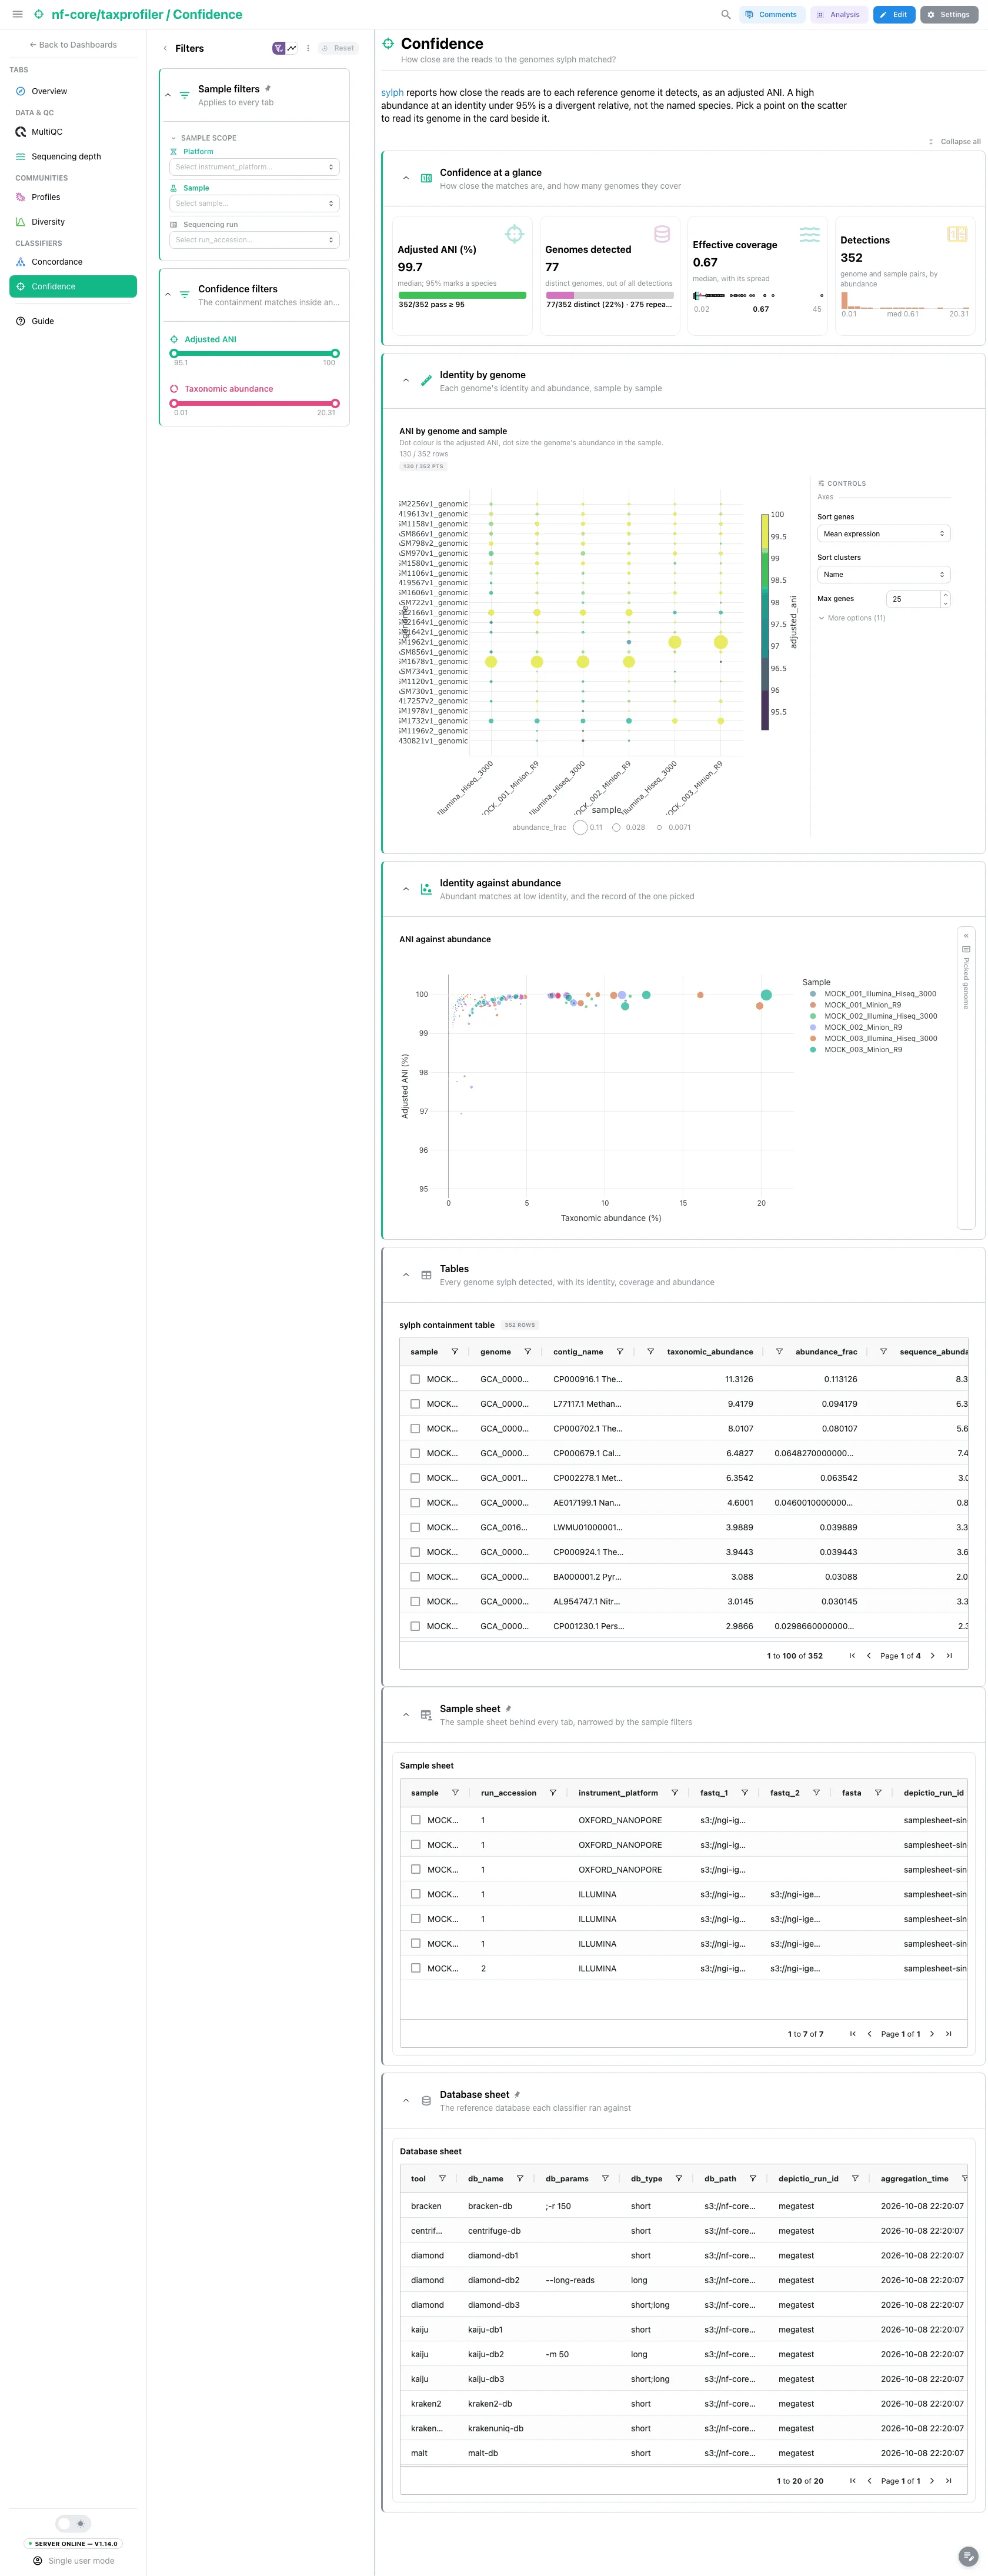
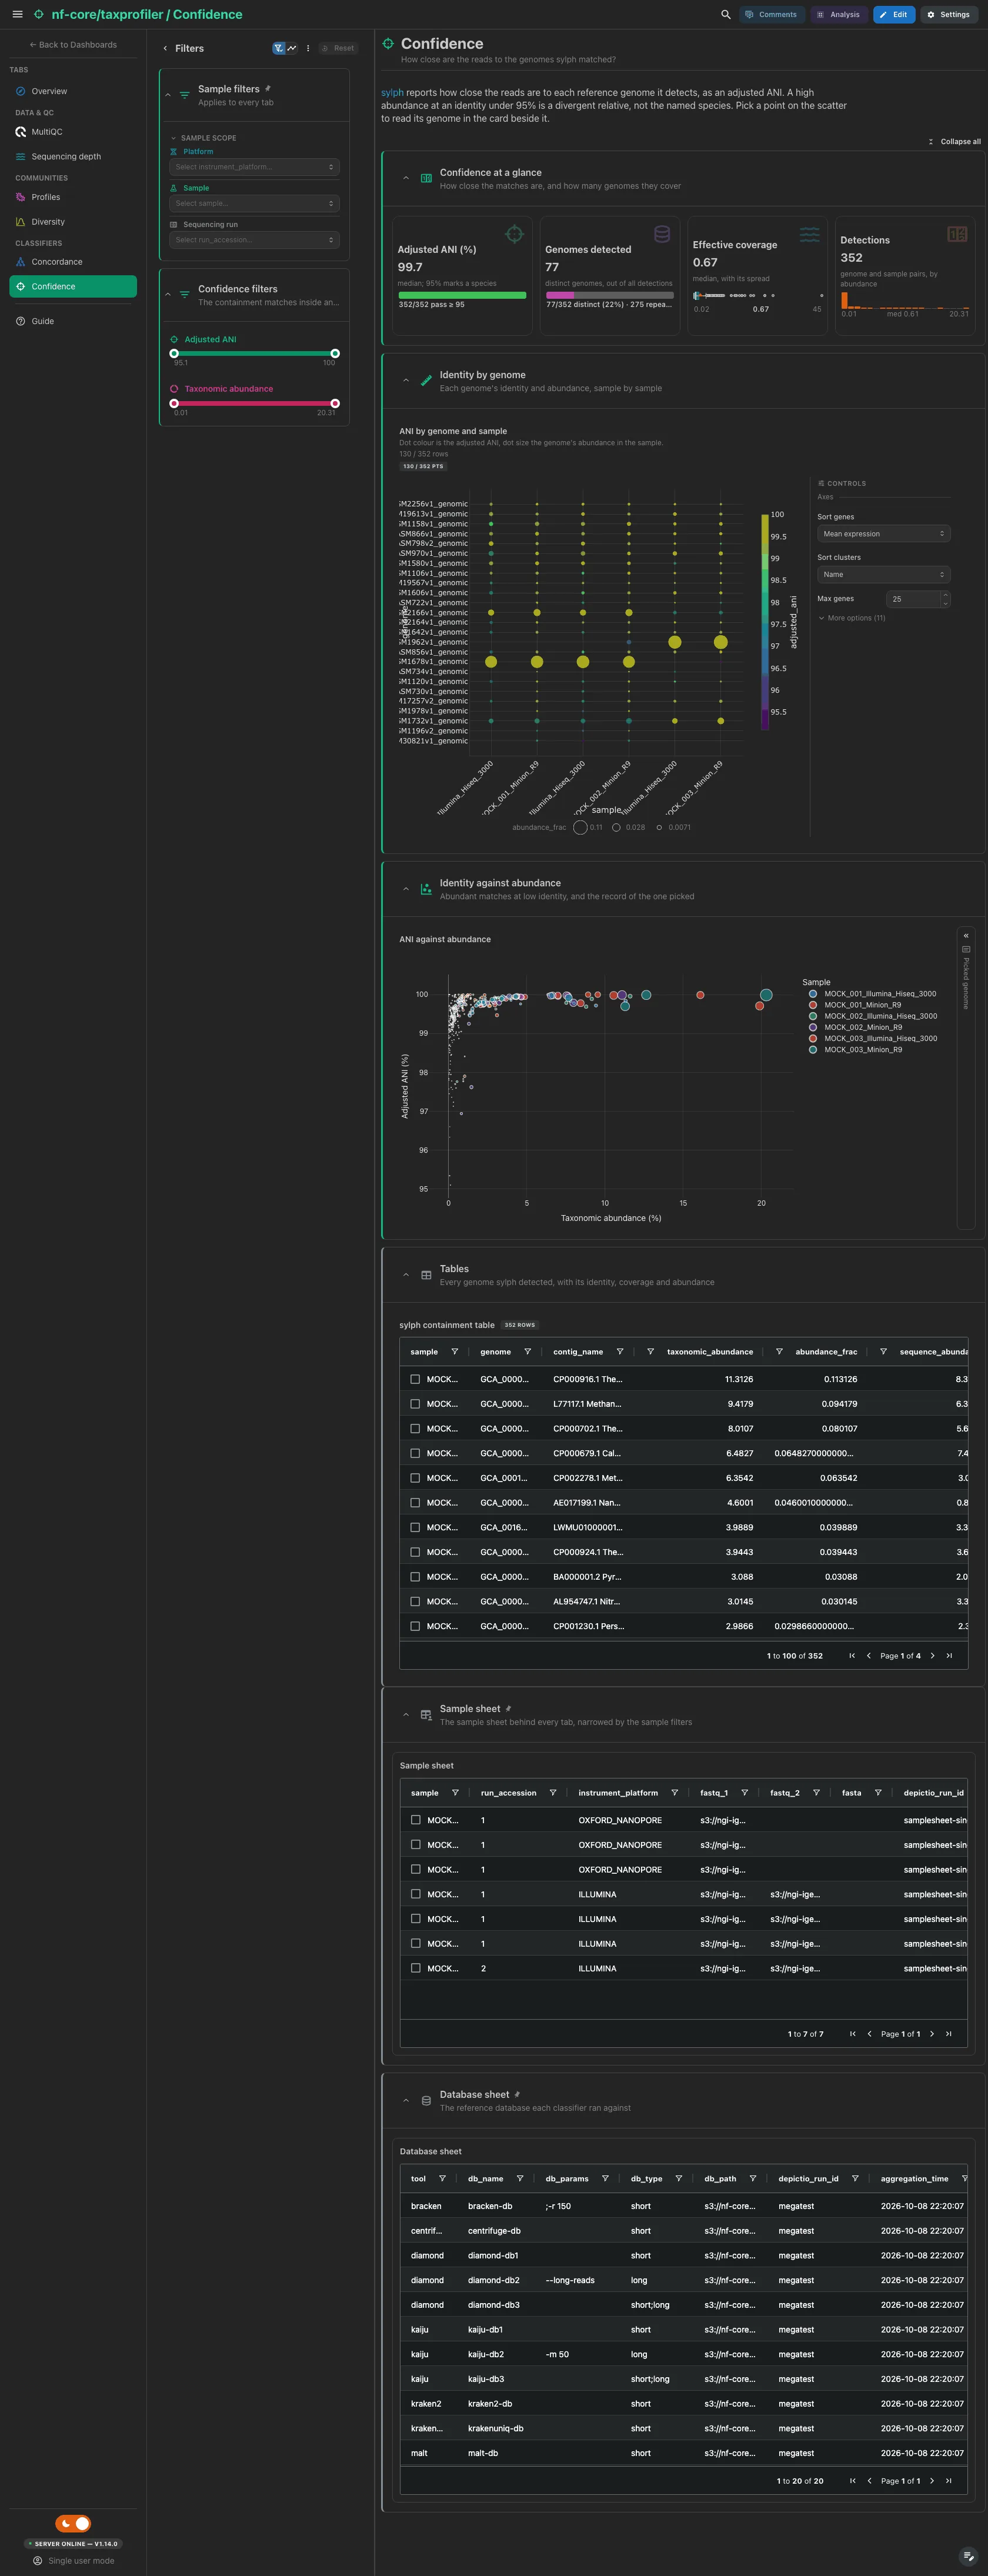
sylph reports the adjusted ANI of every genome it detects beside its abundance, so a high-abundance, low-identity genome reads as the divergent relative it is. The cards give the median ANI against 95%, the species boundary, the genomes detected, the effective coverage and the detections. Then the ANI by genome and sample, and identity against abundance beside a record card for the genome you pick.
Filters and components
Filters · Adjusted ANI and Taxonomic abundance ranges on
sylph_ani.
| Section | What it holds |
|---|---|
| Confidence at a glance | 4 cards |
| Identity by genome | 1 advanced visualization |
| Identity against abundance | ANI against abundance + a genome record card |
| Tables (collapsed) | sylph containment table |
Which panels the sample filter reaches
The persistent Sample filters narrow every taxpasta and sylph tile, the Nonpareil tiles and the MultiQC panels keyed on the sample id. They do not reach the per-classifier top-taxa panels: MultiQC keys those on a sample id carrying the database as a suffix, which no samplesheet value reduces to. The cross-classifier view of the same data, on the Profiles tab, does filter.
Tables and point views select on their entity column: the sample sheet on
sample; the Nonpareil scatter and table on library; the richness scatter, the
per-run table and the Bray-Curtis ordination on profiler_db; the
cross-classifier tables on the taxon name, the melon table on species and the
sylph clade table on clade_name; the ANI scatter and the sylph containment
table on genome. A pick narrows the other tiles of its collection and follows
the project links to the collections they reach.
Running the pipeline
Depictio reads the output of nf-core/taxprofiler, it does not run the pipeline. Run the pipeline first:
nextflow run nf-core/taxprofiler -r 2.0.1 \
  --input samplesheet.csv \
  --databases database.csv \
  --perform_shortread_qc --run_profile_standardisation \
  --run_kraken2 --run_bracken --run_sylph \
  --perform_shortread_redundancyestimation \
  --outdir results -profile docker
Then point Depictio at the results:
See nf-co.re/taxprofiler/usage for full pipeline documentation.
Required data structure
Point depictio ingest at the directory holding the pipeline output. Depictio scans
recursively, so only the parts a run actually wrote have to be present.
--run_profile_standardisation is the one real requirement: the five taxpasta
collections are what every cross-profiler tile is built from.
<DATA_ROOT>/
├── input/                                     # not written by the pipeline, see Test data
│   ├── samplesheet.csv                        # --var SAMPLESHEET_FILE (auto-detected)
│   └── database.csv                           # matched as input/database*.csv
├── pipeline_info/
│   ├── params.json                            # the run_* flags the layout adapts to
│   └── software_versions.yml
├── multiqc/multiqc_data/
│   └── multiqc.parquet
├── taxpasta/
│   └── <profiler>_<database>.tsv              # the hub, one table per combination
├── kraken2/, krakenuniq/, centrifuge/
│   └── <sample>/*.report.txt                  # where the taxon names come back from
├── sylph/                                     # ⚠ Requires --run_sylph
│   ├── sylph_<db>_combined_reports.tsv
│   └── <sample>/*.sylph.tsv, *.sylphmpa
├── melon/                                     # ⚠ Requires --run_melon and long reads
│   └── <database>/<sample>_<database>/*.tsv
├── nanoq/*.stats
└── nonpareil/nonpareil_all_samples.tsv       # ⚠ Requires --perform_shortread_redundancyestimation (short reads)
Validation runs
The repository ships
download_test_data.sh,
which fetches the subset of nf-core's AWS megatest run that the template needs:
The run is
s3://nf-core-awsmegatests/taxprofiler/results-70ecc15e49b4f1fcf79d876643b5d14b65c66178/:
3 mock communities across 2 sequencing platforms and 12 profiler/database
combinations. Only the per-sample summary tables are fetched; the read-level
outputs are roughly 3 GB and the template never reads them. taxprofiler does not
copy its two input sheets into the results tree, so the script curls them from
the test-datasets URLs in params.json into input/ after the S3 fetch.
Then run Depictio against it:
Additional resources
- nf-co.re/taxprofiler: official pipeline documentation
- nf-co.re/taxprofiler/2.0.1/results: AWS test results
- taxpasta: the standardisation step the hub collection is built on
- Template System Reference: YAML format, variables, conditionals
- Recipes: how to read, test, and write recipes
Authorship
 weber8thomas
Reviewing a template on your own data, or taking over a role here, is a contribution in itself: the contributing guide says what each one involves.