Monitoring: Log & Task
Admin-only panel (Administration → Log & Task, /admin) exposing a durable MongoDB ledger of background activity: Celery tasks, ingestion runs, running watchers, application logs, and worker health. Since v1.11.0 each pane has its own address, /admin/tasks, /admin/ingestion, /admin/logs and /admin/health, joined by /admin/watchers for the Watchers pane, and the Ingestion pane keeps its filters in the query string, so a filtered view can be bookmarked or sent. /admin/monitoring redirects to /admin/tasks.
Availability
Admin-only. Shown in single- and multi-user mode, hidden in public/demo; non-admins get Forbidden.
Each pane polls every 8 s; toggle Auto to pause. With live updates on, a green Live badge appears and the active pane refreshes on each event. The Tasks, Ingestion and Logs panes each have a free-text search box next to their filters.
Tasks
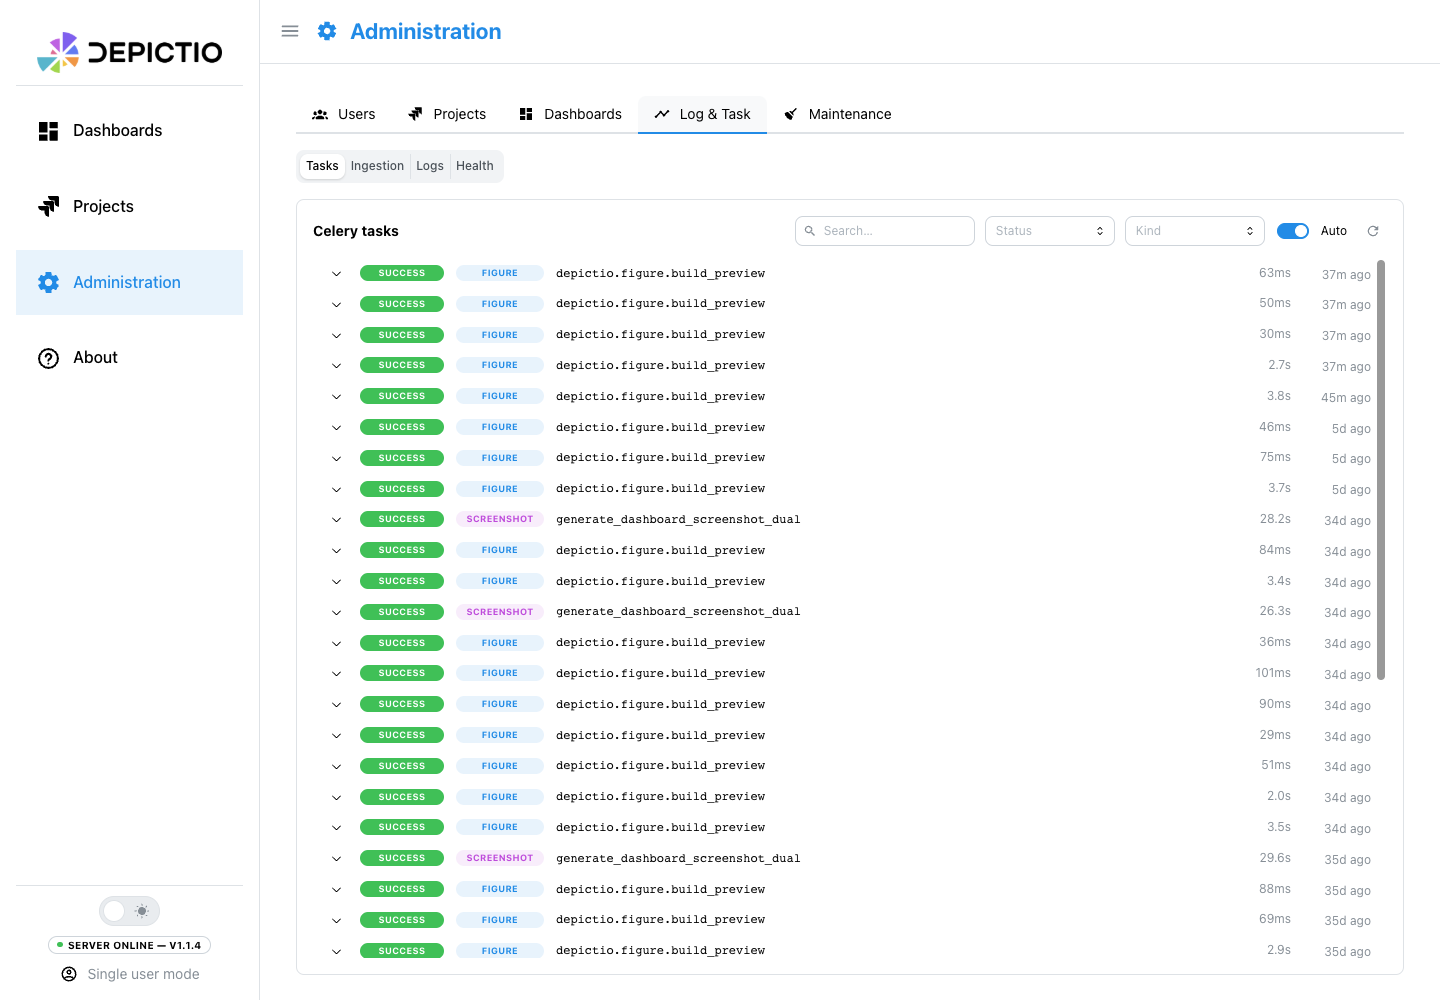
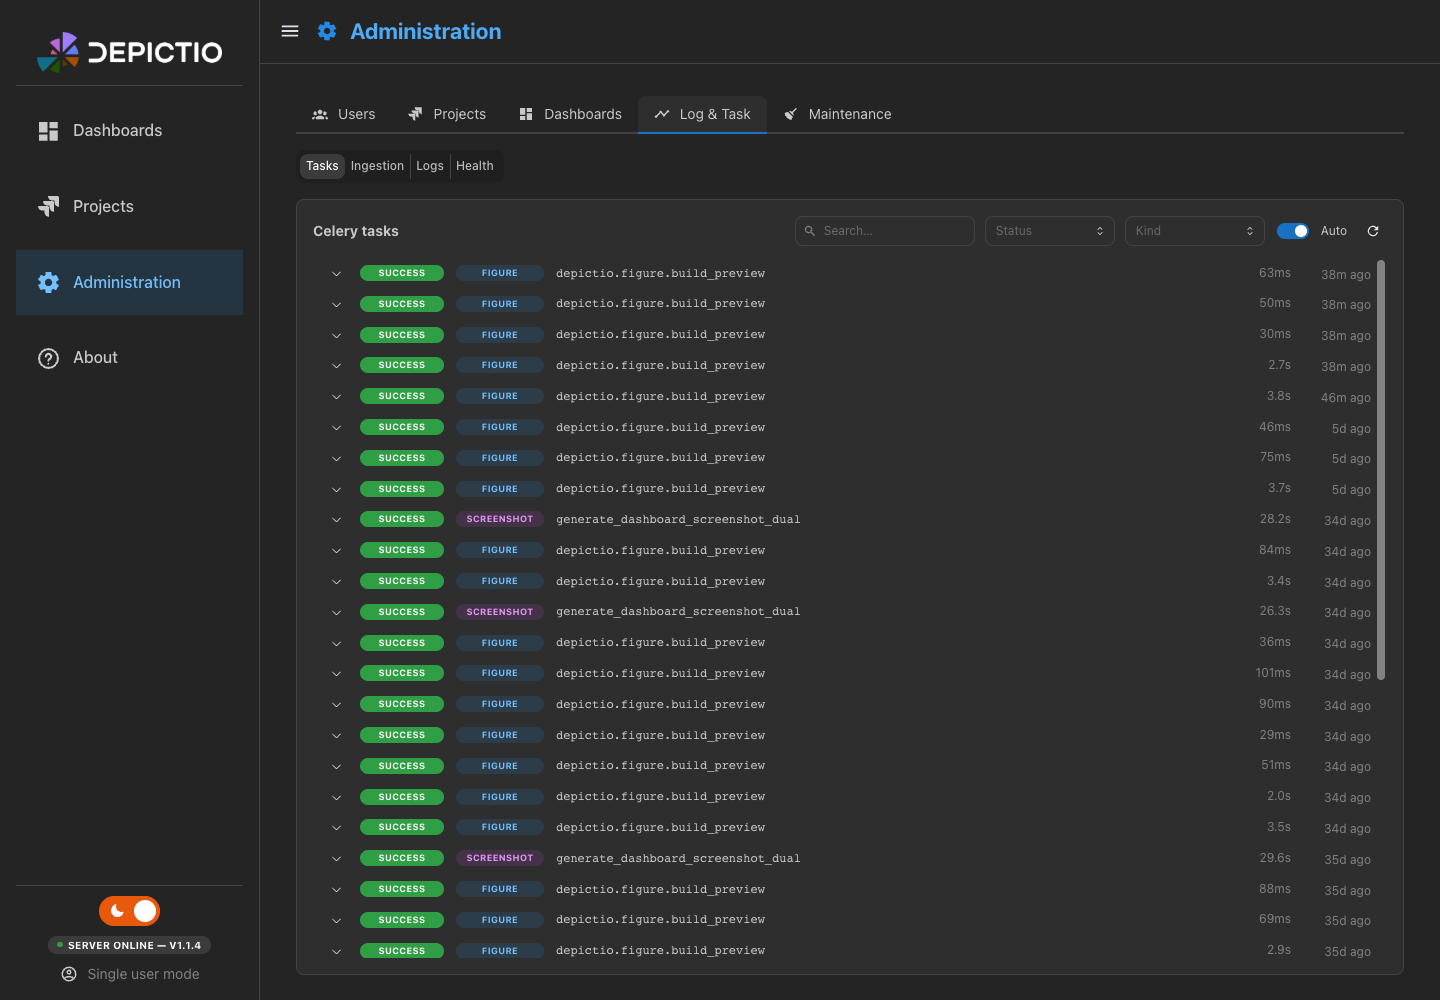
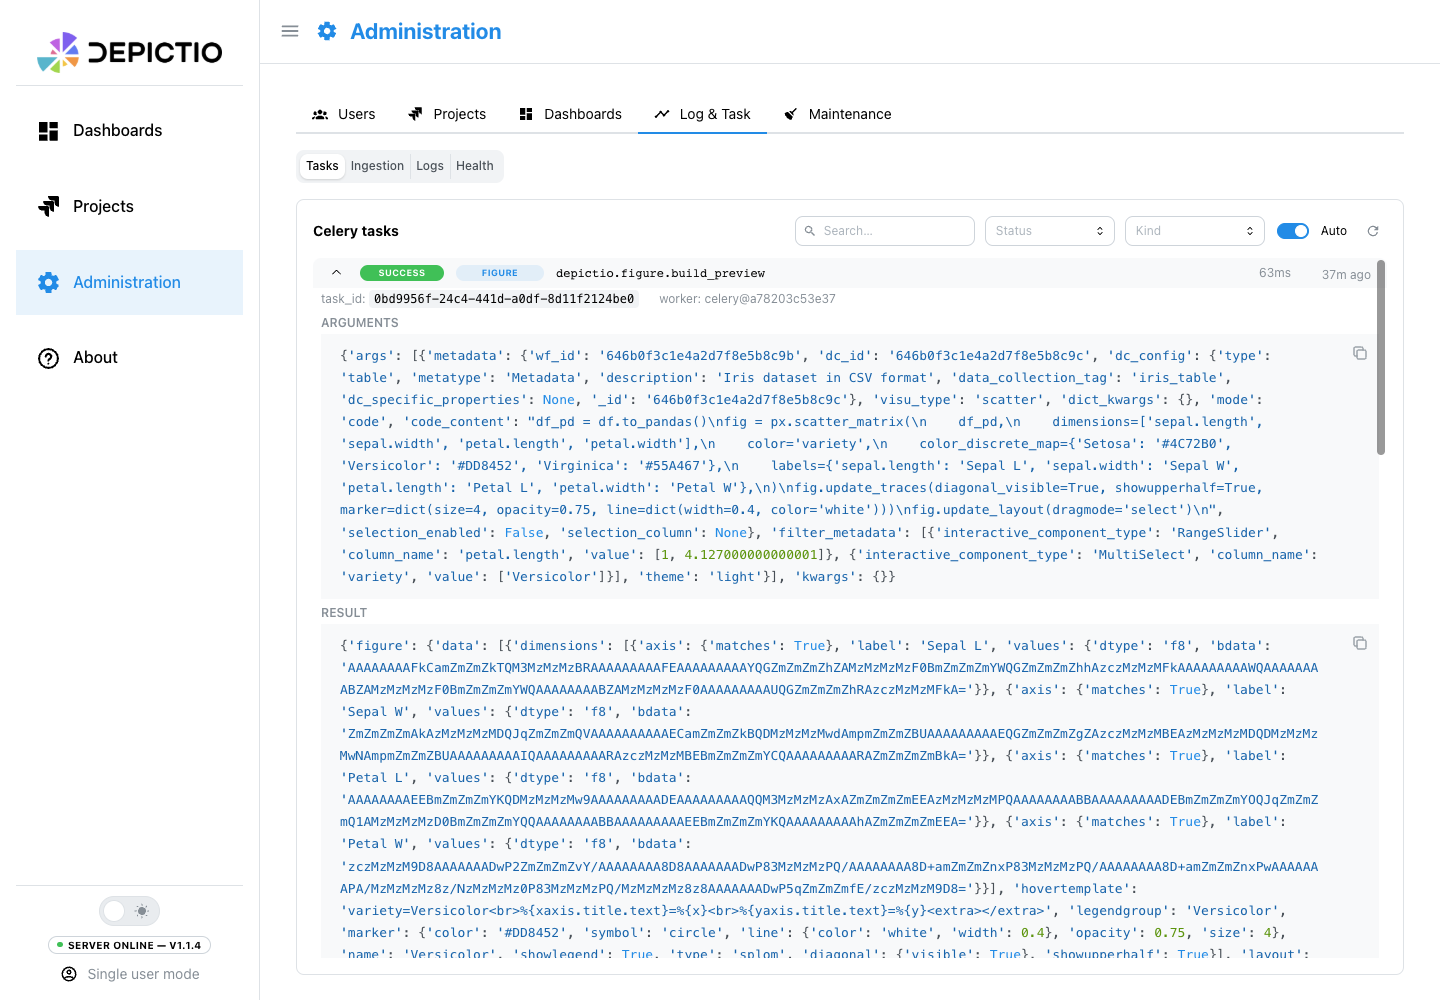
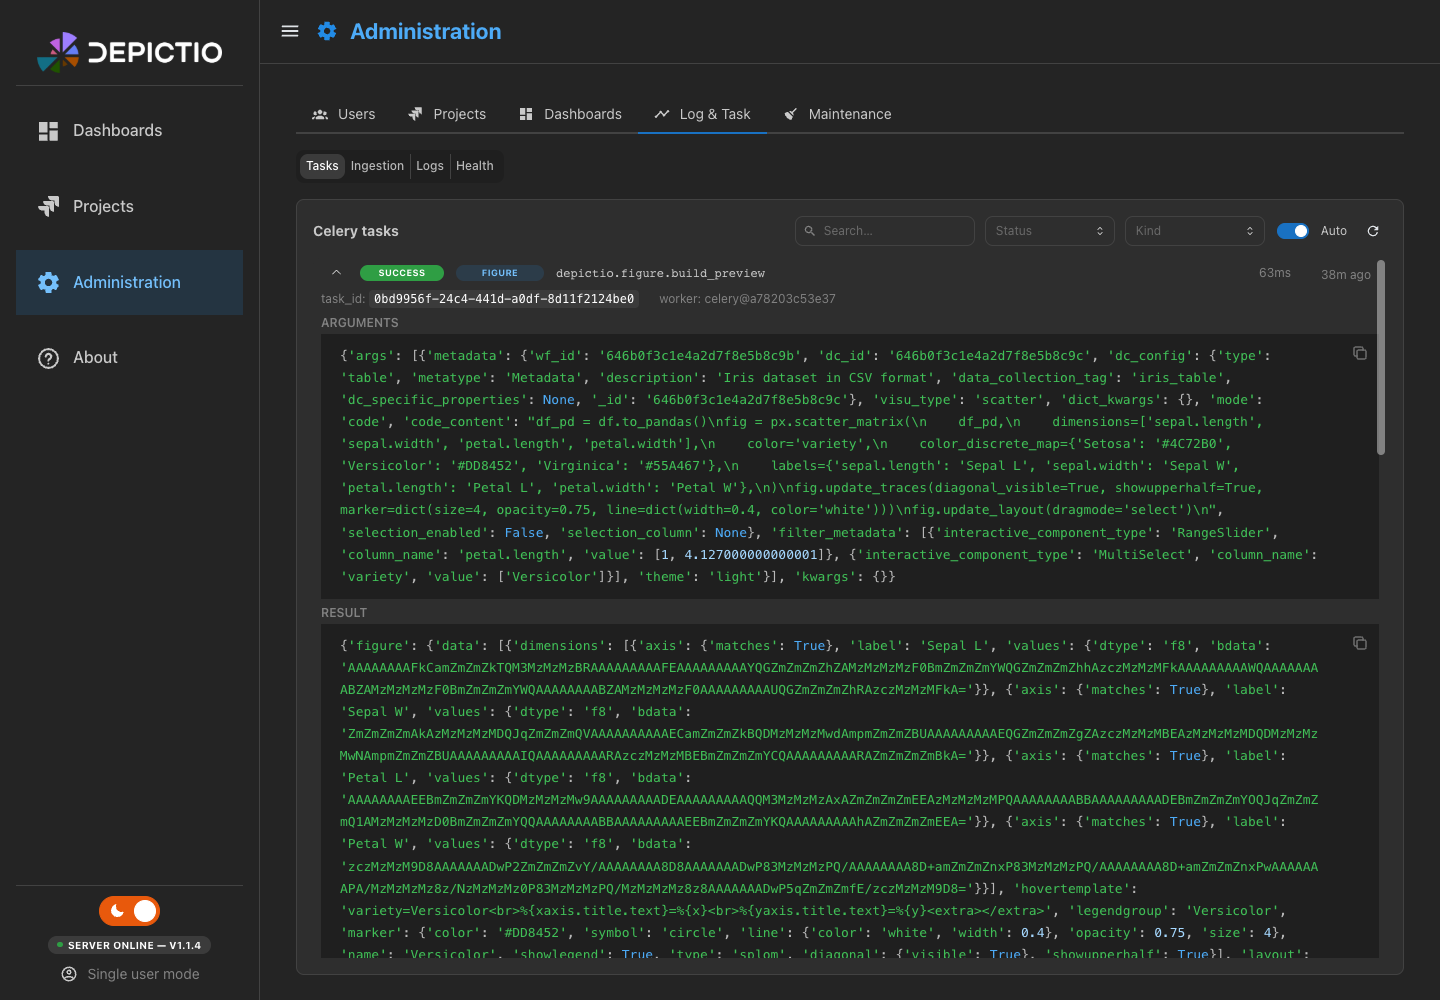
Celery task history (figures, screenshots, MultiQC, advanced viz, Delta tables) with a status badge, duration, and timestamp. Filter by status, kind, or text. Expand a row for the task id, worker, and labelled Arguments, Result, Error / Traceback and Logs blocks.
Ingestion
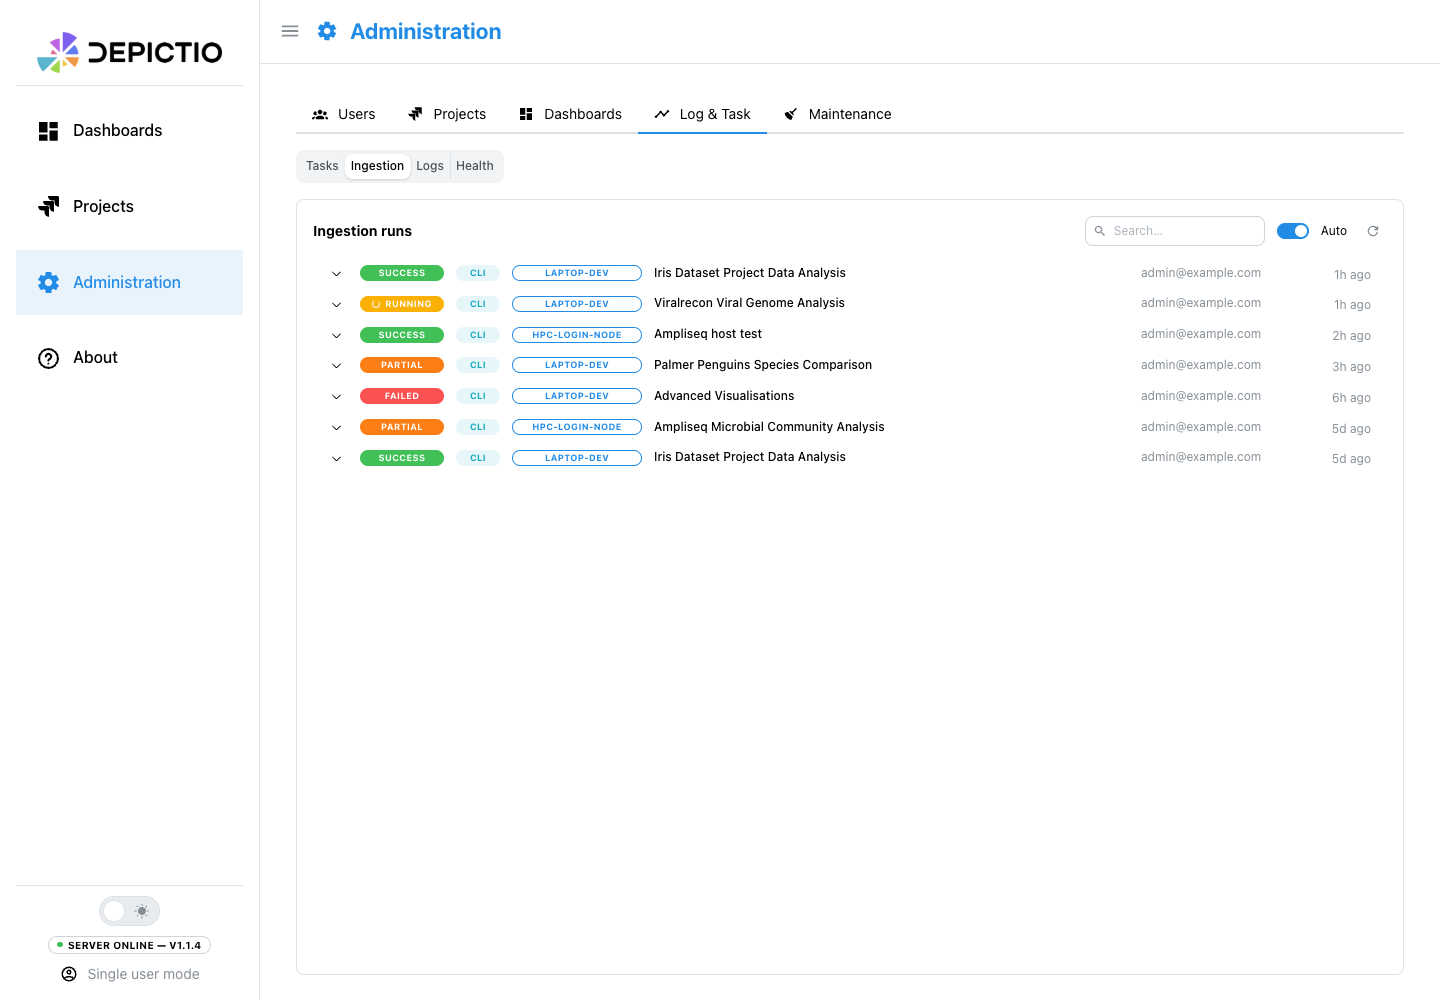
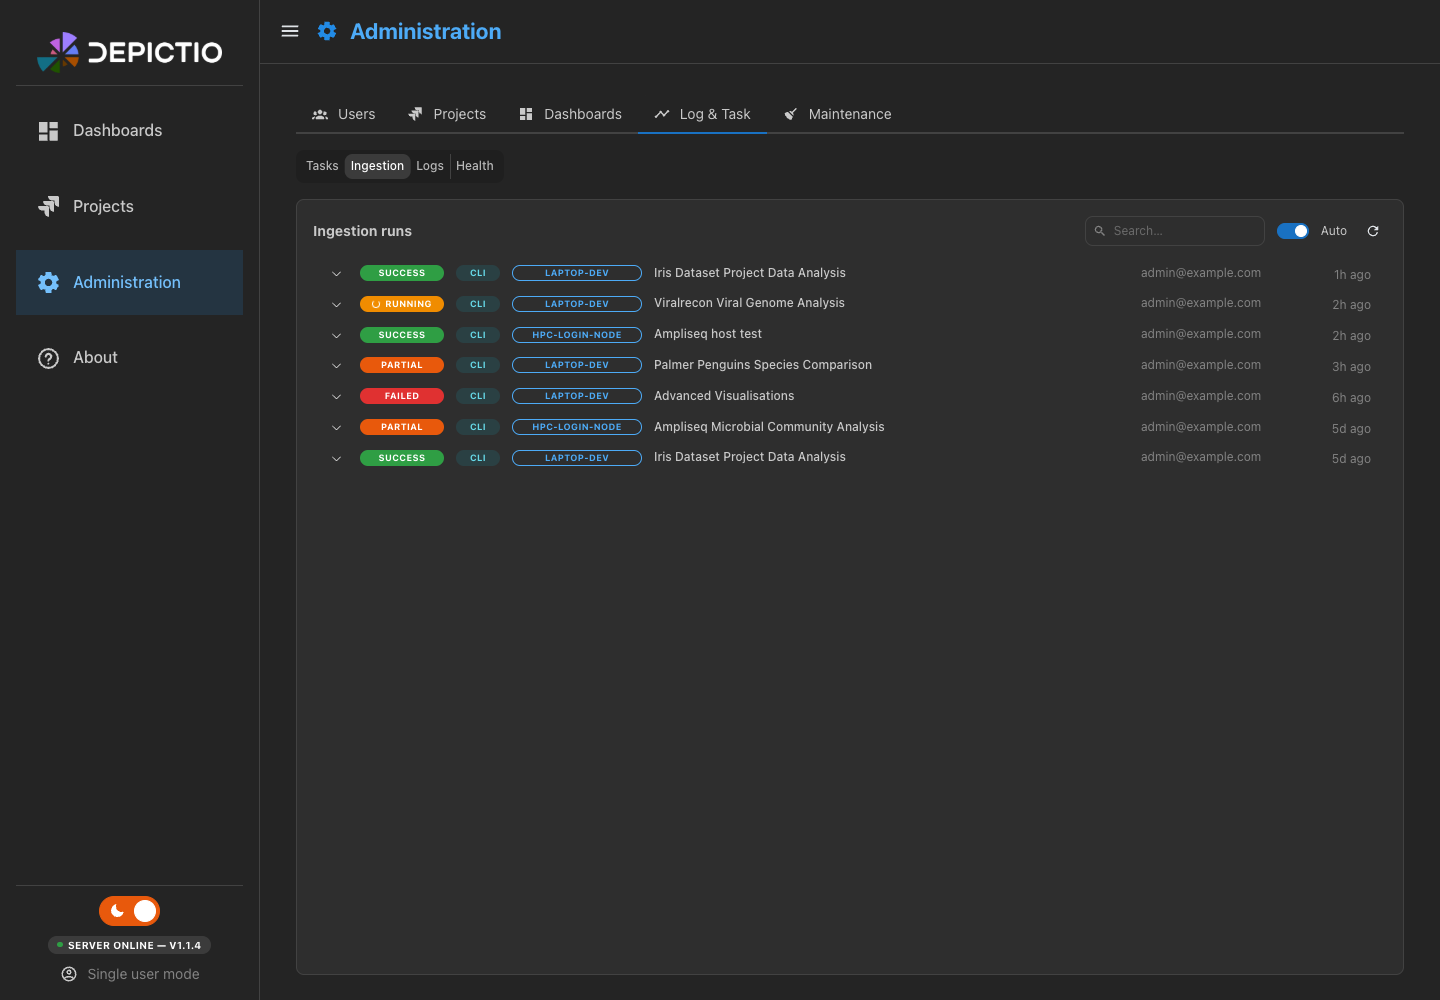
Ingestion runs, newest first: status, a CLI, Upload or Server source badge (a run from the Nextflow trigger shows CLI), instance label or hostname, project, and user. Uploads made through the web UI are recorded alongside CLI runs; recording is best-effort and never blocks an upload. Server marks an ingestion the server ran itself after someone pressed Run ingestion on a project page (v1.15.0+), created a project from a run folder or started a Data refresh (v1.16.0+); its instance is Web UI. The last two record from_run or refresh_manifest as their command, Manual as their trigger, and one step per data collection, named by its tag, in place of the CLI's phases. The runs of one project also appear in its ingestion history, for anyone who can open the project.
A run is running until it ends as success, partial or failed. Since v1.11.0 the CLI closes its record on every way out, so Ctrl-C or SIGTERM leaves interrupted rather than a run that spins forever. For the ends nobody can report, such as SIGKILL or a lost node, the server sweeps a running record with no write for DEPICTIO_MONITORING_INGESTION_STALE_AFTER_HOURS (24 by default) to abandoned. Filter by Status, Instance and Project; the instance is the CLI's instance_label, or its hostname when none is set.
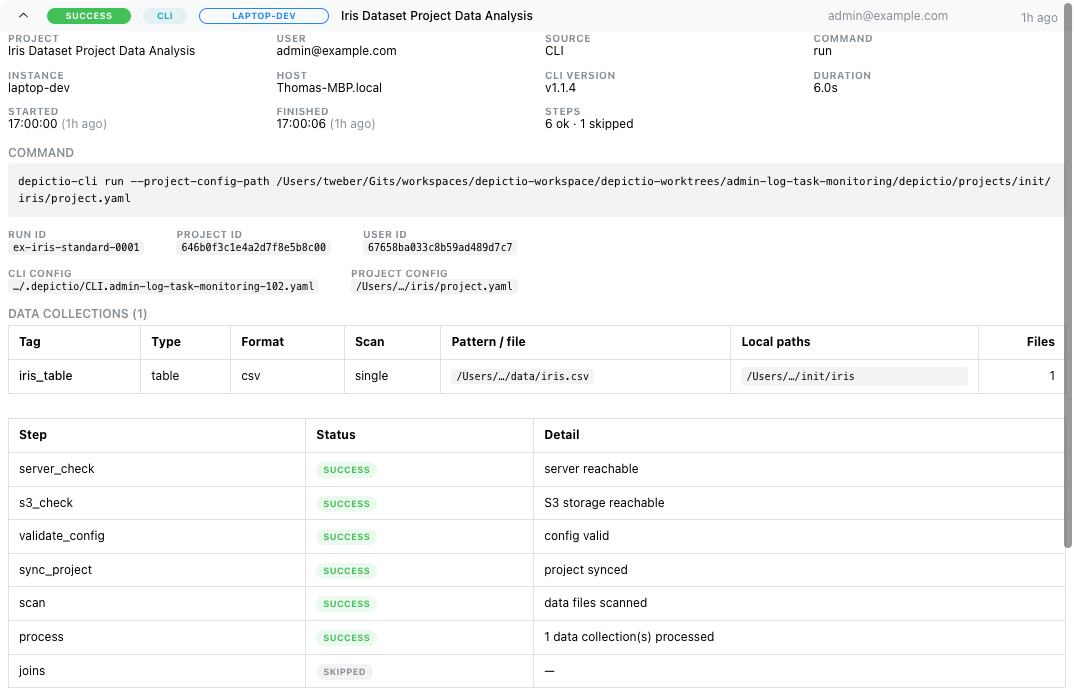
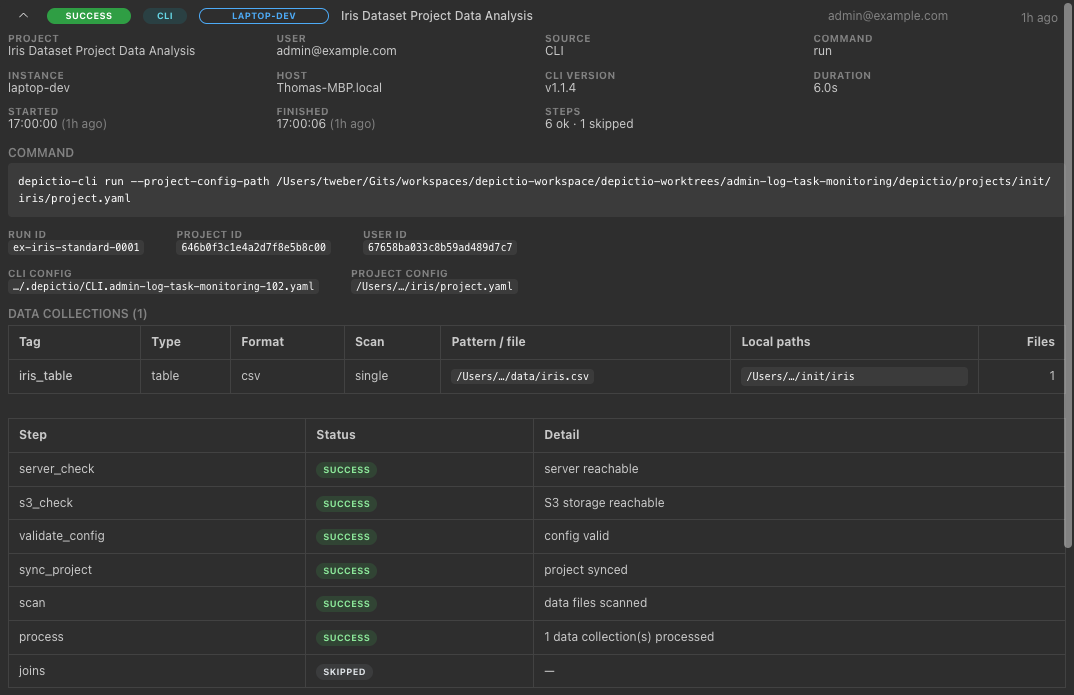
Expand a run for its provenance field grid: run id, host, CLI version, the resolved project id, the invoking command line, the CLI and project config paths, and the data root. Its Trigger says what started it: Manual, Watch (a watcher) or UI (the web UI: Run now on a watcher's card, or Run ingestion on a project page), with the reason in a tooltip. Long paths are shortened to head/…/tail, with the full value in a tooltip and click-to-copy. Below it come two blocks:
- Data collections: one row per data collection: tag, type, format, scan mode (
recursive/single, and from v1.16.0url/s3_prefix/manifest, orrecipefor a derived collection the server re-ran), what it matched on (the regex or filename for the local modes; the URL, the prefix plus its glob, or the manifest URL for the remote ones), the local directories scanned, and the file count when known. These local scan paths are not shown anywhere else in the UI. - Steps: a timeline of every phase the run went through (provisioning, template resolve, server and S3 checks, config validation, project sync, scan, process, joins, dashboard import), each with
success/failed/skipped/interruptedand a detail line such as 3 data collection(s) processed. The summary line tallies ok / failed / skipped and the wall-clock duration.
The CLI reports each step as it starts, so a running ingestion shows its steps as a live timeline: the current step is marked, with a progress bar when the CLI knows how far it is, and counters such as scanned, new, updated, unchanged, skipped, failed, deleted, rows, bytes and runs. A step offloaded to a server worker carries an offloaded badge. The server records at most DEPICTIO_INGESTION_STEP_UPDATES_PER_MINUTE step updates per run and minute (60 by default) and drops the rest; a step reported as success, failed or skipped always gets through (v1.15.0+).
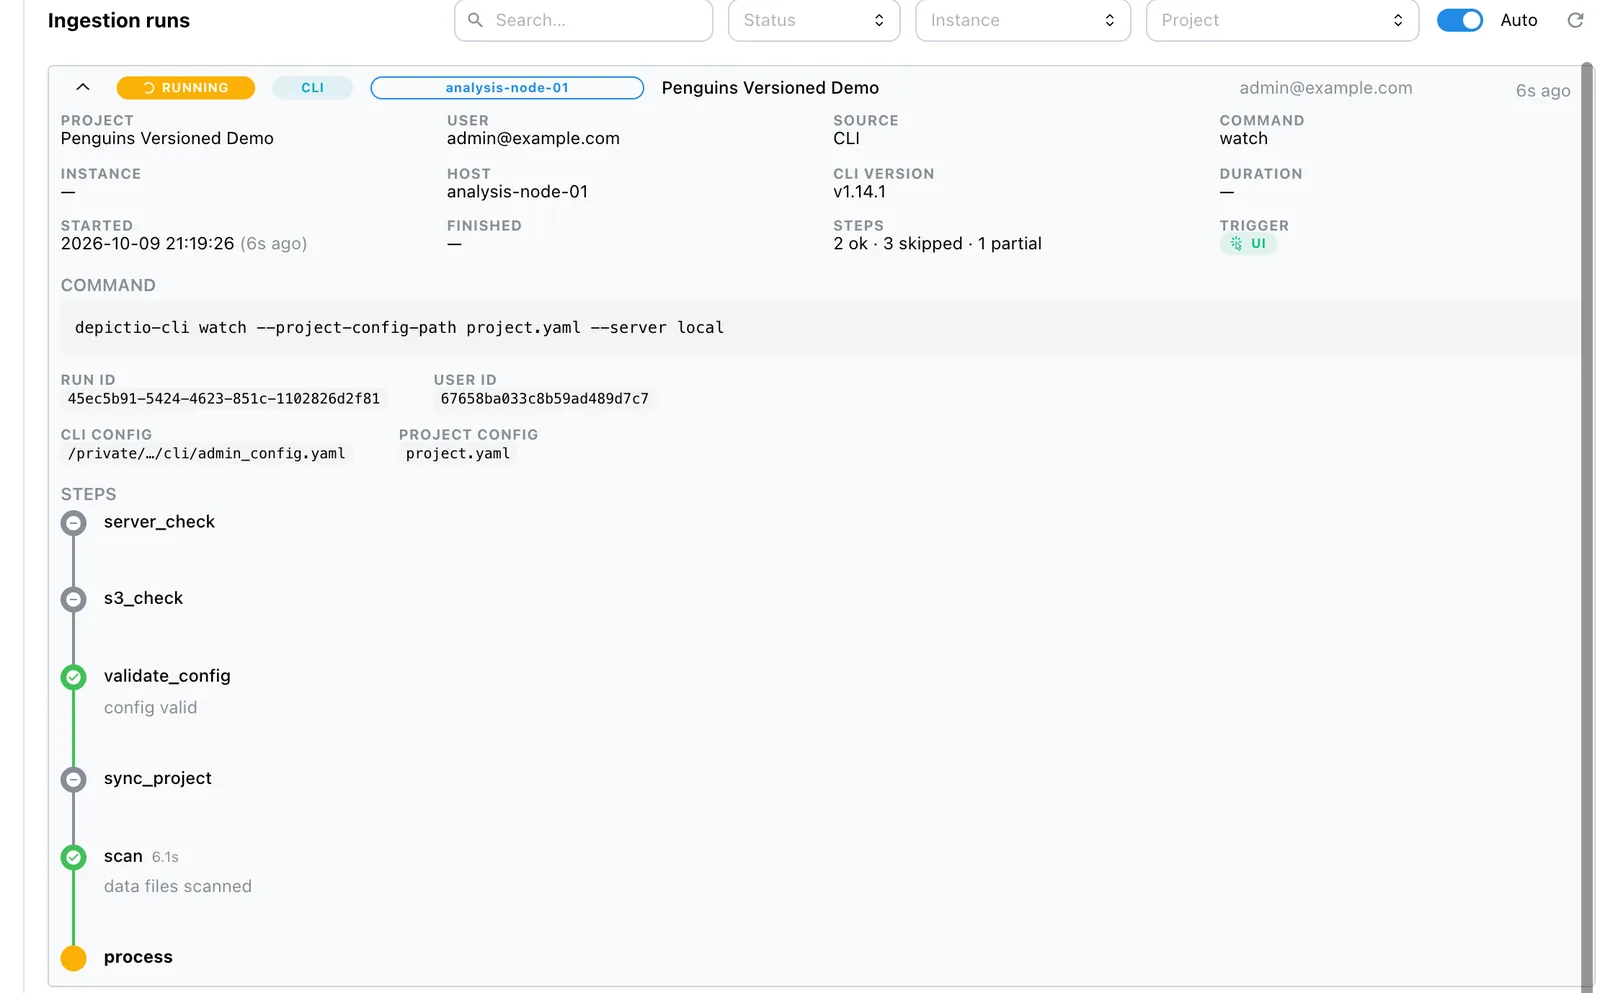
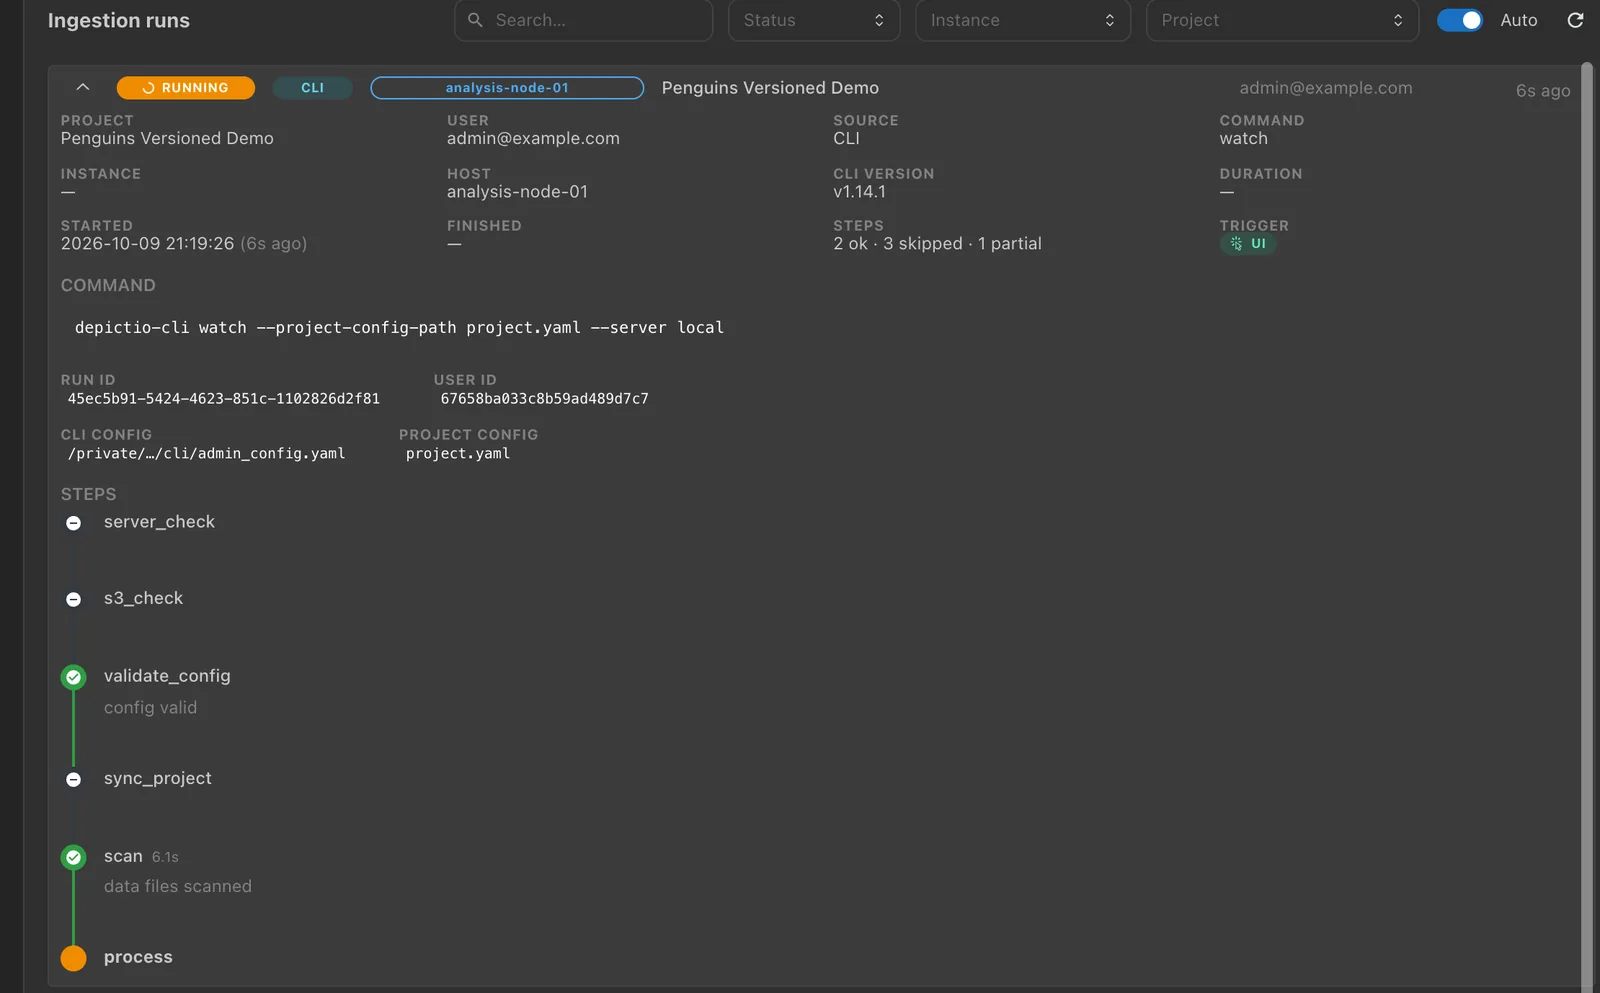
Administration → Log & Task → Ingestion: a run started by Run now, expanded while it runs.
Watchers
Every running depictio watch, one card each: its status (idle, settling, scanning, ingesting or error), host, project, mode (incremental or full), how it detects changes (native, polling or both), and the number of cycles it has run. Expand a card for its PID, CLI version, when it started and last fired, the last ingestion it ran, the locations it watches, and its last error.
Run now asks the watcher for a cycle at once, without waiting for a change. The watcher picks the request up within a few seconds, since it polls the server for it, and the run shows UI as its trigger. The button is unavailable while a cycle runs, while a request is pending, and when the watcher has sent no heartbeat for over 3 minutes, which the card flags in red.
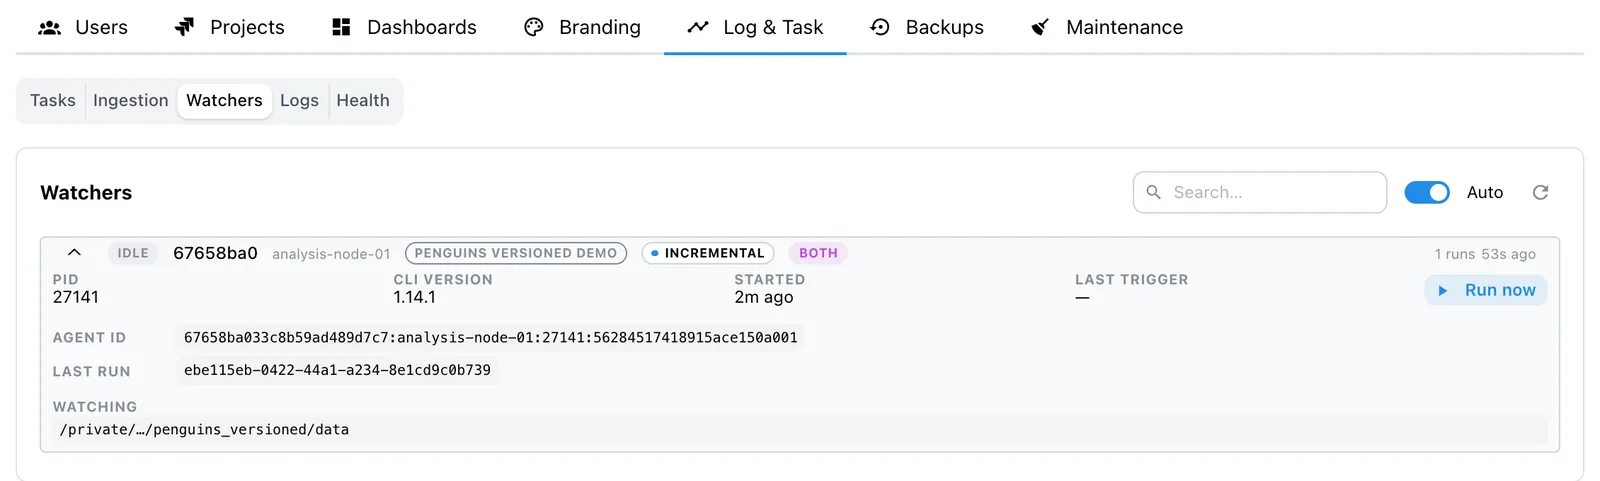
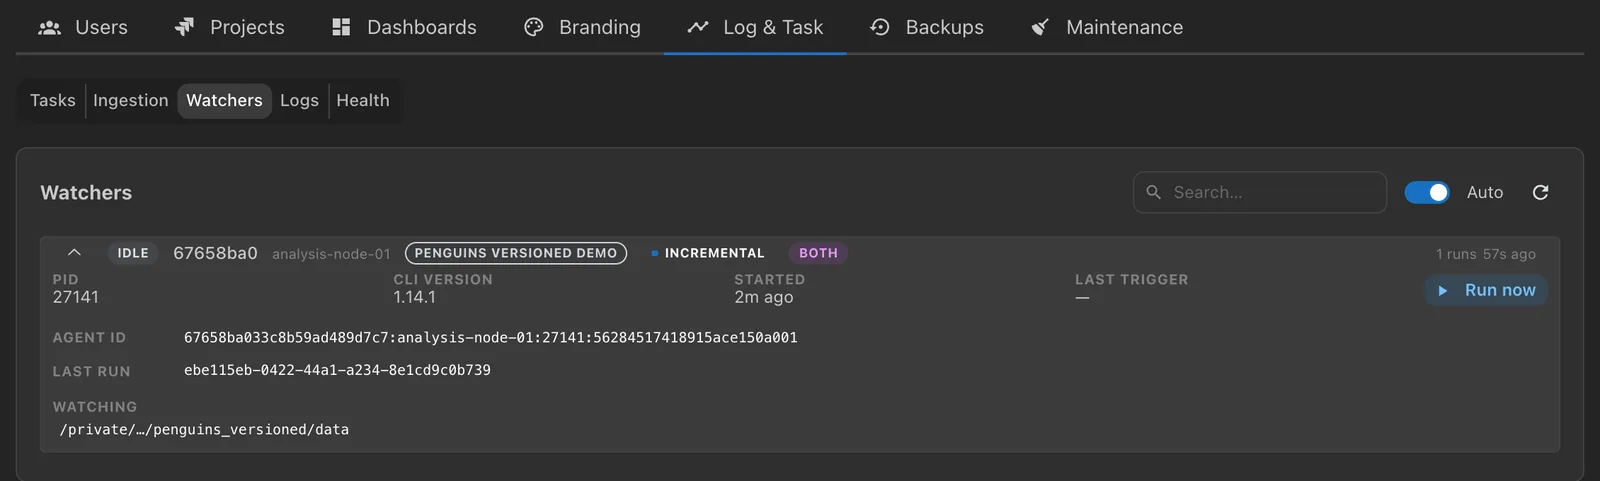
Administration → Log & Task → Watchers, a card expanded.
A watcher sends a heartbeat every minute and leaves the pane when it stops cleanly. One that dies leaves it once its last heartbeat is older than DEPICTIO_MONITORING_AGENT_TTL_SECONDS. See How new data versions are written for what a watcher is for.
Logs
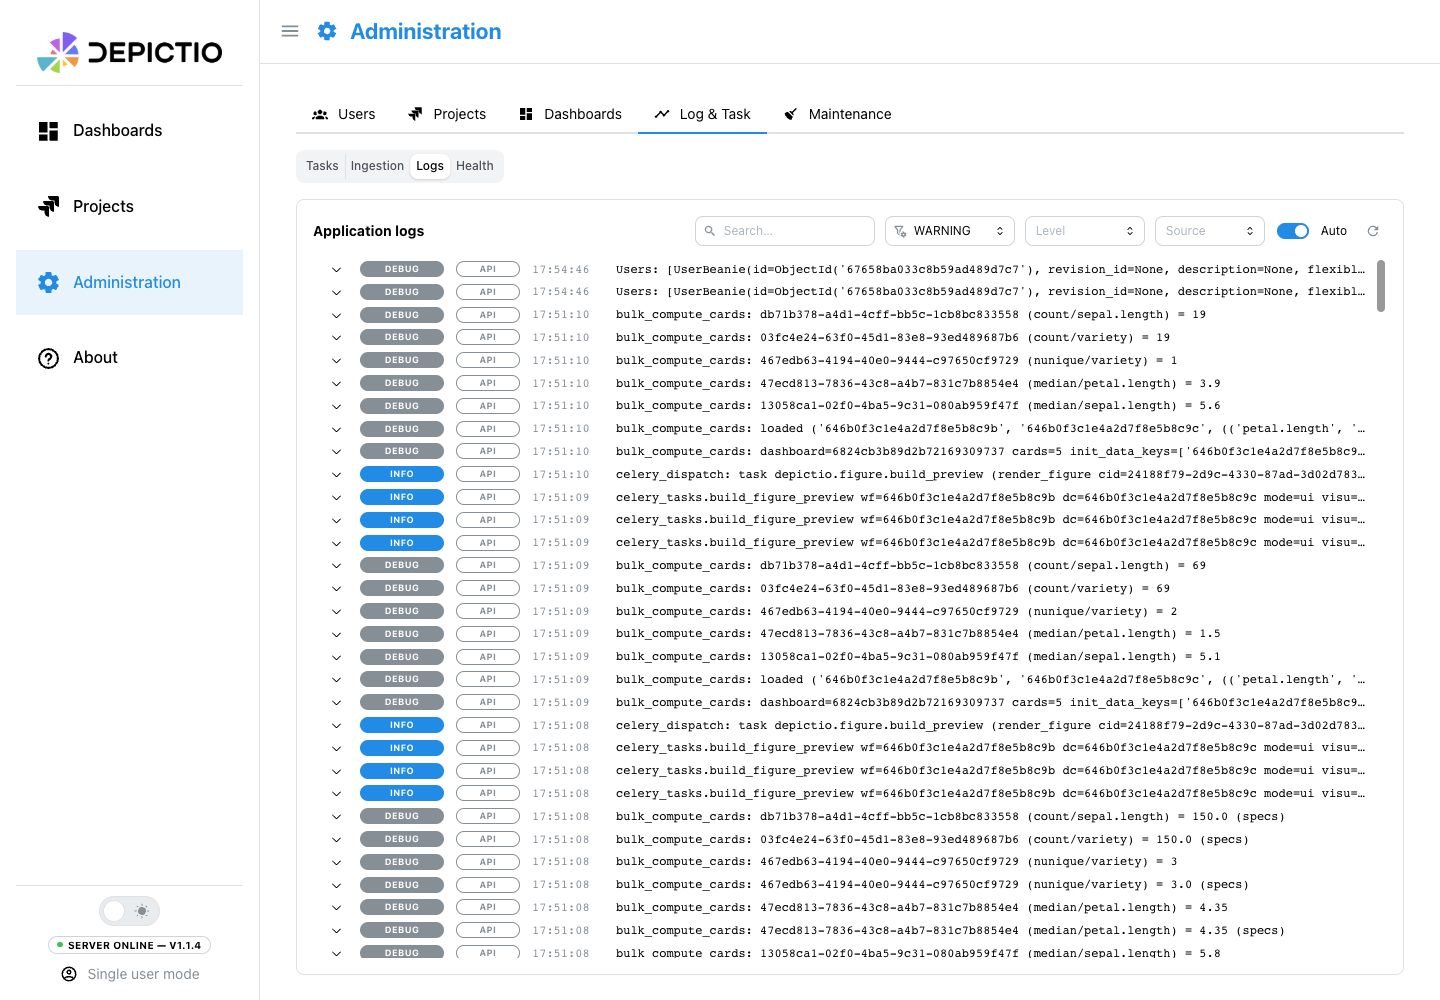
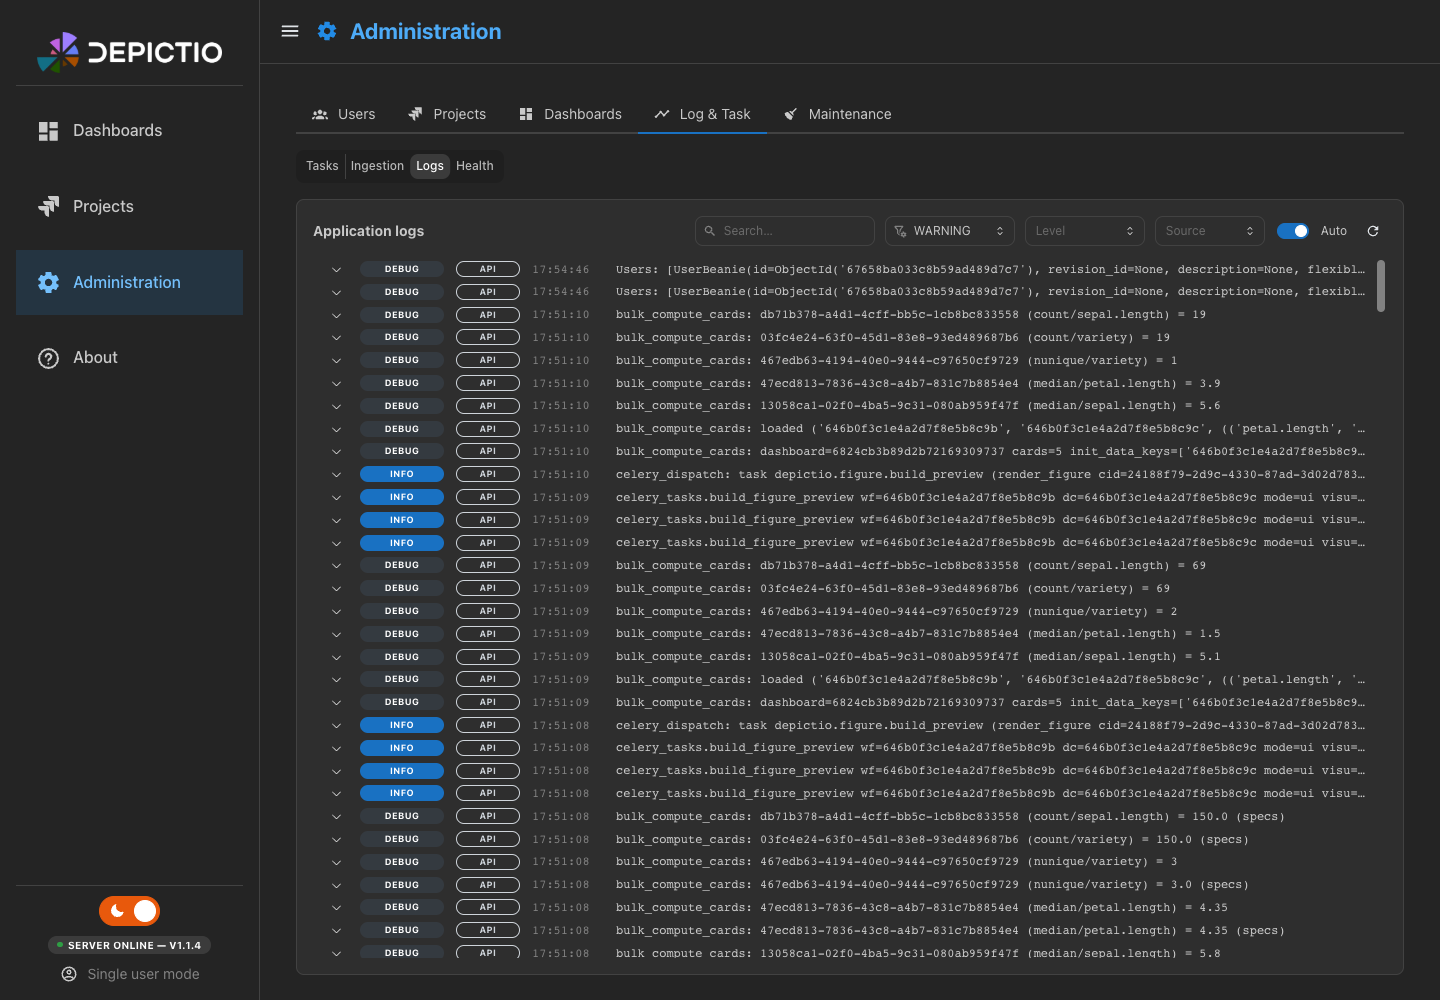
Recent application logs from a capped collection, tagged by level and source (api / celery). Filter by level, source, or text; expand a row for the logger, the source file:line, and the full message.
Runtime capture floor
The capture floor selector sets what the server persists, live. Drop it to DEBUG while debugging, then raise it back. It differs from the Level filter, which only narrows rows already captured. The change is broadcast to Celery workers and is not persisted: a restart falls back to DEPICTIO_MONITORING_APP_LOG_MIN_LEVEL.
Health
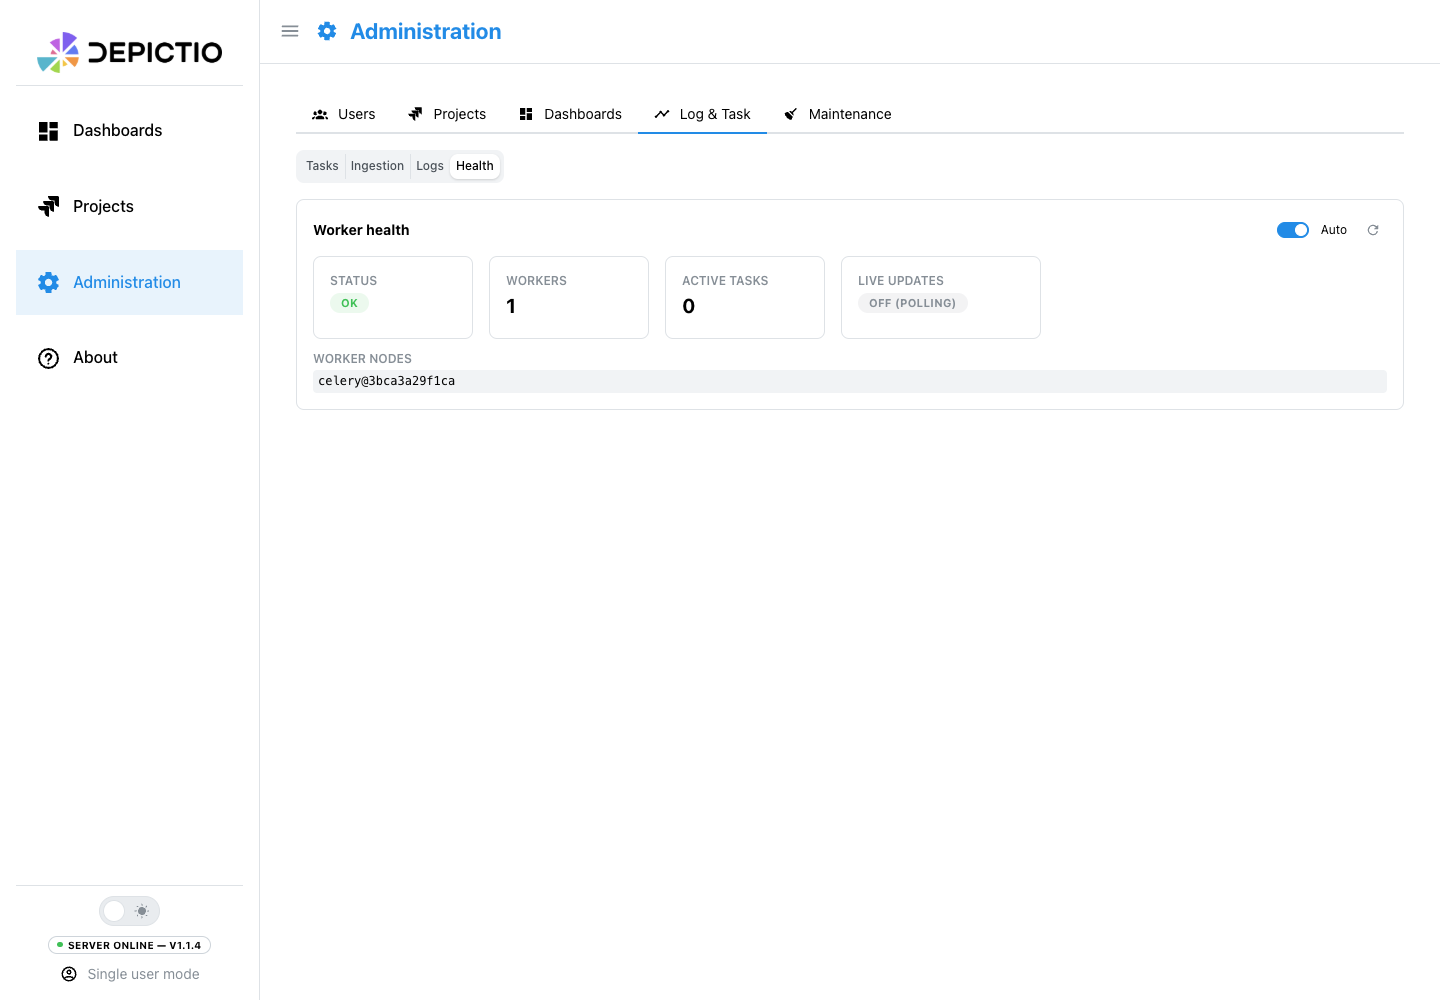
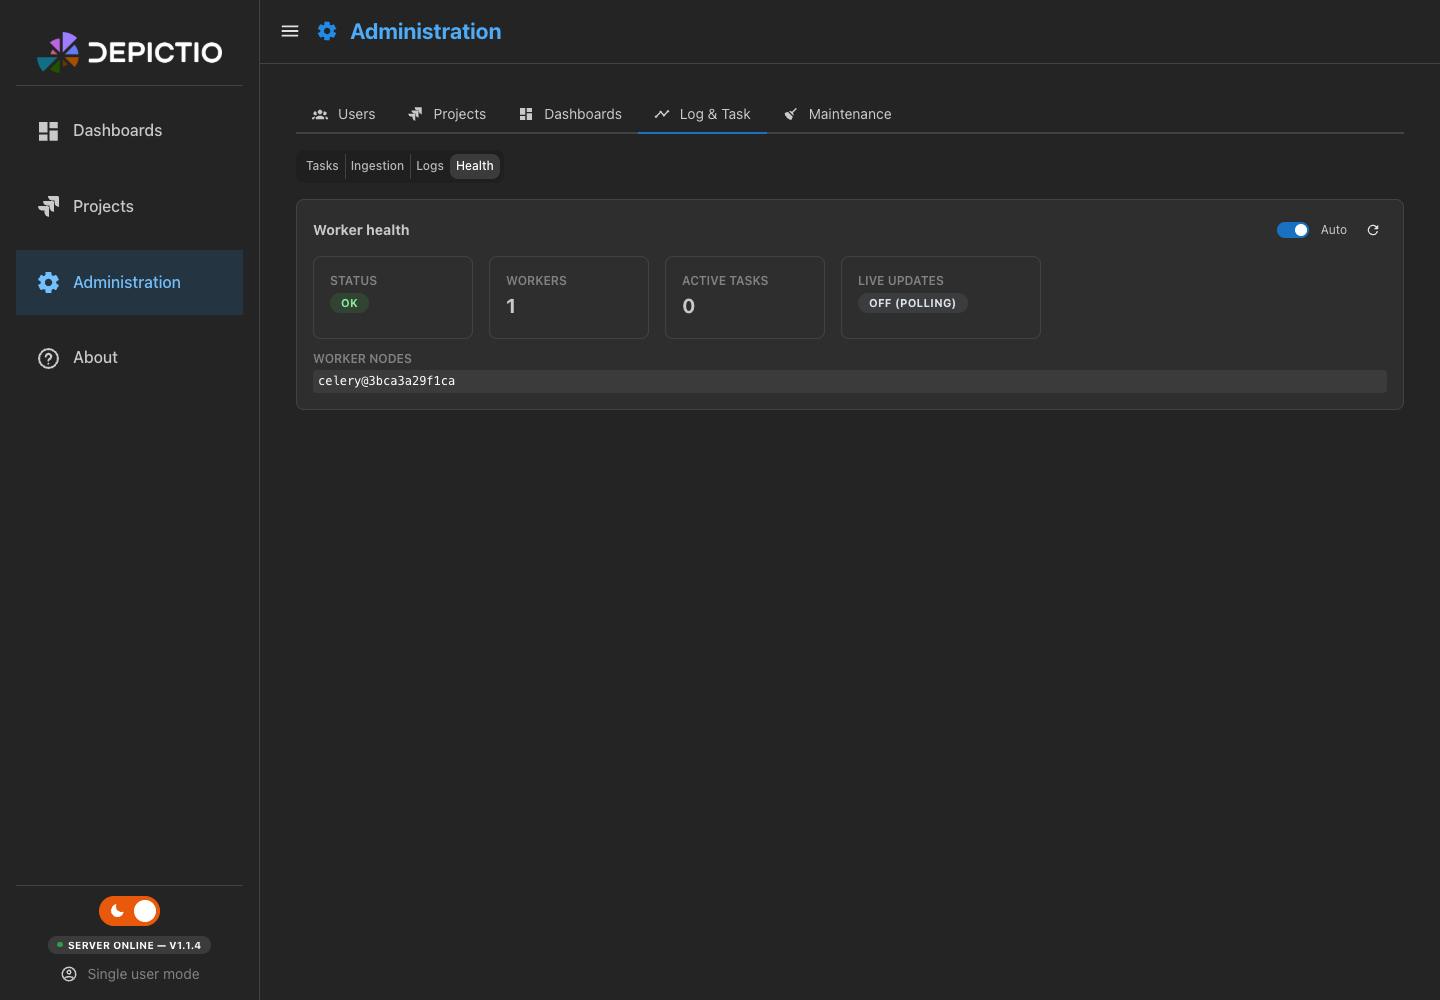
Celery worker and broker health: status, worker count, active tasks, live-updates state, and worker hostnames.
Configuration
| Variable | Default | Purpose |
|---|---|---|
DEPICTIO_MONITORING_ENABLED |
true |
Master switch. |
DEPICTIO_MONITORING_RETENTION_DAYS |
14 |
TTL for task events. |
DEPICTIO_MONITORING_APP_LOG_MIN_LEVEL |
WARNING |
Default log capture floor. |
DEPICTIO_MONITORING_APP_LOG_CAPPED_MB |
64 |
Log collection size cap. |
DEPICTIO_MONITORING_LIVE_UPDATES |
true |
Enables live WebSocket push. |
DEPICTIO_MONITORING_INGESTION_STALE_AFTER_HOURS |
24 |
Hours without a write before a running ingestion is swept to abandoned; 0 disables the sweep. Every live step update counts as a write. Not forwarded by the bundled compose files or Helm chart. (v1.11.0+) |
DEPICTIO_MONITORING_AGENT_TTL_SECONDS |
300 |
How long a watcher stays listed after its last heartbeat. At least 60 |
DEPICTIO_INGESTION_STEP_UPDATES_PER_MINUTE |
60 |
Step updates recorded per ingestion run and minute, beyond which the server drops them. success, failed and skipped steps always pass. (v1.15.0+) |
Live push
Requires DEPICTIO_EVENTS_ENABLED=true. Without it the panel still works over polling.
CLI ingestion identity
Set instance_label in the CLI YAML; each request then sends X-Depictio-CLI-Instance and X-Depictio-CLI-Host, and depictio ingest records an ingestion run automatically, so multiple CLIs against one server stay distinguishable. Recording is best-effort and never blocks ingestion.
What leaves the machine
Sensitive option values such as --provisioning-key are redacted to *** before the run is reported, but the rest of the invocation and the local paths listed above (CLI and project config, data root, scanned directories) are visible to server admins whenever monitoring is enabled.
Post-deployment check (v1.3.0+)
scripts/check_deployment.py walks every dashboard and every tab the API
returns and replays, per component, the exact data fetch the viewer issues for
that component type. It reports which components fail and attributes each
failure to a root cause. No browser involved.
uv run python scripts/check_deployment.py --host demo.example.org
uv run python scripts/check_deployment.py --host localhost:5080 --scheme http
With no token it sends no Authorization header, which on a public-mode
instance is what an ordinary visitor gets, so the run reproduces what a visitor
sees. Pass --token-file with an admin bearer token to cover private dashboards
too.
| Option | Default | Description |
|---|---|---|
--host |
required | Viewer or API host, with or without scheme. |
--scheme |
https |
https or http. |
--token-file |
- | File holding an admin bearer token, one line. |
--only |
- | Restrict to these dashboard ids. |
--concurrency |
4 |
Parallel in-flight requests. |
--timeout |
60 |
Per-request timeout, seconds. |
--json / --markdown |
- | Write the per-component report to a file. |
--strict |
false |
Exit 1 when any component fails. |
--dry-run |
false |
List dashboards and exit. |
--insecure |
false |
Skip TLS verification. |
The exit code is 0 unless the deployment is unreachable or preflight fails. Add
--strict to fail CI on any broken component.
Finding the admin token on Kubernetes
It lives in the backend pod under /app/depictio/.depictio/, at
user.token.access_token. The file is named after the admin account
(<username>_config.yaml), not admin_config.yaml, so glob for
*_config.yaml rather than assuming a fixed name.