Picking a component from the catalog (v1.9.0+)
Add component opens a chooser with two routes:
- New component is the manual stepper: pick a type, connect it to data, configure it yourself. See Dashboard Creation.
- Pick from catalog skips all of it and offers visualizations already built for the tool outputs Depictio found in this project.
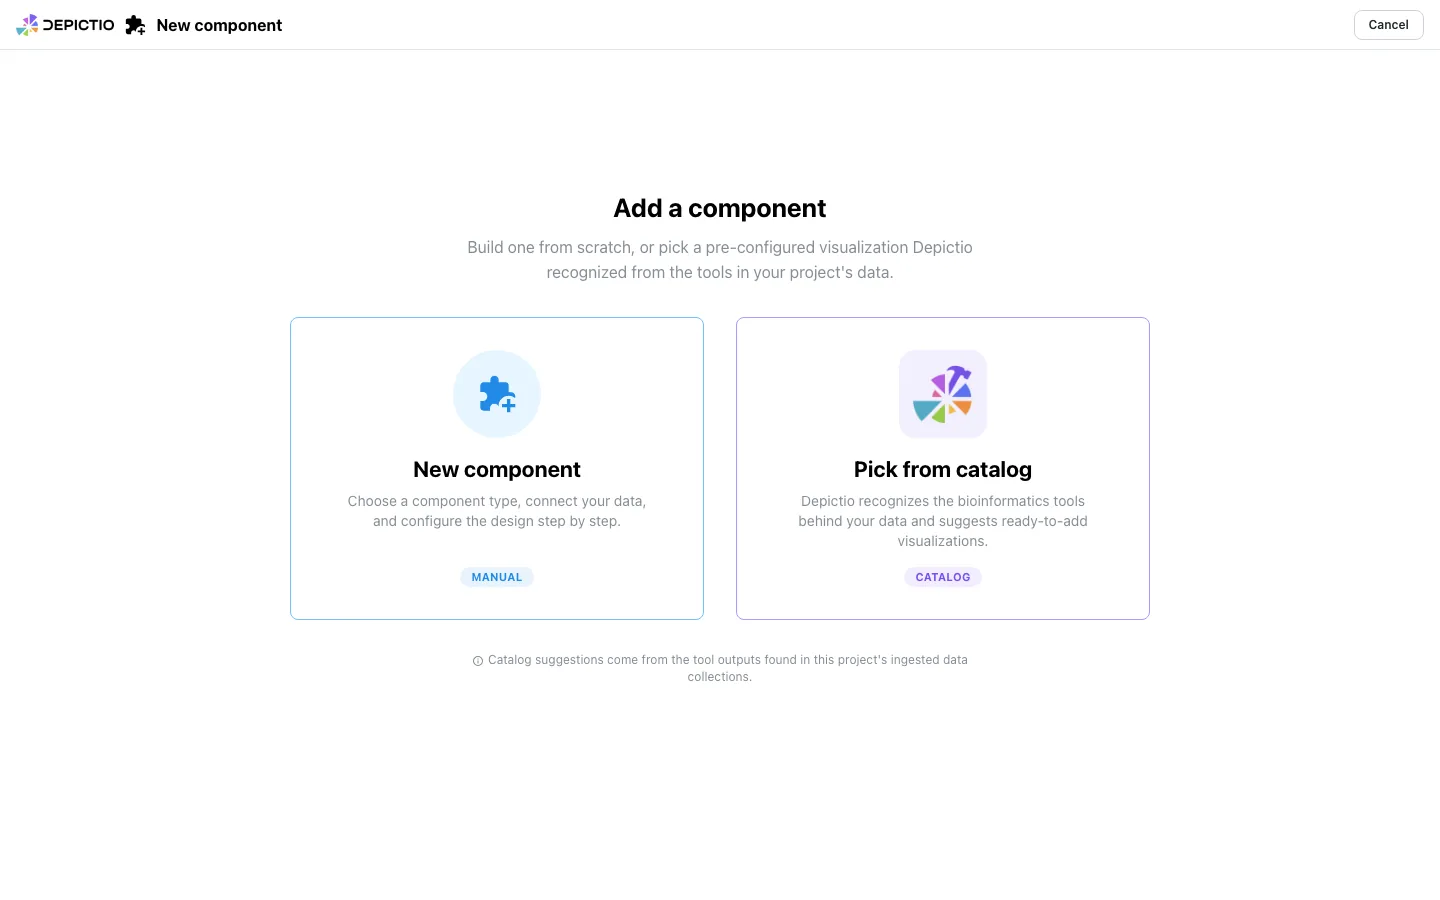
Where the offers come from
Nothing is inferred from the data itself. Every entry in the Tools Catalog declares how to recognise the file and which columns it must carry, and Depictio compares your ingested data collections against those declarations. A project whose outputs match no entry simply has nothing to offer.
Filename
The collection's file matches the name the entry expects, such as *.variants.tsv.
Path glob
The collection's path matches the entry's glob, such as **/ivar/*.tsv. This is how a real pipeline run is recognised.
Recipe
The collection came from a recipe the entry declares. Derived collections carry no raw pipeline path, so neither of the other two can fire.
Any one of the three is enough to surface the tool. The entry's column schema then decides which of its renders are offered, so a render binding a column your file does not carry is never proposed.
MultiQC is a special case
Every multiqc/* output keys the same multiqc.parquet, so offers are
narrowed to the sections the ingested report actually holds, and the
originating tool is named on each one. The General Statistics offer adds
the report's General Statistics table; before v1.16.0 it added the first
plot of another module.
The browser
Offers are grouped by tool on the left, one row per recognised output, with a coloured dot for each component type it can become. Selecting a row previews it on the right.
The preview is the real component, rendered in an iframe at the exact grid box it will occupy, so what you see is what lands on the dashboard.
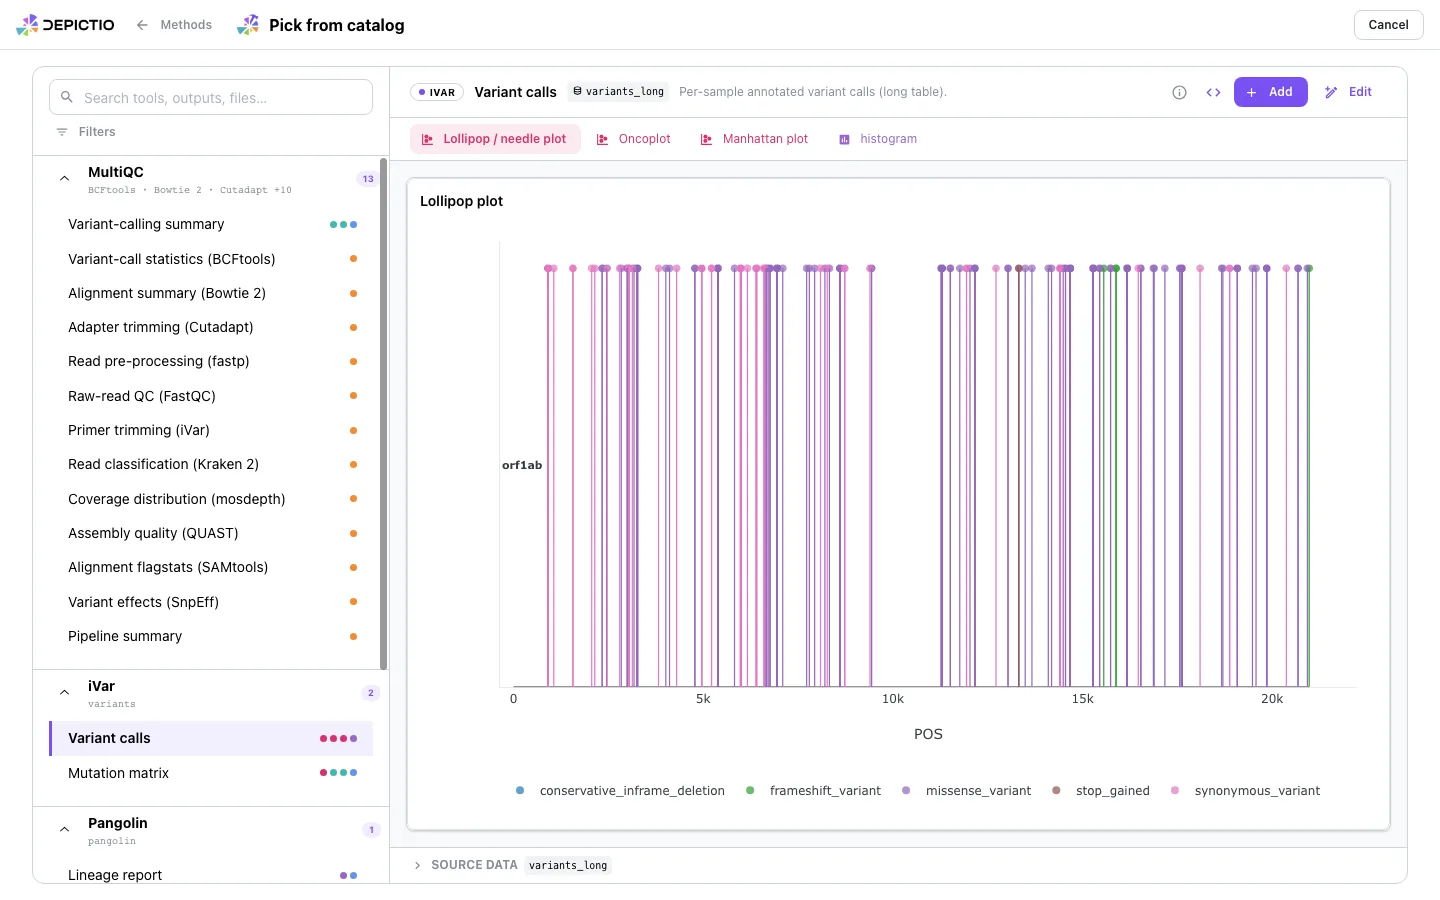
Add saves it straight away. Edit drops it into the Design step first. Browser Back and Forward walk the picker's surfaces rather than leaving the flow.
Narrowing the list
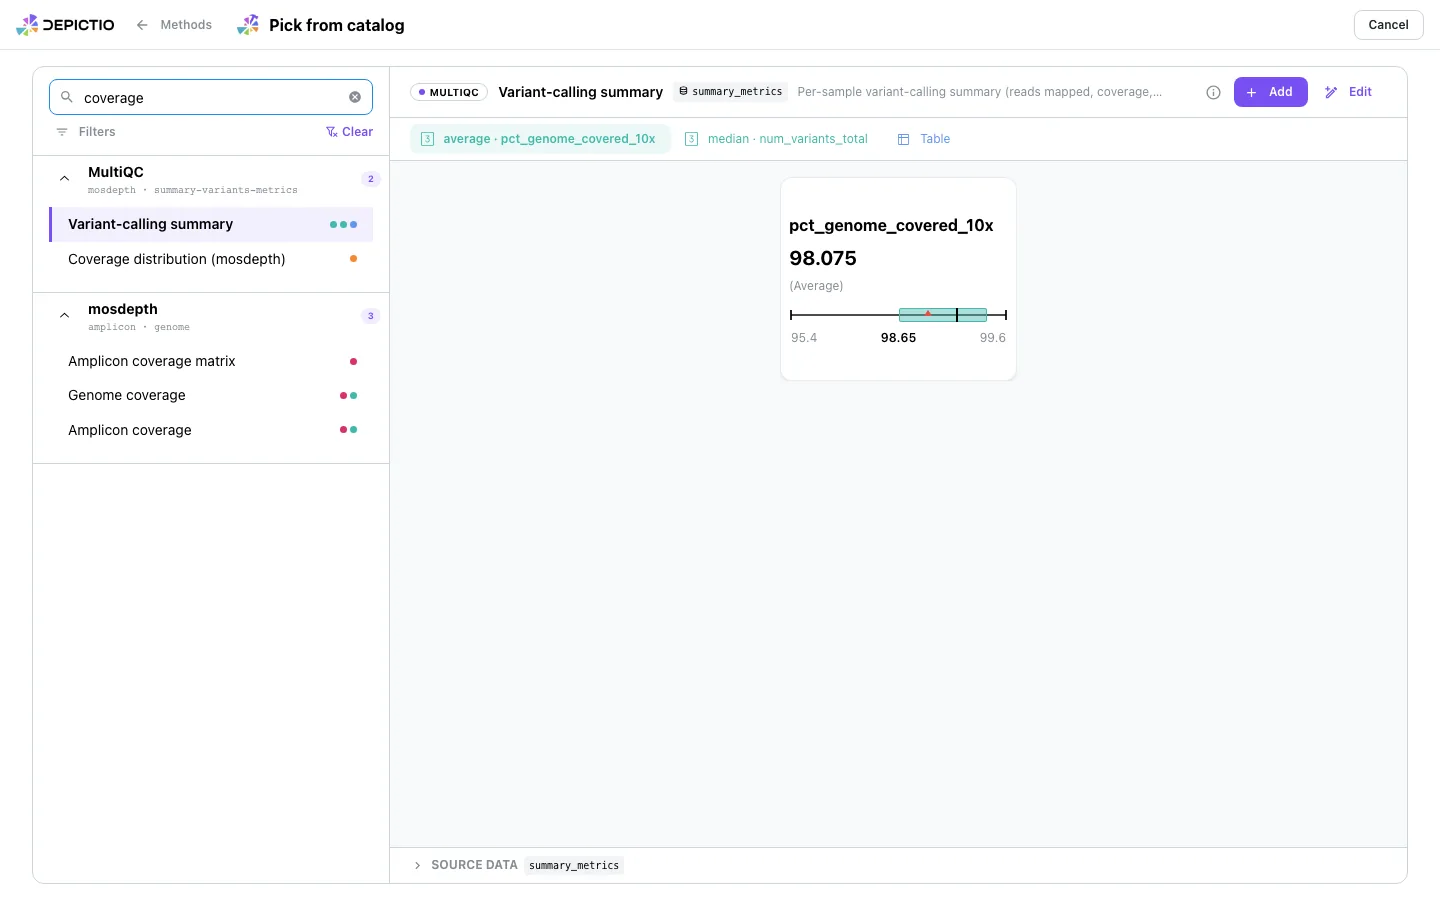
Search matches tool, output, description, file and collection at once, so
coverage finds mosdepth's own outputs and the MultiQC coverage section
together.
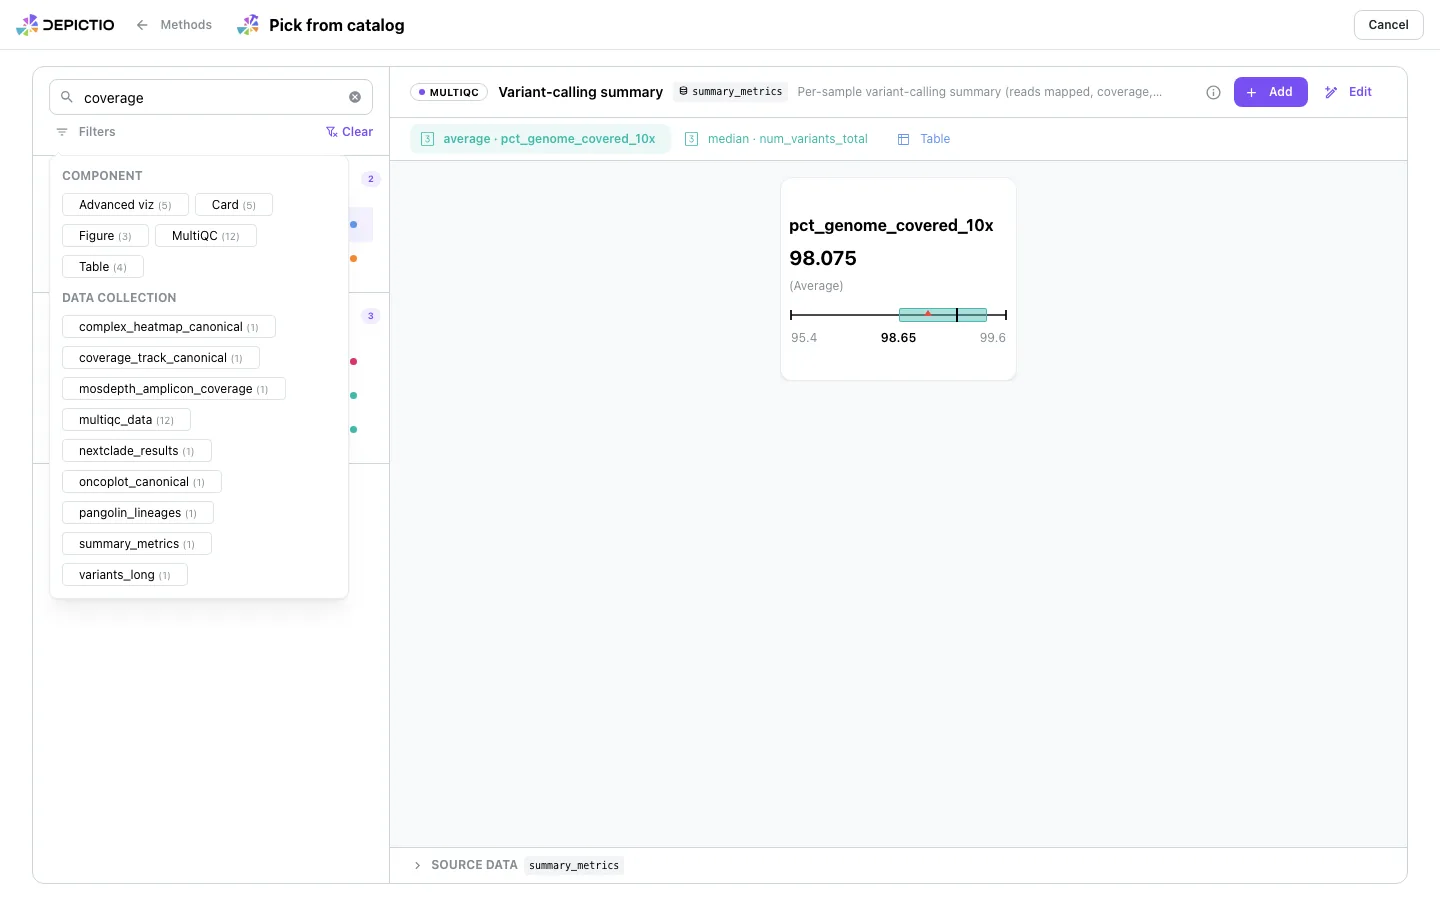
Filters adds two facets with counts, Component and Data collection, computed against the current search rather than the whole catalog. A violet badge on the button says how many are active.
One output, several renders
Most recognised outputs support more than one visualization: iVar's variant calls can be drawn as a lollipop plot, an oncoplot, a Manhattan plot or a histogram. The tab strip switches between them, each render carrying its own configuration and its own grid box.
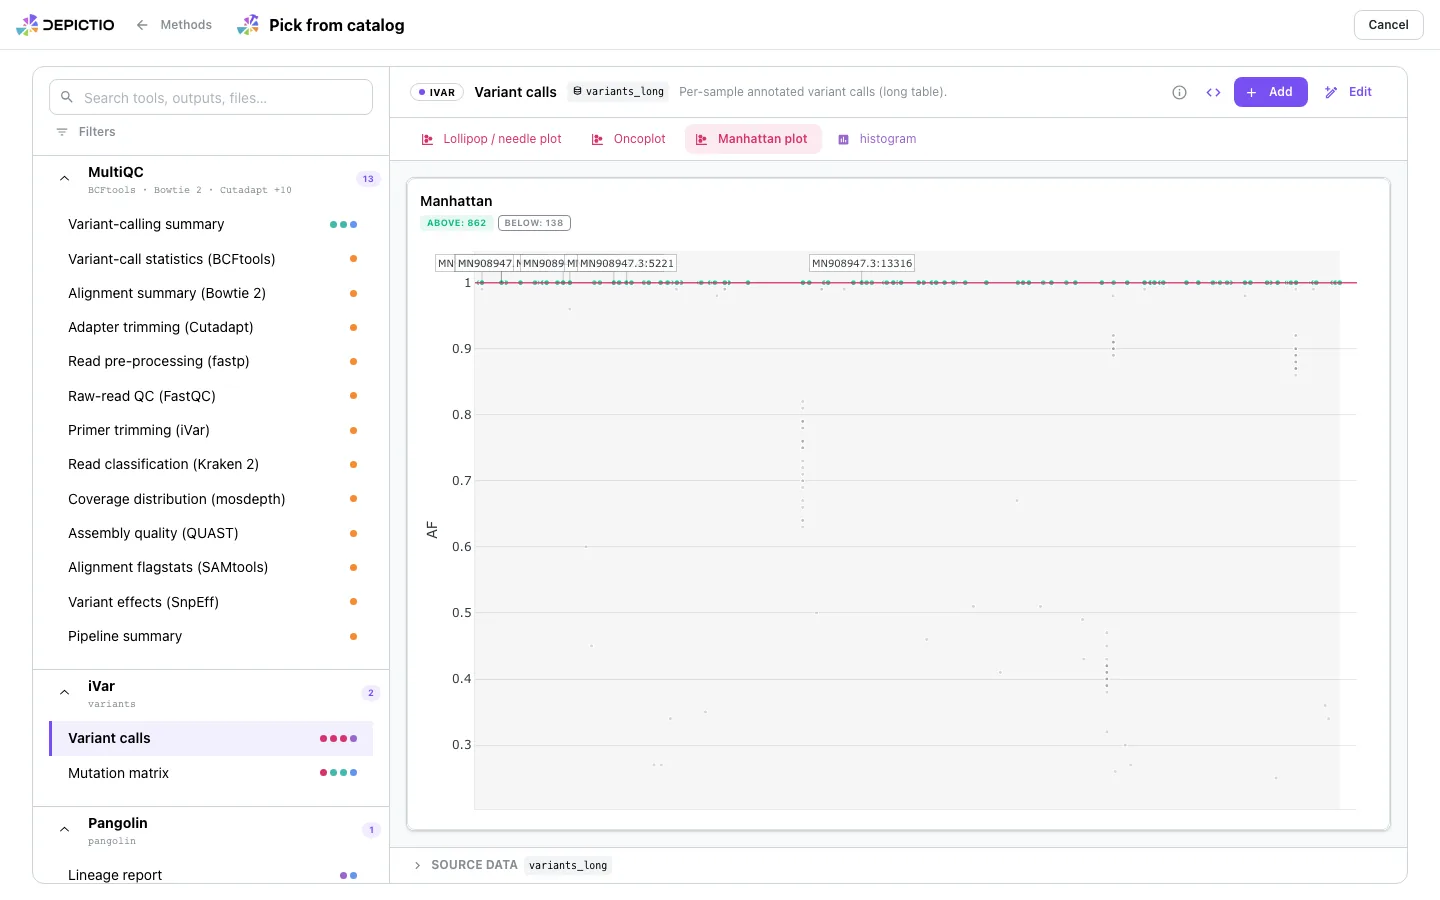
Settings tuned inside the preview travel with the offer, on both the Add and the Edit path.
Provenance
A component added from the catalog says so:
- a copyable
use: <tool>/<render-id>snippet, the same identifier you would write in a project YAML; - a
catalog_sourcestamp carried through later edits and YAML import; - a violet catalog action on the tile, opening a metadata inspector with identity, resolved configuration, data source, catalog origin and raw JSON.
See also
- Tools Catalog to browse every tool and render outside a project
- Dashboard Creation for the manual stepper
- Contributing a Tool to add a tool to the catalog