

The ampliseq template follows a standard nf-core/ampliseq run from reads to differential taxa, one tab per step:
- Overview: the run in four key figures, live findings and four figures, each linked to the tab that explains it
- MultiQC quality control: FastQC read quality and Cutadapt trimming
- Diversity: alpha diversity with rarefaction curves, and the PCoA on Bray-Curtis distances (requires metadata)
- Taxa: composition per group and per sample, the sunburst, the taxa groups share, and the phylogenetic tree
- Differential abundance: ANCOM-BC volcano with MA and QQ views, per contrast (requires metadata +
--ancombc)
Quick start
The results directory is the only thing you have to pass. The samplesheet is picked up
from input/, and pipeline_info/params.json fills in the metadata file the
run was given (--metadata) and the route flags: multi-region, --skip_qiime,
--skip_taxonomy, --skip_alpha_rarefaction, --skip_ancom, and the depth of
the Phylum rank in the taxonomy database.
depictio ingest /path/to/ampliseq_results \
--template nf-core/ampliseq/latest \
--var METADATA_FILE=/path/to/Metadata.tsv \
--var GROUP_COL=habitat
GROUP_COL is the metadata column every grouped tile, the group filter and
the ANCOM-BC contrast read. It defaults to the first annotation column of the
metadata file, so pass it when the factor you care about is another one.
METADATA_ID_COL names the sample-ID column (the first column by default),
and SAMPLESHEET_FILE or TREE_FILE override the auto-detected samplesheet
and Newick tree.
depictio config nextflow --install     # once per machine
nextflow run nf-core/ampliseq -r 2.18.0 -profile docker --outdir results
No ingestion command and no template named: the pipeline ingests its own output directory when it finishes and picks this template from its own name and version. See Nextflow trigger.
Reference
Running without METADATA_FILE prunes the metadata-dependent collections
(see the Conditional routes table); the multi-region, --skip_qiime,
--skip_taxonomy, --skip_alpha_rarefaction and --skip_ancom routes are
auto-detected from the run's params.json.
Self-adapting layout
The dashboard adapts to whatever the run actually produced: components bound to
pruned or unparsed data collections are hidden, tabs left with no real
visualizations are dropped entirely, and the remaining components are re-packed so
there are no empty rows. One template therefore covers 16S/ITS, single- vs.
multi-region (SIDLE), and skip_qiime runs without edits.
Template variables
Variables you provide when running the template: DATA_ROOT is the results directory given to depictio ingest, the others are set with --var NAME=value:
| Variable | Required | Description |
|---|---|---|
DATA_ROOT |
✓ | Root directory containing ampliseq pipeline output (multiqc/, qiime2/) |
SAMPLESHEET_FILE |
— | Path to the ampliseq samplesheet. Auto-detected from {DATA_ROOT}/input/ (CSV or TSV) when omitted. |
TREE_FILE |
— | Path to the Newick tree to serve. Defaults to {DATA_ROOT}/qiime2/phylogenetic_tree/tree.nwk. A run with far more ASVs than a tree renders readably should point this at the output of scripts/prune_newick.py, which cuts the tree to the same taxa the tip-metadata recipe keeps. |
METADATA_FILE |
— | Path to sample metadata TSV (--metadata in ampliseq run). Optional. All non-ID columns become annotations. |
METADATA_ID_COL |
— | Metadata sample-ID column name (links join on it). Auto-detected as the first metadata column; defaults to 'sample'. |
GROUP_COL |
— | Metadata column for grouping/facetting in dashboards. Auto-detected as first annotation column if not provided. |
Auto-detected (set from the run's metadata / params.json; the route flags drive Conditional routes below): PPLACE_TREE_FILE, GROUP_COL_DISPLAY, ANNOTATION_COLS, IS_MULTIREGION, SKIP_TAXONOMY, SKIP_ALPHA_RAREFACTION, SKIP_ANCOM, PHYLUM_LEVEL, CLASS_LEVEL, ORDER_LEVEL, FAMILY_LEVEL, GENUS_LEVEL
Data collections
26 data collections — 11 required 15 optional · 12 direct 14 derived.
Origin tells you whether a collection is real pipeline data or a reshape of it: direct = a pipeline output (scanned, or a recipe that reads raw files); derived = a recipe that reshapes one or more direct collections into the layout a visualization needs (no new measurement). Reads shows what produces it: a recipe .py transform, whose name links to its source on GitHub, or a raw file scanned off disk. (A direct collection can still have a recipe — one that merely parses/cleans the raw file; derived means the recipe reshapes another collection.)
| Tag | Origin | Type | Reads | Status |
|---|---|---|---|---|
multiqc_data |
direct |  MultiQC MultiQC |
file multiqc/multiqc_data/multiqc.parquet |
required |
samplesheet |
direct | Table | file {SAMPLESHEET_FILE} |
required |
metadata |
direct | Table | file {METADATA_FILE} |
optional |
read_tracking |
direct | Table | recipe nf-core/ampliseq/read_tracking.py |
optional |
alpha_rarefaction |
direct | Table | recipe qiime2/alpha_rarefaction.py |
required |
alpha_rarefaction_summary |
derived | Table | recipe qiime2/alpha_rarefaction_summary.py |
optional |
taxonomy_composition |
direct | Table | recipe qiime2/taxonomy_composition.py |
required |
taxonomy_rel_abundance |
derived | Table | recipe nf-core/ampliseq/taxonomy_rel_abundance.py |
required |
sintax_rel_abundance |
derived | Table | recipe vsearch/sintax_abundance.py |
optional |
taxonomy_heatmap |
derived | Table | recipe qiime2/taxonomy_heatmap.py |
required |
ancombc_results |
direct | Table | recipe qiime2/ancombc.py |
optional |
stacked_taxonomy_canonical |
derived | Table | recipe qiime2/stacked_taxonomy_canonical.py |
optional |
embedding_pcoa |
derived | Table | recipe qiime2/embedding_pcoa.py |
required |
rarefaction_canonical |
derived | Table | recipe qiime2/rarefaction_canonical.py |
optional |
alpha_diversity_multi_canonical |
direct | Table | recipe qiime2/alpha_diversity_multi_canonical.py |
optional |
complex_heatmap_canonical |
derived | Table | recipe nf-core/ampliseq/complex_heatmap_canonical.py |
required |
sunburst_canonical |
derived | Table | recipe nf-core/ampliseq/sunburst_canonical.py |
optional |
sankey_canonical |
derived | Table | recipe nf-core/ampliseq/sankey_canonical.py |
optional |
upset_canonical |
derived | Table | recipe nf-core/ampliseq/upset_canonical.py |
required |
ma_canonical |
derived | Table | recipe nf-core/ampliseq/ma_canonical.py |
required |
bray_curtis_canonical |
derived | Table | recipe nf-core/ampliseq/bray_curtis_canonical.py |
required |
beta_adonis |
direct | Table | recipe nf-core/ampliseq/beta_adonis.py |
optional |
phylogenetic_tree_canonical |
direct | phylogeny | file {DATA_ROOT}/qiime2/phylogenetic_tree/tree.nwk |
optional |
phylogenetic_tree_metadata_canonical |
derived | Table | recipe nf-core/ampliseq/tree_metadata_canonical.py |
optional |
sidle_reconstructed |
direct | Table | recipe sidle/reconstructed.py |
optional |
sidle_reconstruction_qc |
direct | Table | recipe sidle/reconstruction_qc.py |
optional |
Conditional routes
Rows are data collections; columns are the variables you set or params.json flags auto-detected from the run. Each filled cell is the effect of setting that variable; an empty cell means that variable leaves the collection unchanged. (5 collections are unaffected by any variable — present on every run.)
+ included− removed⇄ repointed
| Data collection | METADATA_FILE |
SKIP_QIIME |
IS_MULTIREGION |
SKIP_TAXONOMY |
SKIP_ALPHA_RAREFACTION |
SKIP_ANCOM |
PHYLUM_LEVEL |
PPLACE_TREE_FILE |
TREE_FILE |
|---|---|---|---|---|---|---|---|---|---|
metadata |
+ | ||||||||
alpha_rarefaction |
+ | − | − | − | |||||
alpha_rarefaction_summary |
+ | − | − | − | |||||
taxonomy_composition |
− | − | ⇄ | ||||||
taxonomy_rel_abundance |
− | − | − | ⇄ | |||||
sintax_rel_abundance |
+ | ||||||||
taxonomy_heatmap |
− | − | − | ||||||
ancombc_results |
+ | − | − | − | − | ⇄ | |||
stacked_taxonomy_canonical |
− | − | − | ⇄ | |||||
embedding_pcoa |
− | − | − | ||||||
rarefaction_canonical |
− | − | − | ||||||
alpha_diversity_multi_canonical |
− | − | − | ||||||
complex_heatmap_canonical |
− | − | − | ||||||
sunburst_canonical |
− | − | − | ||||||
sankey_canonical |
− | − | − | ||||||
upset_canonical |
+ | − | − | − | |||||
ma_canonical |
+ | − | − | − | − | ||||
bray_curtis_canonical |
− | − | − | ||||||
beta_adonis |
+ | − | − | − | |||||
phylogenetic_tree_canonical |
− | − | ⇄ | ⇄ | |||||
phylogenetic_tree_metadata_canonical |
− | − |
Cross-DC links
23 links — selecting a value in the source collection filters the target. The join column is shown after the source.
| Source · column | Target | Filters | |
|---|---|---|---|
samplesheet · sampleID |
→ | multiqc_data |
Filter MultiQC by samplesheet samples |
metadata · {METADATA_ID_COL} |
→ | multiqc_data |
Filter MultiQC by metadata samples |
samplesheet · sampleID |
→ | read_tracking |
Filter read tracking by samplesheet samples |
metadata · {METADATA_ID_COL} |
→ | read_tracking |
Filter read tracking by metadata samples |
metadata · {METADATA_ID_COL} |
→ | alpha_rarefaction |
Filter alpha rarefaction by metadata samples |
metadata · {METADATA_ID_COL} |
→ | alpha_rarefaction_summary |
Filter the rarefaction summary by metadata samples |
metadata · {METADATA_ID_COL} |
→ | taxonomy_composition |
Filter taxonomy composition by metadata samples |
metadata · {METADATA_ID_COL} |
→ | taxonomy_rel_abundance |
Filter taxonomy rel abundance by metadata samples |
samplesheet · sampleID |
→ | sintax_rel_abundance |
Filter sintax rel abundance by samplesheet samples |
metadata · {METADATA_ID_COL} |
→ | sintax_rel_abundance |
Filter sintax rel abundance by metadata samples |
samplesheet · sampleID |
→ | sidle_reconstructed |
Filter SIDLE reconstructed community by samplesheet samples |
metadata · {METADATA_ID_COL} |
→ | sidle_reconstructed |
Filter SIDLE reconstructed community by metadata samples |
samplesheet · sampleID |
→ | taxonomy_heatmap |
Filter taxonomy heatmap by samplesheet samples |
metadata · {METADATA_ID_COL} |
→ | taxonomy_heatmap |
Filter taxonomy heatmap by metadata samples |
metadata · {METADATA_ID_COL} |
→ | alpha_diversity_multi_canonical |
Filter per-sample multi-metric alpha-diversity by metadata samples |
metadata · {METADATA_ID_COL} |
→ | rarefaction_canonical |
Filter multi-metric rarefaction curves by metadata samples |
alpha_diversity_multi_canonical · sample_id |
→ | rarefaction_canonical |
Filter rarefaction by Alpha Diversity tab sample selection |
metadata · {METADATA_ID_COL} |
→ | stacked_taxonomy_canonical |
Filter stacked-taxonomy bars by metadata samples |
metadata · {METADATA_ID_COL} |
→ | embedding_pcoa |
Filter PCoA embedding by metadata samples |
metadata · {METADATA_ID_COL} |
→ | sunburst_canonical |
Filter sunburst by metadata samples |
metadata · {METADATA_ID_COL} |
→ | sankey_canonical |
Filter sankey flows by metadata samples |
metadata · {METADATA_ID_COL} |
→ | complex_heatmap_canonical |
Filter complex heatmap by metadata samples (best-effort on wide matrix) |
metadata · {METADATA_ID_COL} |
→ | bray_curtis_canonical |
Filter Bray-Curtis distances by metadata samples (best-effort on wide matrix) |
Recipes
Each recipe reshapes raw pipeline output into a tidy table. The name links to its source; Output lists the validated OUTPUT_SCHEMA columns.
| Recipe | Transforms | Output |
|---|---|---|
nf-core/ampliseq/beta_adonis.py |
Collect ampliseq's PERMANOVA (adonis) tables into one row per metric and term. | metric, formula, term, df, sum_of_squares, r2, f_stat, p_value |
nf-core/ampliseq/bray_curtis_canonical.py |
Canonical-schema Bray-Curtis distance DC for ampliseq. | sample |
nf-core/ampliseq/complex_heatmap_canonical.py |
Canonical-schema ComplexHeatmap DC for ampliseq. | Phylum, Kingdom |
nf-core/ampliseq/ma_canonical.py |
Canonical-schema MA-plot DC for ampliseq. | feature_id, avg_log_intensity, log2_fold_change |
nf-core/ampliseq/read_tracking.py |
Tidy ampliseq's overall_summary.tsv into per-sample read counts and the share kept. |
sample, input_reads, denoised_reads, final_reads, kept_percent |
nf-core/ampliseq/sankey_canonical.py |
Canonical-schema Sankey DC for ampliseq. | sample_id, Kingdom, Phylum, abundance |
nf-core/ampliseq/sunburst_canonical.py |
Canonical-schema sunburst DC for ampliseq. | Kingdom, Phylum, abundance |
nf-core/ampliseq/taxonomy_rel_abundance.py |
Transform QIIME2 relative abundance table to long-format per-sample taxonomy table. | sample, taxonomy, rel_abundance, Kingdom, Phylum |
nf-core/ampliseq/tree_metadata_canonical.py |
Tip metadata for the ampliseq phylogenetic tree. | taxon |
nf-core/ampliseq/upset_canonical.py |
Canonical-schema UpSet DC for ampliseq. | taxon |
qiime2/alpha_diversity_multi_canonical.py |
Per-sample multi-metric alpha-diversity DC for ampliseq. | sample_id |
qiime2/alpha_rarefaction.py |
Transform QIIME2 alpha rarefaction wide CSV to long-format rarefaction curves. | sample, depth, iter, faith_pd |
qiime2/alpha_rarefaction_summary.py |
Per-sample rarefaction summary: one row per (sample, depth), not per iteration. | sample, depth, faith_pd |
qiime2/ancombc.py |
Merge ANCOM-BC differential abundance results (5 files) into one long-format table. | id, contrast, lfc, p_val, q_val, w, se, Kingdom, Phylum, neg_log10_qval, significant |
qiime2/embedding_pcoa.py |
Canonical-schema embedding DC for ampliseq (PCoA on Bray-Curtis). | sample_id, dim_1, dim_2 |
qiime2/rarefaction_canonical.py |
Canonical-schema rarefaction DC for ampliseq (multi-metric). | sample_id, depth, iter, shannon, observed_features, faith_pd |
qiime2/stacked_taxonomy_canonical.py |
Canonical-schema stacked-taxonomy DC for ampliseq. | sample_id, taxon, rank, abundance |
qiime2/taxonomy_composition.py |
Transform QIIME2 barplot CSV (wide) to long-format taxonomy composition table. | sample, taxonomy, count, Kingdom, Phylum |
qiime2/taxonomy_heatmap.py |
Pivot relative abundance table to wide-format heatmap matrix. | Phylum, Kingdom |
sidle/reconstructed.py |
Melt the SIDLE cross-region reconstructed feature table to long per-sample taxonomy. | feature_id, sample, count, taxonomy, Kingdom, Phylum, Class, Genus |
sidle/reconstruction_qc.py |
Per-reconstructed-feature SIDLE reconstruction confidence. | feature_id, num_regions, total_kmers_mapped, mean_kmer_per_region, stdv_kmer_per_region, mapped_asvs |
vsearch/sintax_abundance.py |
Per-sample Phylum-level relative abundance from a SINTAX classification. | sample, taxonomy, rel_abundance, Kingdom, Phylum |
Template variables
Variables you provide when running the template: DATA_ROOT is the results directory given to depictio ingest, the others are set with --var NAME=value:
| Variable | Required | Description |
|---|---|---|
DATA_ROOT |
✓ | Root directory containing ampliseq pipeline output (multiqc/, qiime2/) |
SAMPLESHEET_FILE |
— | Path to the ampliseq samplesheet. Auto-detected from {DATA_ROOT}/input/ (CSV or TSV) when omitted. |
TREE_FILE |
— | Path to the Newick tree to serve. Defaults to {DATA_ROOT}/qiime2/phylogenetic_tree/tree.nwk. A run with far more ASVs than a tree renders readably should point this at the output of scripts/prune_newick.py, which cuts the tree to the same taxa the tip-metadata recipe keeps. |
METADATA_FILE |
— | Path to sample metadata TSV (--metadata in ampliseq run). Optional. All non-ID columns become annotations. |
METADATA_ID_COL |
— | Metadata sample-ID column name (links join on it). Auto-detected as the first metadata column; defaults to 'sample'. |
GROUP_COL |
— | Metadata column for grouping/facetting in dashboards. Auto-detected as first annotation column if not provided. |
Auto-detected (set from the run's metadata / params.json; the route flags drive Conditional routes below): GROUP_COL_DISPLAY, ANNOTATION_COLS, IS_MULTIREGION, SKIP_TAXONOMY, SKIP_ALPHA_RAREFACTION, SKIP_ANCOM
Data collections
24 data collections — 11 required 13 optional · 10 direct 14 derived.
Origin tells you whether a collection is real pipeline data or a reshape of it: direct = a pipeline output (scanned, or a recipe that reads raw files); derived = a recipe that reshapes one or more direct collections into the layout a visualization needs (no new measurement). Reads shows what produces it: a recipe .py transform, whose name links to its source on GitHub, or a raw file scanned off disk. (A direct collection can still have a recipe — one that merely parses/cleans the raw file; derived means the recipe reshapes another collection.)
| Tag | Origin | Type | Reads | Status |
|---|---|---|---|---|
multiqc_data |
direct | MultiQC |
file multiqc/multiqc_data/multiqc.parquet |
required |
samplesheet |
direct | Table | file {SAMPLESHEET_FILE} |
required |
metadata |
direct | Table | file {METADATA_FILE} |
optional |
alpha_rarefaction |
direct | Table | recipe qiime2/alpha_rarefaction.py |
required |
alpha_rarefaction_summary |
derived | Table | recipe qiime2/alpha_rarefaction_summary.py |
optional |
taxonomy_composition |
direct | Table | recipe qiime2/taxonomy_composition.py |
required |
taxonomy_rel_abundance |
derived | Table | recipe nf-core/ampliseq/taxonomy_rel_abundance.py |
required |
sintax_rel_abundance |
derived | Table | recipe vsearch/sintax_abundance.py |
optional |
taxonomy_heatmap |
derived | Table | recipe qiime2/taxonomy_heatmap.py |
required |
ancombc_results |
direct | Table | recipe qiime2/ancombc.py |
optional |
stacked_taxonomy_canonical |
derived | Table | recipe qiime2/stacked_taxonomy_canonical.py |
optional |
embedding_pcoa |
derived | Table | recipe qiime2/embedding_pcoa.py |
required |
rarefaction_canonical |
derived | Table | recipe qiime2/rarefaction_canonical.py |
optional |
alpha_diversity_multi_canonical |
direct | Table | recipe qiime2/alpha_diversity_multi_canonical.py |
optional |
complex_heatmap_canonical |
derived | Table | recipe nf-core/ampliseq/complex_heatmap_canonical.py |
required |
sunburst_canonical |
derived | Table | recipe nf-core/ampliseq/sunburst_canonical.py |
optional |
sankey_canonical |
derived | Table | recipe nf-core/ampliseq/sankey_canonical.py |
optional |
upset_canonical |
derived | Table | recipe nf-core/ampliseq/upset_canonical.py |
required |
ma_canonical |
derived | Table | recipe nf-core/ampliseq/ma_canonical.py |
required |
bray_curtis_canonical |
derived | Table | recipe nf-core/ampliseq/bray_curtis_canonical.py |
required |
phylogenetic_tree_canonical |
direct | phylogeny | file {DATA_ROOT}/qiime2/phylogenetic_tree/tree.nwk |
optional |
phylogenetic_tree_metadata_canonical |
derived | Table | recipe nf-core/ampliseq/tree_metadata_canonical.py |
optional |
sidle_reconstructed |
direct | Table | recipe sidle/reconstructed.py |
optional |
sidle_reconstruction_qc |
direct | Table | recipe sidle/reconstruction_qc.py |
optional |
Conditional routes
Rows are data collections; columns are the variables you set or params.json flags auto-detected from the run. Each filled cell is the effect of setting that variable; an empty cell means that variable leaves the collection unchanged. (4 collections are unaffected by any variable — present on every run.)
+ included− removed⇄ repointed
| Data collection | METADATA_FILE |
SKIP_QIIME |
IS_MULTIREGION |
SKIP_TAXONOMY |
SKIP_ALPHA_RAREFACTION |
SKIP_ANCOM |
TREE_FILE |
|---|---|---|---|---|---|---|---|
metadata |
+ | ||||||
alpha_rarefaction |
+ | − | − | − | |||
alpha_rarefaction_summary |
+ | − | − | − | |||
taxonomy_composition |
− | − | |||||
taxonomy_rel_abundance |
− | − | − | ||||
sintax_rel_abundance |
+ | ||||||
taxonomy_heatmap |
− | − | − | ||||
ancombc_results |
+ | − | − | − | − | ||
stacked_taxonomy_canonical |
− | − | − | ||||
embedding_pcoa |
− | − | − | ||||
rarefaction_canonical |
− | − | − | ||||
alpha_diversity_multi_canonical |
− | − | − | ||||
complex_heatmap_canonical |
− | − | − | ||||
sunburst_canonical |
− | − | − | ||||
sankey_canonical |
− | − | − | ||||
upset_canonical |
+ | − | − | − | |||
ma_canonical |
+ | − | − | − | − | ||
bray_curtis_canonical |
− | − | − | ||||
phylogenetic_tree_canonical |
− | − | ⇄ | ||||
phylogenetic_tree_metadata_canonical |
− | − |
Cross-DC links
19 links — selecting a value in the source collection filters the target. The join column is shown after the source.
| Source · column | Target | Filters | |
|---|---|---|---|
samplesheet · sampleID |
→ | multiqc_data |
Filter MultiQC by samplesheet samples |
metadata · {METADATA_ID_COL} |
→ | multiqc_data |
Filter MultiQC by metadata samples |
metadata · {METADATA_ID_COL} |
→ | alpha_rarefaction |
Filter alpha rarefaction by metadata samples |
metadata · {METADATA_ID_COL} |
→ | alpha_rarefaction_summary |
Filter the rarefaction summary by metadata samples |
metadata · {METADATA_ID_COL} |
→ | taxonomy_composition |
Filter taxonomy composition by metadata samples |
metadata · {METADATA_ID_COL} |
→ | taxonomy_rel_abundance |
Filter taxonomy rel abundance by metadata samples |
samplesheet · sampleID |
→ | sintax_rel_abundance |
Filter sintax rel abundance by samplesheet samples |
metadata · {METADATA_ID_COL} |
→ | sintax_rel_abundance |
Filter sintax rel abundance by metadata samples |
samplesheet · sampleID |
→ | taxonomy_heatmap |
Filter taxonomy heatmap by samplesheet samples |
metadata · {METADATA_ID_COL} |
→ | taxonomy_heatmap |
Filter taxonomy heatmap by metadata samples |
metadata · {METADATA_ID_COL} |
→ | alpha_diversity_multi_canonical |
Filter per-sample multi-metric alpha-diversity by metadata samples |
metadata · {METADATA_ID_COL} |
→ | rarefaction_canonical |
Filter multi-metric rarefaction curves by metadata samples |
alpha_diversity_multi_canonical · sample_id |
→ | rarefaction_canonical |
Filter rarefaction by Alpha Diversity tab sample selection |
metadata · {METADATA_ID_COL} |
→ | stacked_taxonomy_canonical |
Filter stacked-taxonomy bars by metadata samples |
metadata · {METADATA_ID_COL} |
→ | embedding_pcoa |
Filter PCoA embedding by metadata samples |
metadata · {METADATA_ID_COL} |
→ | sunburst_canonical |
Filter sunburst by metadata samples |
metadata · {METADATA_ID_COL} |
→ | sankey_canonical |
Filter sankey flows by metadata samples |
metadata · {METADATA_ID_COL} |
→ | complex_heatmap_canonical |
Filter complex heatmap by metadata samples (best-effort on wide matrix) |
metadata · {METADATA_ID_COL} |
→ | bray_curtis_canonical |
Filter Bray-Curtis distances by metadata samples (best-effort on wide matrix) |
Recipes
Each recipe reshapes raw pipeline output into a tidy table. The name links to its source; Output lists the validated OUTPUT_SCHEMA columns.
| Recipe | Transforms | Output |
|---|---|---|
nf-core/ampliseq/bray_curtis_canonical.py |
Canonical-schema Bray-Curtis distance DC for ampliseq. | sample |
nf-core/ampliseq/complex_heatmap_canonical.py |
Canonical-schema ComplexHeatmap DC for ampliseq. | Phylum, Kingdom |
nf-core/ampliseq/ma_canonical.py |
Canonical-schema MA-plot DC for ampliseq. | feature_id, avg_log_intensity, log2_fold_change |
nf-core/ampliseq/sankey_canonical.py |
Canonical-schema Sankey DC for ampliseq. | sample_id, Kingdom, Phylum, abundance |
nf-core/ampliseq/sunburst_canonical.py |
Canonical-schema sunburst DC for ampliseq. | Kingdom, Phylum, abundance |
nf-core/ampliseq/taxonomy_rel_abundance.py |
Transform QIIME2 relative abundance table to long-format per-sample taxonomy table. | sample, taxonomy, rel_abundance, Kingdom, Phylum |
nf-core/ampliseq/tree_metadata_canonical.py |
Tip metadata for the ampliseq phylogenetic tree. | taxon |
nf-core/ampliseq/upset_canonical.py |
Canonical-schema UpSet DC for ampliseq. | taxon |
qiime2/alpha_diversity_multi_canonical.py |
Per-sample multi-metric alpha-diversity DC for ampliseq. | sample_id |
qiime2/alpha_rarefaction.py |
Transform QIIME2 alpha rarefaction wide CSV to long-format rarefaction curves. | sample, depth, iter, faith_pd |
qiime2/alpha_rarefaction_summary.py |
Per-sample rarefaction summary: one row per (sample, depth), not per iteration. | sample, depth, faith_pd |
qiime2/ancombc.py |
Merge ANCOM-BC differential abundance results (5 files) into one long-format table. | id, contrast, lfc, p_val, q_val, w, se, Kingdom, Phylum, neg_log10_qval, significant |
qiime2/embedding_pcoa.py |
Canonical-schema embedding DC for ampliseq (PCoA on Bray-Curtis). | sample_id, dim_1, dim_2 |
qiime2/rarefaction_canonical.py |
Canonical-schema rarefaction DC for ampliseq (multi-metric). | sample_id, depth, iter, shannon, observed_features, faith_pd |
qiime2/stacked_taxonomy_canonical.py |
Canonical-schema stacked-taxonomy DC for ampliseq. | sample_id, taxon, rank, abundance |
qiime2/taxonomy_composition.py |
Transform QIIME2 barplot CSV (wide) to long-format taxonomy composition table. | sample, taxonomy, count, Kingdom, Phylum |
qiime2/taxonomy_heatmap.py |
Pivot relative abundance table to wide-format heatmap matrix. | Phylum, Kingdom |
sidle/reconstructed.py |
Melt the SIDLE cross-region reconstructed feature table to long per-sample taxonomy. | feature_id, sample, count, taxonomy, Kingdom, Phylum, Class, Genus |
sidle/reconstruction_qc.py |
Per-reconstructed-feature SIDLE reconstruction confidence. | feature_id, num_regions, total_kmers_mapped, mean_kmer_per_region, stdv_kmer_per_region, mapped_asvs |
vsearch/sintax_abundance.py |
Per-sample Phylum-level relative abundance from a SINTAX classification. | sample, taxonomy, rel_abundance, Kingdom, Phylum |
Template variables
Variables you provide when running the template: DATA_ROOT is the results directory given to depictio ingest, the others are set with --var NAME=value:
| Variable | Required | Description |
|---|---|---|
DATA_ROOT |
✓ | Root directory containing ampliseq pipeline output (multiqc/, qiime2/) |
SAMPLESHEET_FILE |
✓ | Path to ampliseq samplesheet CSV (always produced by the pipeline) |
METADATA_FILE |
— | Path to sample metadata TSV (--metadata in ampliseq run). Optional. |
Data collections
8 data collections — 7 required 1 optional · 7 direct 1 derived.
Origin tells you whether a collection is real pipeline data or a reshape of it: direct = a pipeline output (scanned, or a recipe that reads raw files); derived = a recipe that reshapes one or more direct collections into the layout a visualization needs (no new measurement). Reads shows what produces it: a recipe .py transform, whose name links to its source on GitHub, or a raw file scanned off disk. (A direct collection can still have a recipe — one that merely parses/cleans the raw file; derived means the recipe reshapes another collection.)
| Tag | Origin | Type | Reads | Status |
|---|---|---|---|---|
multiqc_data |
direct | MultiQC |
file multiqc/multiqc_data/multiqc.parquet |
required |
samplesheet |
direct | Table | file {SAMPLESHEET_FILE} |
required |
metadata |
direct | Table | file {METADATA_FILE} |
optional |
alpha_diversity |
direct | Table | recipe nf-core/ampliseq/alpha_diversity.py |
required |
alpha_rarefaction |
direct | Table | recipe qiime2/alpha_rarefaction.py |
required |
taxonomy_composition |
direct | Table | recipe qiime2/taxonomy_composition.py |
required |
taxonomy_rel_abundance |
derived | Table | recipe nf-core/ampliseq/taxonomy_rel_abundance.py |
required |
ancombc_results |
direct | Table | recipe qiime2/ancombc.py |
required |
Conditional routes
Rows are data collections; columns are the variables you set or params.json flags auto-detected from the run. Each filled cell is the effect of setting that variable; an empty cell means that variable leaves the collection unchanged. (6 collections are unaffected by any variable — present on every run.)
+ included− removed⇄ repointed
| Data collection | METADATA_FILE |
|---|---|
metadata |
+ |
ancombc_results |
+ |
Cross-DC links
6 links — selecting a value in the source collection filters the target. The join column is shown after the source.
| Source · column | Target | Filters | |
|---|---|---|---|
samplesheet · sampleID |
→ | multiqc_data |
Filter MultiQC by samplesheet samples |
metadata · sample |
→ | multiqc_data |
Filter MultiQC by metadata samples (habitat / date selections) |
metadata · sample |
→ | alpha_diversity |
Filter alpha diversity by metadata samples |
metadata · sample |
→ | alpha_rarefaction |
Filter alpha rarefaction by metadata samples |
metadata · sample |
→ | taxonomy_composition |
Filter taxonomy composition by metadata samples |
metadata · sample |
→ | taxonomy_rel_abundance |
Filter taxonomy rel abundance by metadata samples |
Recipes
Each recipe reshapes raw pipeline output into a tidy table. The name links to its source; Output lists the validated OUTPUT_SCHEMA columns.
| Recipe | Transforms | Output |
|---|---|---|
nf-core/ampliseq/alpha_diversity.py |
Transform QIIME2 alpha diversity vector to per-sample Faith PD table. | sample, faith_pd |
nf-core/ampliseq/taxonomy_rel_abundance.py |
Transform QIIME2 relative abundance table to long-format per-sample taxonomy table. | sample, taxonomy, rel_abundance, habitat, Kingdom, Phylum |
qiime2/alpha_rarefaction.py |
Transform QIIME2 alpha rarefaction wide CSV to long-format rarefaction curves. | sample, depth, iter, faith_pd |
qiime2/ancombc.py |
Merge ANCOM-BC differential abundance results (5 files) into one long-format table. | id, contrast, lfc, p_val, q_val, w, se, Kingdom, Phylum, neg_log10_qval, significant |
qiime2/taxonomy_composition.py |
Transform QIIME2 barplot CSV (wide) to long-format taxonomy composition table. | sample, taxonomy, count, Kingdom, Phylum |
Dashboard tabs
One dashboard: the Overview, then seven child tabs in three groups, read as a funnel from the run to the taxa that differ between groups. Each tab below carries the same icon and colour the dashboard gives it, so the page and the app read alike.
| Group | Tabs |
|---|---|
| Data & QC | MultiQC |
| Diversity | Alpha Diversity, Ordination & Clustering |
| Taxa | Community & Diversity, Differential Abundance, Phylogeny, SIDLE |
Each child tab opens with a short intro and a strip of four cards, then at most
three open sections; tables and details follow, collapsed. The persistent Sample
filters (your grouping column, then the sample id) sit in the left panel and narrow
every tab through cross-DC links on the metadata sample column, see
Cross-DC links. The Sample sheet is pinned, collapsed, to the
bottom of every child tab.
Where a tab names your grouping column, that is whichever metadata column the run was resolved against; the dashboard substitutes its real name everywhere.
Amplicon communities, from reads to the taxa that differ between groups.
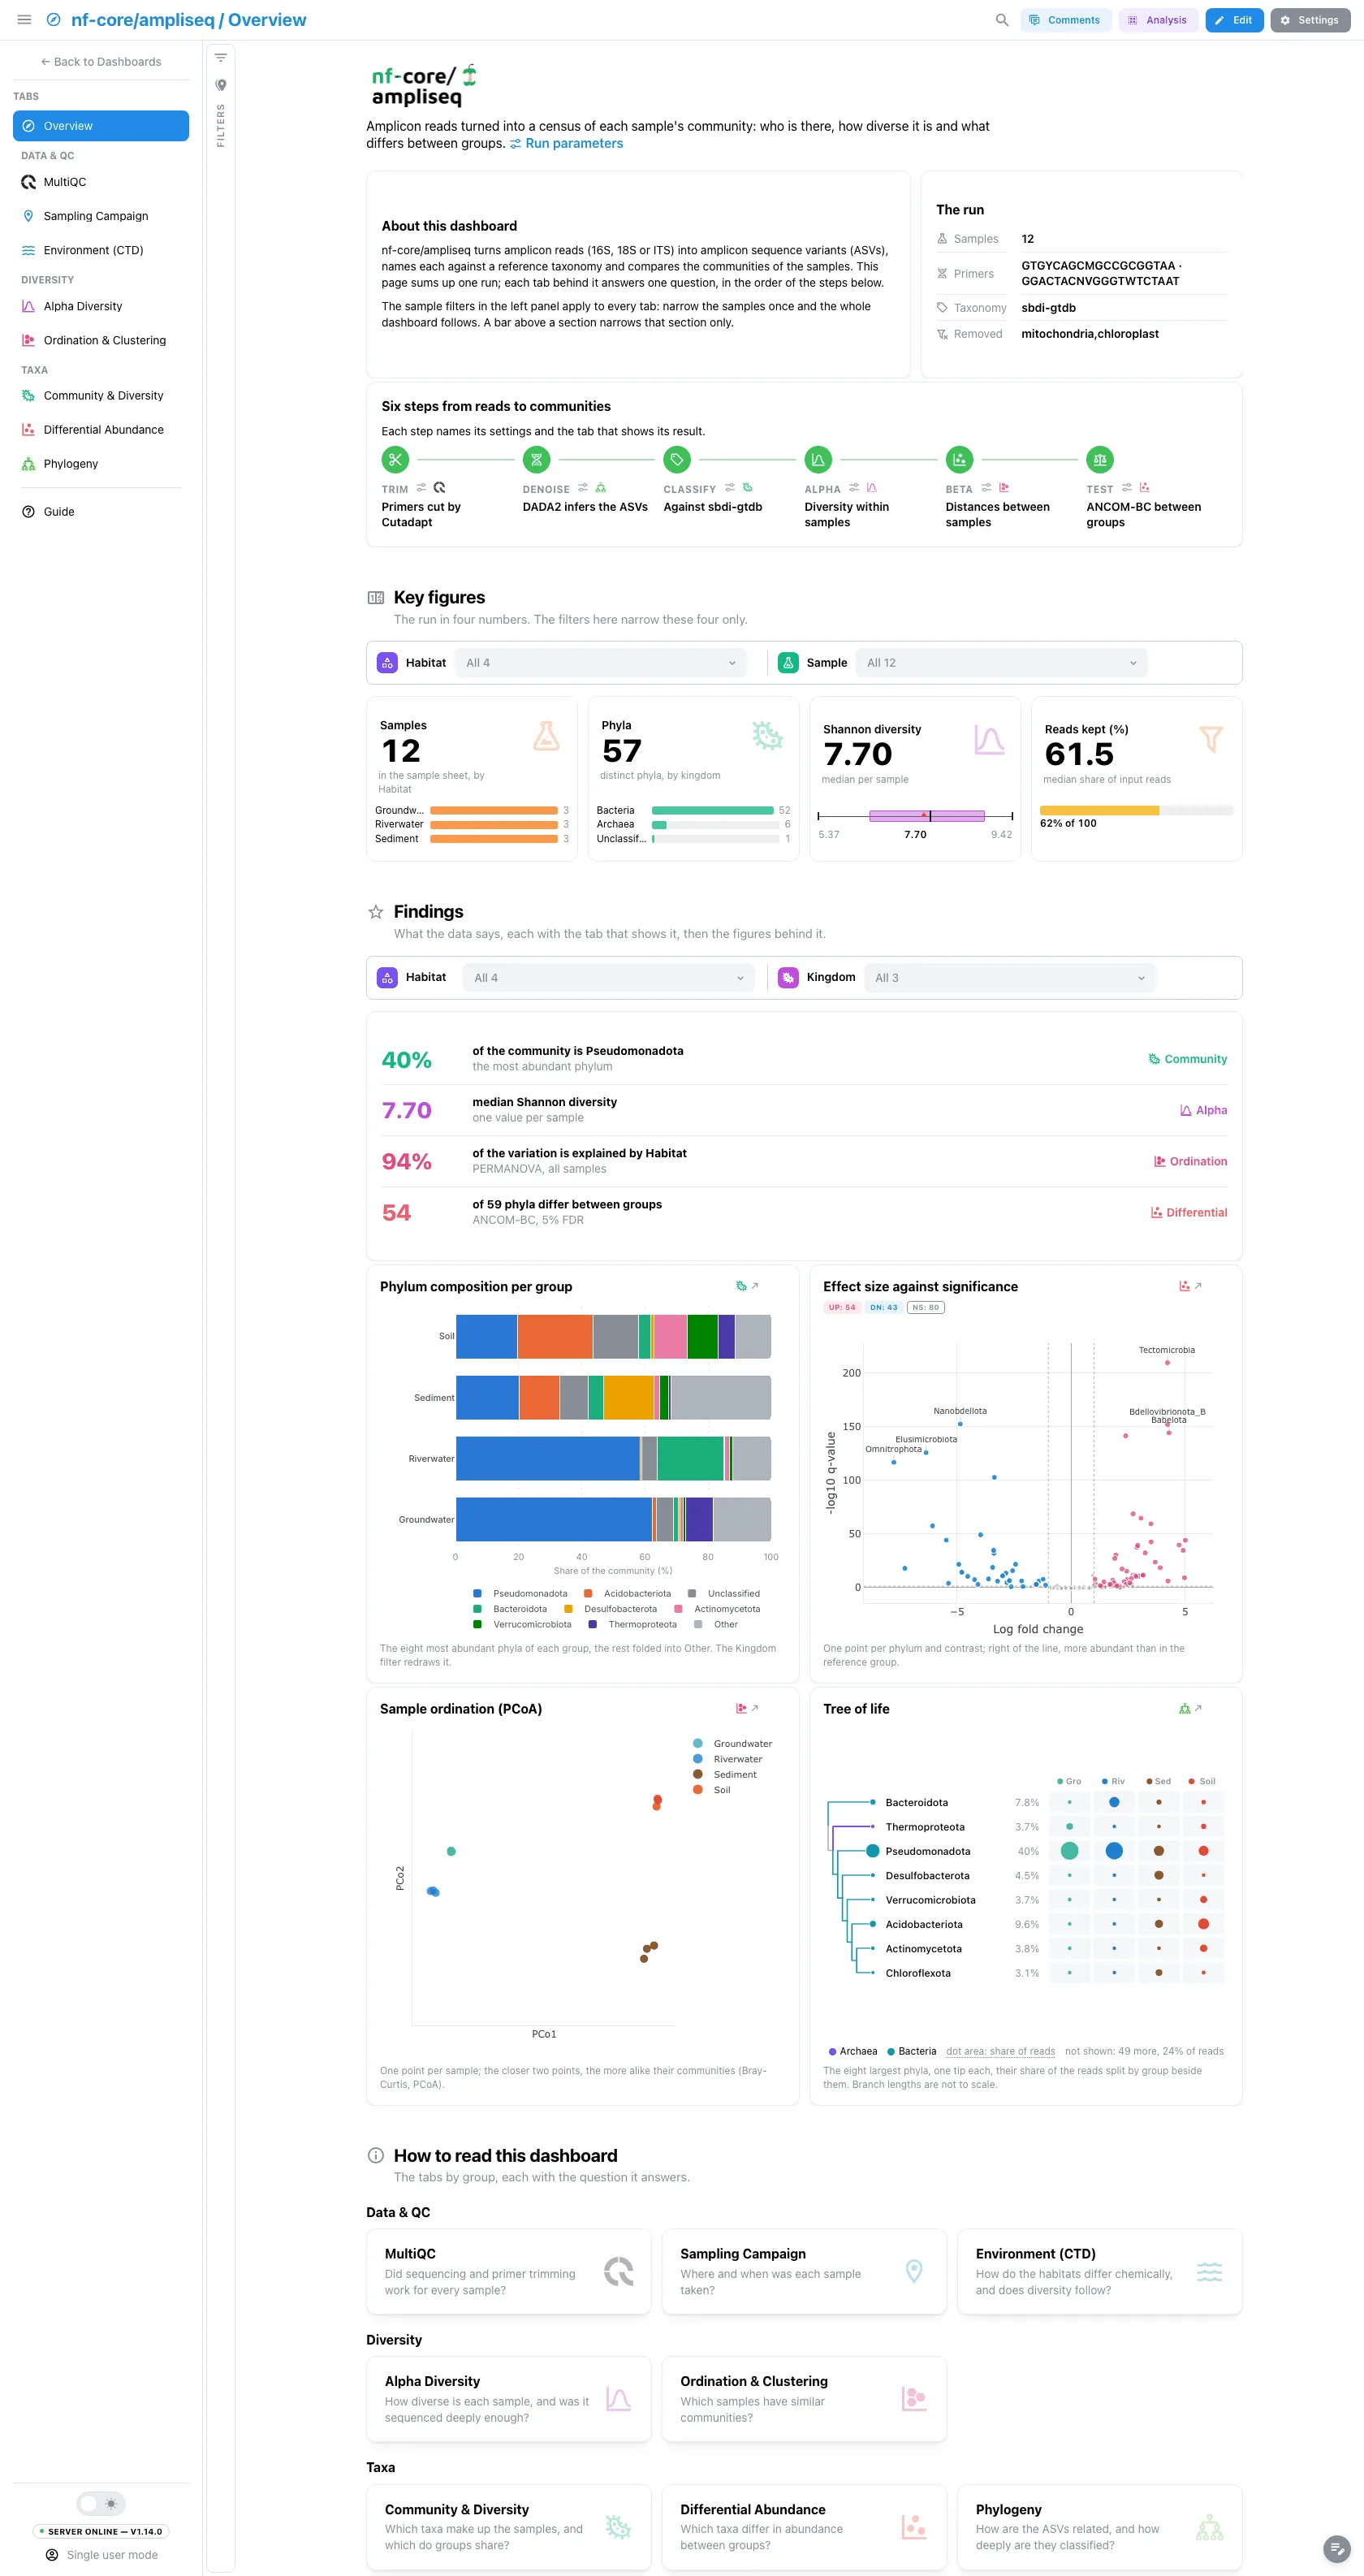
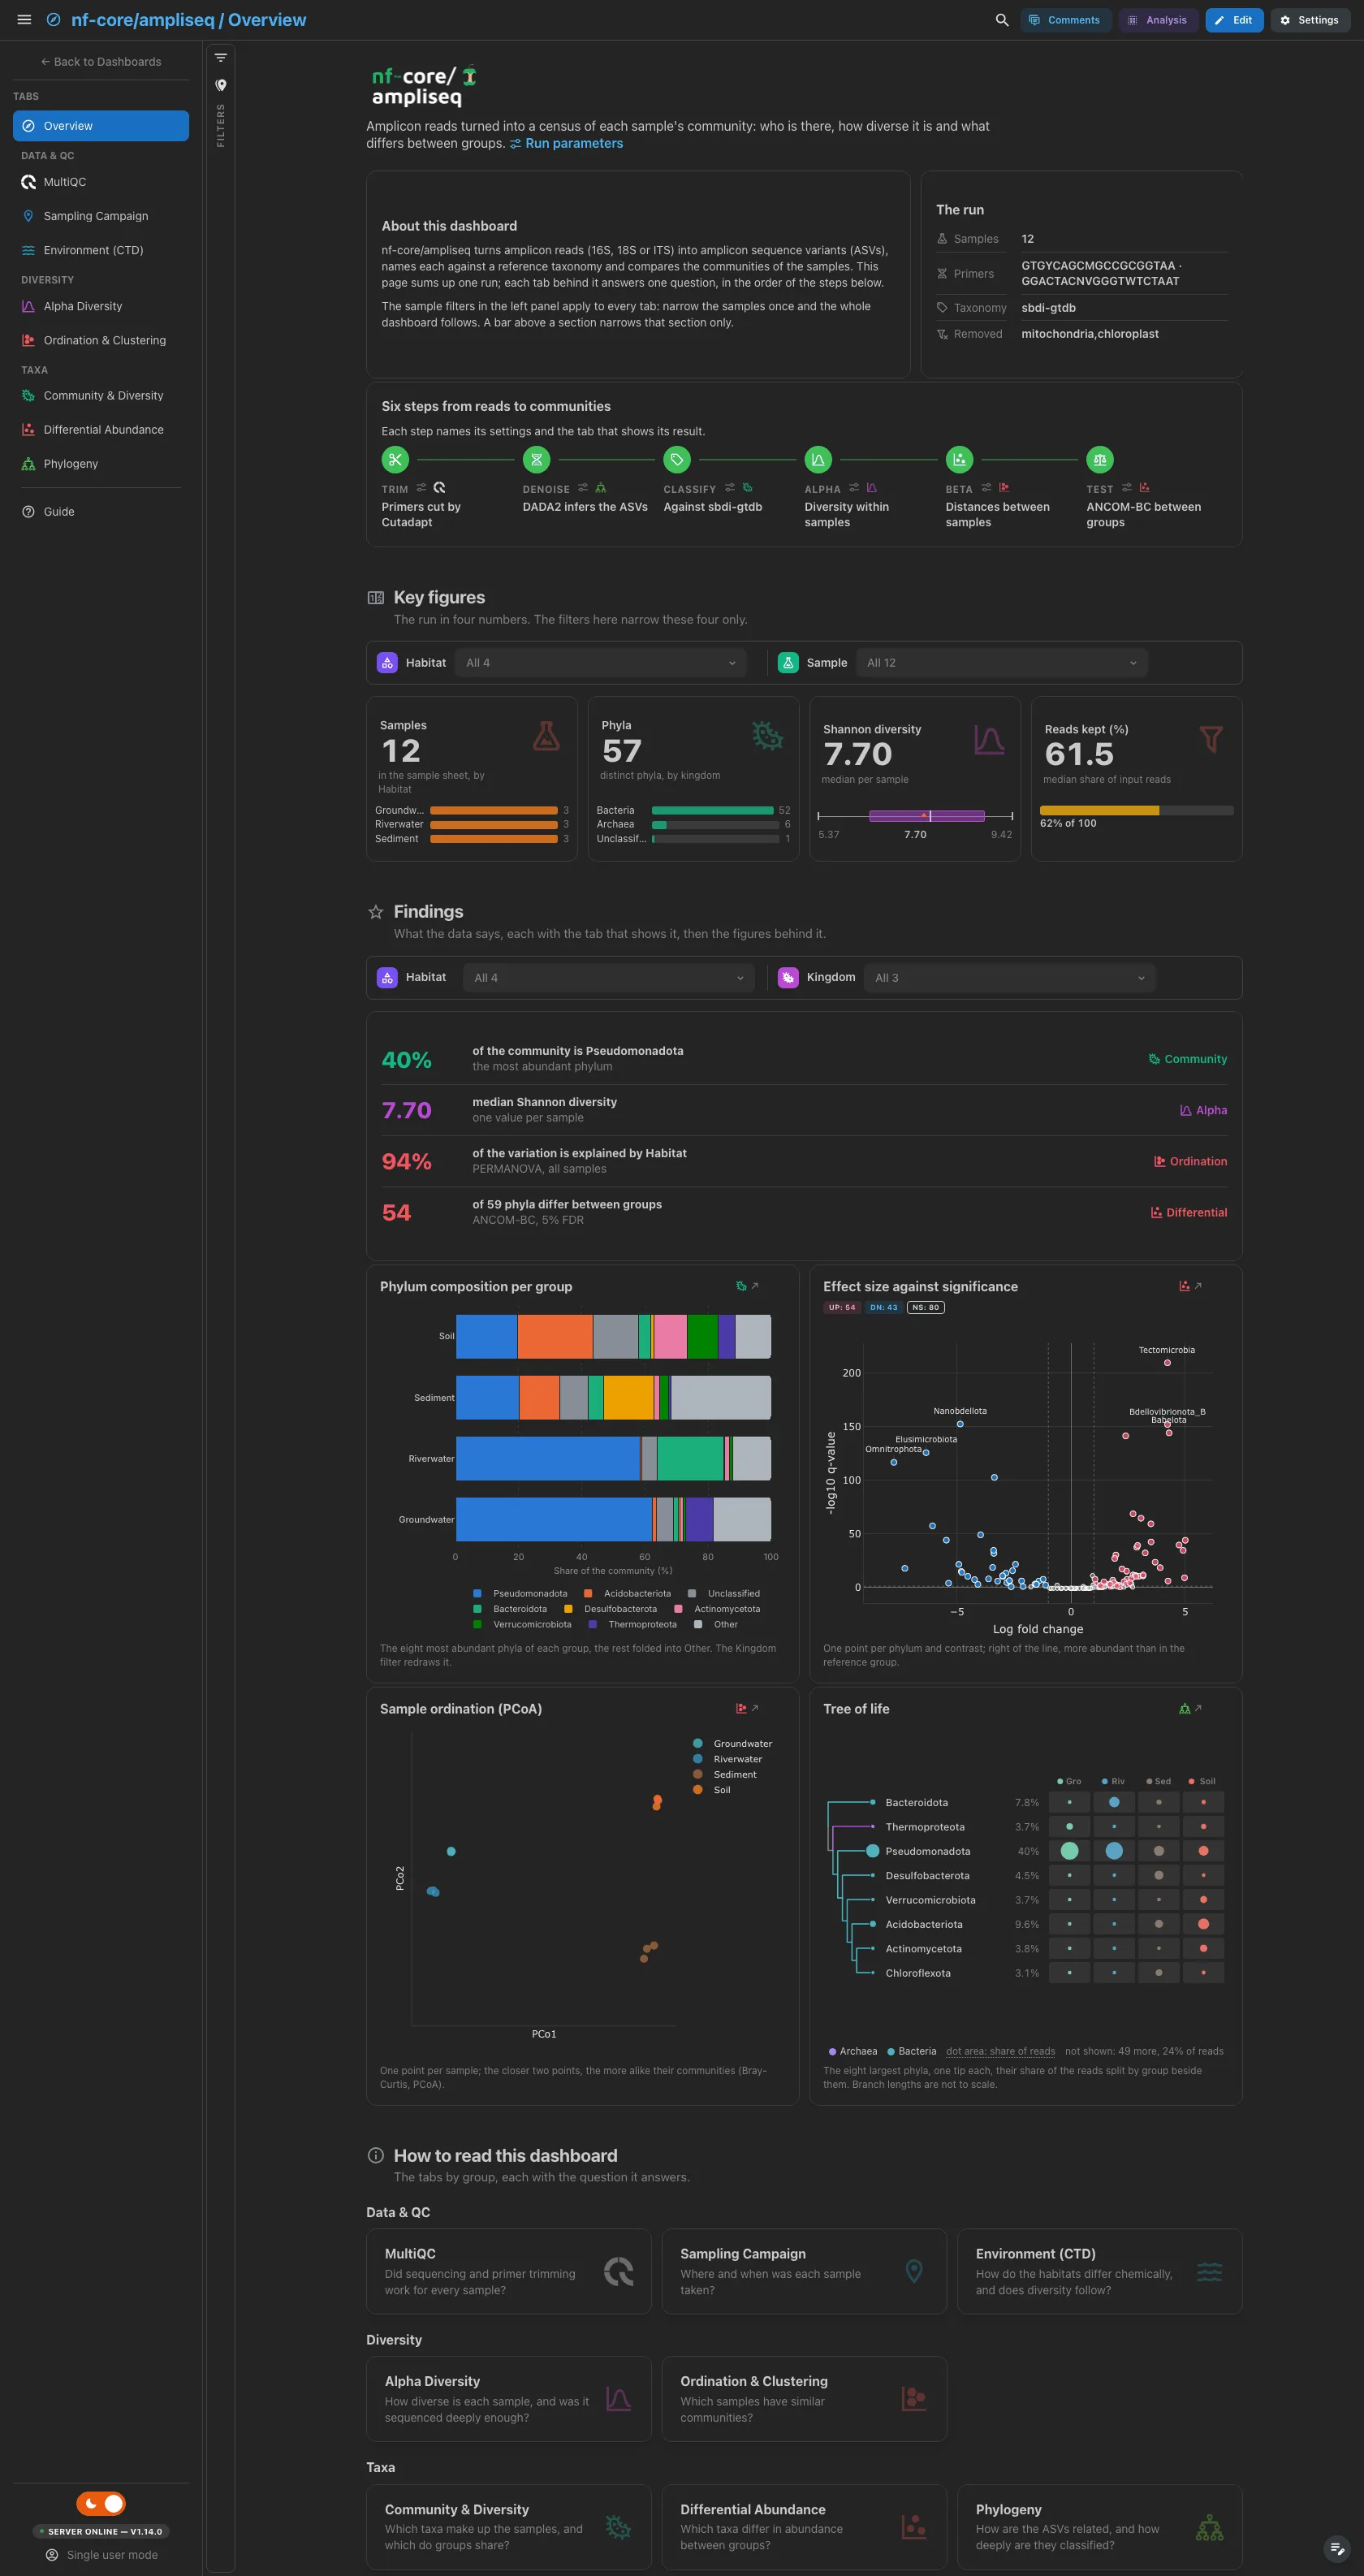
A short hero links the run parameters. About this dashboard says how to move through the tabs, The run lists the samples, primers, reference taxonomy and removed taxa, and Pipeline walks the six steps from trimming to the differential test, each linked to its parameters and its tab. The findings are live values: they follow the filters, and a route that lacks their data drops them.
Filters and components
Filters · the left panel starts collapsed. Key figures has its own filter bar (your grouping column and the sample id), and so does Findings (your grouping column and the kingdom): each narrows its own section only.
| Section | What it holds |
|---|---|
| Top | Hero, About this dashboard, The run, Pipeline |
| Key figures | 4 headline cards: samples, phyla, median Shannon diversity, reads kept |
| Findings | Live result rows, then 4 figures: phylum composition per group, the ANCOM-BC volcano, the PCoA and a tree of the eight largest phyla |
| How to read this dashboard | The tabs by group, each with its question |
Data & QC · Did sequencing and primer trimming work for every sample?
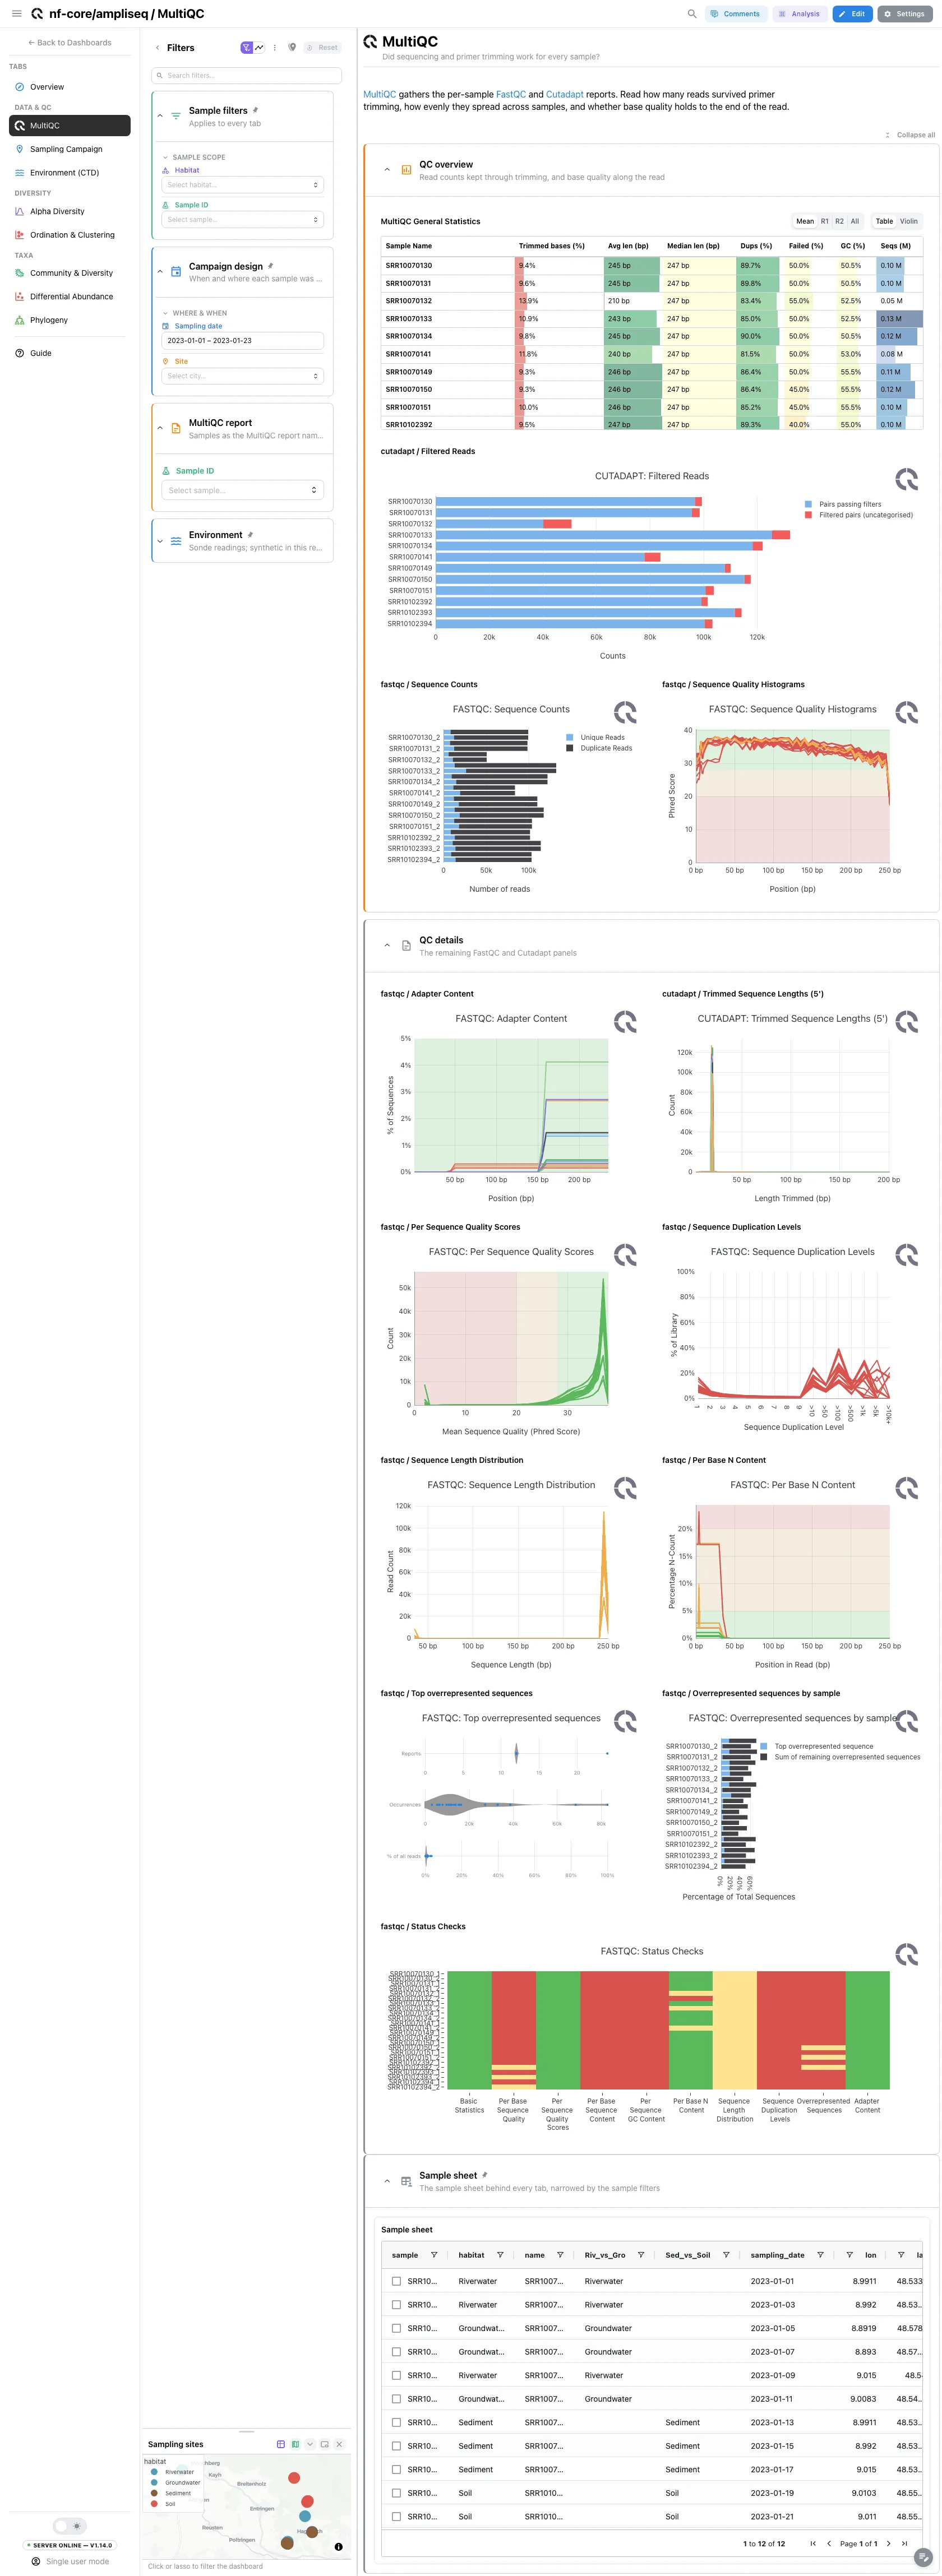
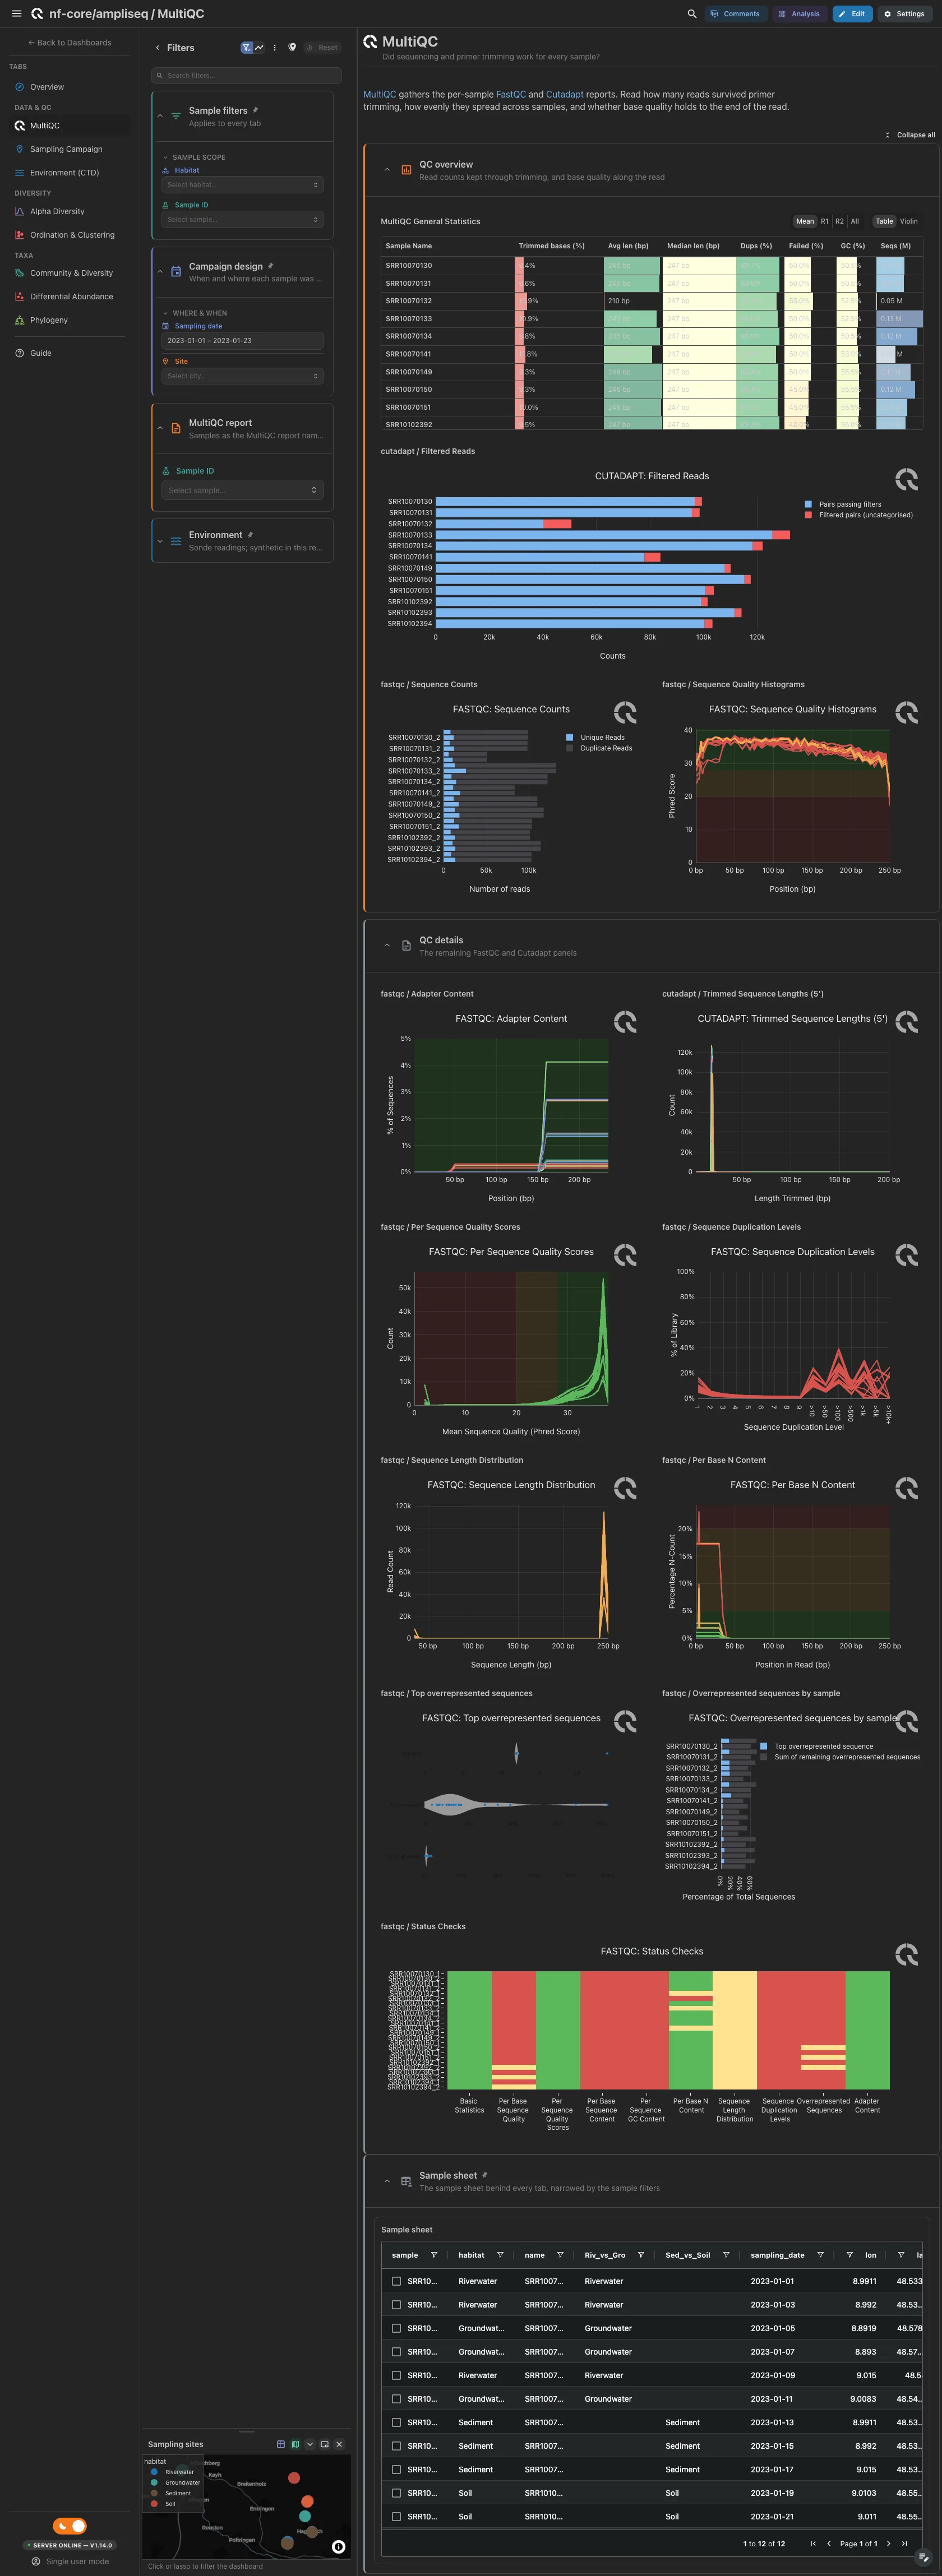
MultiQC panels only: general statistics, Cutadapt filtered reads, FastQC sequence counts and quality histograms open, the other FastQC and Cutadapt panels collapsed. Its sample filter reads the MultiQC report, so the tab works on a run without metadata.
Filters and components
Filters · Sample ID, read from the MultiQC report.
| Section | What it holds |
|---|---|
| QC overview | 4 MultiQC panels |
| QC details (collapsed) | 9 MultiQC panels |
Diversity · How diverse is each sample, and was it sequenced deeply enough?
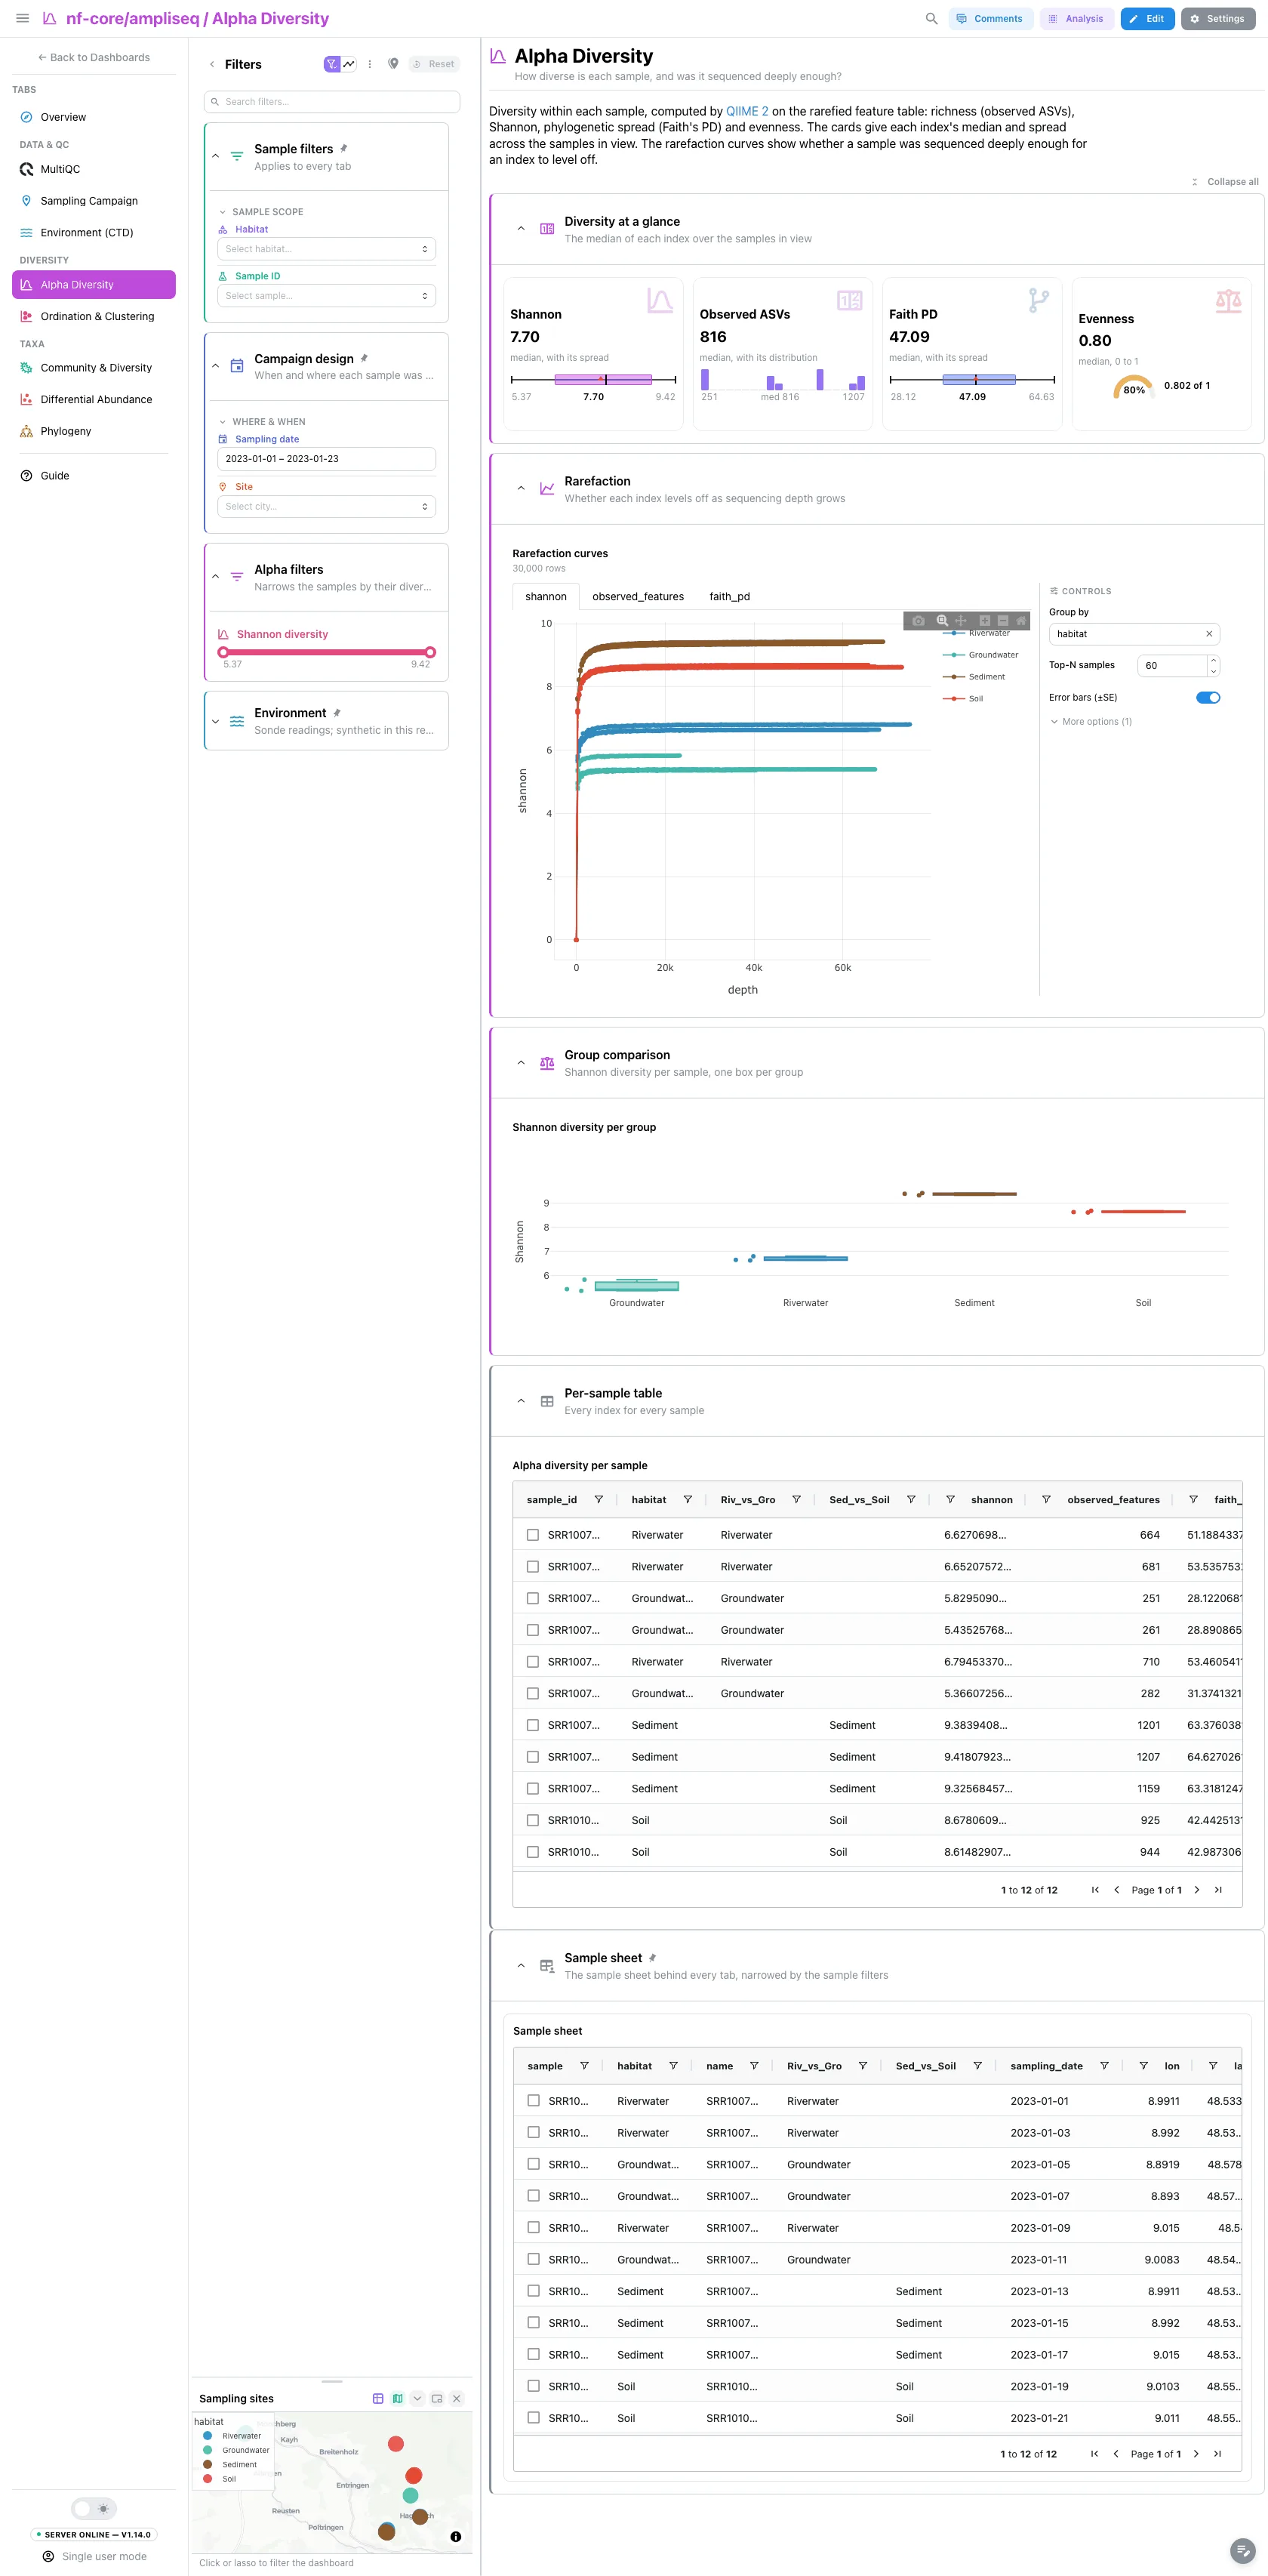
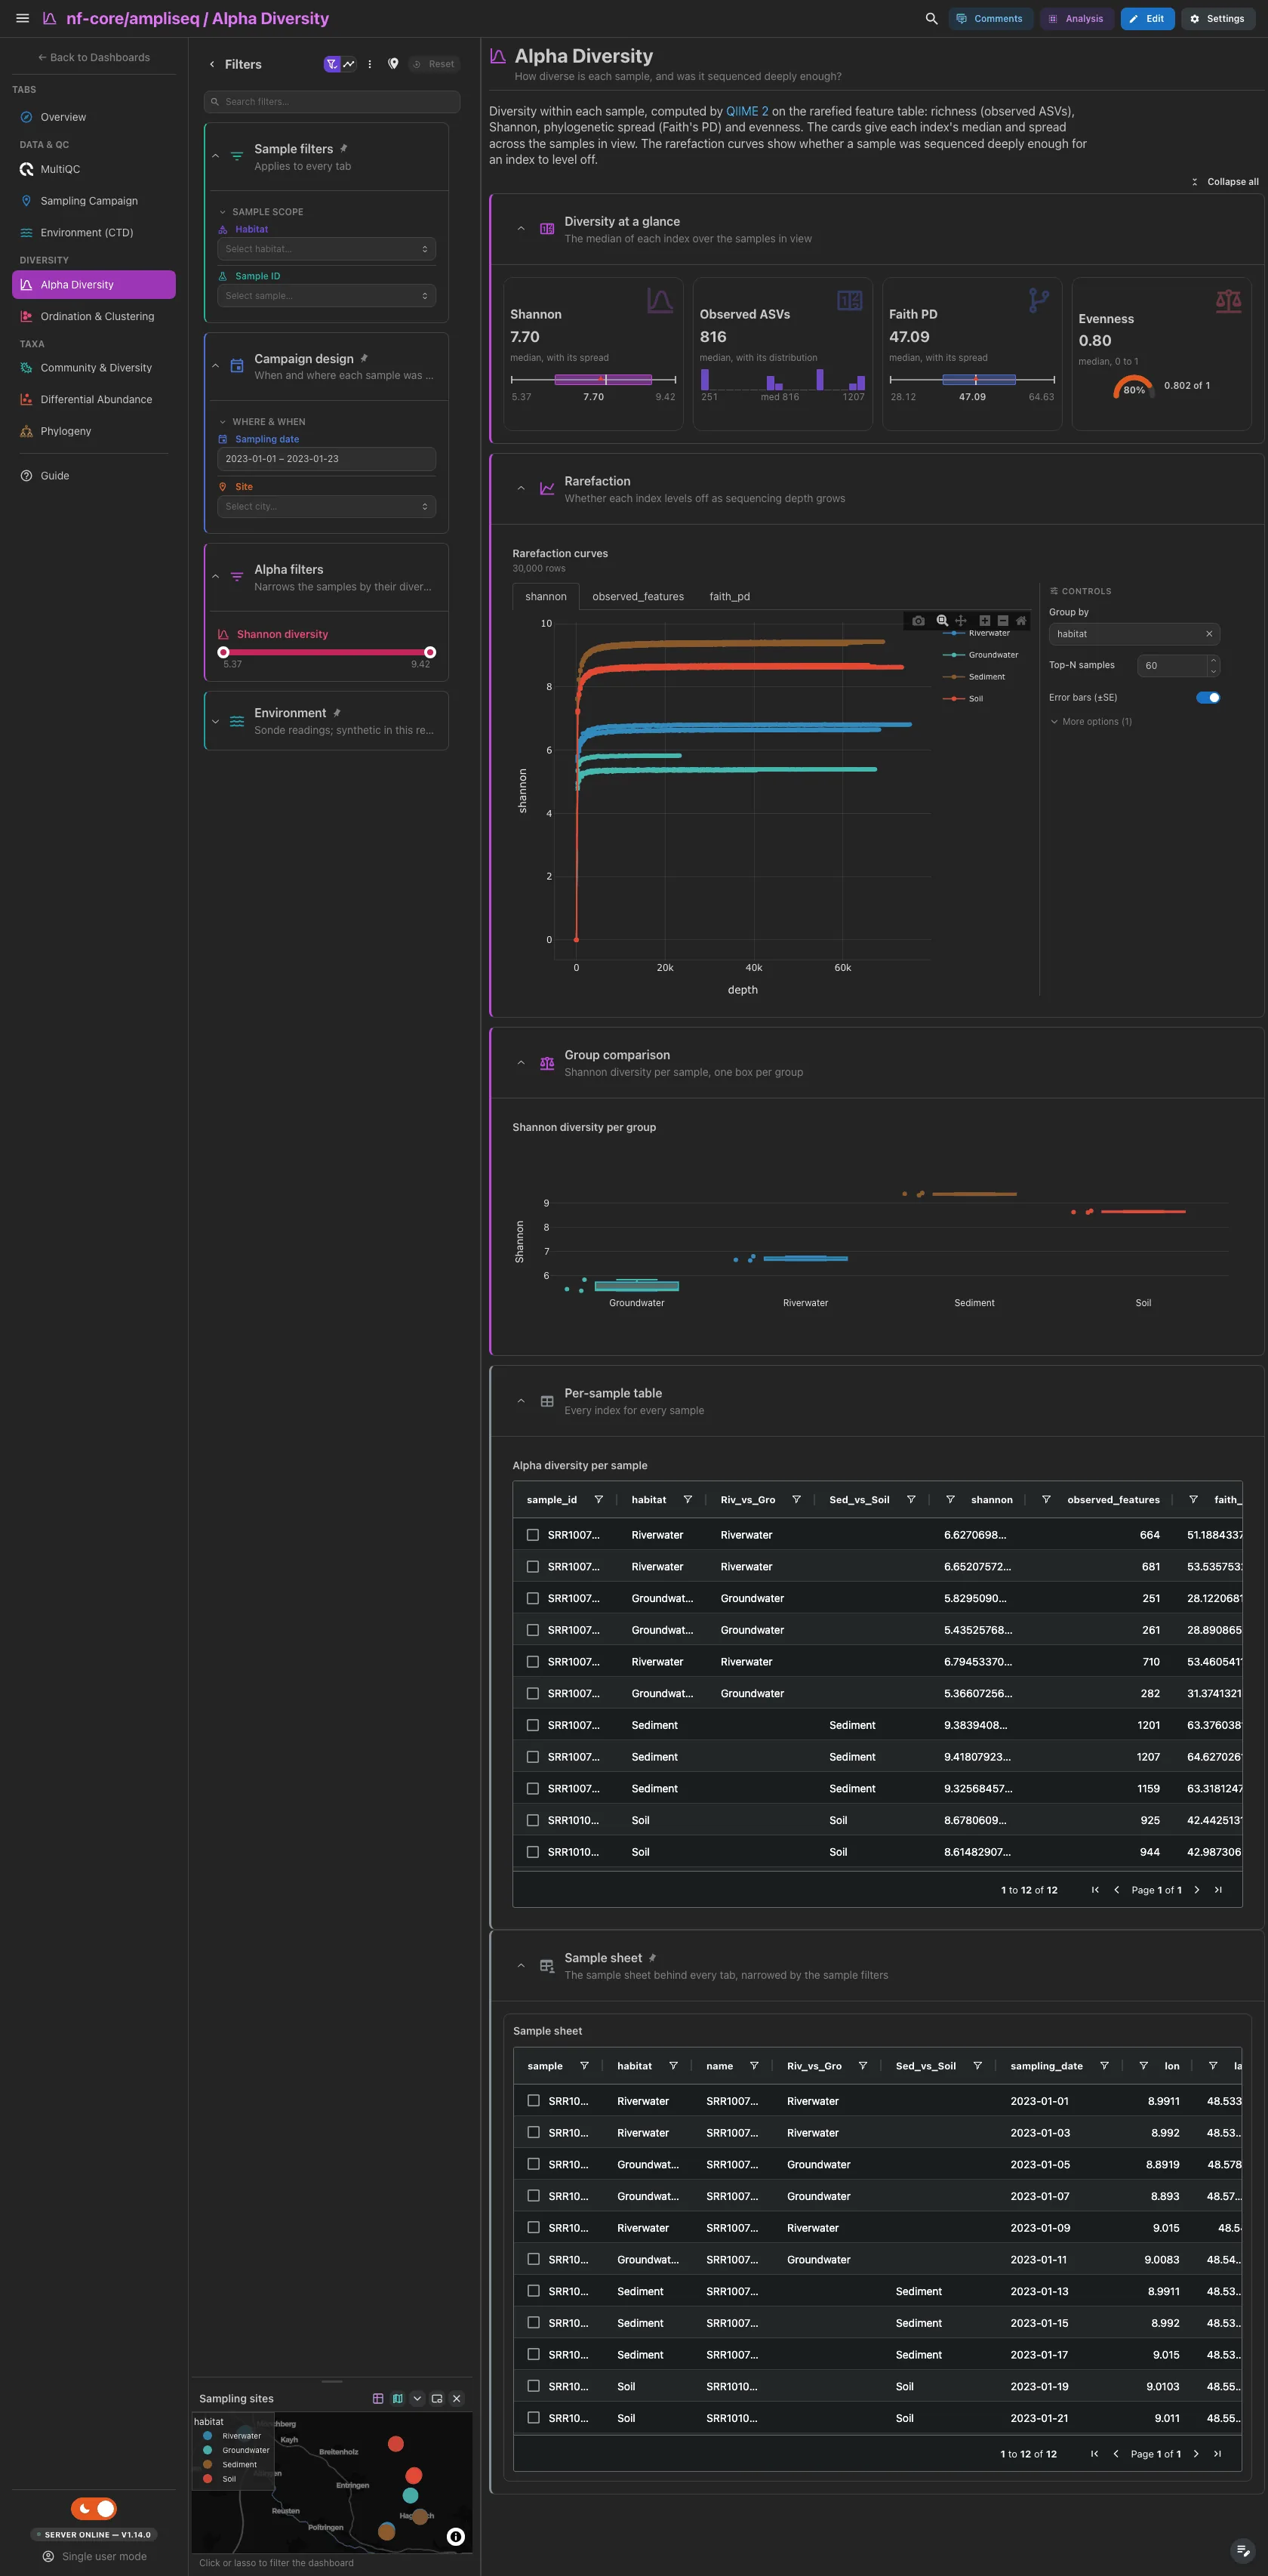
The median Shannon diversity and Faith PD with their spread, Observed ASVs with their distribution and Evenness on a 0 to 1 gauge. Then the rarefaction curves, one per group with a metric switch, and Shannon diversity per group with one point per sample.
Filters and components
Filters · a Shannon diversity range on
alpha_diversity_multi_canonical, plus the sample filters.
| Section | What it holds |
|---|---|
| Diversity at a glance | 4 cards |
| Rarefaction | 1 advanced visualization |
| Group comparison | Shannon diversity per group |
| Per-sample table (collapsed) | Alpha diversity per sample |
Diversity · Which samples have similar communities?
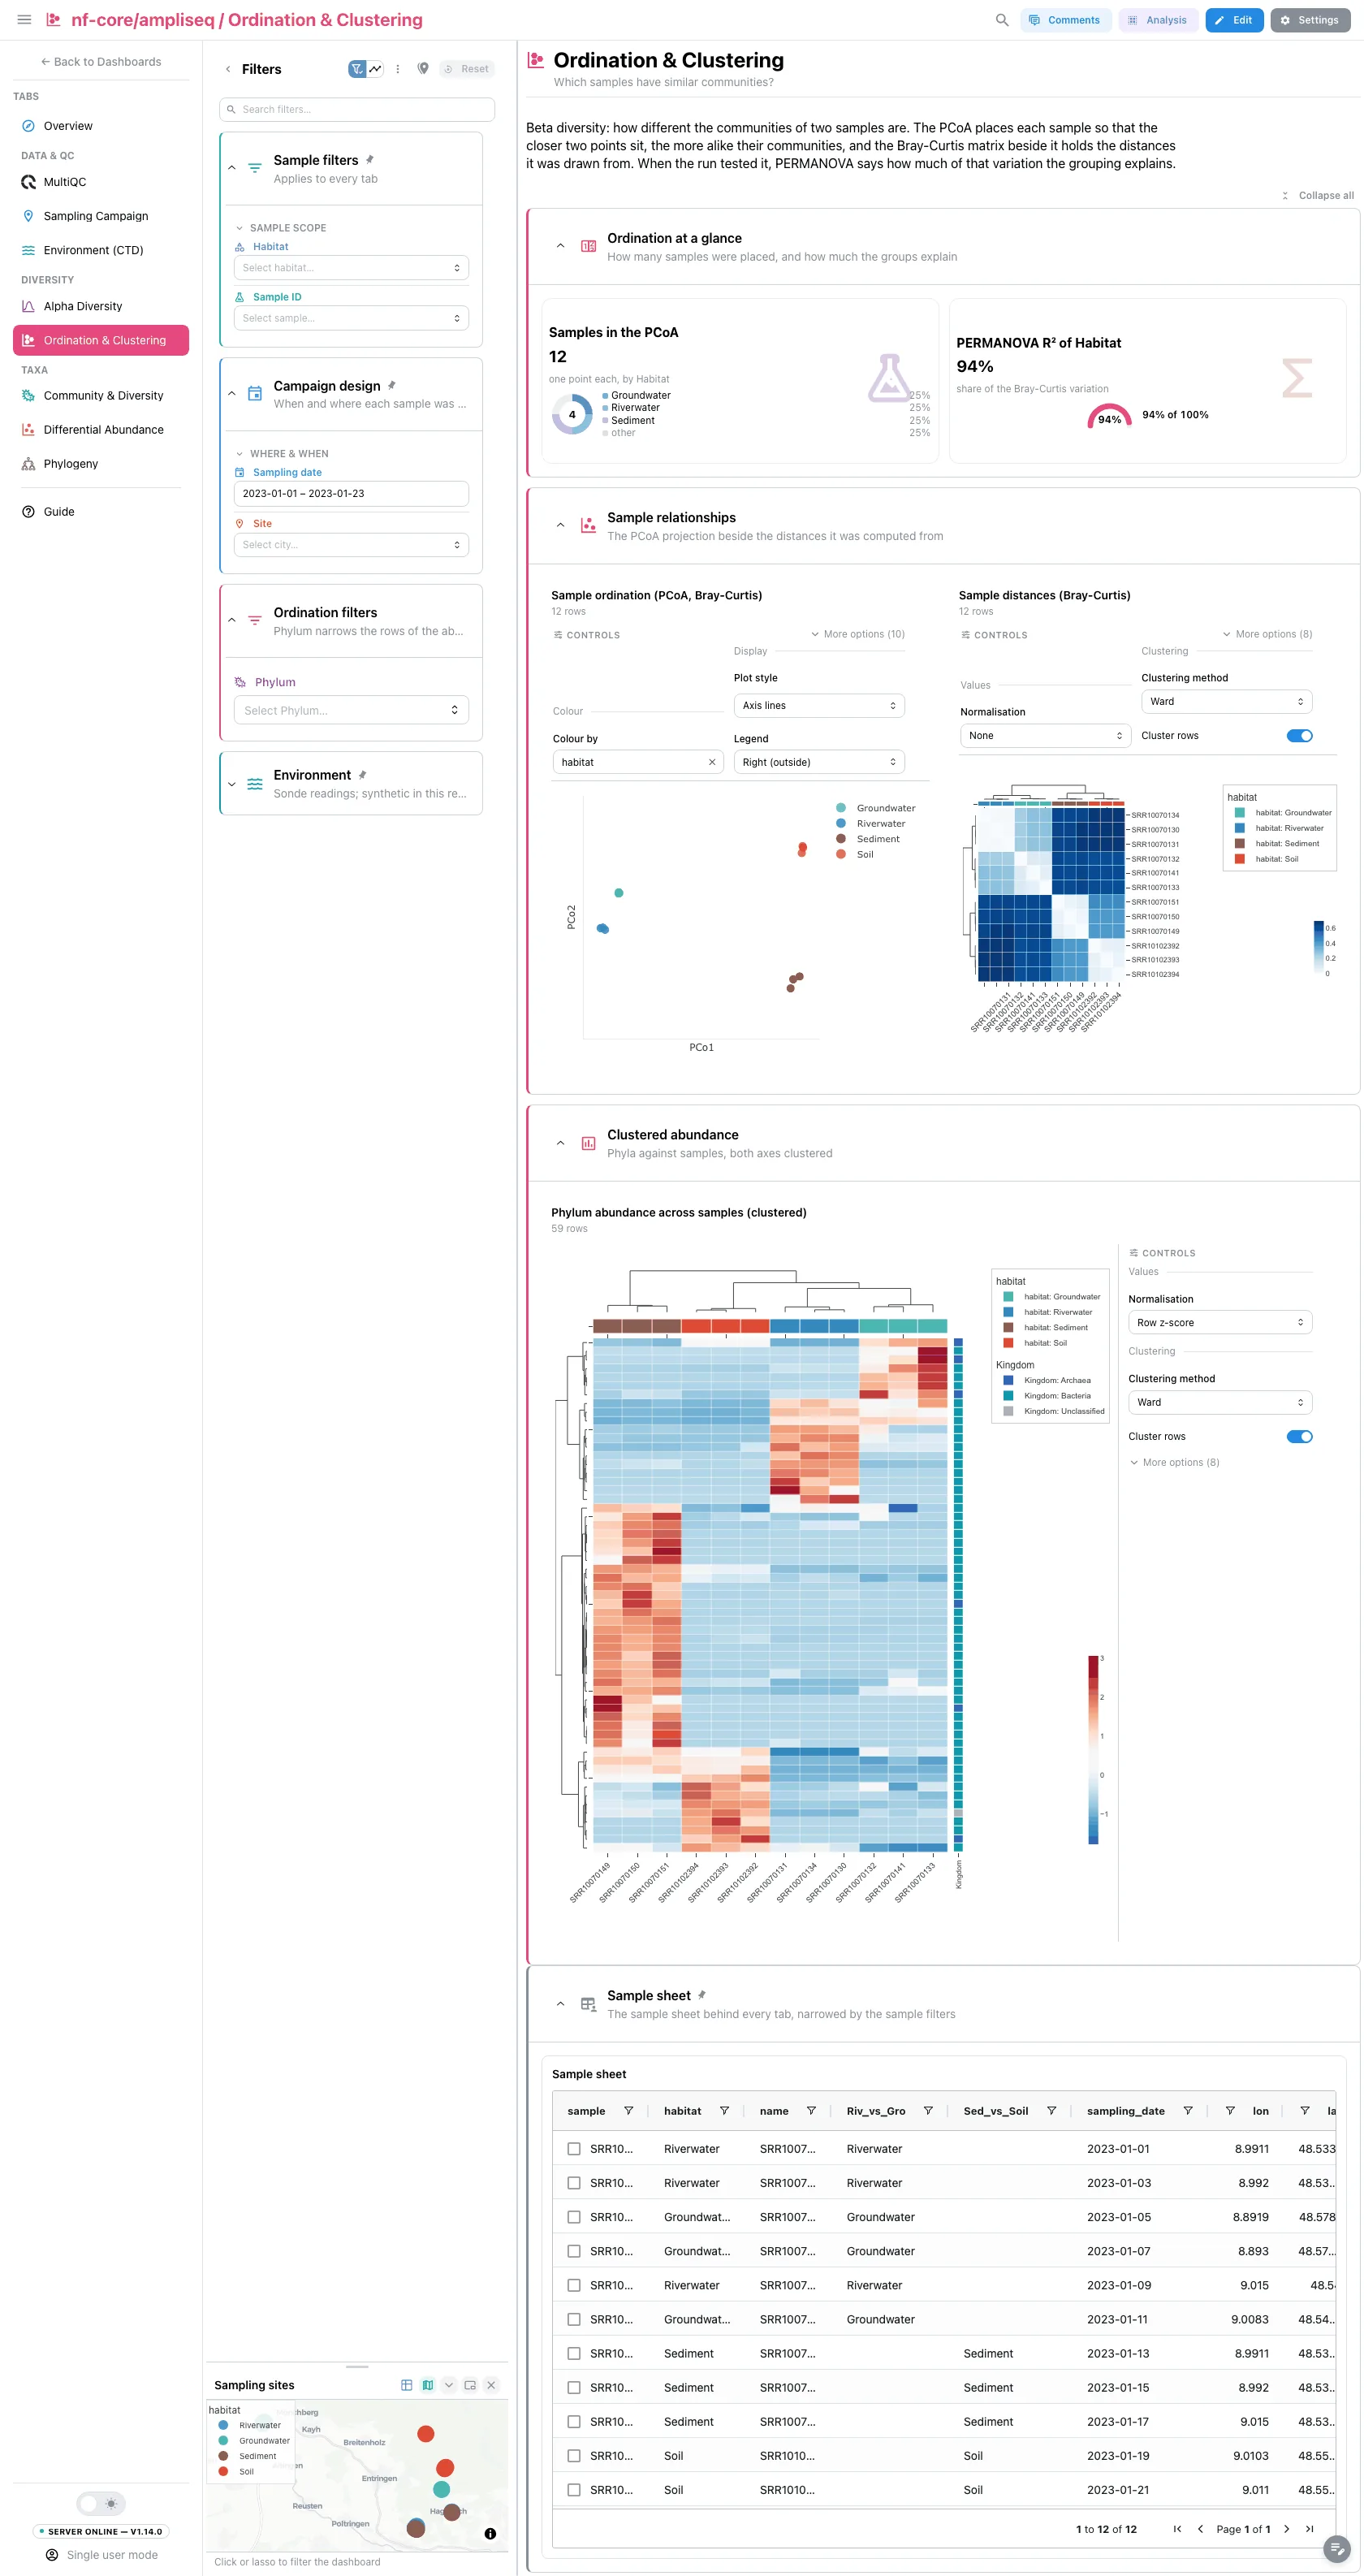
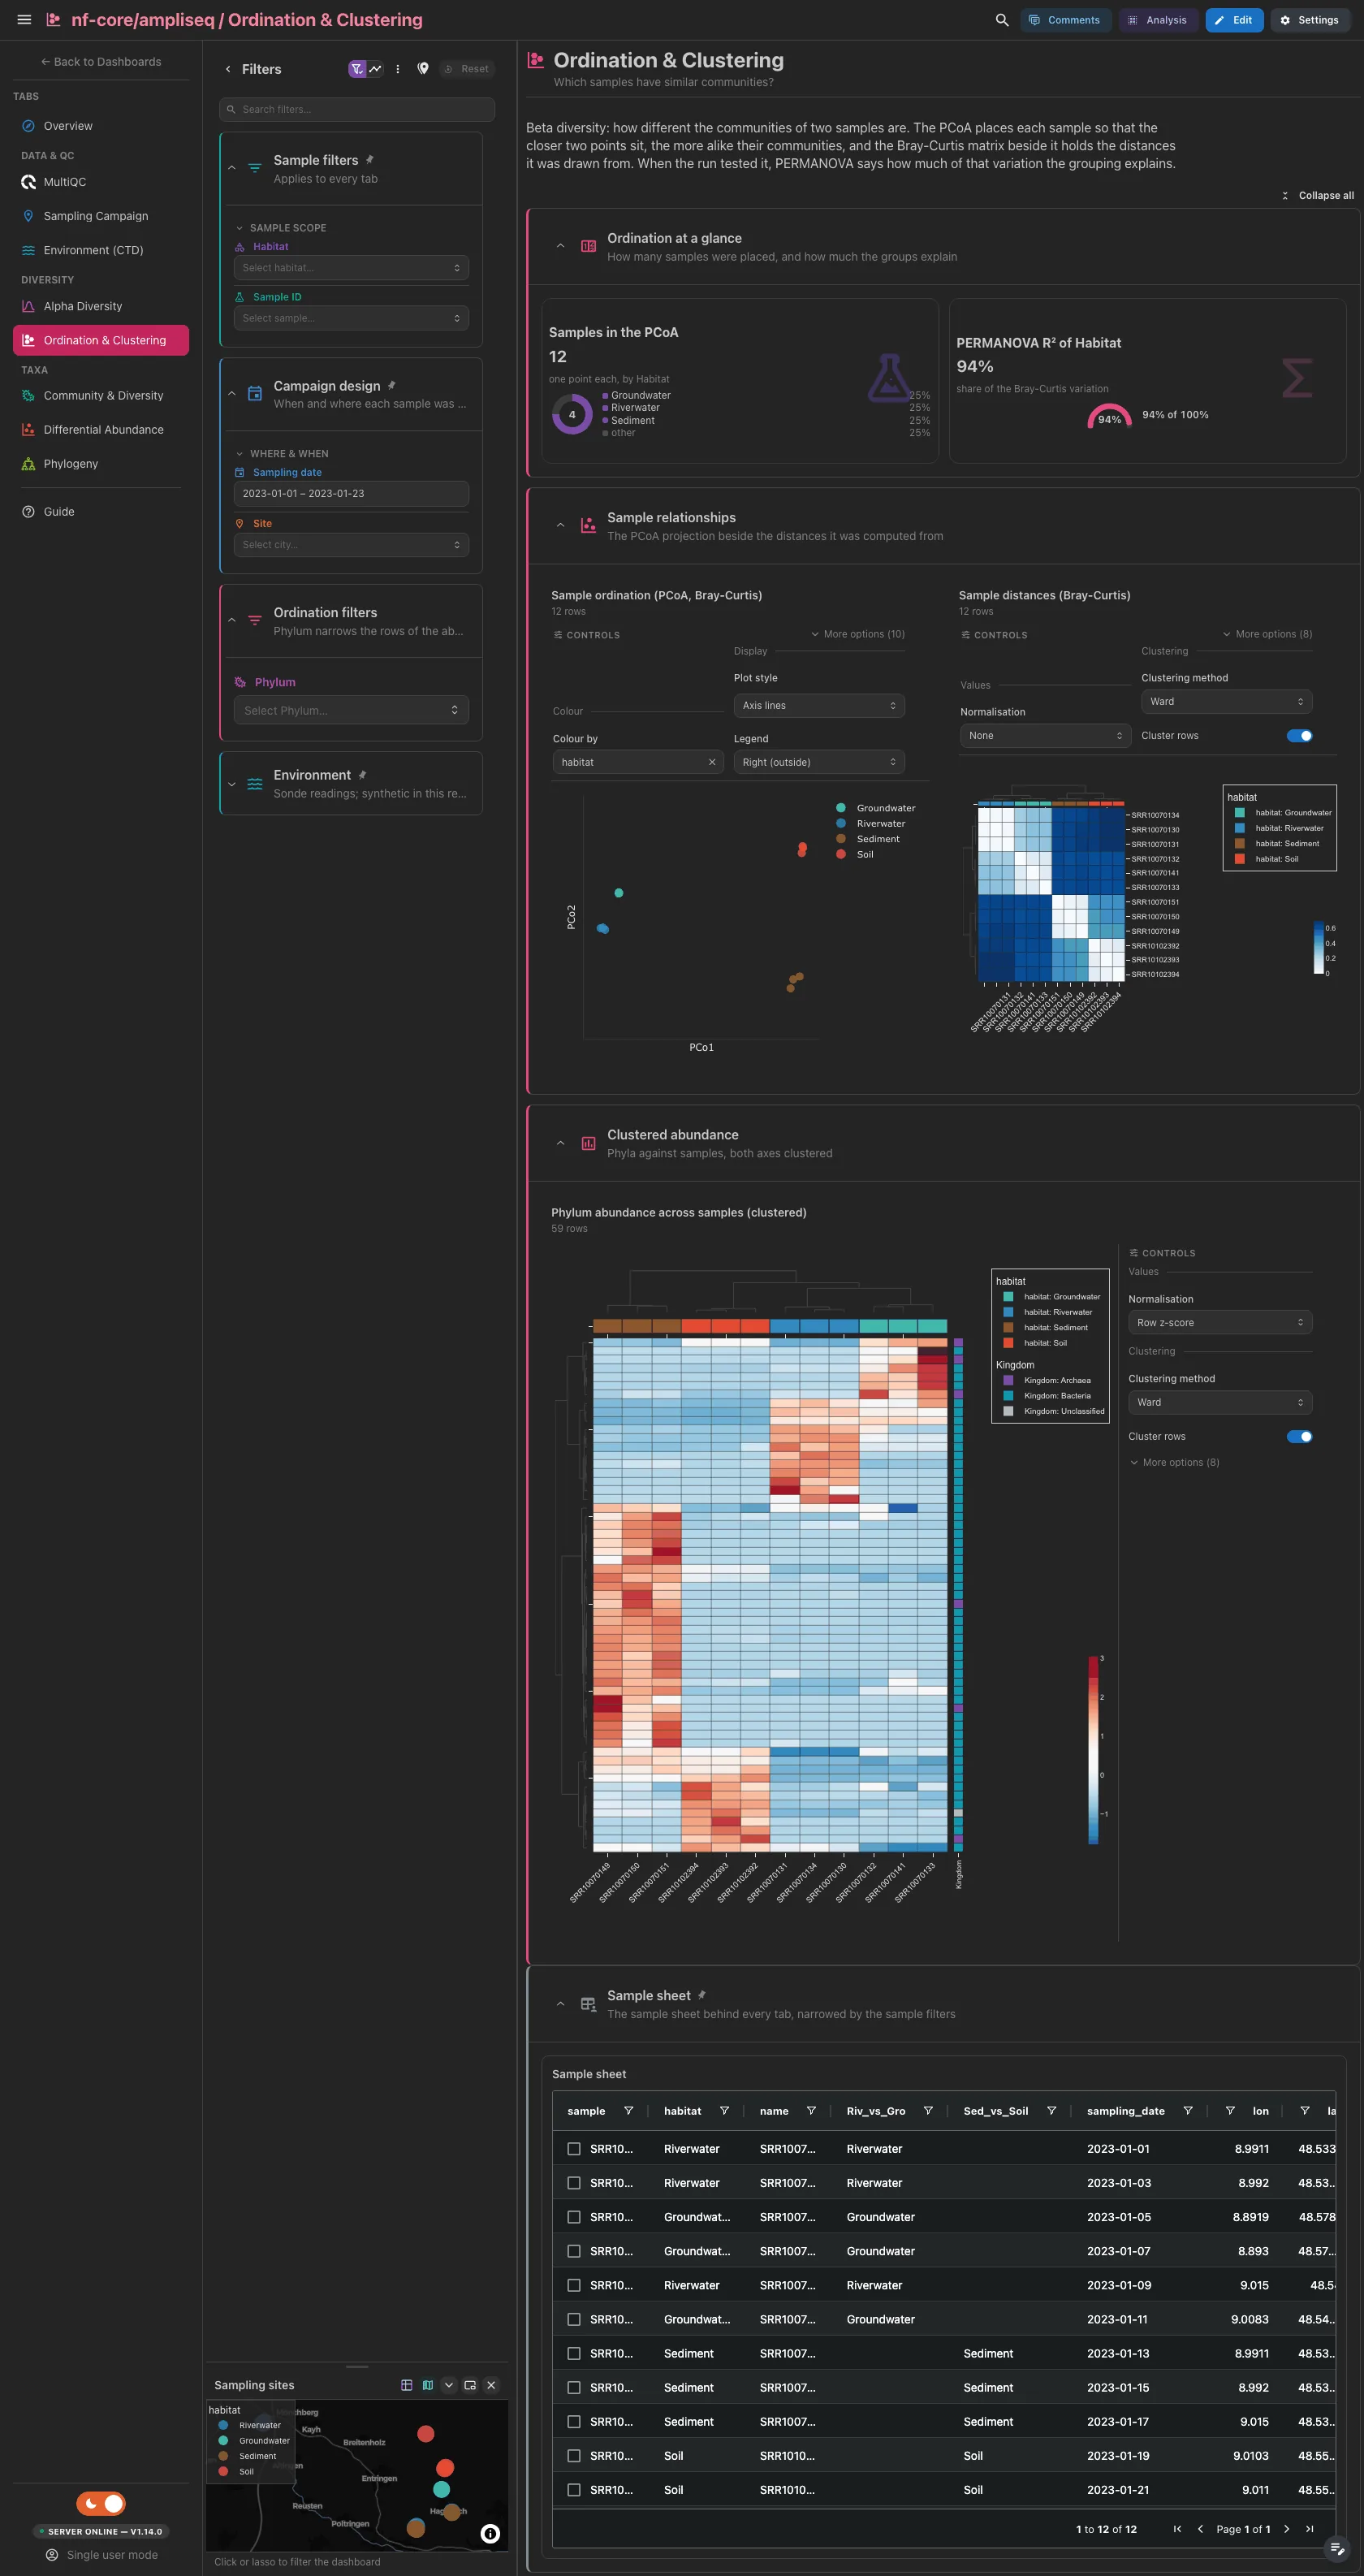
The samples placed by the PCoA, split by group, and, when the run tested a PERMANOVA formula, the share of variation the group explains. Then the PCoA on Bray-Curtis beside the distances it was drawn from, and the phyla against the samples with both axes clustered. A lasso on the PCoA makes an analysis group.
Filters and components
Filters · Phylum on complex_heatmap_canonical, narrowing the rows
of the heatmap, plus the sample filters.
| Section | What it holds |
|---|---|
| Ordination at a glance | 2 cards |
| Sample relationships | 2 advanced visualizations |
| Clustered abundance | 1 advanced visualization |
Taxa · Which taxa make up the samples, and which do groups share?
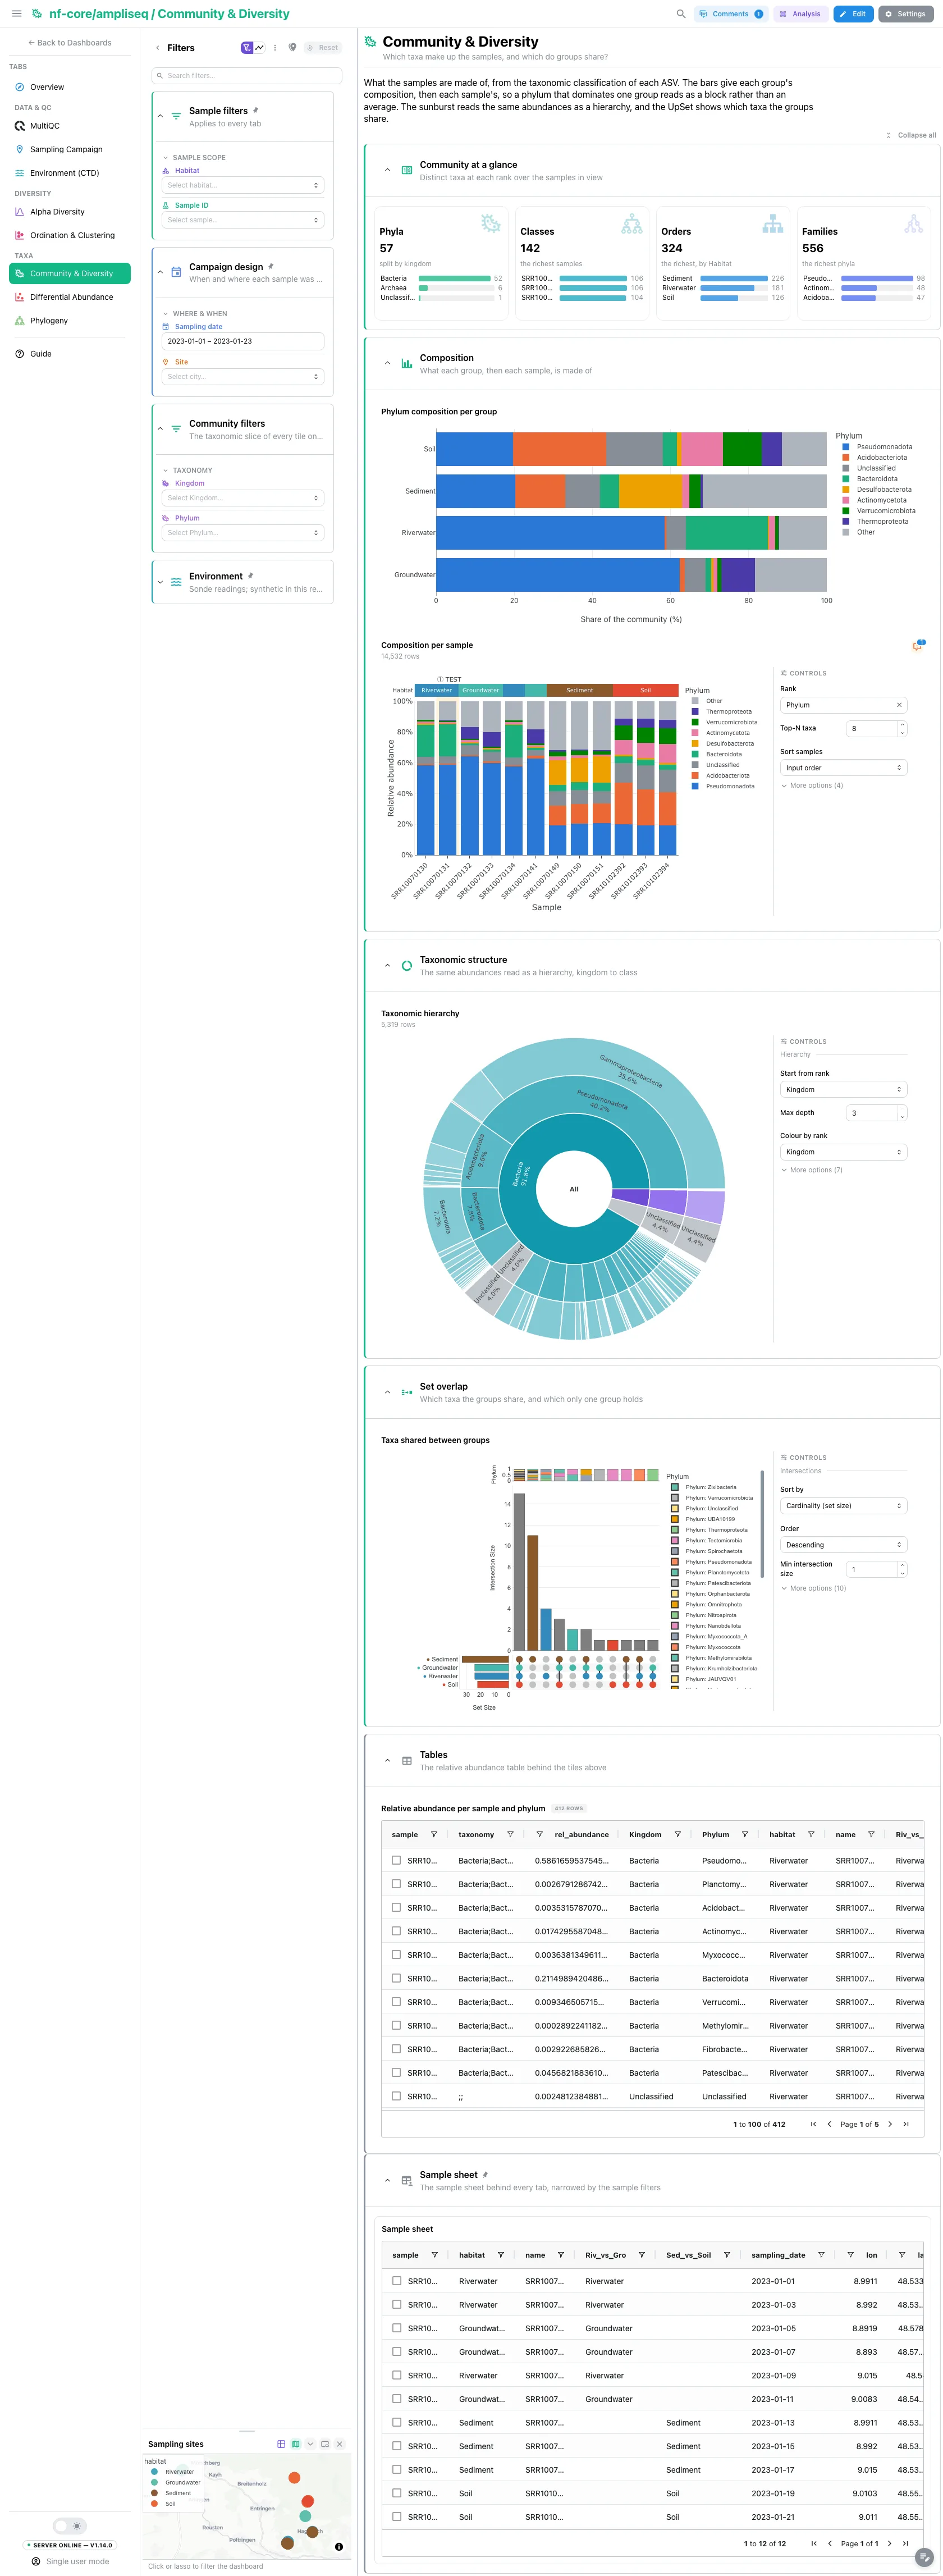
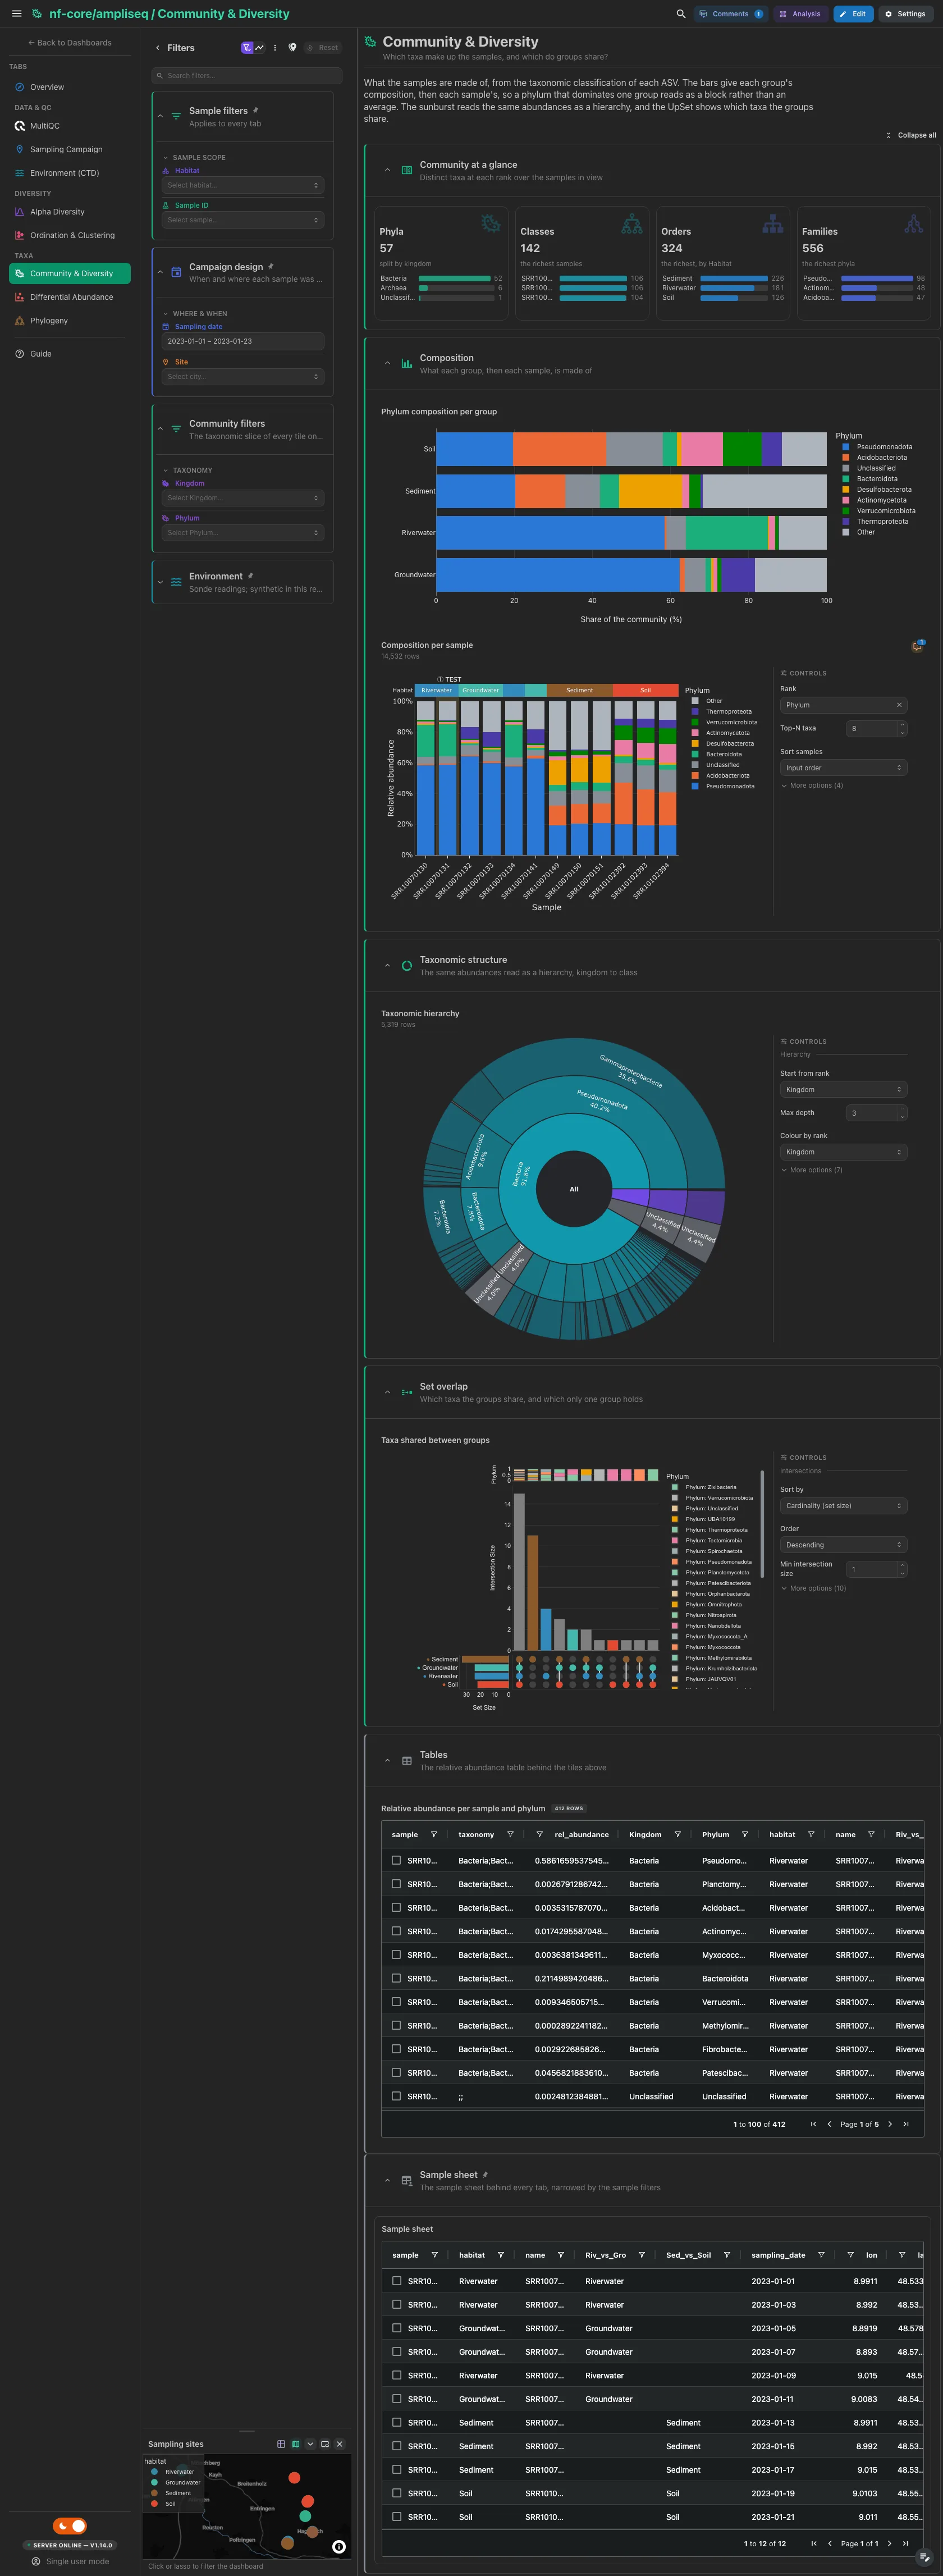
Distinct phyla, classes, orders and families, each split or ranked. Then the
phylum composition per group and per sample (the eight largest phyla and
Other), the sunburst hierarchy and the UpSet of the taxa the groups share. A
--skip_qiime run shows its SINTAX tiles in the same places.
Filters and components
Filters · Kingdom and Phylum on taxonomy_rel_abundance, or on
sintax_rel_abundance for a SINTAX run, plus the sample filters.
| Section | What it holds |
|---|---|
| Community at a glance | 4 cards |
| Composition | 1 bar + 1 advanced visualization |
| Taxonomic structure | 1 advanced visualization |
| Set overlap | 1 advanced visualization |
| Tables (collapsed) | Relative abundance per sample and phylum |
Taxa · Which taxa differ in abundance between groups?
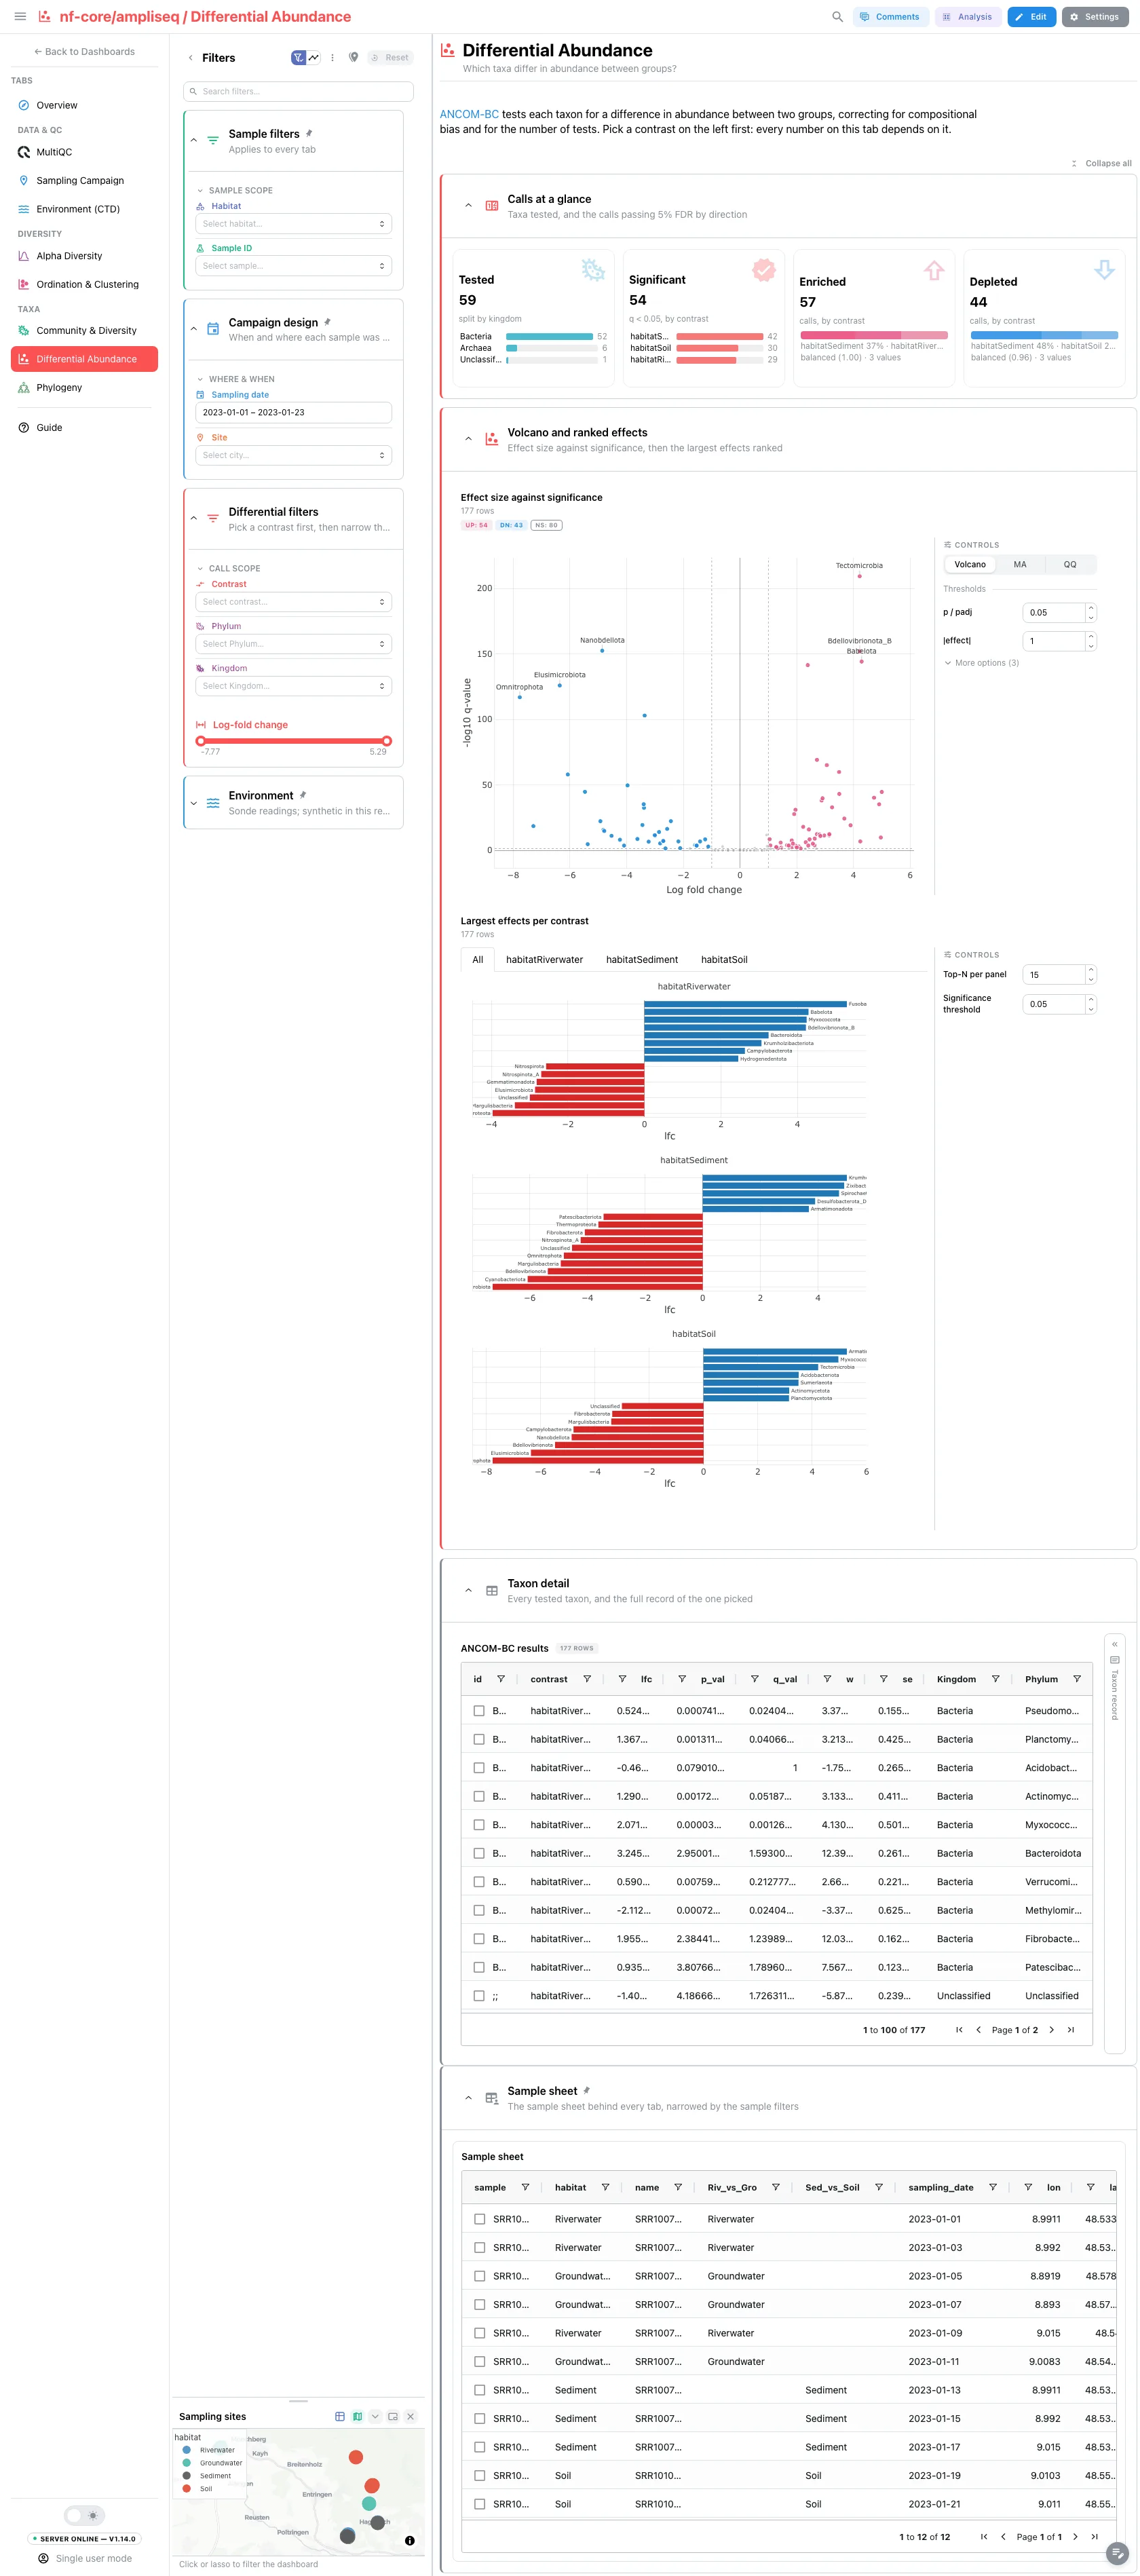
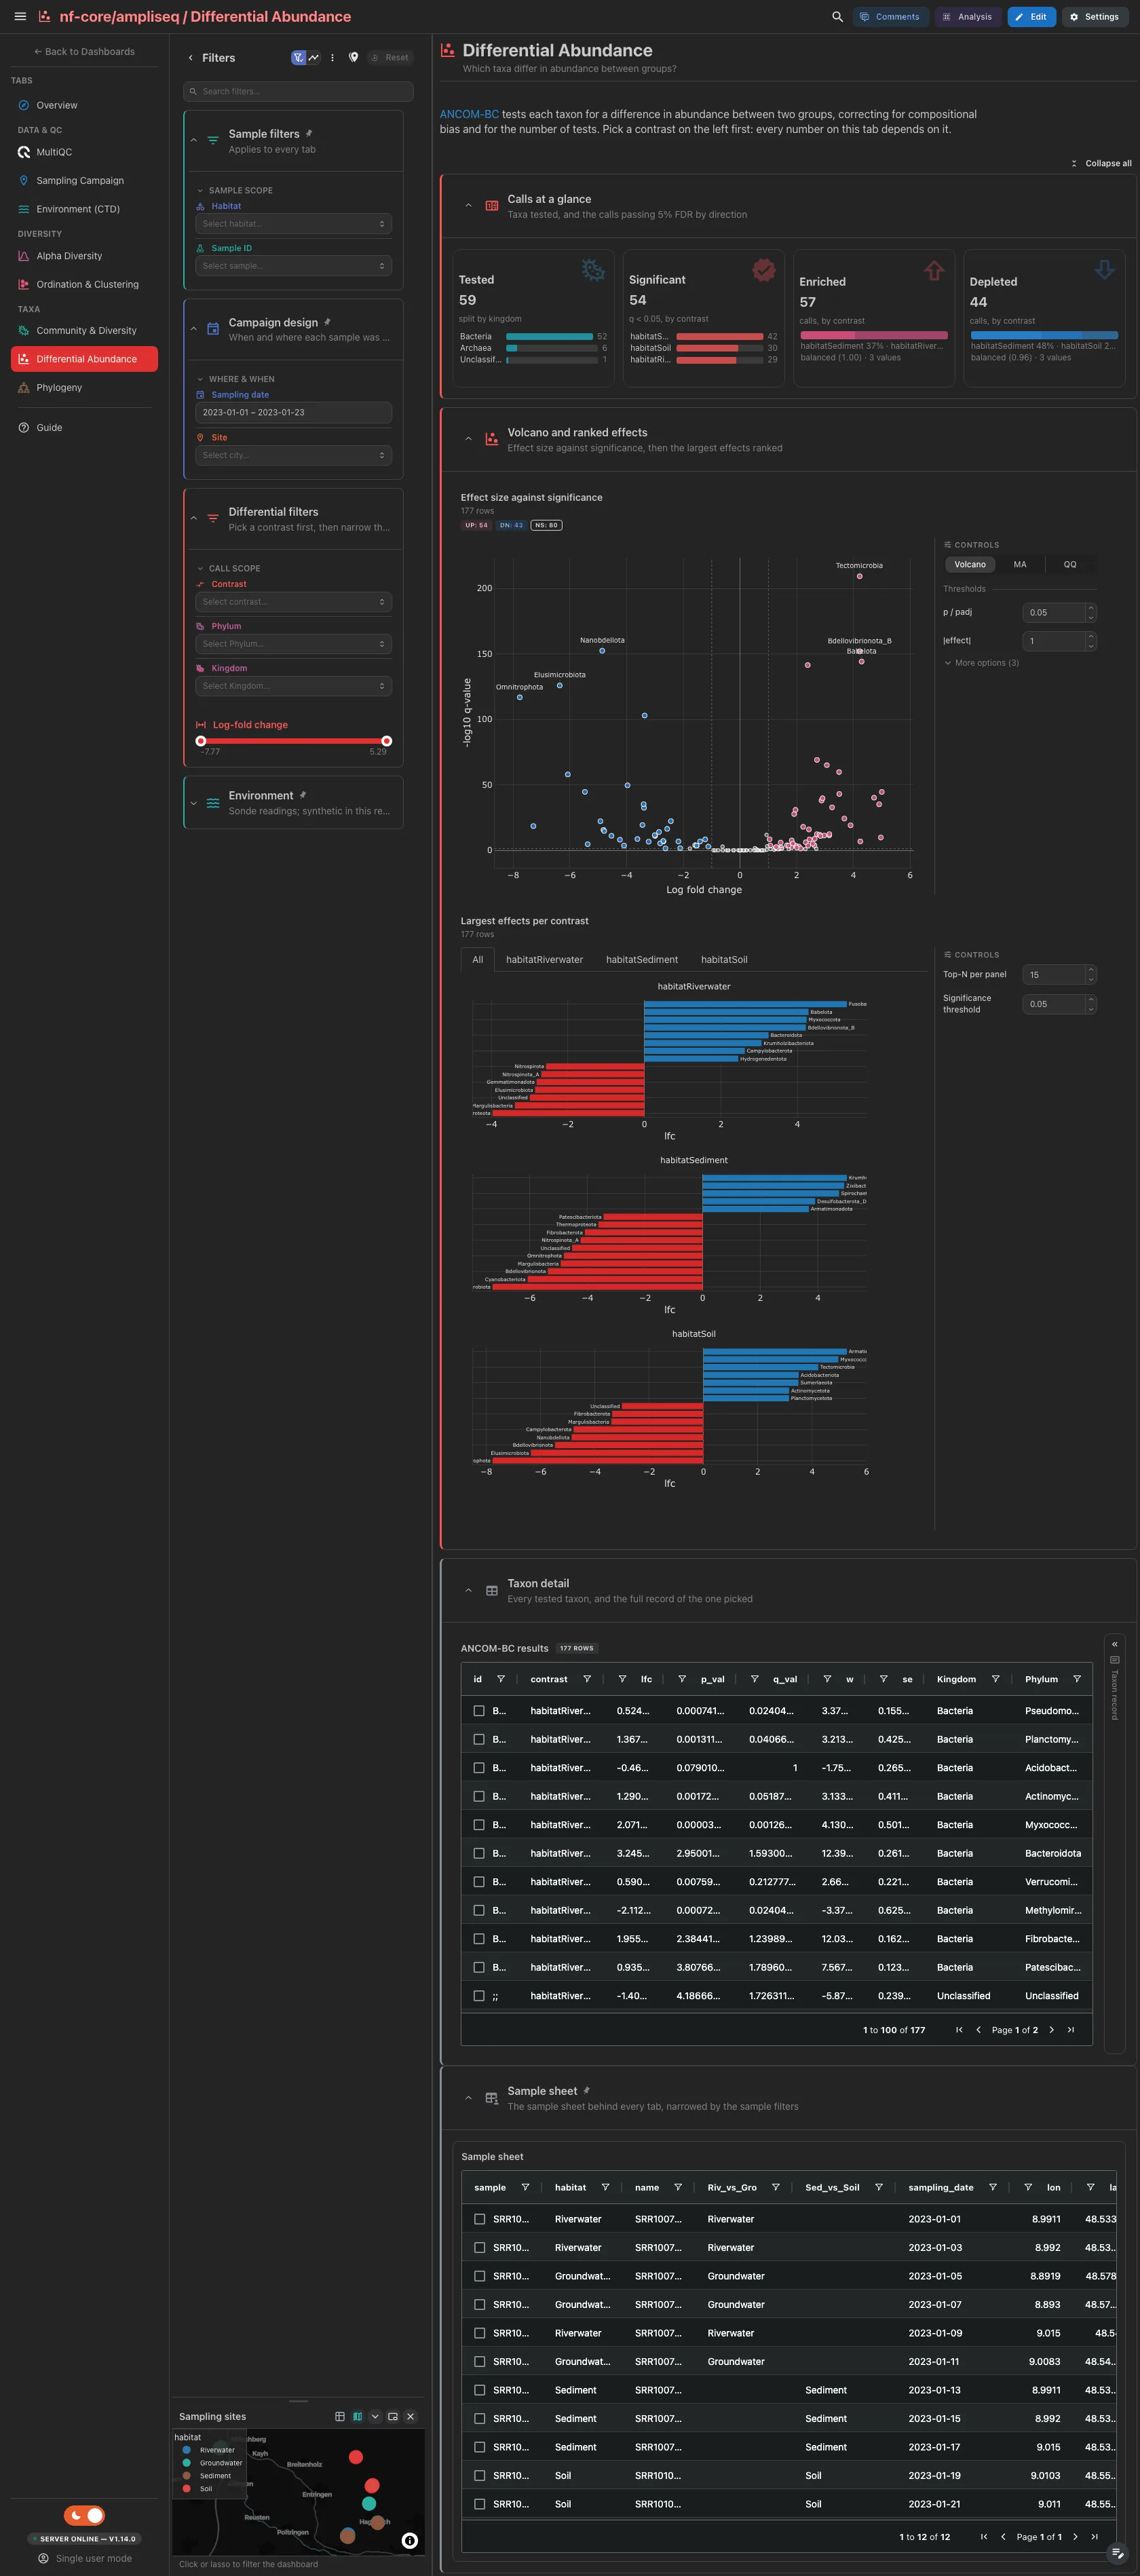
Pick a contrast first. The taxa tested, those significant at 5% FDR, and the enriched and depleted calls, each split by contrast. Then the volcano, whose View switch reads the same calls as an MA or a QQ plot, and the largest effects per contrast. The collapsed Taxon detail holds the ANCOM-BC table, with a record card for the row you pick.
Filters and components
Filters · Contrast, Phylum, Kingdom and a log-fold-change
range, all on ancombc_results.
| Section | What it holds |
|---|---|
| Calls at a glance | 4 cards |
| Volcano and ranked effects | 2 advanced visualizations |
| Taxon detail (collapsed) | ANCOM-BC results + a taxon record card |
Taxa · How are the ASVs related, and how deeply are they classified?
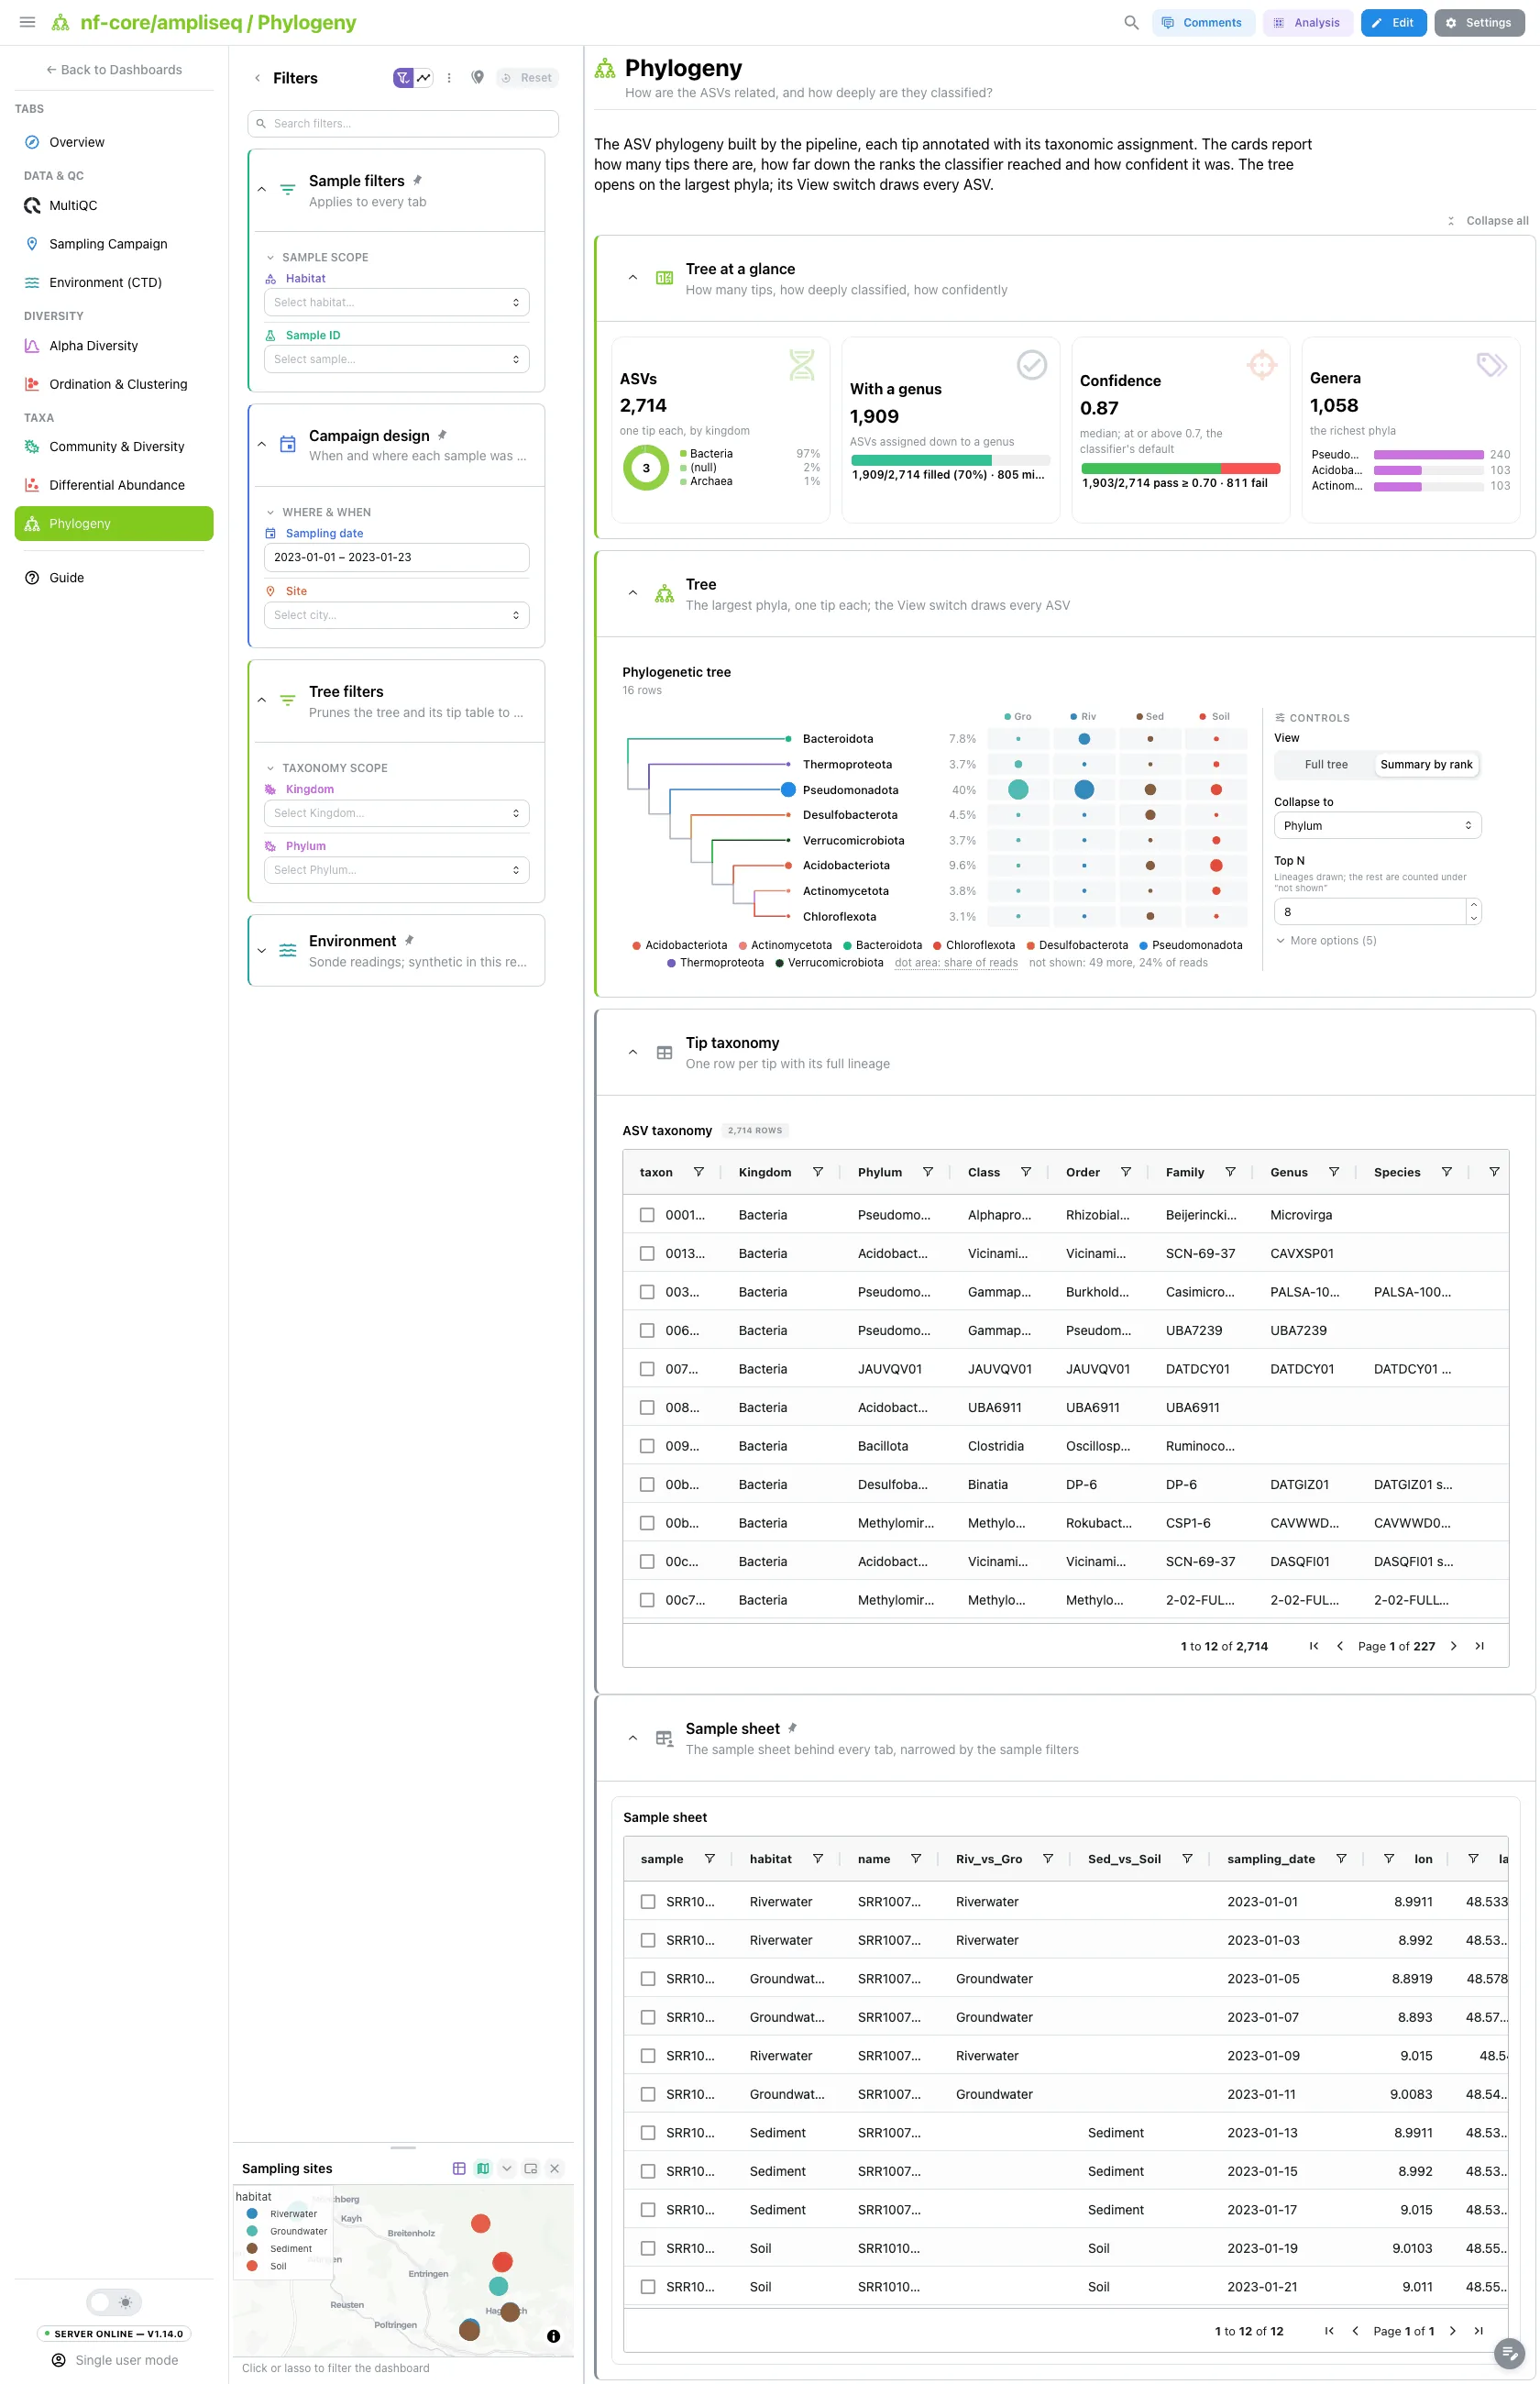
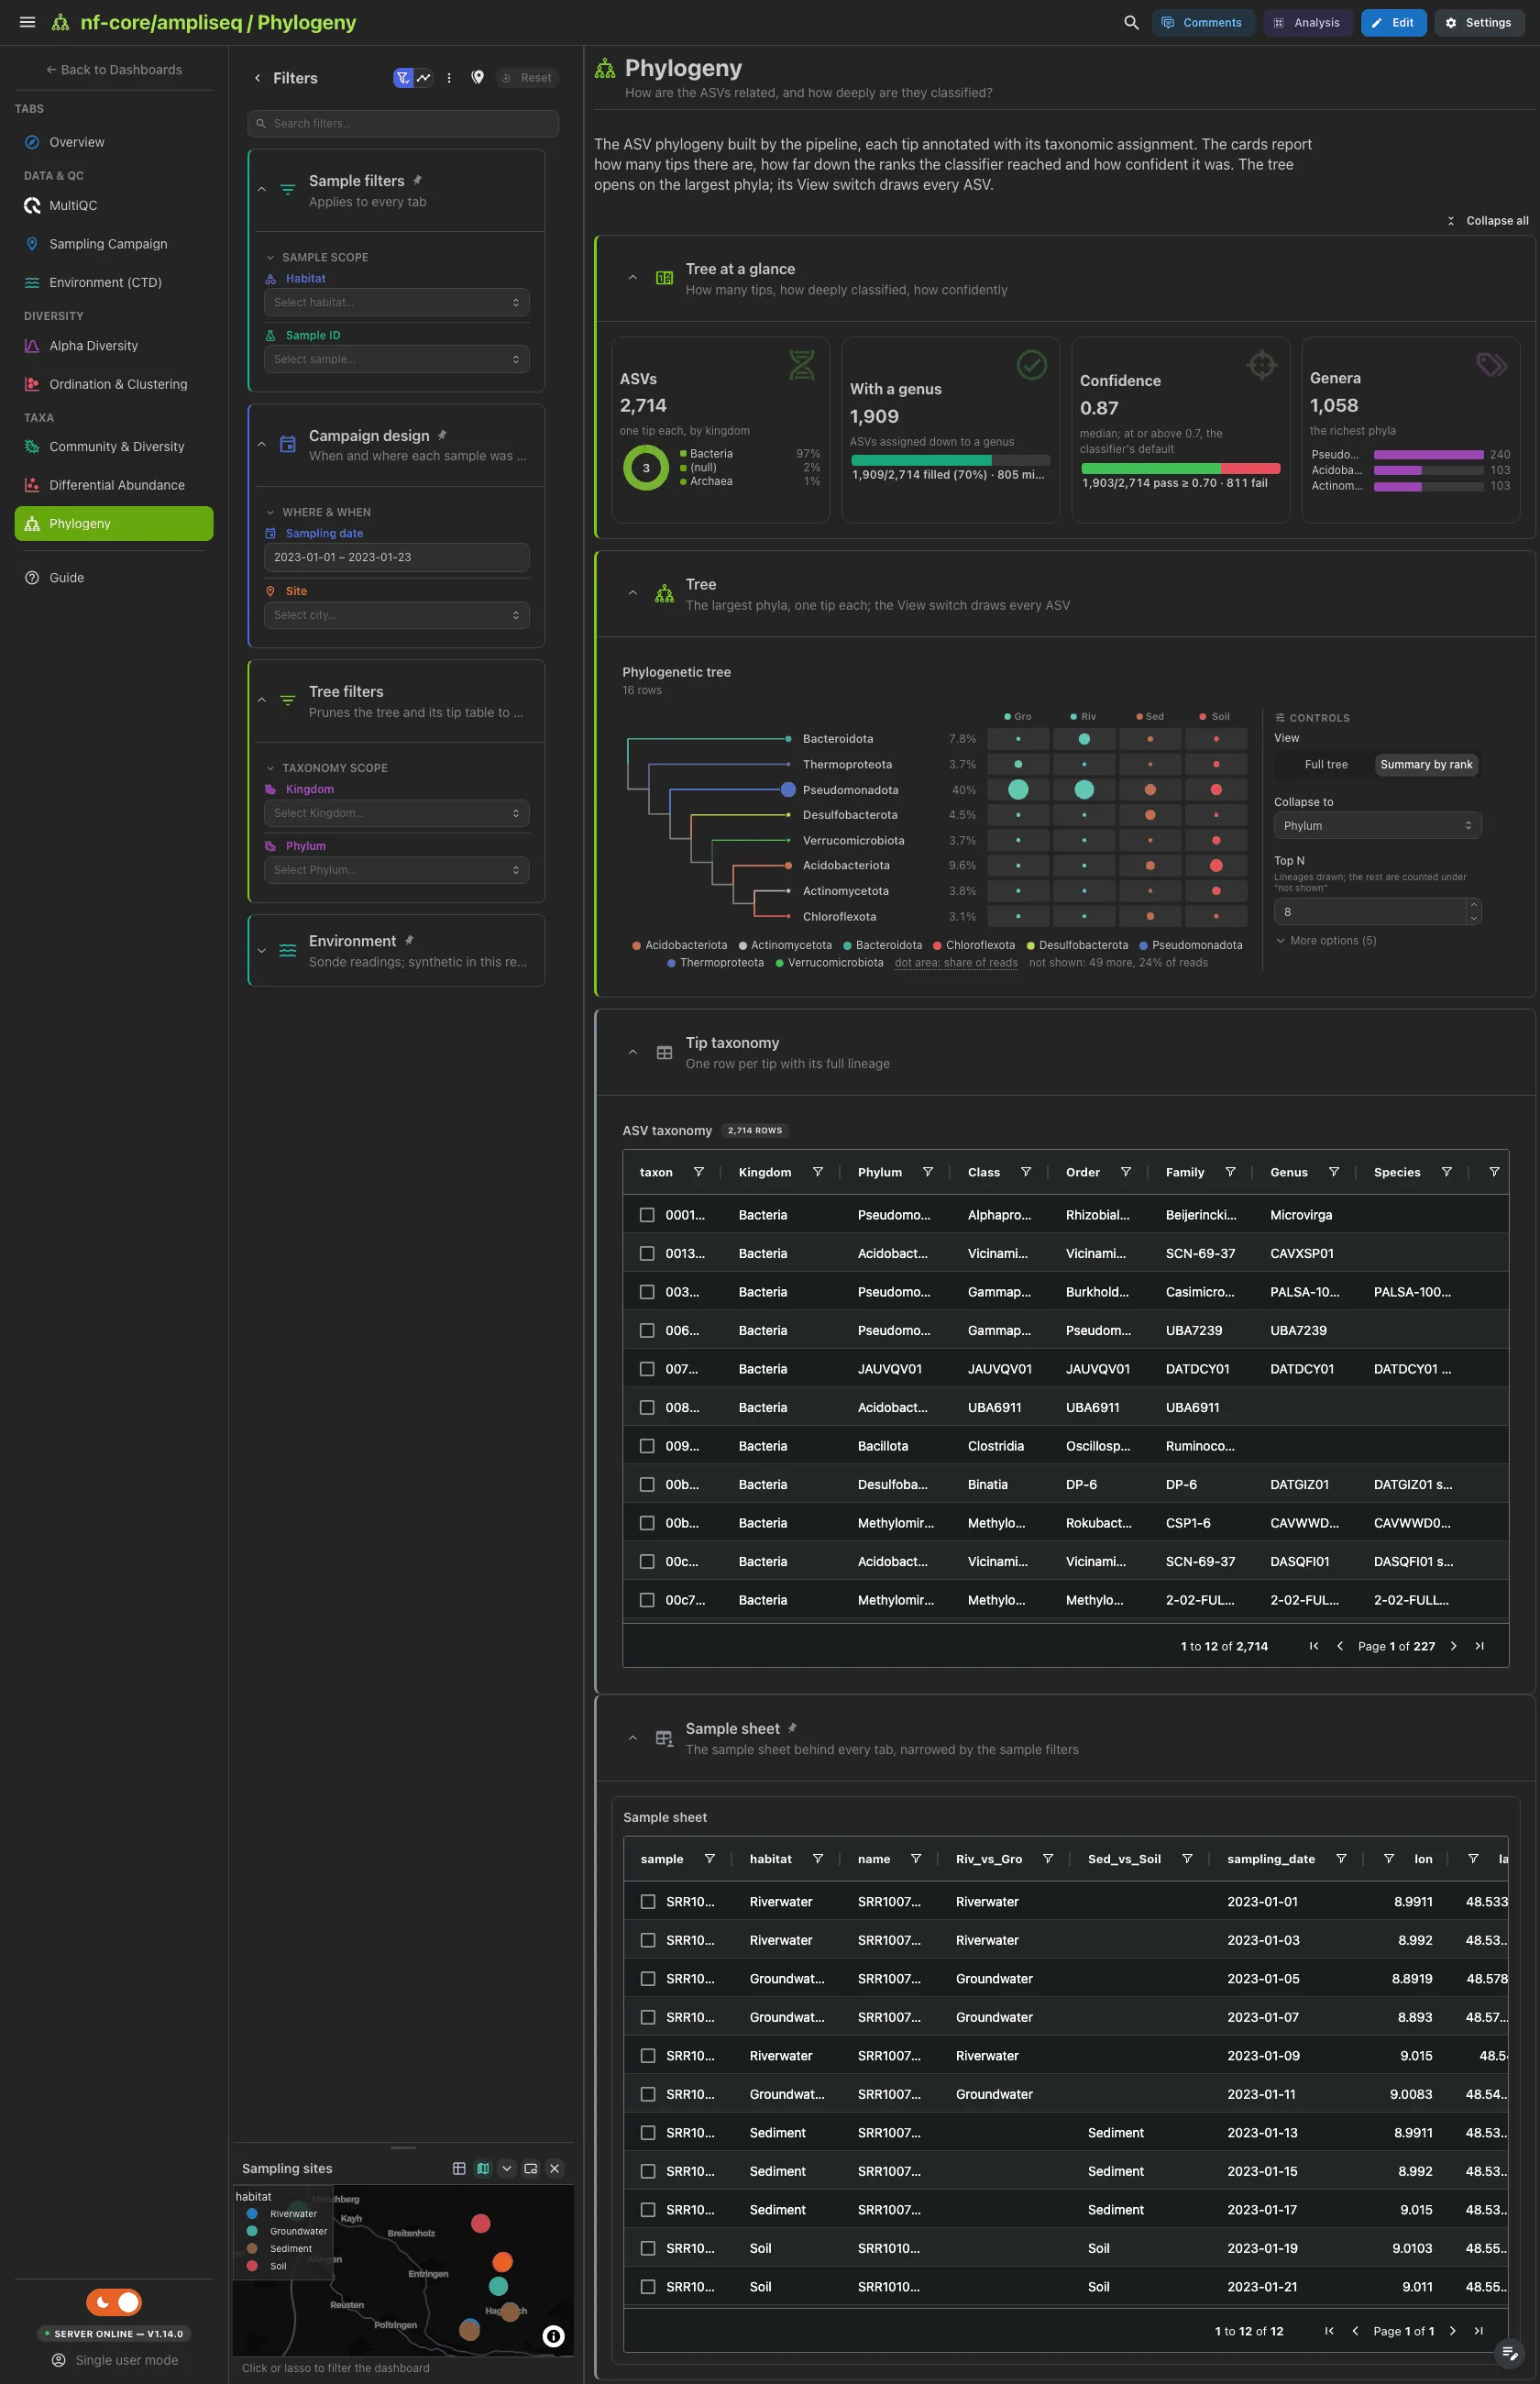
The ASVs, the share classified to genus, the median classifier confidence and the distinct genera. The tree opens on its summary, the eight largest phyla with their share of the reads per group; its View switch draws every ASV, coloured by any rank.
Filters and components
Filters · Kingdom and Phylum on
phylogenetic_tree_metadata_canonical, pruning the tree to one clade.
| Section | What it holds |
|---|---|
| Tree at a glance | 4 cards |
| Tree | 1 advanced visualization |
| Tip taxonomy (collapsed) | ASV taxonomy |
Taxa · What does the community rebuilt across amplicon regions contain?
Multi-region runs only
This tab is bound to sidle_reconstructed, which a single-region run never
writes. On such a run the self-adapting layout drops the tab entirely.
The reconstructed features, the samples that carry them, the phyla they resolve to and the mean number of regions per feature. Then the composition per sample, by phylum and by genus, and the reconstruction QC: regions and k-mer support per feature.
Filters and components
Filters · Phylum on sidle_reconstructed.
| Section | What it holds |
|---|---|
| Reconstruction at a glance | 4 cards |
| Composition | 2 bars |
| Reconstruction QC | 1 bar + 1 scatter |
| Tables (collapsed) | Reconstructed features per sample, Reconstruction support per feature |
The reference project adds two tabs
The Ammer catchment reference dashboard, seeded with the bundled demo data, adds two tabs to Data & QC: Sampling Campaign (where and when the catchment was sampled) and Environment (CTD) (sonde readings per sample, and the diversity they go with). Both are bound to metadata columns that only that dataset ships.
Tables select rows and the SIDLE k-mer scatter selects points: the pinned
sample sheet on the metadata id column, the alpha-diversity table on
sample_id, the two relative-abundance tables on taxonomy, the ANCOM-BC table
on id (which also drives the Taxon record), the tip taxonomy table on
taxon, and both SIDLE tables and the scatter on feature_id. A pick narrows the
other tiles of the same collection and, through the project links, the
collections downstream of it. The bar and box figures do not select, and the
ordination embedding narrows nothing, since its collection has no outgoing link.
Running the pipeline
Depictio reads the output of nf-core/ampliseq, it does not run the pipeline. Run the pipeline first:
nextflow run nf-core/ampliseq -r 2.18.0 \
  --input samplesheet.tsv \
  --FW_primer GTGYCAGCMGCCGCGGTAA \
  --RV_primer GGACTACNVGGGTWTCTAAT \
  --metadata Metadata.tsv \
  -profile docker --outdir results
Then point Depictio at the results:
See nf-co.re/ampliseq/usage for full pipeline documentation.
Required data structure
Point depictio ingest at the output directory of one run. Not every file is
required: the template adapts to what is present and to the route flags read
from params.json.
<DATA_ROOT>/
├── input/
│   ├── Samplesheet.tsv                            # auto-detected (or --var SAMPLESHEET_FILE)
│   └── Metadata.tsv                               # read from params.json (or --var METADATA_FILE)
├── pipeline_info/
│   ├── params_<timestamp>.json                    # route flags and the metadata path
│   └── software_versions.yml
├── multiqc/multiqc_data/
│   └── multiqc.parquet
├── qiime2/
│   ├── alpha-rarefaction/*.csv                    # requires --metadata
│   ├── diversity/alpha_diversity/
│   │   └── <metric>_vector/metadata.tsv           # shannon, observed_features, faith_pd, evenness
│   ├── barplot/level-<N>.csv                      # N = Phylum depth of the database
│   ├── rel_abundance_tables/rel-table-<N>.tsv     # Phylum down to Genus
│   ├── ancombc/differentials/                     # requires --metadata, skipped by --skip_ancom
│   │   └── Category-<GROUP_COL>-level-<N>/
│   │       └── {lfc,p_val,q_val,se,w}_slice.csv
│   └── phylogenetic_tree/tree.nwk                 # or --var TREE_FILE
├── dada2/ASV_table.tsv                            # --skip_qiime route only
├── sintax/ASV_tax_sintax.*.tsv                    # --skip_qiime route only
└── sidle/                                         # multi-region route only
    ├── reconstructed/reconstructed_merged.tsv
    └── DB/3_reconstructed/reconstruction_summary/metadata.tsv
Validation runs
The template is validated against the nf-core AWS megatest of the 2.18.0
release, a 16S run with sample metadata, and the screenshots above come from
the bundled Ammer catchment reference project resolved with
GROUP_COL=habitat. megatest.yaml lists the tables-only subset of that run
the template needs:
python scripts/nfcore_megatest.py fetch --pipeline ampliseq --version 2.18.0 --dest /tmp/ampliseq_test
depictio ingest /tmp/ampliseq_test --template nf-core/ampliseq/2.18.0 --var GROUP_COL=habitat
Do not pass --project when ingesting: the dashboard is attached to the
project by name, so renaming it breaks a later depictio dashboard import.
Re-ingesting accumulates dashboards, so delete the project before repeating a run.
Additional resources
- nf-co.re/ampliseq: official pipeline documentation
- nf-co.re/ampliseq/2.18.0/results: AWS test results
- Template System Reference: YAML format, variables, conditionals
- Recipes: how to read, test, and write recipes
Authorship
 weber8thomas
 Depictio team
Reviewing a template on your own data, or taking over a role here, is a contribution in itself: the contributing guide says what each one involves.