

The sarek template follows a variant-calling run from the reads to the genes the calls land on, and reads the VCFs themselves, so callers are compared call by call and gene by gene rather than only by how many calls each made:
- Overview: the run in four key figures, live findings and four figures, each linked to the tab that explains it
- Data & QC: read, mapping and recalibration panels from the pipeline's own MultiQC report, and the depth over the intervals with an X against Y sex check
- Variant calls: what each caller called and of what kind, how clean each callset looks, and which calls the callers share
- Annotation: SnpEff's consequences recomputed per call, the genes that carry the calls, and depth and calls at one region on one axis
The persistent Sample filters (status, patient, sample) sit in the left panel,
and a pick there reaches every per-sample collection and the MultiQC panels
through the sample links.
Concordance is agreement, not truth
Nothing in this template compares a callset against a benchmark truth set: "concordance" means agreement between callers and samples. For a truth-set benchmark, nf-core/variantbenchmarking has its own template.
Structural-variant callers call few SNPs
Manta and TIDDIT report a Ts/Tv of 0.0 in bcftools stats, which is the
caller doing its job. Every Ts/Tv card and filter keeps only ts_tv > 0, so
they do not drag the medians down.
Quick start
The results directory is the only thing you have to pass. The sample hub is built
from the CSV manifests sarek writes under csv/ (patient, sex, status and
the callers run per sample), so the launch samplesheet is not needed. If the
run was aligned to another assembly than hg38, name it so the locus tracks
draw the right axis and gene lane:
| Variable | Default | Role |
|---|---|---|
GENOME |
hg38 |
UCSC name of the assembly (hg38, hg19, mm10): the axis and gene lane of every locus track |
depictio config nextflow --install     # once per machine
nextflow run nf-core/sarek -r 3.10.0 -profile docker --outdir results
No depictio ingest, and no template named: the pipeline ingests its own
output directory when it finishes and resolves this template from its own
manifest. See Nextflow trigger.
Reference
The template reads the native MultiQC report, the per-caller bcftools stats and
VCFtools summaries, mosdepth's coverage files, the called VCFs, and SnpEff's
annotated VCFs, CSV statistics and per-gene tables. The caller and the sample
live only in the directory path (reports/<tool>/<caller>/<sample>/), so raw
scans carry the path into the table and recipes read both off it. sarek runs
mosdepth on the duplicate-marked and on the recalibrated CRAM; the coverage
recipes keep one pass per sample, so no tile counts a sample twice.
Self-adapting layout
The dashboard adapts to whatever the run actually produced: components bound
to pruned or unparsed data collections are hidden, tabs left with no real
visualizations are dropped entirely, and the remaining components are
re-packed so there are no empty rows. A run without SnpEff in --tools
drops the Consequences and Genes tabs instead of failing to ingest.
Template variables
Variables you provide when running the template: DATA_ROOT is the results directory given to depictio ingest, the others are set with --var NAME=value:
| Variable | Required | Description |
|---|---|---|
DATA_ROOT |
✓ | Root directory of the sarek output (csv/, reports/, variant_calling/, annotation/, multiqc/, pipeline_info/). |
GENOME |
— | UCSC name of the assembly the run was aligned to (hg38, hg19, mm10): the axis and gene lane of every locus track. |
Data collections
37 data collections — 17 required 20 optional · 17 direct 20 derived.
Origin tells you whether a collection is real pipeline data or a reshape of it: direct = a pipeline output (scanned, or a recipe that reads raw files); derived = a recipe that reshapes one or more direct collections into the layout a visualization needs (no new measurement). Reads shows what produces it: a recipe .py transform, whose name links to its source on GitHub, or a raw file scanned off disk. (A direct collection can still have a recipe — one that merely parses/cleans the raw file; derived means the recipe reshapes another collection.)
| Tag | Origin | Type | Reads | Status |
|---|---|---|---|---|
samples |
direct | Table | recipe nf-core/sarek/samples.py |
required |
multiqc_data |
direct |  MultiQC MultiQC |
file (?:.*/)?multiqc(?:/[^/]+)?/multiqc_data/multiqc.parquet$ |
required |
bcftools_stats_raw |
direct | Table | file .*.bcftools_stats.txt$ |
required |
bcftools_stats_summary |
derived | Table | recipe bcftools/stats_summary.py |
required |
bcftools_stats_tstv |
derived | Table | recipe bcftools/stats_tstv.py |
required |
bcftools_stats_sections |
derived | Table | recipe bcftools/stats_sections.py |
required |
bcftools_substitution_spectrum |
derived | Table | recipe nf-core/sarek/substitution_spectrum.py |
required |
bcftools_indel_spectrum |
derived | Table | recipe nf-core/sarek/indel_spectrum.py |
required |
mosdepth_regions_raw |
direct | Table | file .*.regions.bed.gz$ |
required |
mosdepth_regions |
derived | Table | recipe mosdepth/regions.py |
required |
mosdepth_targets |
derived | Table | recipe nf-core/sarek/mosdepth_targets.py |
required |
mosdepth_windows |
derived | Table | recipe nf-core/sarek/mosdepth_windows.py |
required |
mosdepth_summary_raw |
direct | Table | file .*.mosdepth.summary.txt$ |
required |
mosdepth_summary |
derived | Table | recipe mosdepth/summary.py |
required |
mosdepth_xy_sex_check |
direct | Table | recipe mosdepth/xy_sex_check.py |
optional |
vcftools_filter_summary_raw |
direct | Table | file .*.FILTER.summary$ |
optional |
vcftools_filter_summary |
derived | Table | recipe vcftools/filter_summary.py |
optional |
vcftools_tstv_qual_raw |
direct | Table | file .*.TsTv.qual$ |
optional |
vcftools_tstv_qual |
derived | Table | recipe vcftools/tstv_qual.py |
optional |
vcf_calls_raw |
direct | Table | file ^(?!._(?:snpEff|VEP).ann.vcf.gz$)(?!..g(?:enome)?.vcf.gz$).*.vcf.gz$ |
required |
vcf_variants |
derived | Table | recipe vcf/variants.py |
required |
snpeff_ann_vcf_raw |
direct | Table | file .*_snpEff.ann.vcf.gz$ |
optional |
snpeff_ann_variants |
derived | Table | recipe snpeff/ann_variants.py |
optional |
snpeff_variant_upset |
derived | Table | recipe snpeff/variant_upset.py |
optional |
snpeff_protein_lollipop |
derived | Table | recipe snpeff/protein_lollipop.py |
optional |
snpeff_csv_raw |
direct | Table | file .*_snpEff.csv$ |
optional |
snpeff_csv_stats |
derived | Table | recipe snpeff/csv_stats.py |
optional |
snpeff_genes_raw |
direct | Table | file .*_snpEff.genes.txt$ |
optional |
snpeff_genes |
derived | Table | recipe snpeff/genes.py |
optional |
snpeff_gene_upset |
derived | Table | recipe snpeff/gene_upset.py |
optional |
snpeff_gene_heatmap |
derived | Table | recipe snpeff/gene_heatmap.py |
optional |
callset_qc |
derived | Table | recipe nf-core/sarek/callset_qc.py |
required |
snpeff_vcf_files |
direct | indexed_file | file ^(?!..(?:manta|tiddit).)._snpEff.ann.vcf.gz$ |
optional |
ascat_segments |
direct | Table | file .*.cnvs.txt$ |
optional |
cnvkit_segments |
direct | Table | file .*.call.cns$ |
optional |
msisensorpro_summary |
direct | Table | file .msisensorpro.(?<!_dis)(?<!_germline)(?<!_somatic)$ |
optional |
ngscheckmate_matches |
direct | Table | file .*_all.txt$ |
optional |
Cross-DC links
33 links — selecting a value in the source collection filters the target. The join column is shown after the source.
| Source · column | Target | Filters | |
|---|---|---|---|
samples · sample_id |
→ | multiqc_data |
Filter every MultiQC panel by the samples picked in the left panel, through sarek's per-tool sample names |
samples · sample_id |
→ | mosdepth_regions |
Filter the coverage track by the samples picked in the left panel |
samples · sample_id |
→ | mosdepth_summary |
Filter the per-contig coverage summary by the samples picked in the left panel |
samples · sample_id |
→ | mosdepth_xy_sex_check |
Filter the sex check by the samples picked in the left panel |
samples · sample_id |
→ | bcftools_stats_sections |
Filter the bcftools distributions by the samples picked in the left panel |
samples · sample_id |
→ | vcftools_filter_summary |
Filter the FILTER breakdown by the samples picked in the left panel |
samples · sample_id |
→ | vcftools_tstv_qual |
Filter the quality sweeps by the samples picked in the left panel |
samples · sample_id |
→ | vcf_variants |
Filter the variant calls by the samples picked in the left panel |
samples · sample_id |
→ | snpeff_ann_variants |
Filter the annotated calls by the samples picked in the left panel |
samples · sample_id |
→ | snpeff_protein_lollipop |
Filter the coding variants by the samples picked in the left panel |
samples · sample_id |
→ | snpeff_csv_stats |
Filter the annotation composition by the samples picked in the left panel |
samples · sample_id |
→ | snpeff_genes |
Filter the per-gene burden by the samples picked in the left panel |
bcftools_stats_summary · caller |
→ | bcftools_stats_sections |
Carry the caller picked on the variant-yield tab over to the bcftools distributions |
bcftools_stats_summary · caller |
→ | vcftools_filter_summary |
Carry the caller picked on the variant-yield tab over to the FILTER breakdown |
bcftools_stats_summary · caller |
→ | vcftools_tstv_qual |
Carry the caller picked on the variant-yield tab over to the quality sweeps |
vcf_variants · caller |
→ | snpeff_ann_variants |
Carry the caller picked on the concordance tab over to the annotated calls |
snpeff_csv_stats · caller |
→ | snpeff_ann_variants |
Carry the caller picked on the consequences tab over to the annotated calls |
snpeff_genes · caller |
→ | snpeff_protein_lollipop |
Carry the caller picked on the genes tab over to the coding variants |
snpeff_genes · gene_name |
→ | snpeff_protein_lollipop |
Open a gene picked in the burden table on the lollipop below it |
samples · sample_id |
→ | bcftools_stats_summary |
Filter the per-caller variant counts by the samples picked in the left panel |
samples · sample_id |
→ | bcftools_stats_tstv |
Filter the per-caller Ts/Tv ratios by the samples picked in the left panel |
bcftools_stats_summary · caller |
→ | bcftools_stats_tstv |
Carry the caller picked on the MultiQC tab over to its Ts/Tv rows |
bcftools_stats_summary · sample |
→ | bcftools_stats_tstv |
Carry a sample selected on the variant counts table over to its Ts/Tv rows |
mosdepth_windows · chrom |
→ | mosdepth_targets |
A region typed or brushed on the depth navigator narrows the per-target depth track |
mosdepth_windows · chrom |
→ | vcf_variants |
A region typed or brushed on the depth navigator narrows the calls track |
samples · sample_id |
→ | mosdepth_windows |
Filter the depth navigator by the samples picked in the left panel |
samples · sample_id |
→ | mosdepth_targets |
Filter the per-target depth track by the samples picked in the left panel |
samples · sample_id |
→ | bcftools_substitution_spectrum |
Filter the substitution spectrum by the samples picked in the left panel |
samples · sample_id |
→ | bcftools_indel_spectrum |
Filter the indel length spectrum by the samples picked in the left panel |
samples · sample_id |
→ | callset_qc |
Filter the callset QC profile by the samples picked in the left panel |
bcftools_stats_summary · caller |
→ | bcftools_substitution_spectrum |
Carry the caller picked on the Variant yield tab over to the substitution spectrum |
bcftools_stats_summary · caller |
→ | bcftools_indel_spectrum |
Carry the caller picked on the Variant yield tab over to the indel length spectrum |
bcftools_stats_summary · caller |
→ | callset_qc |
Carry the caller picked on the Variant yield tab over to the callset QC profile |
Recipes
Each recipe reshapes raw pipeline output into a tidy table. The name links to its source; Output lists the validated OUTPUT_SCHEMA columns.
| Recipe | Transforms | Output |
|---|---|---|
bcftools/stats_sections.py |
The distribution blocks of bcftools stats, melted into one long frame. |
sample, caller, section, bin, label, count |
bcftools/stats_summary.py |
Per-sample, per-caller variant record counts from bcftools stats. |
sample, caller, n_records, n_no_alts, n_snps, n_mnps, n_indels, n_others, n_multiallelic_sites, n_multiallelic_snp_sites, snp_fraction, log10_n_records |
bcftools/stats_tstv.py |
Per-sample, per-caller transition/transversion ratio from bcftools stats. |
sample, caller, ts, tv, ts_tv, ts_1st_alt, tv_1st_alt, ts_tv_1st_alt |
mosdepth/regions.py |
Per-target mosdepth depth, binned into a genome-wide coverage track. | chromosome, position, end, value, sample, stage, sample_stage, n_targets |
mosdepth/summary.py |
Per-contig coverage summary written by mosdepth. | sample, stage, scope, chrom, length, bases, mean_depth, min_depth, max_depth |
mosdepth/xy_sex_check.py |
X and Y mean depth per library, and the sex the ratio is consistent with. | sample, stage, x_coverage, y_coverage, xy_ratio, inferred_sex |
nf-core/sarek/callset_qc.py |
One QC profile per callset (sample and caller), for a parallel-coordinates tile. | callset, sample, caller, n_records, snp_fraction, ts_tv, multiallelic_pct, pass_pct, het_hom_ratio, median_dp, median_het_vaf |
nf-core/sarek/indel_spectrum.py |
Indel length spectrum per callset, from the IDD block of bcftools stats. |
sample, caller, callset, length, indel_class, count, fraction |
nf-core/sarek/mosdepth_targets.py |
Per-target mosdepth depth, unbinned, for the Cohort QC locus section. | chrom, pos, end, depth, sample, stage, sample_stage, target_bp |
nf-core/sarek/mosdepth_windows.py |
The 1 Mb mosdepth windows under the column names the locus section shares. | chrom, pos, end, depth, sample, stage, sample_stage, n_targets |
nf-core/sarek/samples.py |
One row per sarek sample, from the CSV manifests sarek publishes under csv/. | sample_id, patient, sex, status, status_label, n_callers |
nf-core/sarek/substitution_spectrum.py |
SNV substitution spectrum per callset, folded onto the six pyrimidine classes. | sample, caller, callset, substitution_class, mutation_class, count, fraction |
snpeff/ann_variants.py |
One row per annotated variant call, read from SnpEff's annotated VCF. | sample, caller, chrom, pos, variant_key, ref, alt, variant_type, qual, filter_status, is_pass, gt, dp, vaf, gene, gene_id, impact, consequence, hgvs_p, aa_pos |
snpeff/csv_stats.py |
The composition sections of SnpEff's CSV summary, melted into one long frame. | sample, caller, section, category, count, percent |
snpeff/gene_heatmap.py |
Gene by callset burden matrix, for a clustered heatmap. | gene_name |
snpeff/gene_upset.py |
Gene-level caller overlap: one row per gene, one 0/1 column per caller. | gene_name |
snpeff/genes.py |
Per-gene variant counts by impact class, from SnpEff's gene effect table. | sample, caller, gene_name, gene_id, biotype, n_high, n_low, n_moderate, n_modifier, n_variants, n_coding |
snpeff/protein_lollipop.py |
Coding variants positioned along their protein, for a lollipop track. | sample, caller, gene, aa_pos, impact, consequence, hgvs_p, variant_key, vaf |
snpeff/variant_upset.py |
Variant-level caller overlap: one row per variant, one 0/1 column per caller. | variant_key |
vcf/variants.py |
One row per variant call, read from the VCFs themselves. | sample, caller, chrom, pos, variant_key, ref, alt, variant_type, qual, filter_status, is_pass, gt, dp, vaf |
vcftools/filter_summary.py |
How a caller's own FILTER column partitions its calls. | sample, caller, filter_label, n_variants, n_ts, n_tv, ts_tv, is_pass, pct_of_calls |
vcftools/tstv_qual.py |
Transition/transversion ratio as a function of the quality floor. | sample, caller, series, qual_threshold, n_ts_above, n_tv_above, ts_tv_above |
Dashboard tabs
One dashboard: the Overview, then eight child tabs in three groups, read as a funnel from the reads to the genes the calls hit and one region of the genome. Each tab below carries the same icon and colour the dashboard gives it, so the page and the app read alike.
| Group | Tabs |
|---|---|
| Data & QC | MultiQC, Coverage |
| Variant calls | Variant yield, Call quality, Caller concordance |
| Annotation | Consequences, Genes, Locus |
Each child tab opens with a short intro and a strip of four cards, then at most three open sections; tables follow, collapsed. The template has no group column: the sample hub is built from sarek's CSV manifests and carries the patient, sex, status and the callers run per sample. A callset is one caller on one sample. The persistent Sample filters (status, patient, sample) sit in the left panel and narrow every tab through the sample links. The Sample sheet is pinned, collapsed, to the bottom of every child tab.
Germline variant calls, from coverage to the genes they hit.
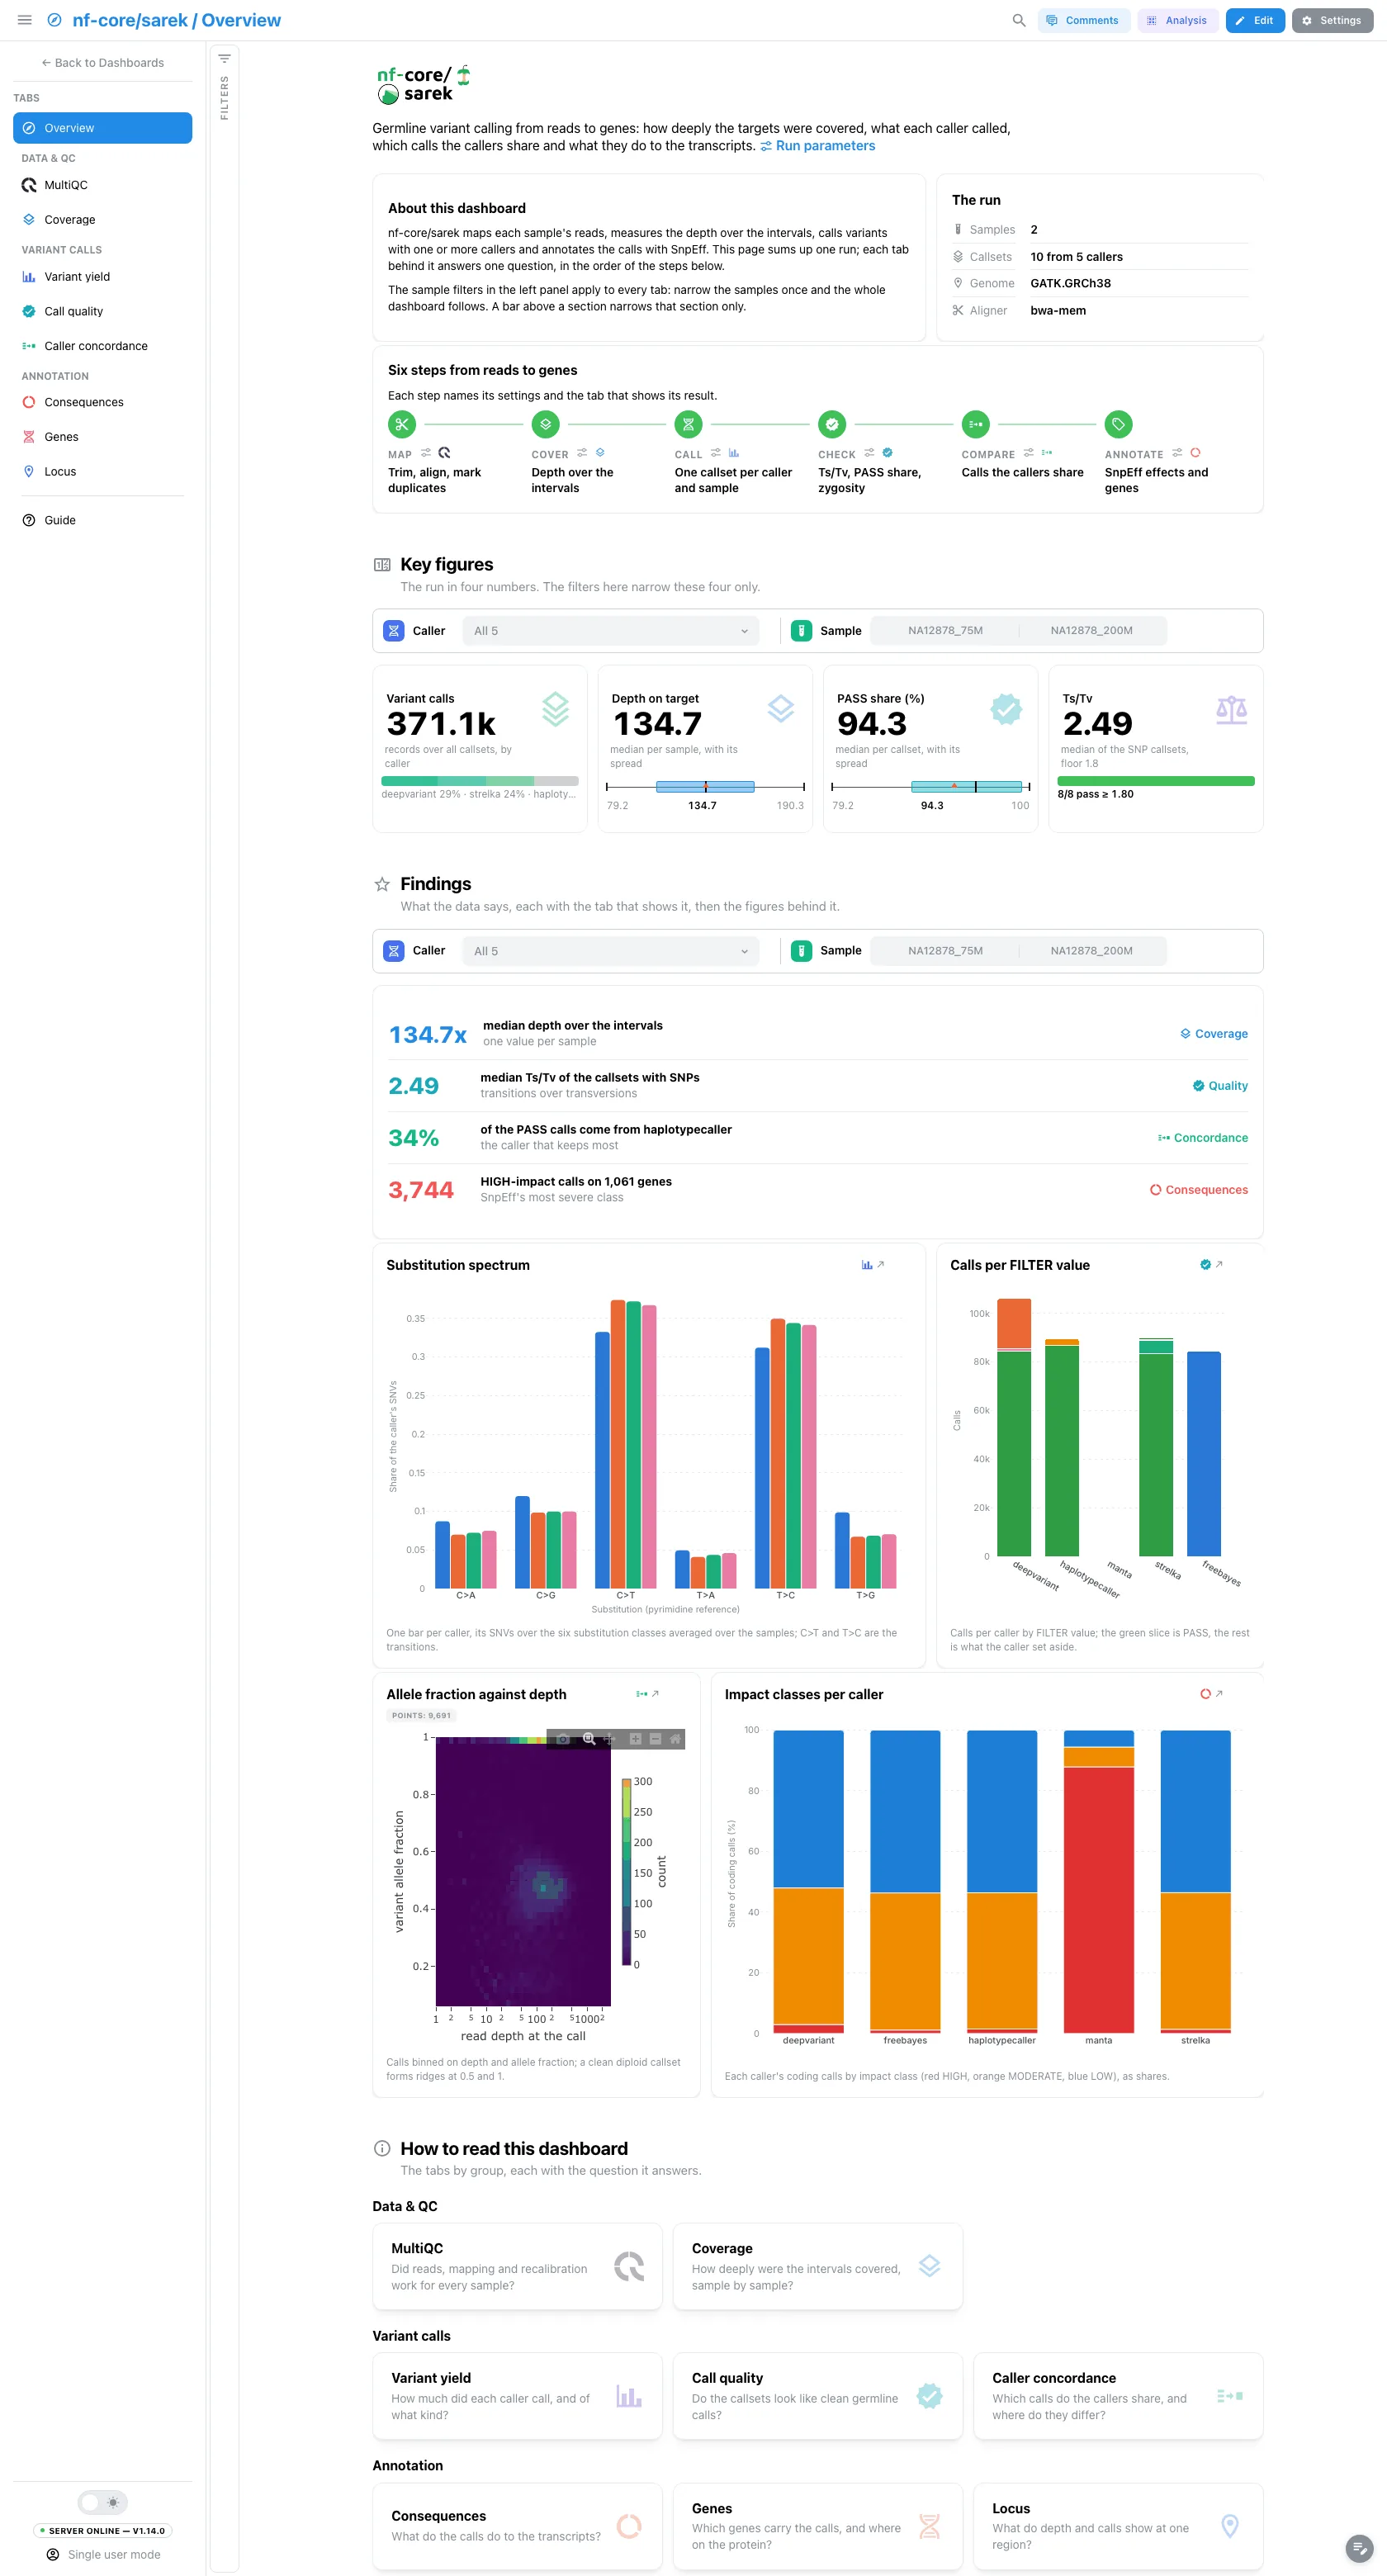
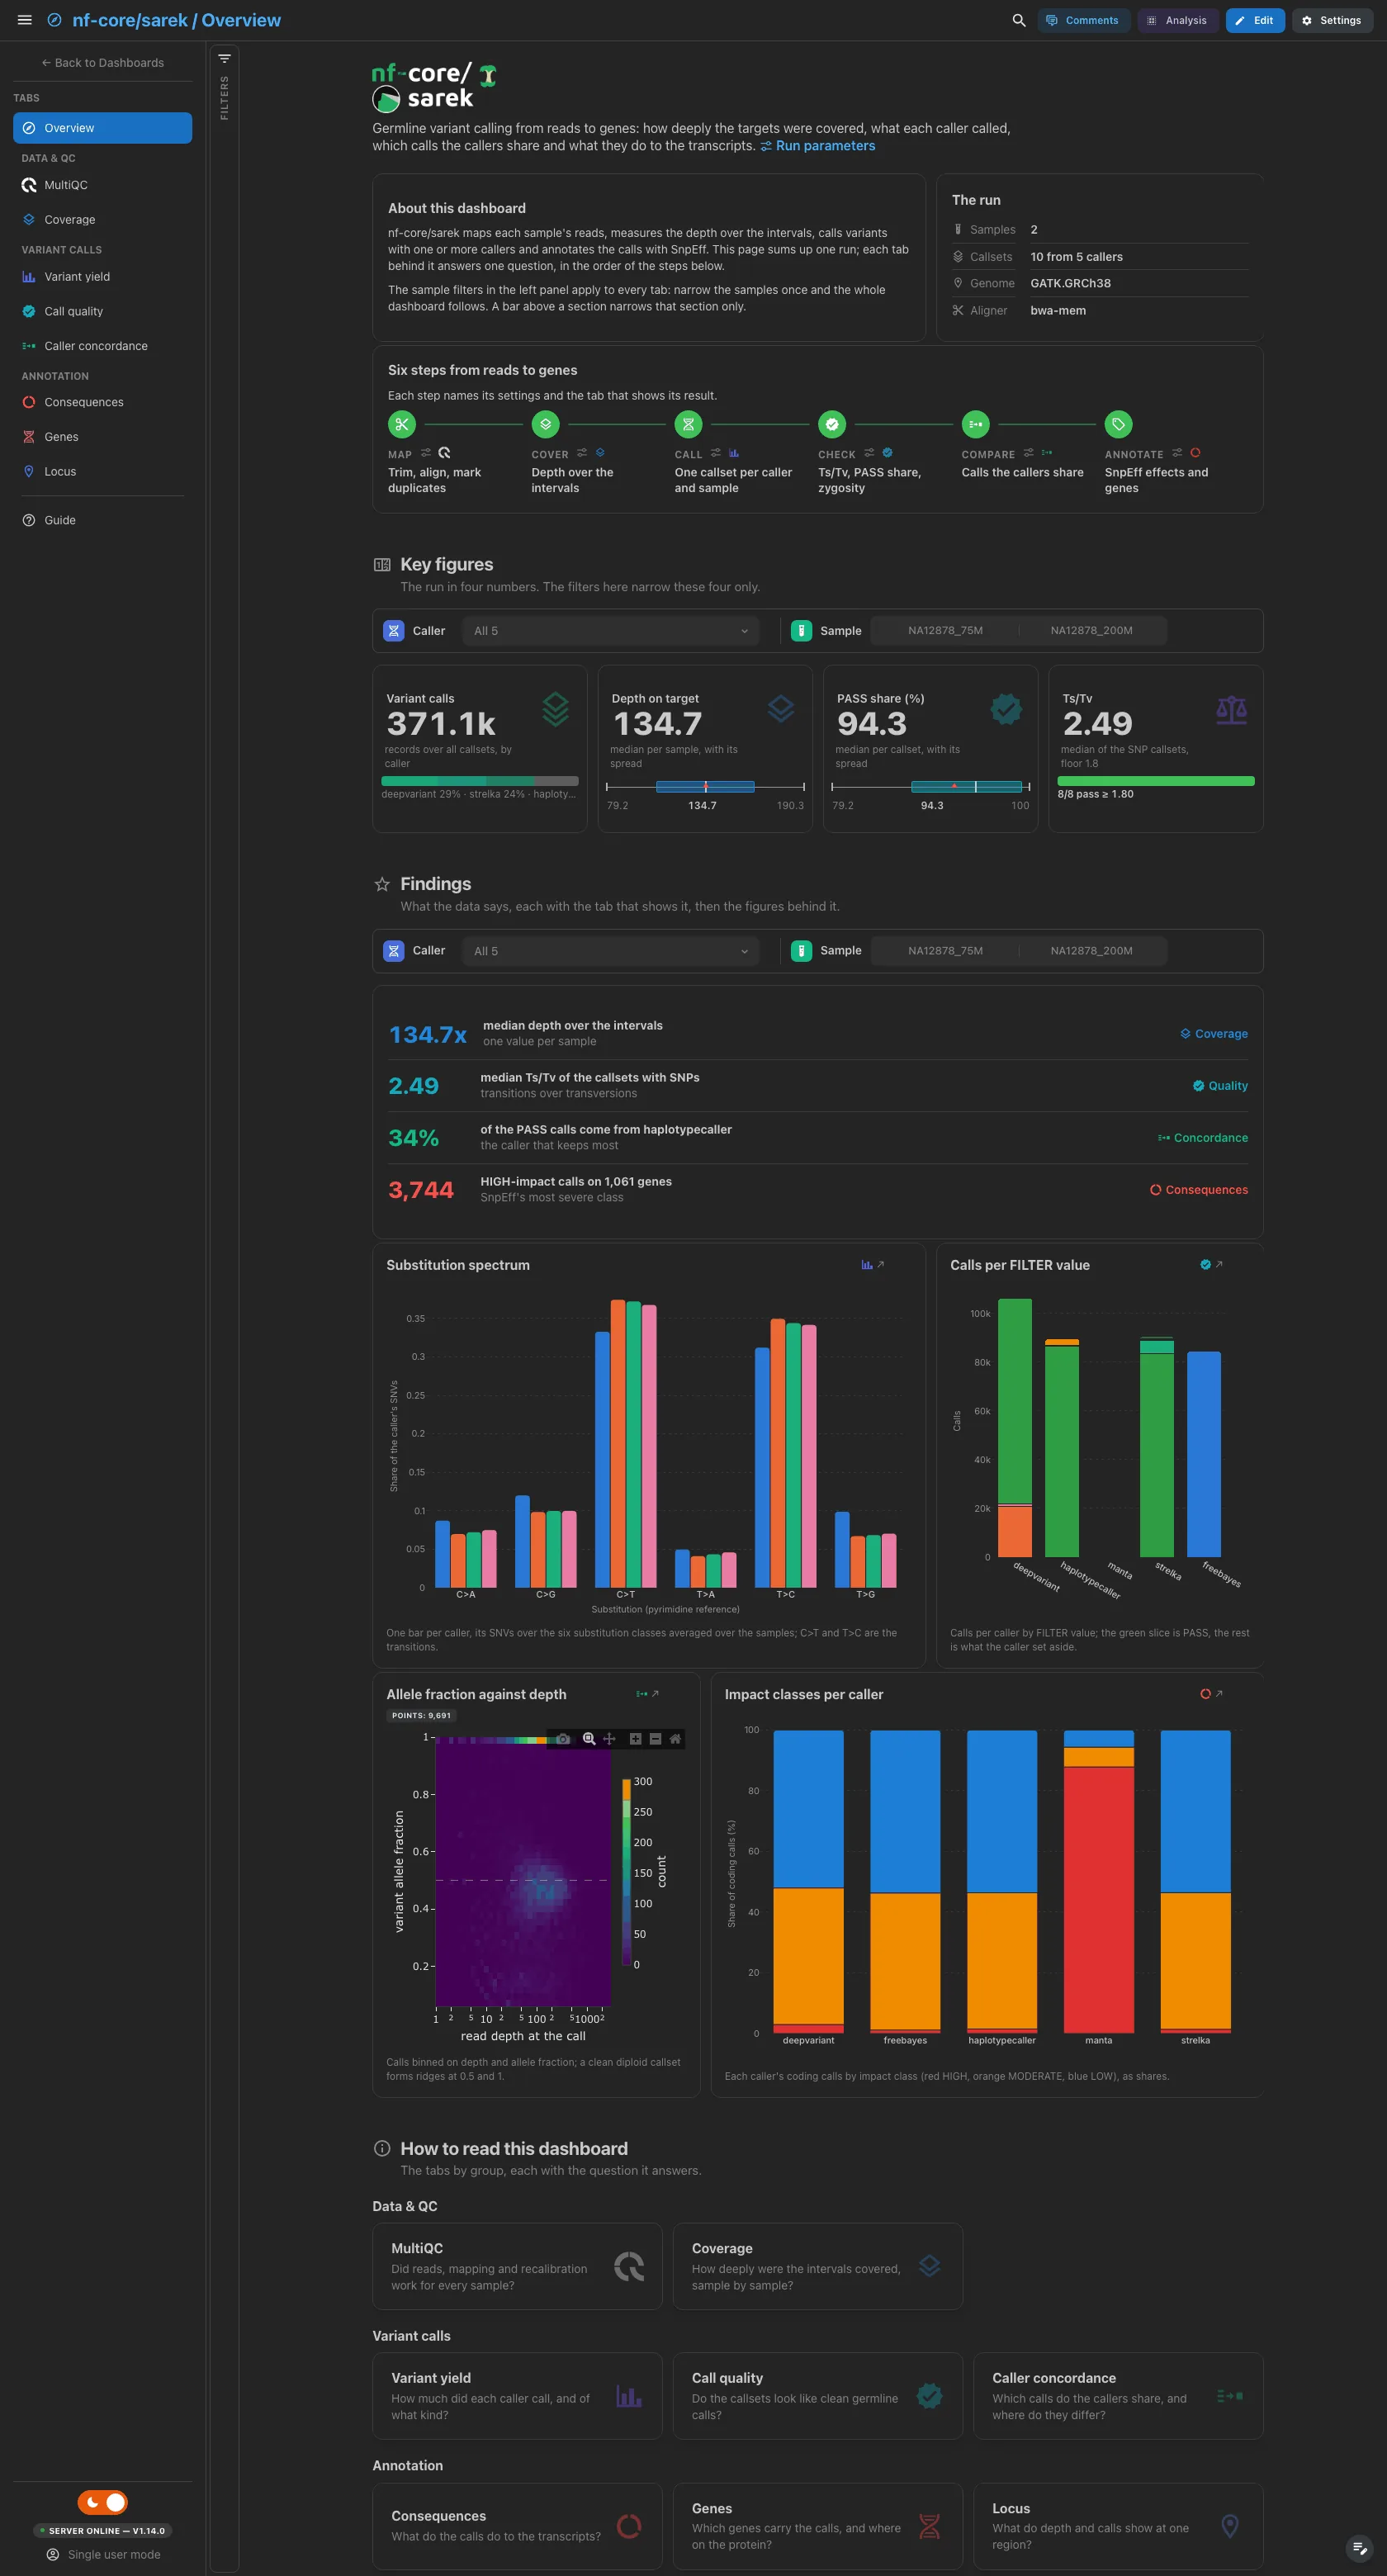
A short hero links the run parameters. About this dashboard says how the two filter levels work, The run lists the samples, the callsets and the callers they come from, the genome and the aligner, and Pipeline walks the six steps from mapping to annotation, each linked to the parameters that drive it and its tab. The findings are live values: they follow the filters, and a run without SnpEff drops the HIGH-impact row and the impact figure.
Filters and components
Filters · the left panel starts collapsed. Key figures and Findings each have their own filter bar (the caller and the sample id): each narrows its own section only.
| Section | What it holds |
|---|---|
| Top | Hero, About this dashboard, The run, Pipeline |
| Key figures | 4 headline cards: variant calls by caller, depth on target, PASS share, Ts/Tv against a 1.8 floor |
| Findings | Live result rows, then 4 figures: the substitution spectrum, the calls per FILTER value, allele fraction against depth and the impact classes per caller |
| How to read this dashboard | The tabs by group, each with its question |
Data & QC · Did reads, mapping and recalibration work for every sample?
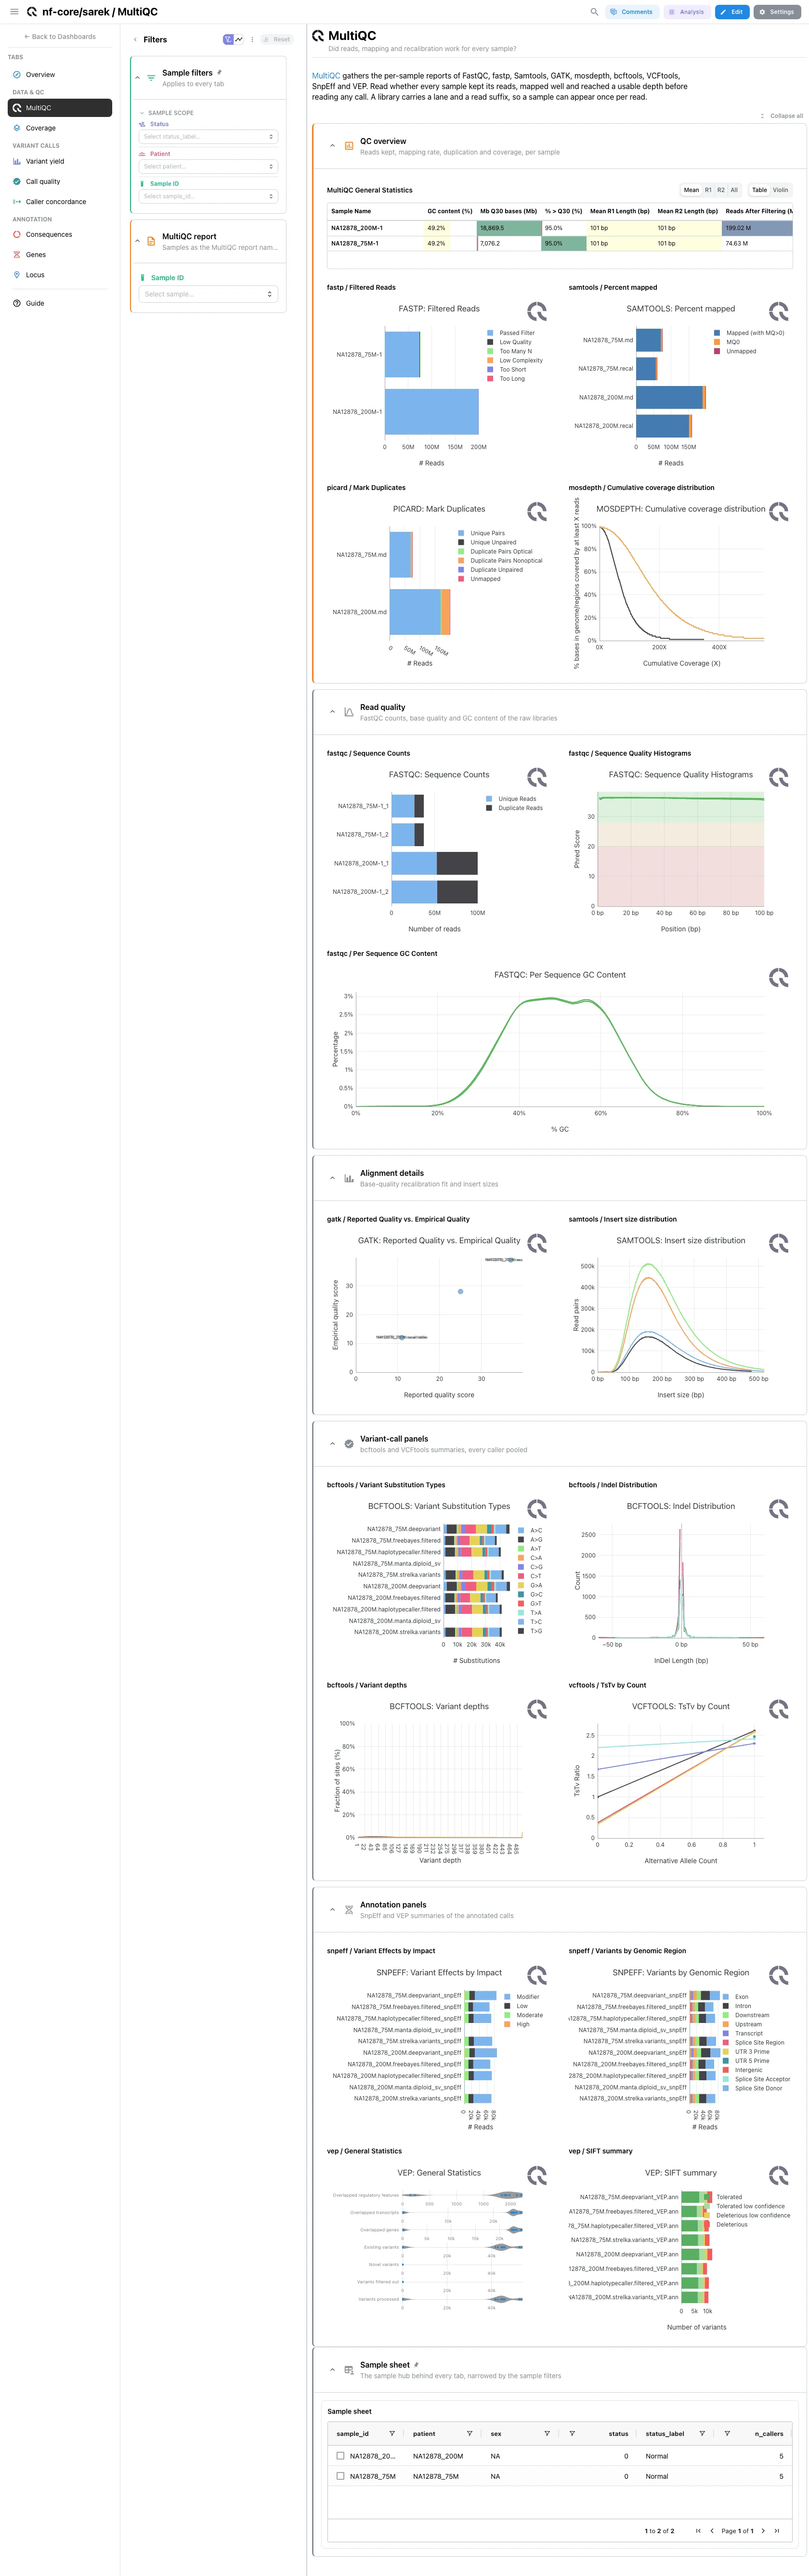
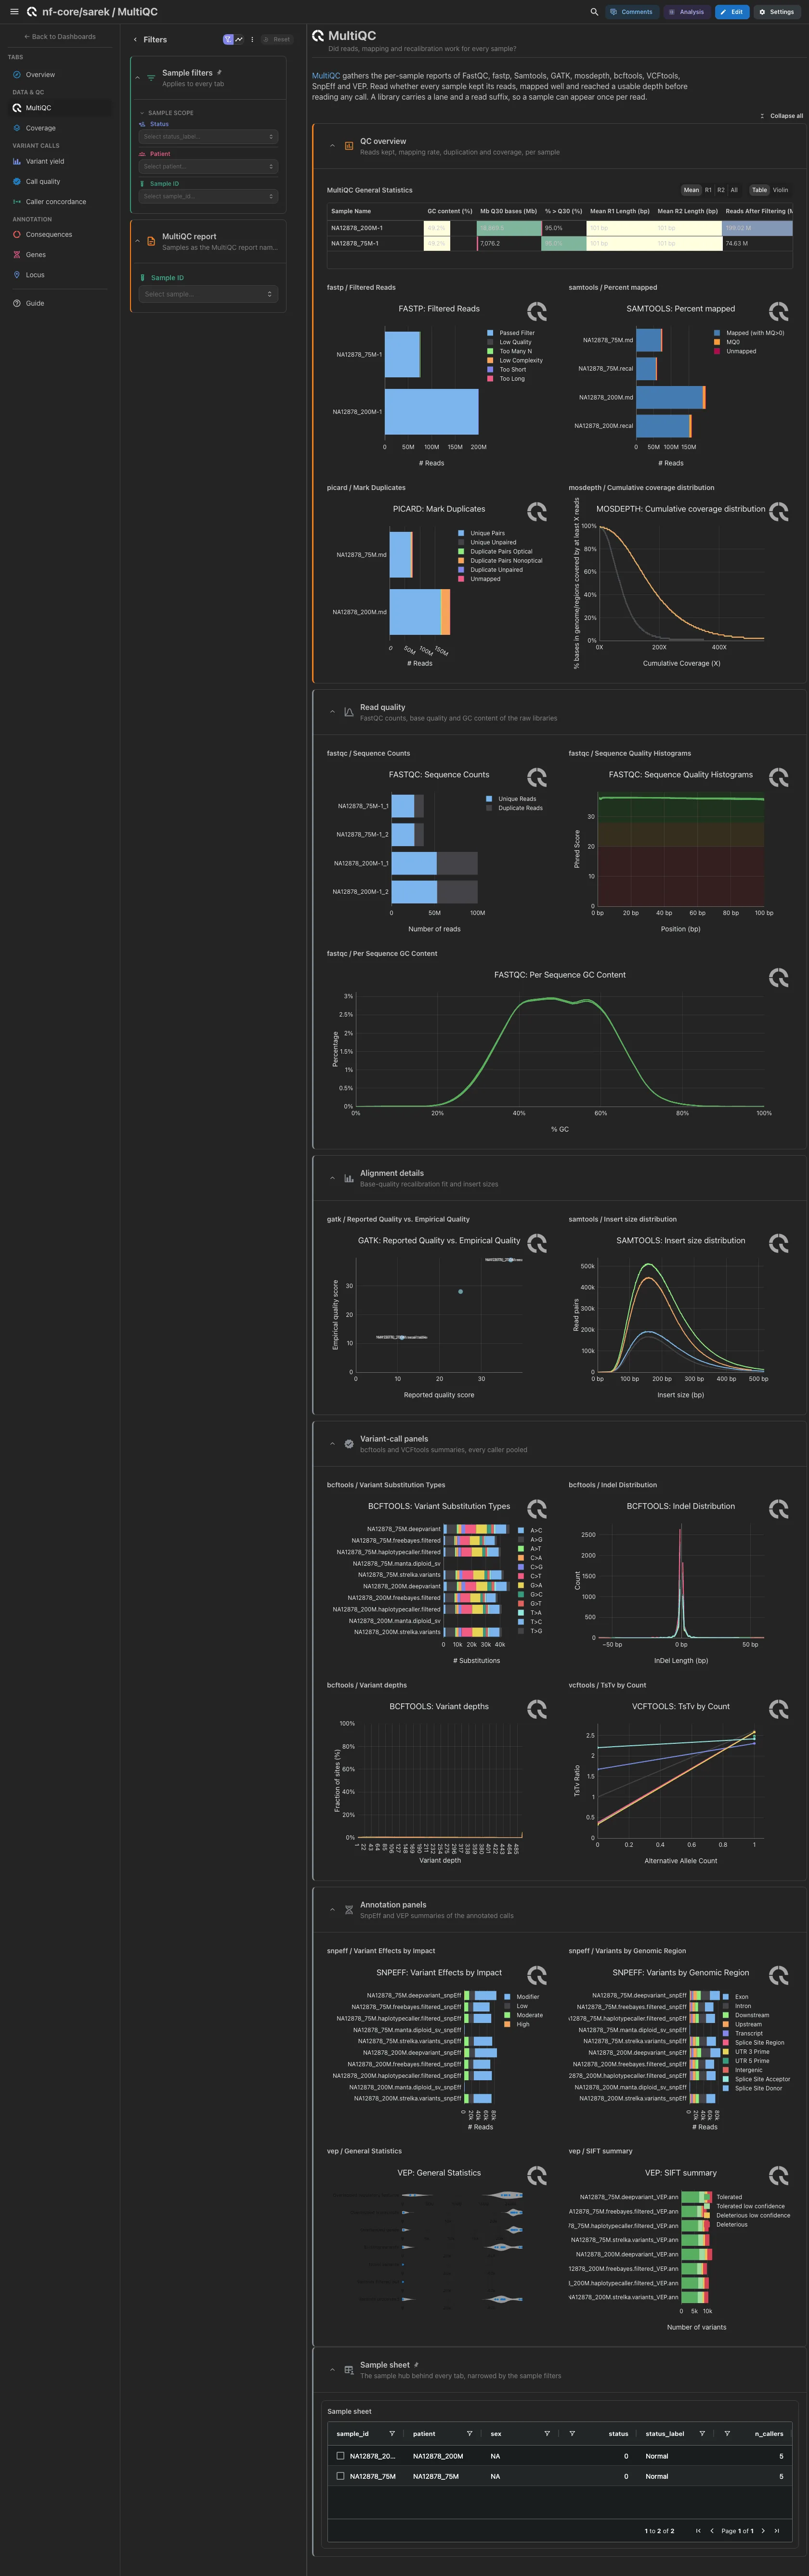
MultiQC panels only, from the run's native report. Open: general statistics, fastp filtered reads, Samtools percent mapped, MarkDuplicates and the mosdepth cumulative coverage. Collapsed: the FastQC panels, the BQSR fit and insert sizes, the bcftools and VCFtools panels with every caller pooled, and the SnpEff and VEP panels. A library carries a lane and a read suffix in the report, so a sample can appear once per read.
Filters and components
Filters · Sample ID, read from the MultiQC report.
| Section | What it holds |
|---|---|
| QC overview | 5 MultiQC panels |
| Read quality (collapsed) | 3 MultiQC panels |
| Alignment details (collapsed) | 2 MultiQC panels |
| Variant-call panels (collapsed) | 4 MultiQC panels |
| Annotation panels (collapsed) | 4 MultiQC panels |
Data & QC · How deeply were the intervals covered, sample by sample?
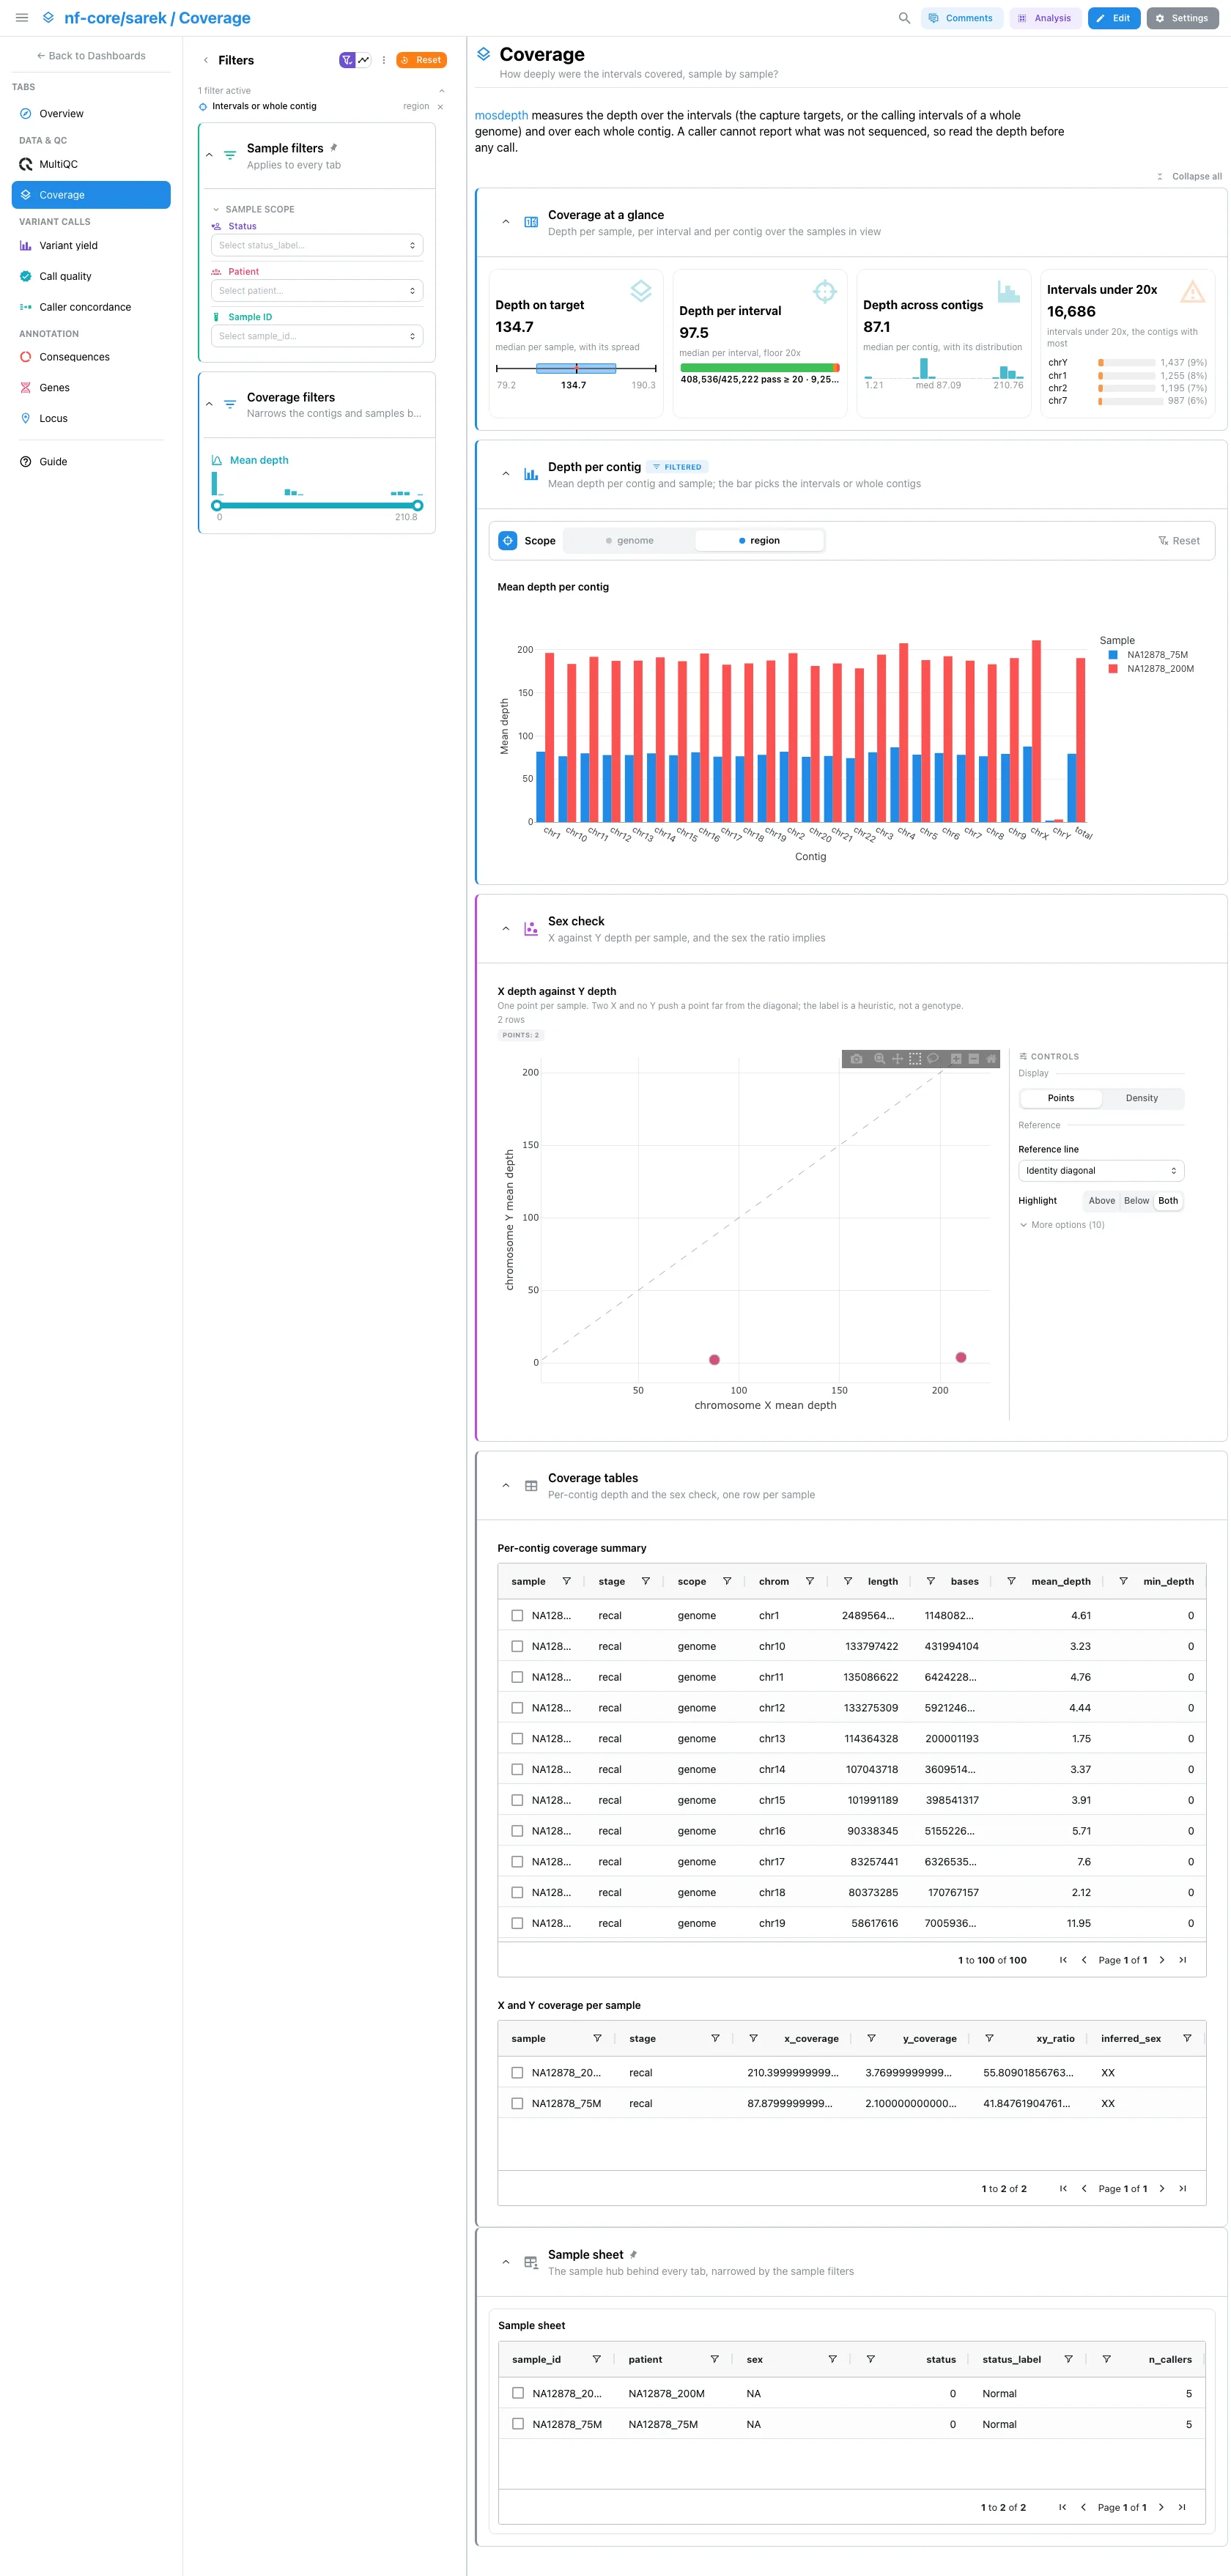
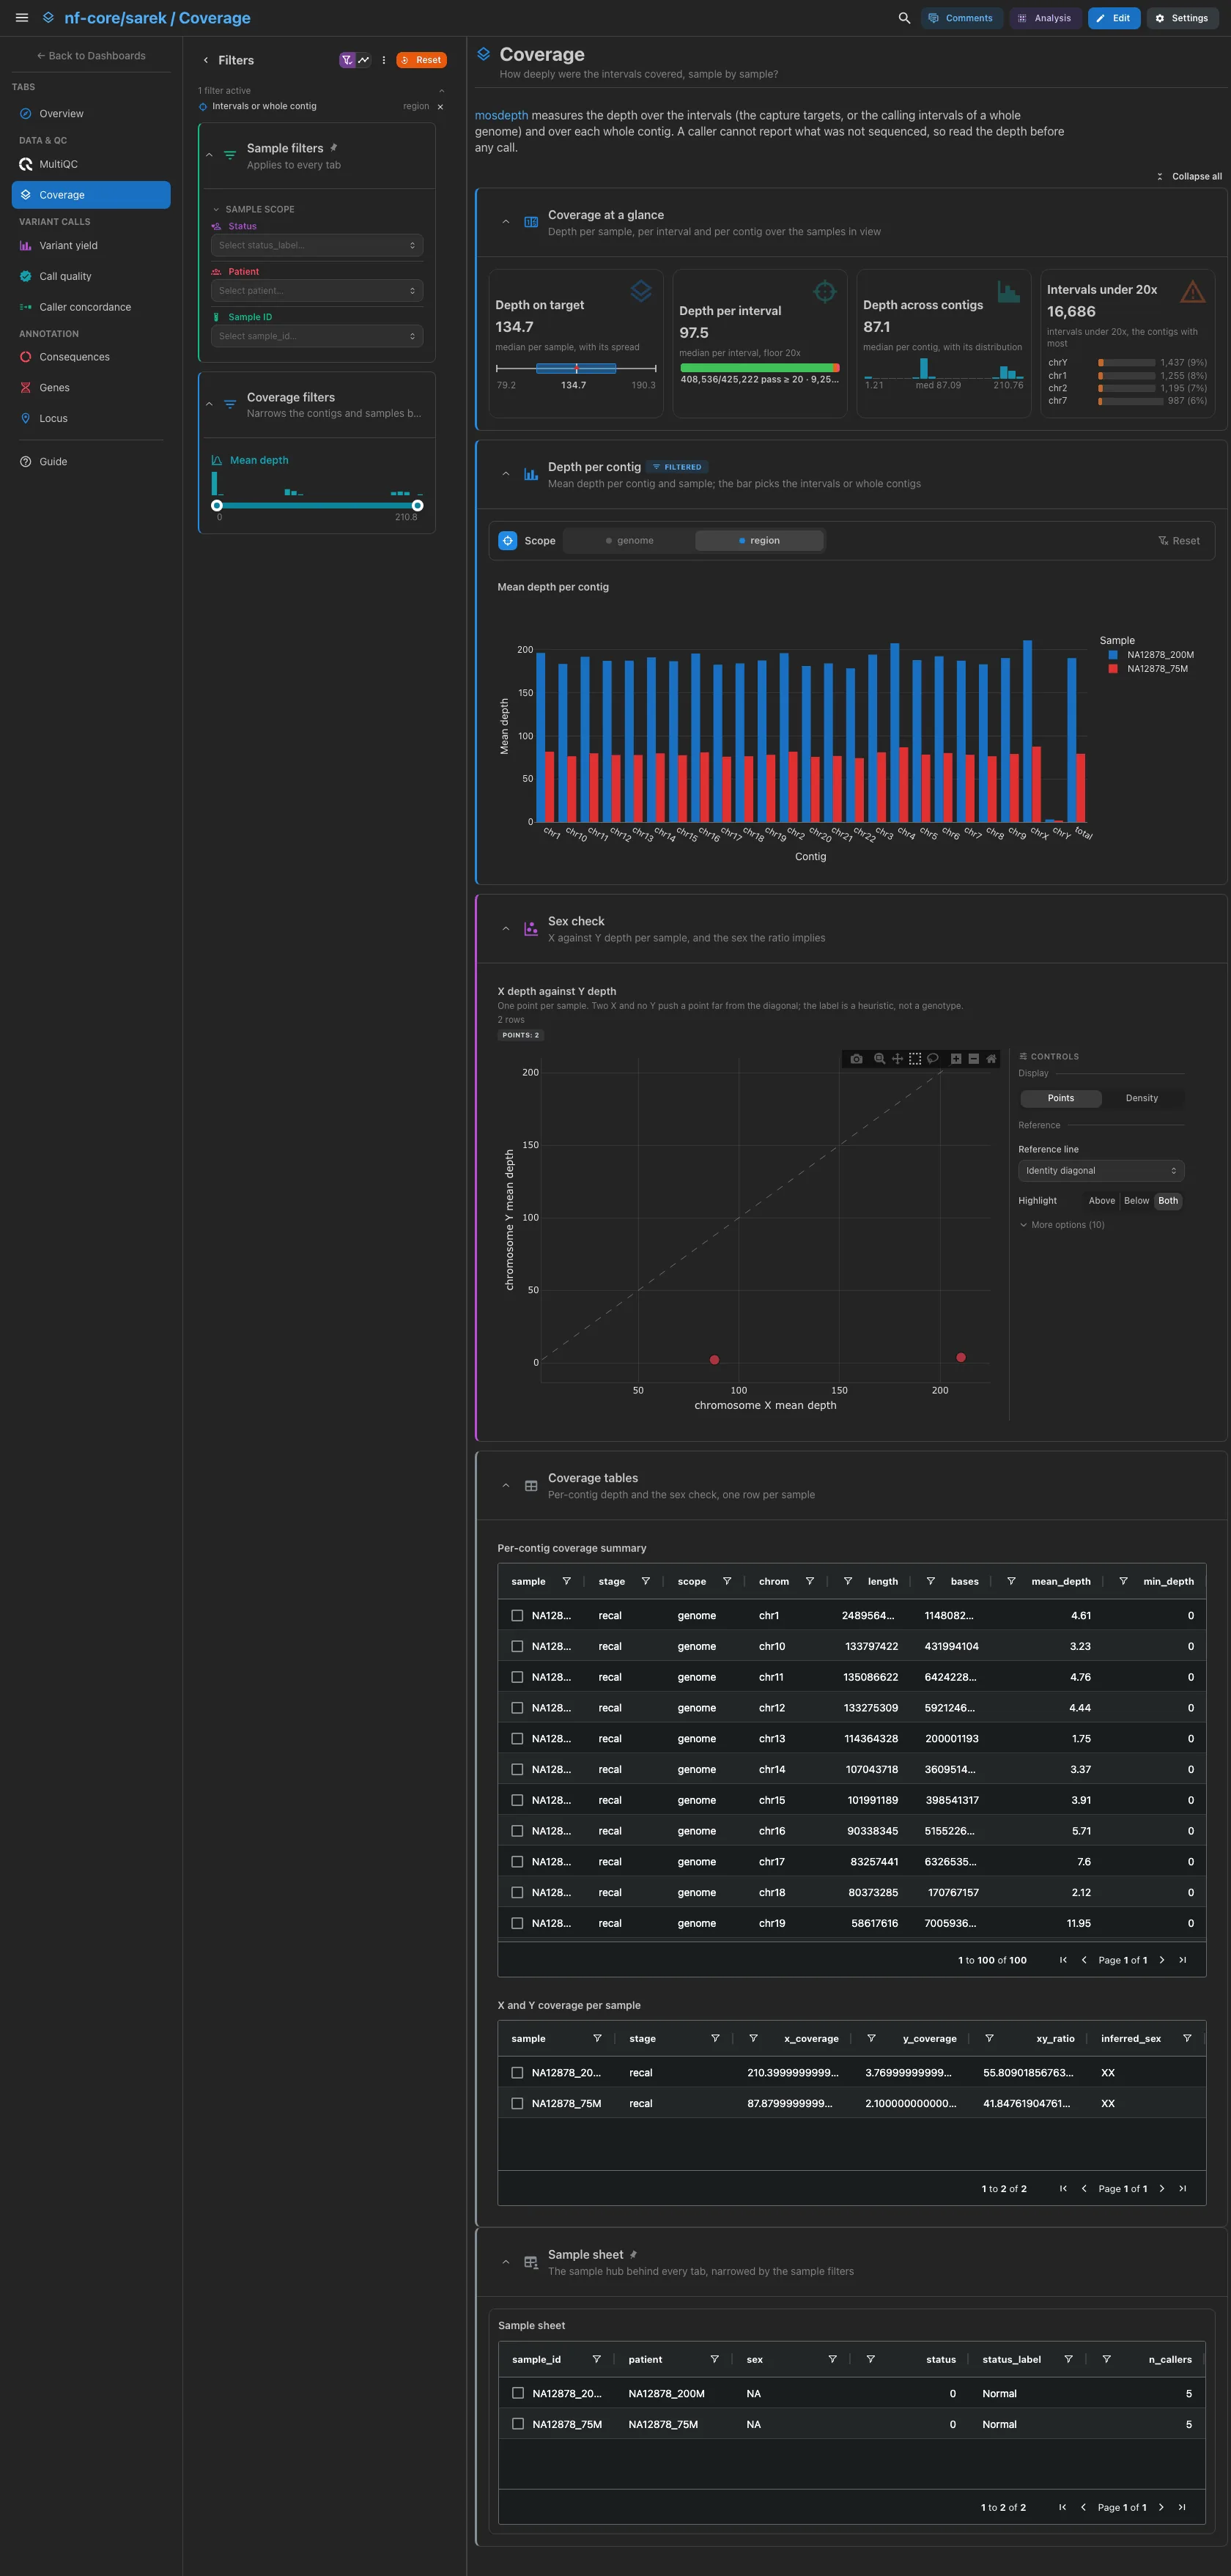
mosdepth's depth over the intervals (the capture targets, or the calling intervals of a whole genome) and over each contig. The depth on target per sample, the median depth of an interval against a 20x floor, the depth across contigs and the intervals under 20x, with the contigs that have most. Then the mean depth per contig, one bar per sample and contig, with a bar above it that switches between the intervals and the whole contig (it opens on the intervals), and the X against Y depth scatter, a heuristic sex check. The per-contig and sex-check tables are collapsed.
Filters and components
Filters · a Mean depth range on mosdepth_summary. Depth per
contig has its own bar, Intervals or whole contig. There is no contig
or scope picker in the left panel: it would empty the Depth on target
card, which reads mosdepth's total row of the intervals.
| Section | What it holds |
|---|---|
| Coverage at a glance | 4 cards |
| Depth per contig | Mean depth per contig, with its own filter bar |
| Sex check | 1 advanced visualization |
| Coverage tables (collapsed) | Per-contig coverage summary, X and Y coverage per sample |
Variant calls · How much did each caller call, and of what kind?
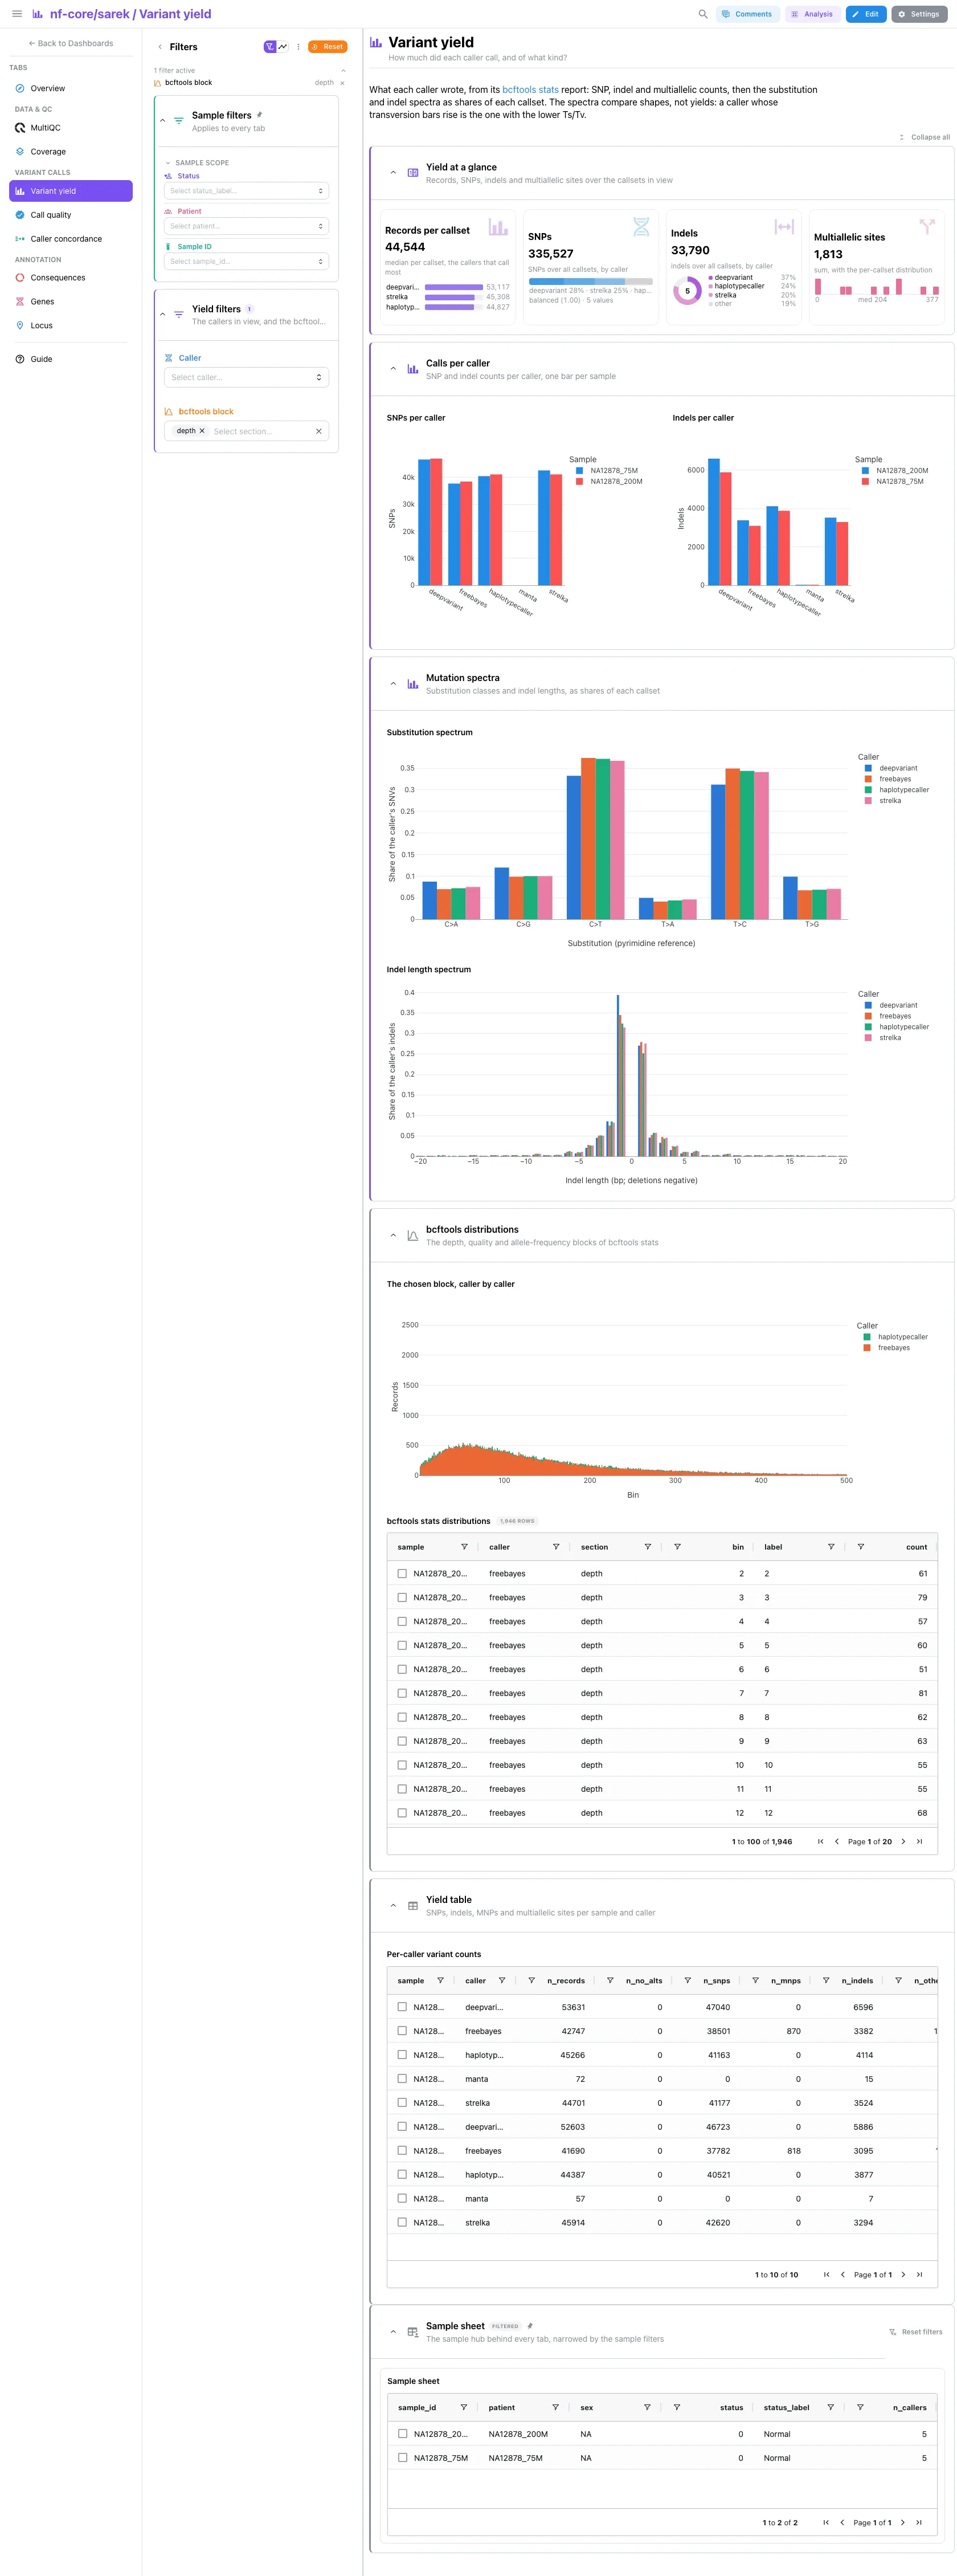
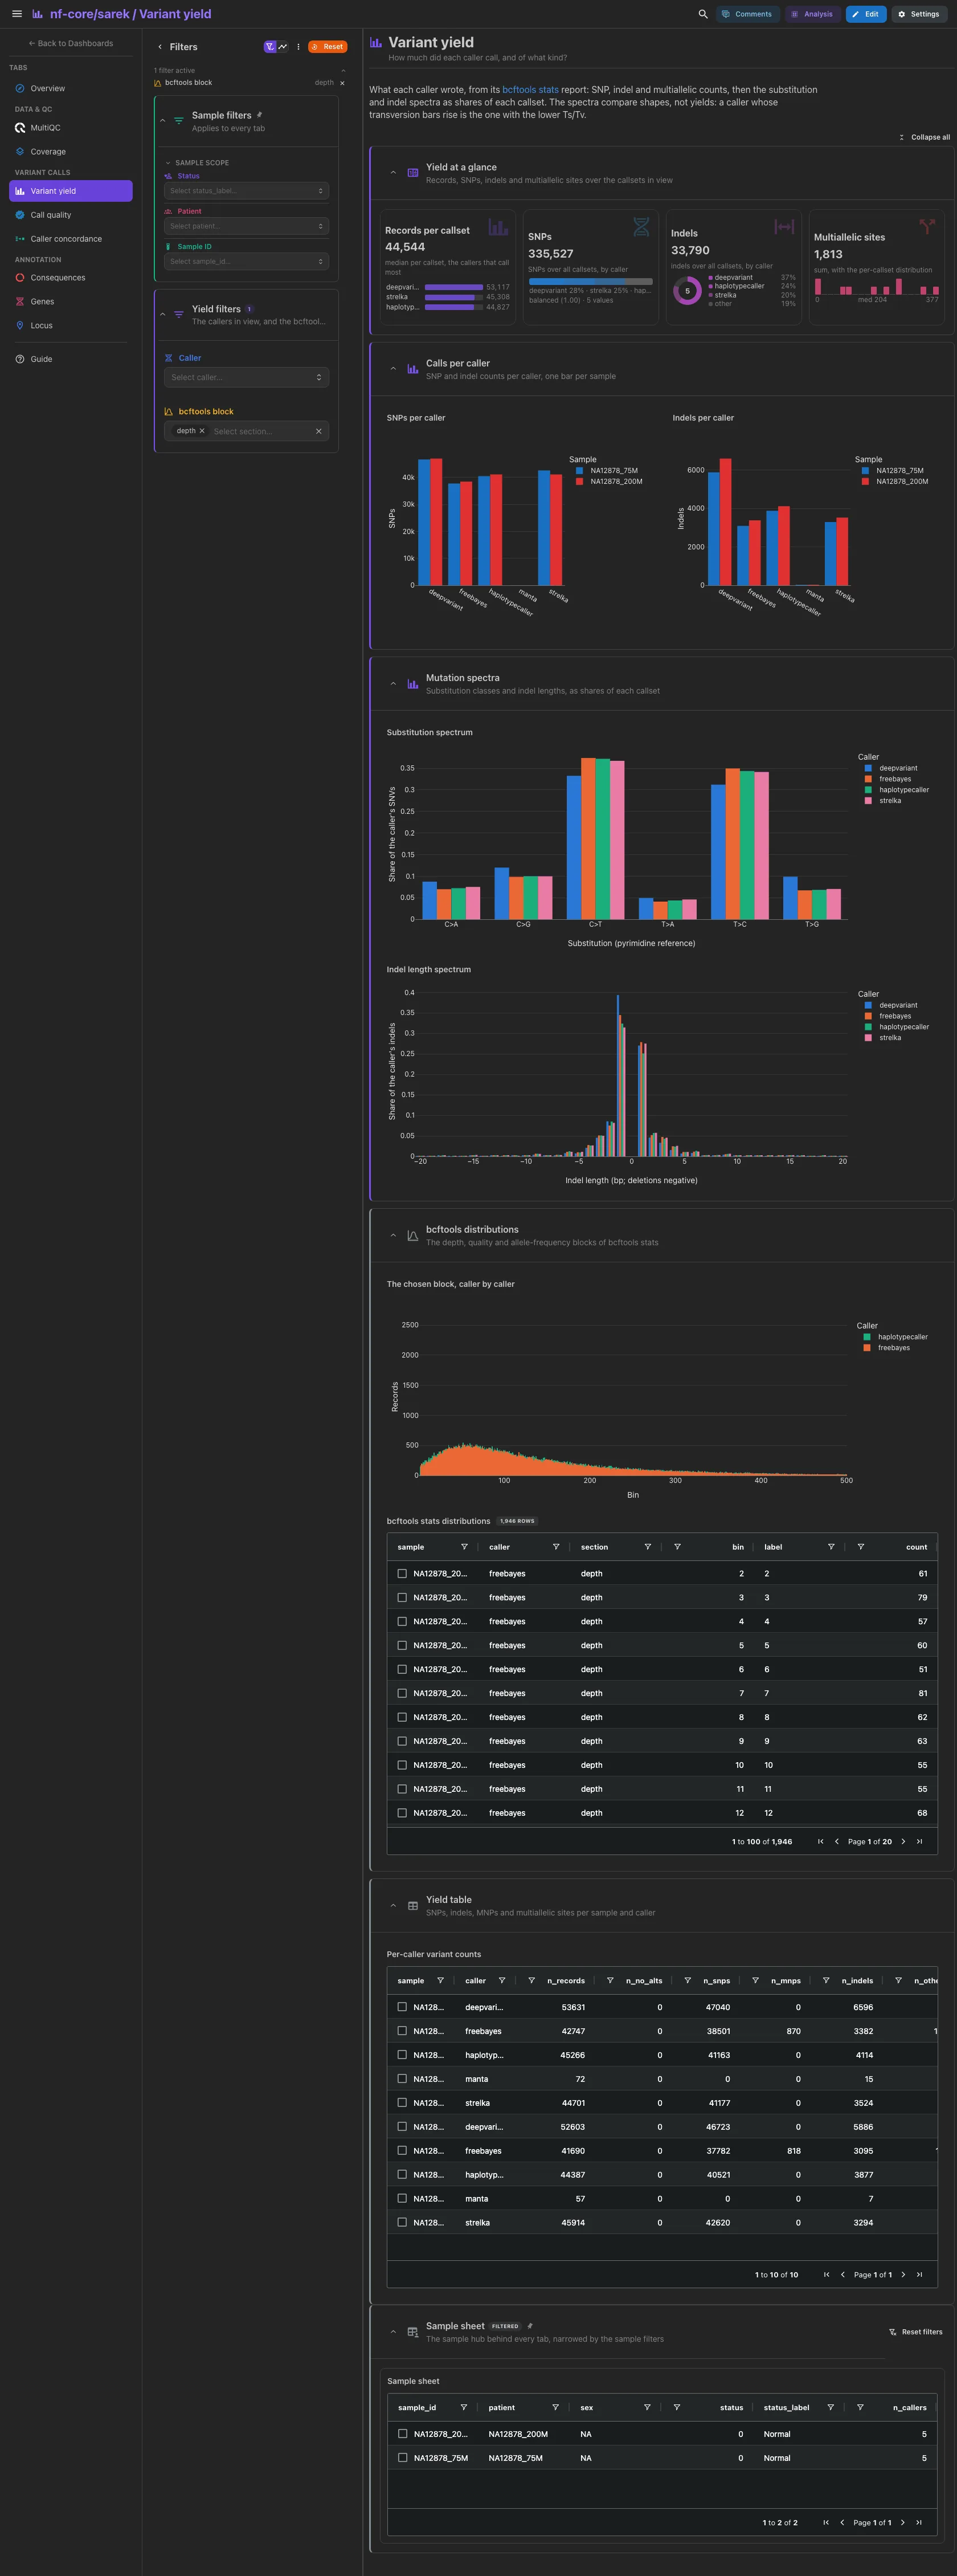
Each caller's own bcftools stats report. The median records per callset, ranked by caller (a structural-variant caller writes orders of magnitude fewer), the SNPs and the indels split by caller, and the multiallelic sites. Then SNPs and indels per caller, one bar per sample, and the substitution and indel length spectra, one bar per caller with its callsets' shares averaged. The spectra compare shapes, not yields: a caller whose transversion bars rise is the one with the lower Ts/Tv. The bcftools distribution blocks and the per-caller count table are collapsed.
Filters and components
Filters · Caller on bcftools_stats_summary, and a bcftools
block picker on bcftools_stats_sections that chooses the block the
collapsed distribution draws (it opens on depth).
| Section | What it holds |
|---|---|
| Yield at a glance | 4 cards |
| Calls per caller | SNPs per caller, Indels per caller |
| Mutation spectra | Substitution spectrum, Indel length spectrum |
| bcftools distributions (collapsed) | The chosen block, caller by caller, bcftools stats distributions |
| Yield table (collapsed) | Per-caller variant counts |
Variant calls · Do the callsets look like clean germline calls?
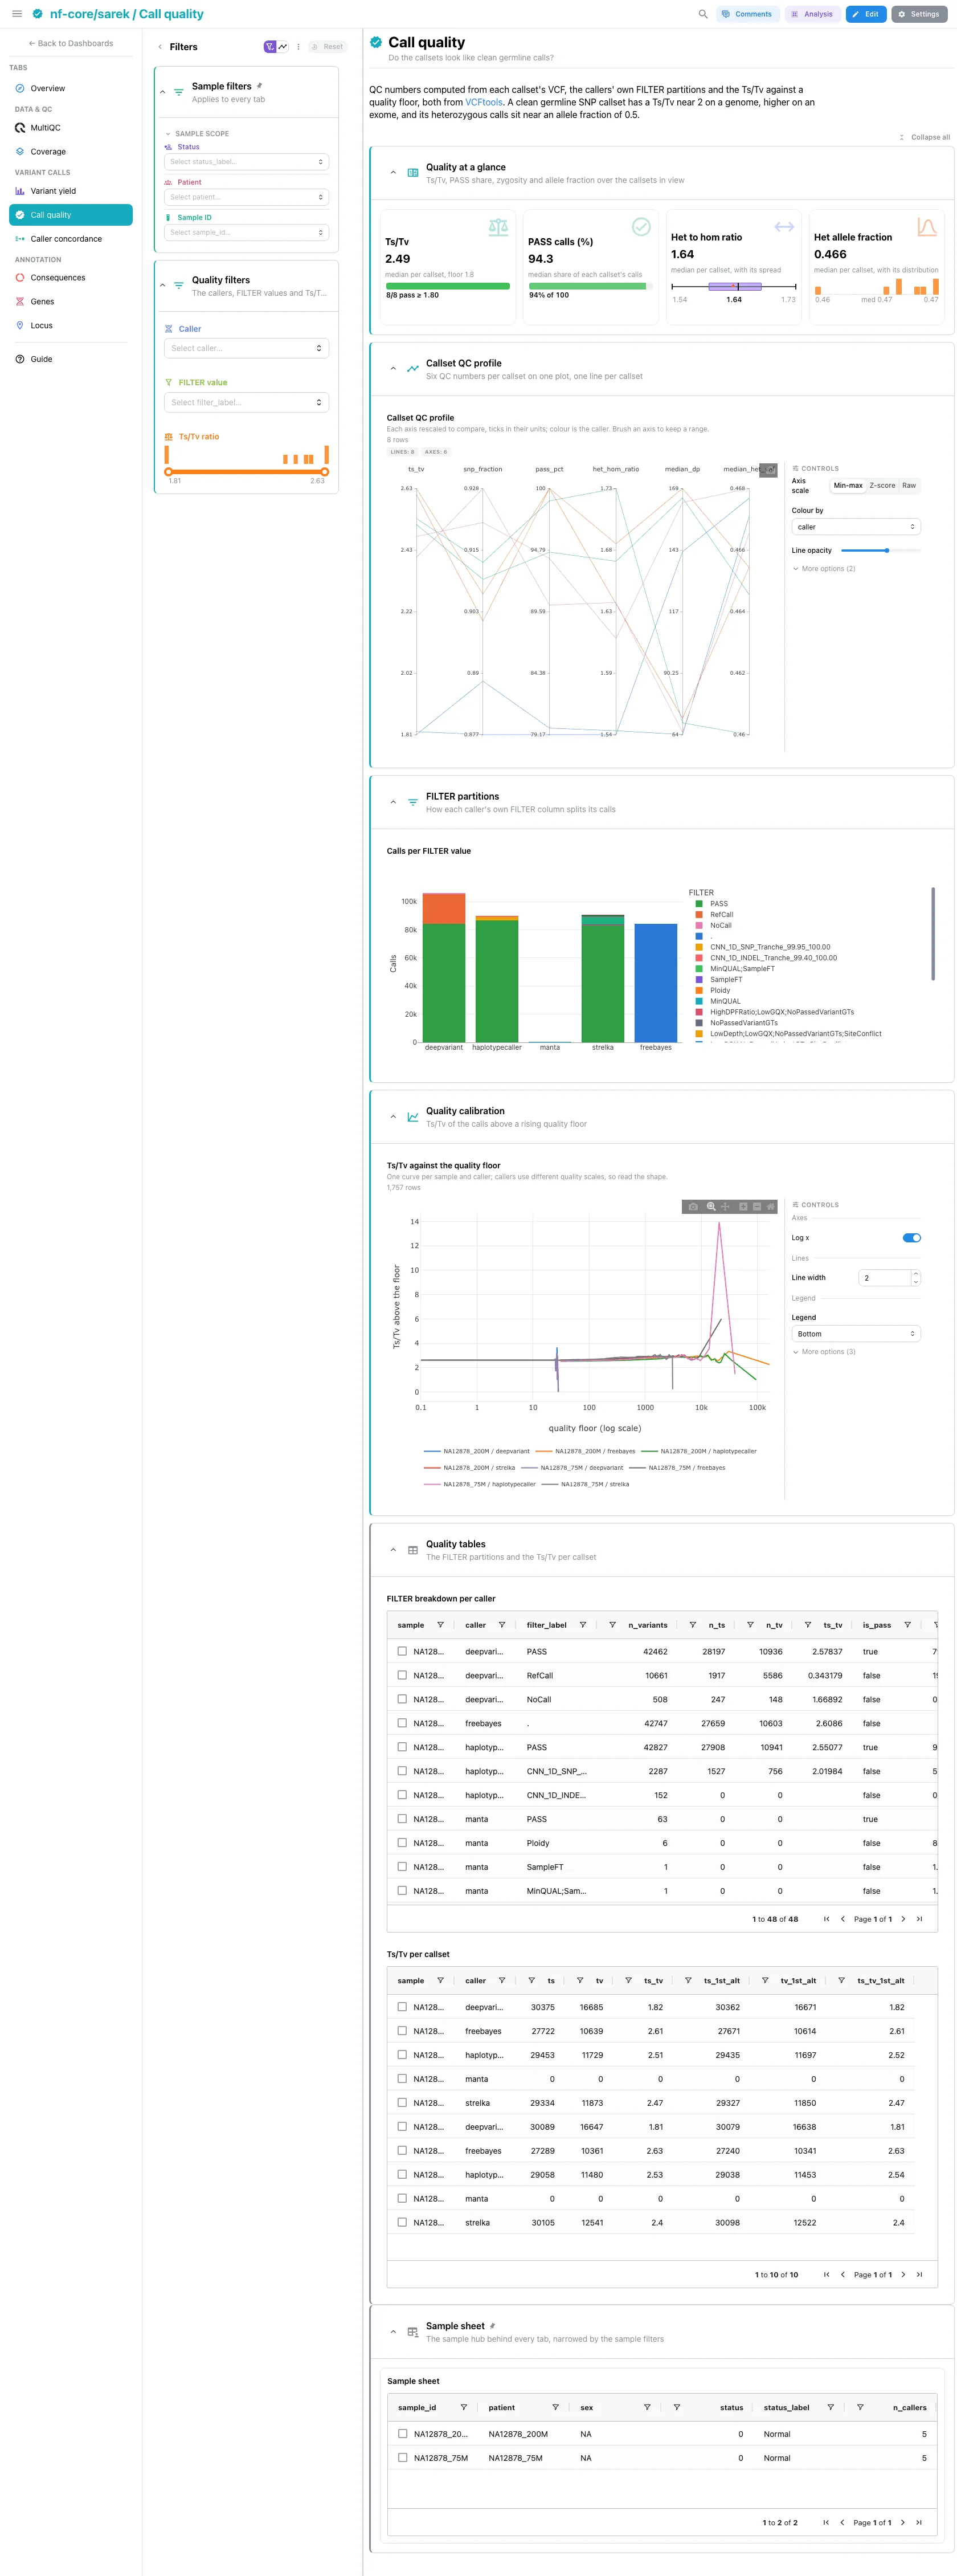
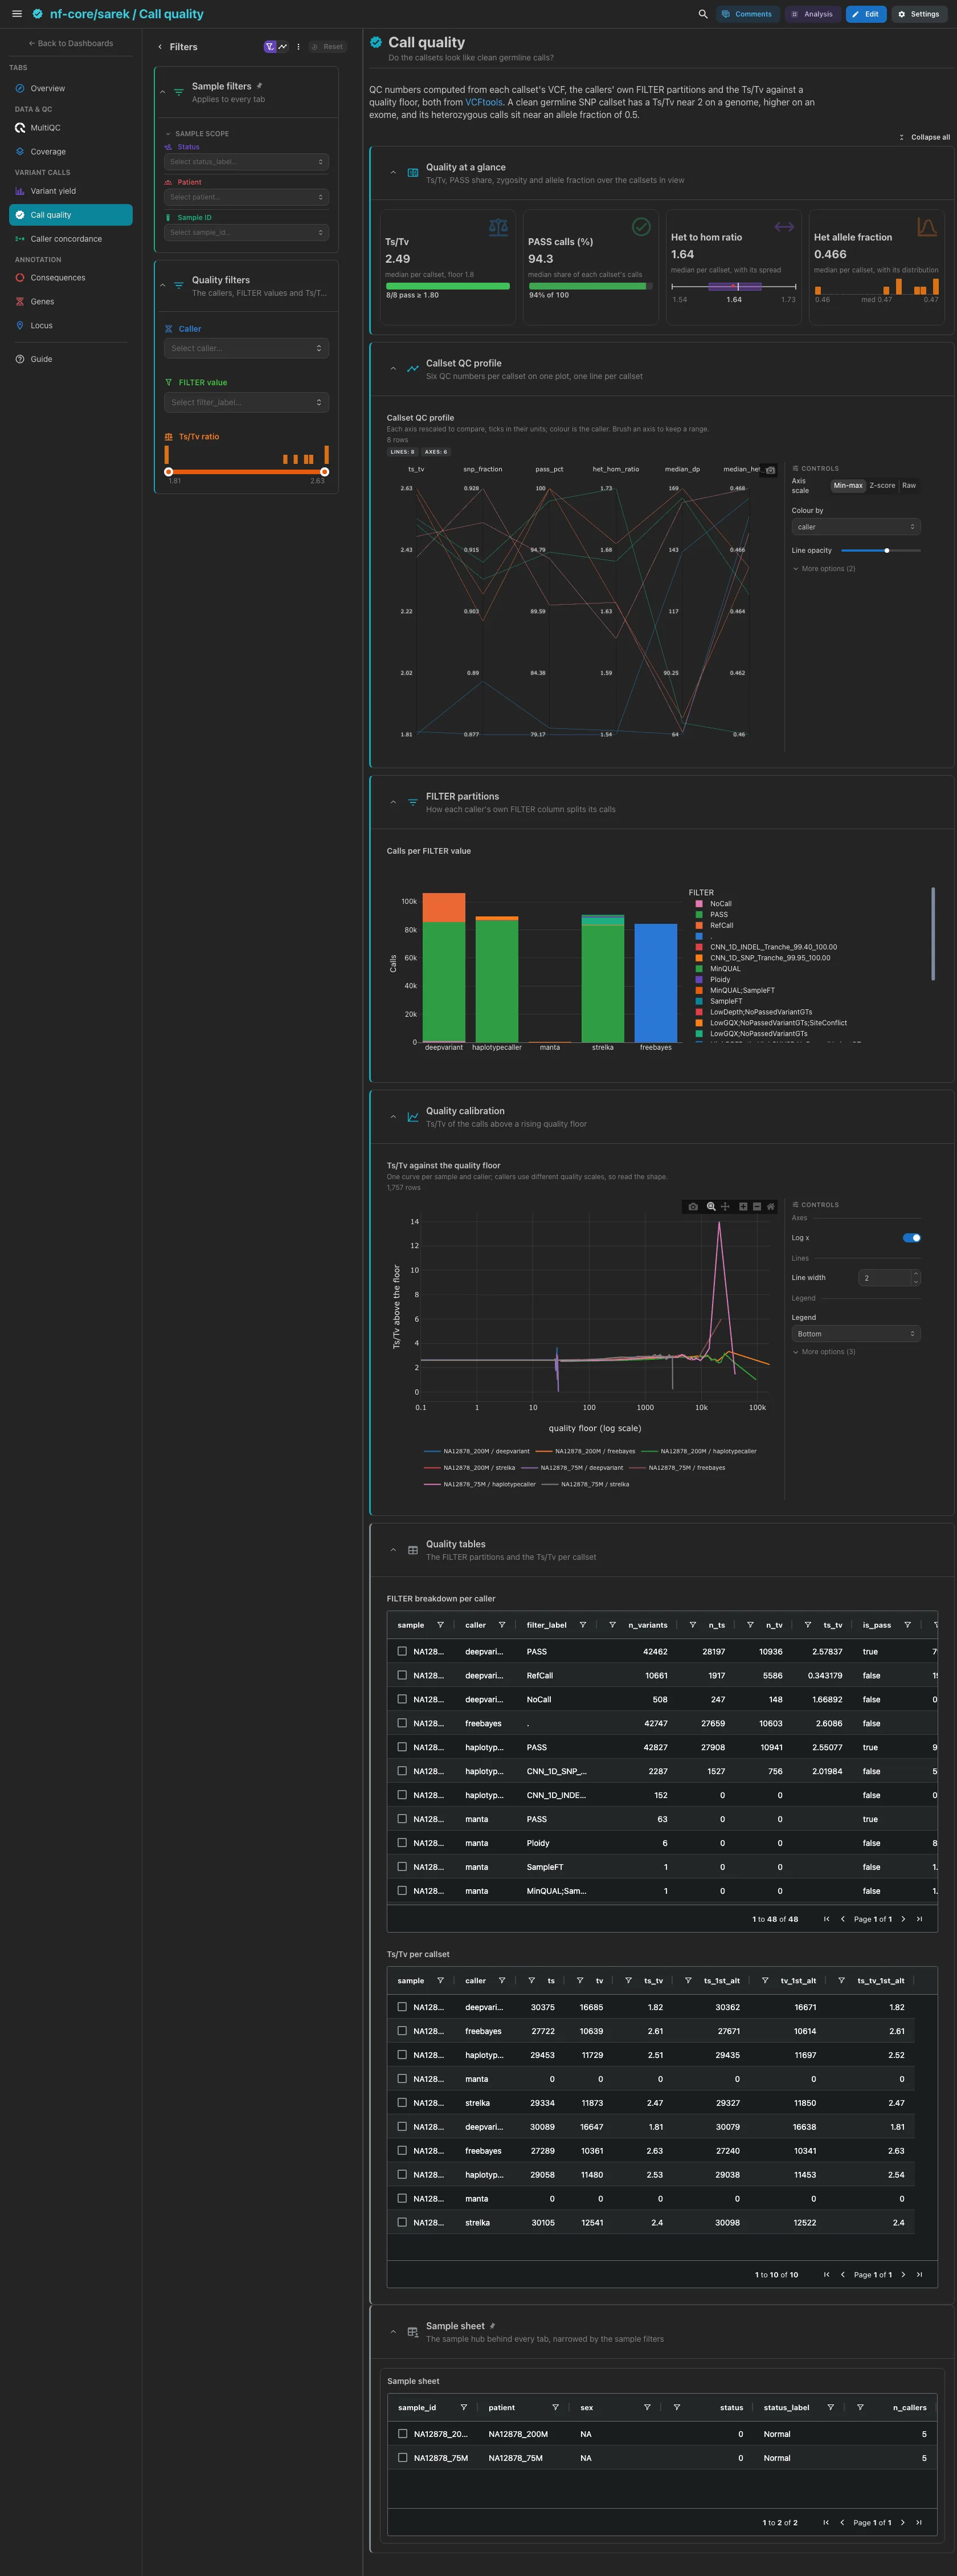
QC numbers computed from each callset's VCF. The median Ts/Tv against a 1.8 floor, the PASS share, the het to hom ratio and the allele fraction of heterozygous calls. Then the callset QC profile, six numbers per callset on parallel axes coloured by caller, the calls per FILTER value per caller, with PASS in green, and the Ts/Tv above a rising quality floor on a log axis, because callers write QUAL on scales a thousand-fold apart. A clean germline SNP callset has a Ts/Tv near 2 on a genome, higher on an exome, and its heterozygous calls sit near an allele fraction of 0.5. The FILTER breakdown and the Ts/Tv per callset are collapsed.
Filters and components
Filters · Caller and a Ts/Tv ratio range on callset_qc, and
FILTER value on vcftools_filter_summary.
| Section | What it holds |
|---|---|
| Quality at a glance | 4 cards |
| Callset QC profile | 1 advanced visualization |
| FILTER partitions | Calls per FILTER value |
| Quality calibration | 1 advanced visualization |
| Quality tables (collapsed) | FILTER breakdown per caller, Ts/Tv per callset |
Without VCFtools
A run that skipped VCFtools has no FILTER partitions, no quality sweep and
no FILTER value filter here, and the Overview drops its FILTER figure.
Variant calls · Which calls do the callers share, and where do they differ?
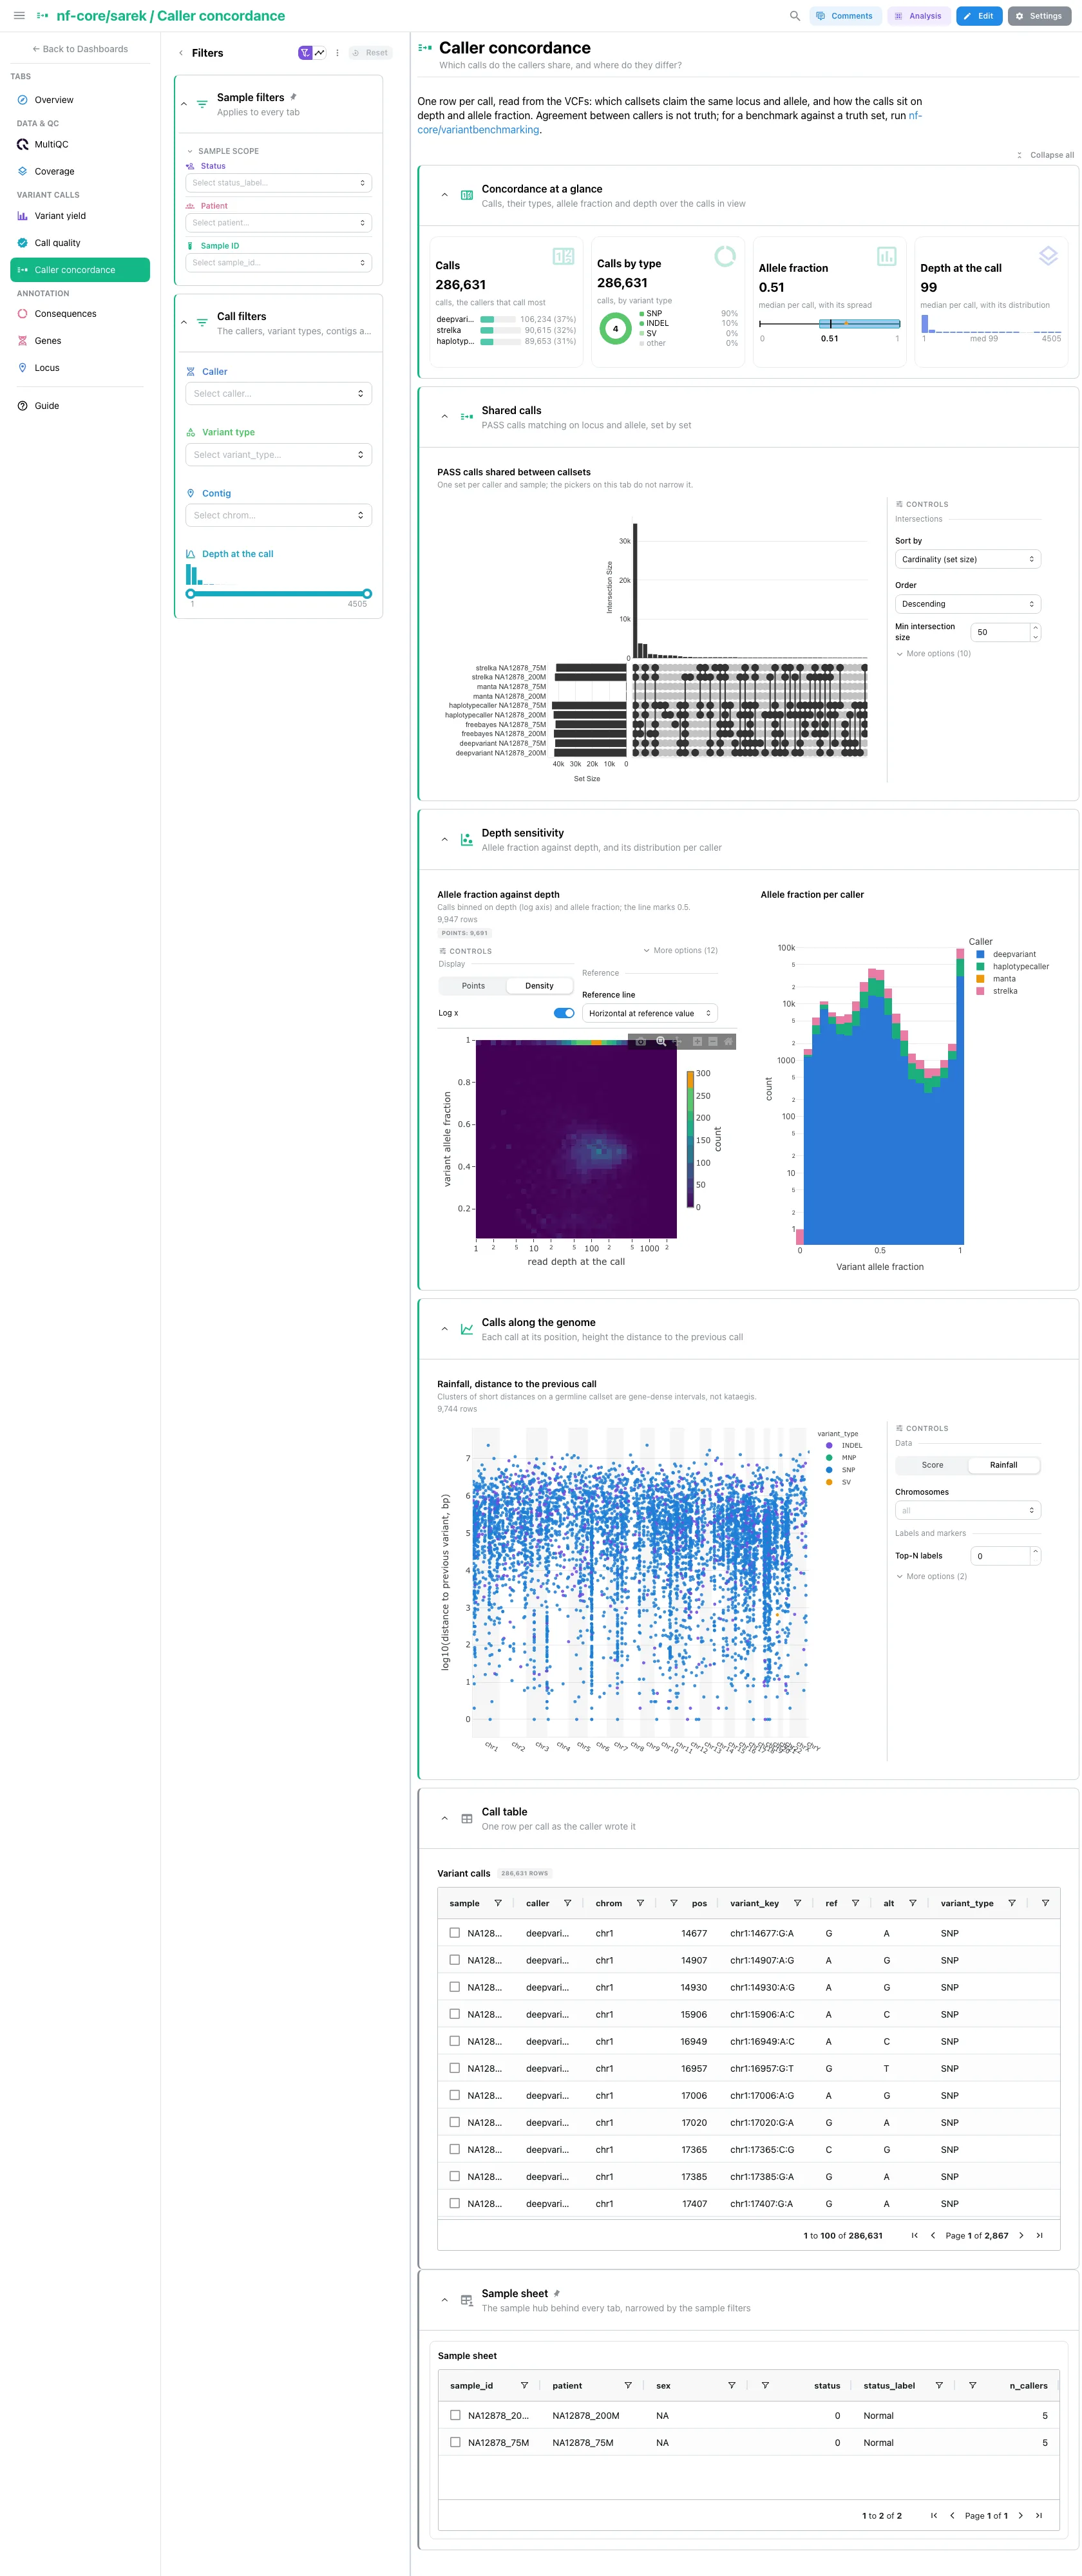
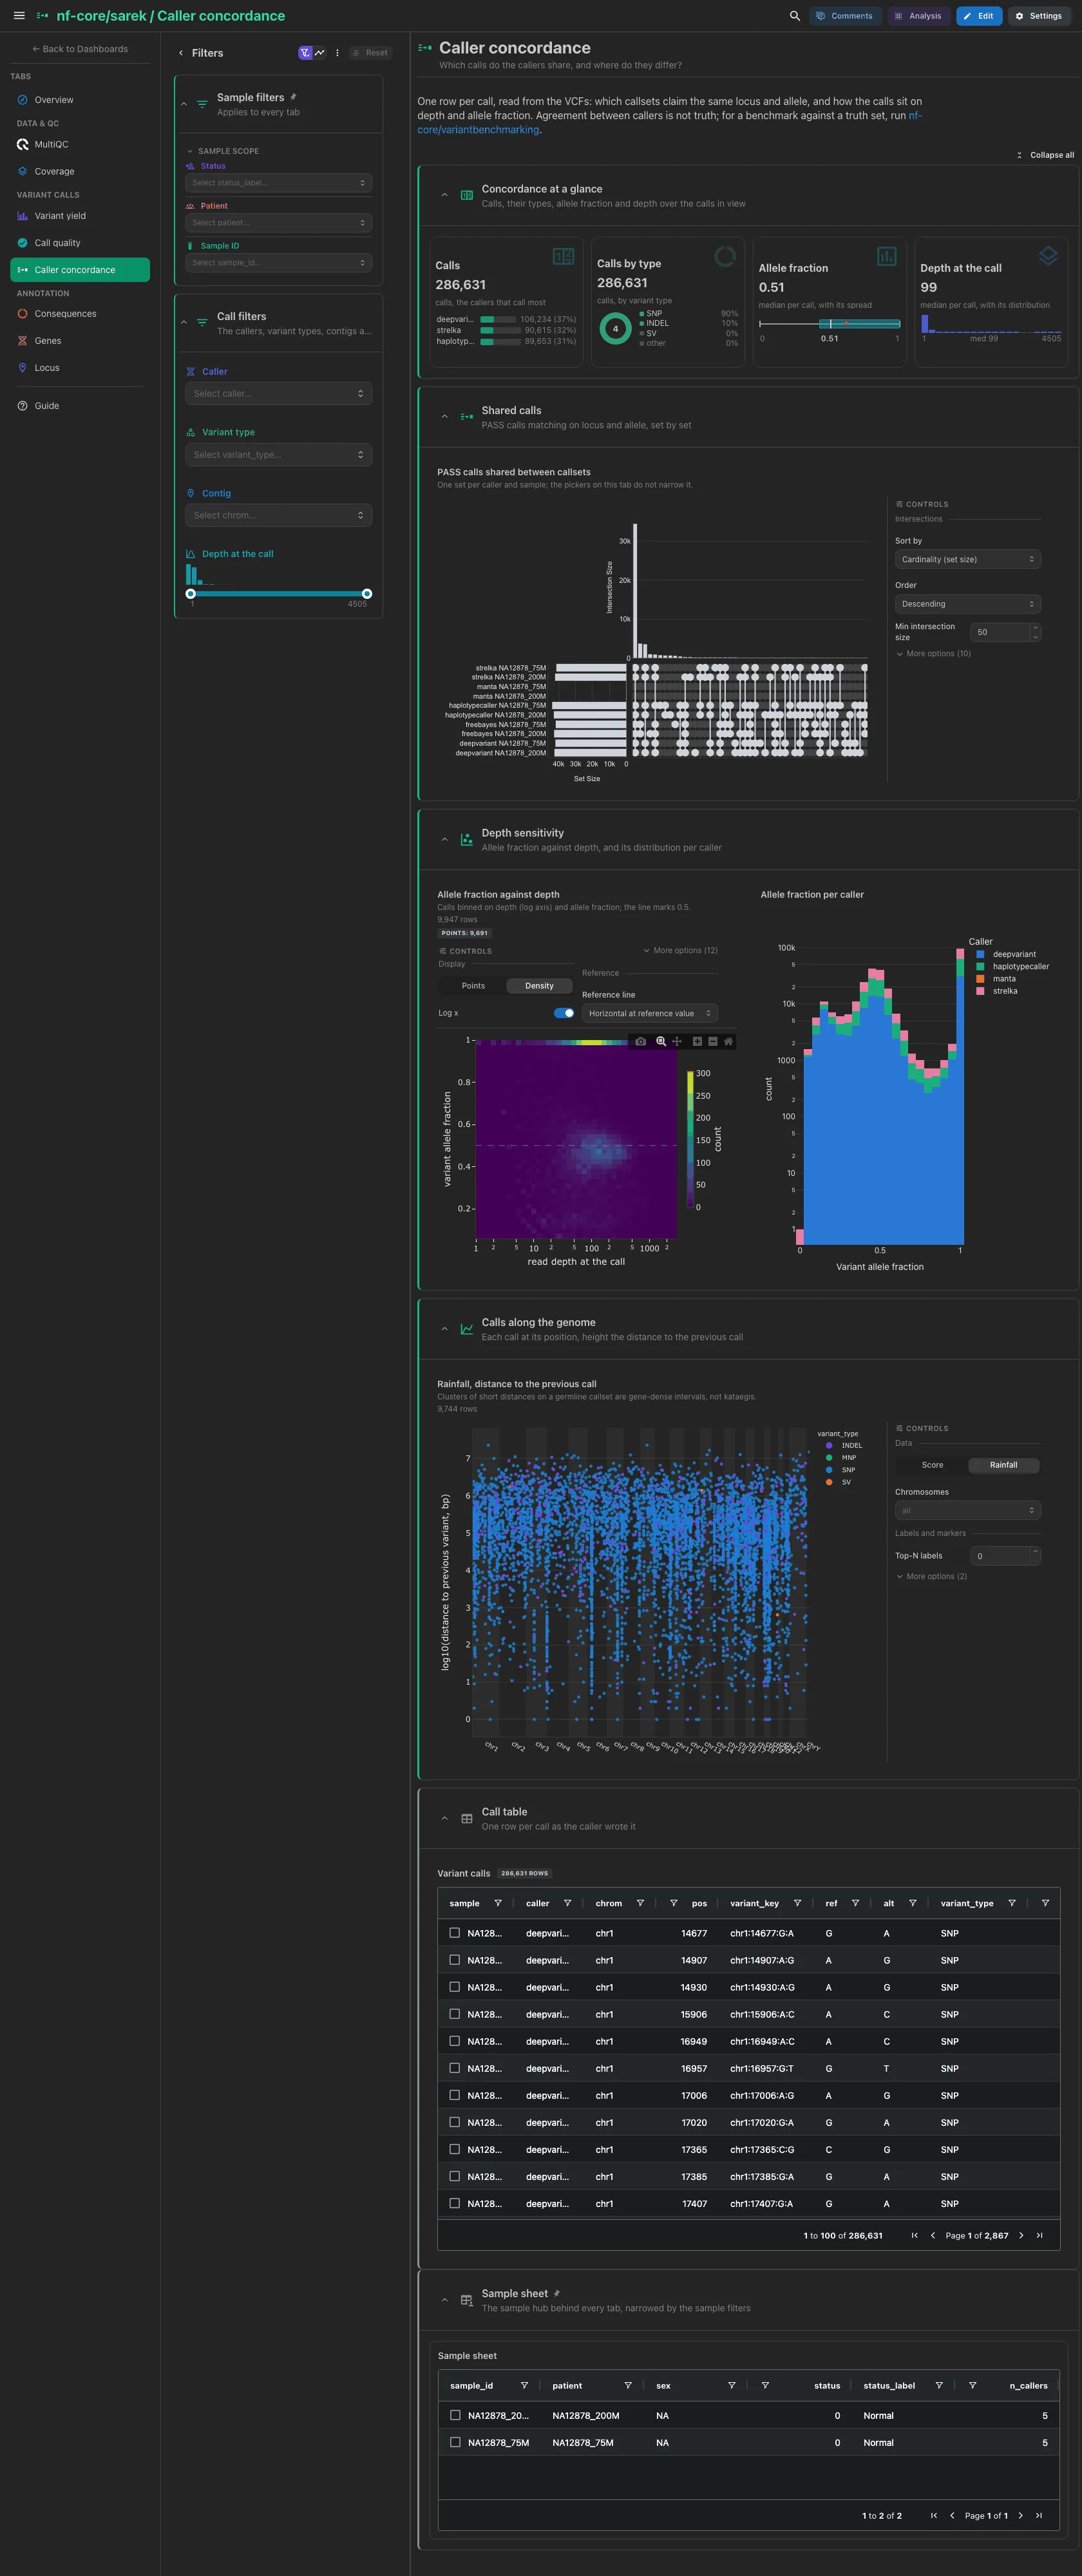
One row per call, read from the VCFs. The calls ranked by caller, the calls by variant type, the allele fraction and the depth at the call. Then the UpSet of PASS calls shared between callsets, matched on locus and allele (fixed: the pickers on this tab do not narrow it), allele fraction against depth as a density beside its histogram per caller (a clean diploid callset forms ridges at 0.5 and 1), and the rainfall of the calls along the genome, each at its distance to the previous call. The call table is collapsed. Agreement between callers is not truth.
Filters and components
Filters · Caller, Variant type, Contig and a Depth at the
call range on vcf_variants.
| Section | What it holds |
|---|---|
| Concordance at a glance | 4 cards |
| Shared calls | 1 advanced visualization |
| Depth sensitivity | 1 advanced visualization, Allele fraction per caller |
| Calls along the genome | 1 advanced visualization |
| Call table (collapsed) | Variant calls |
Annotation · What do the calls do to the transcripts?
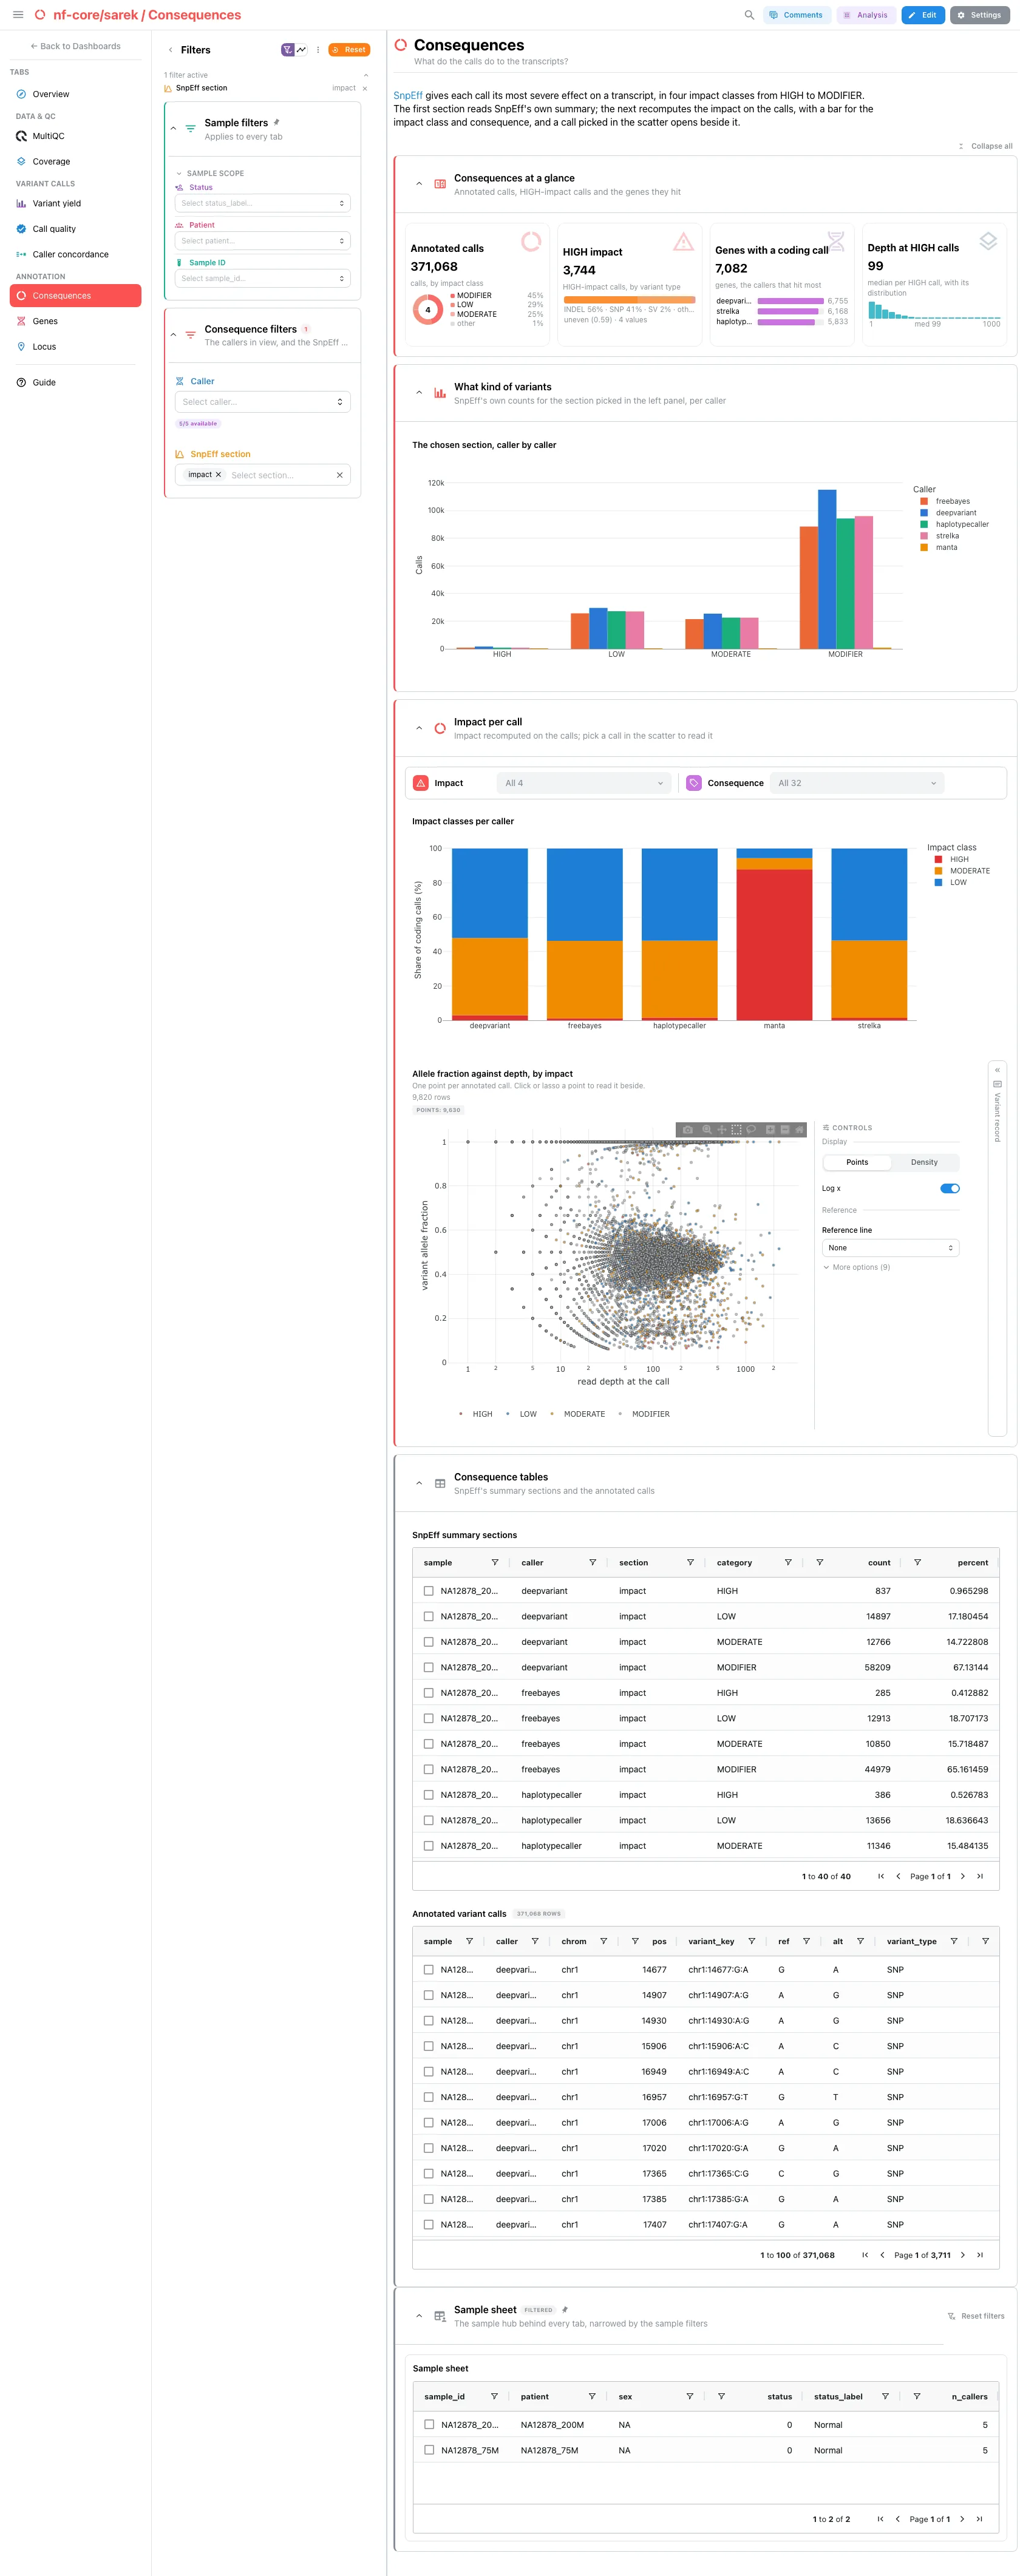
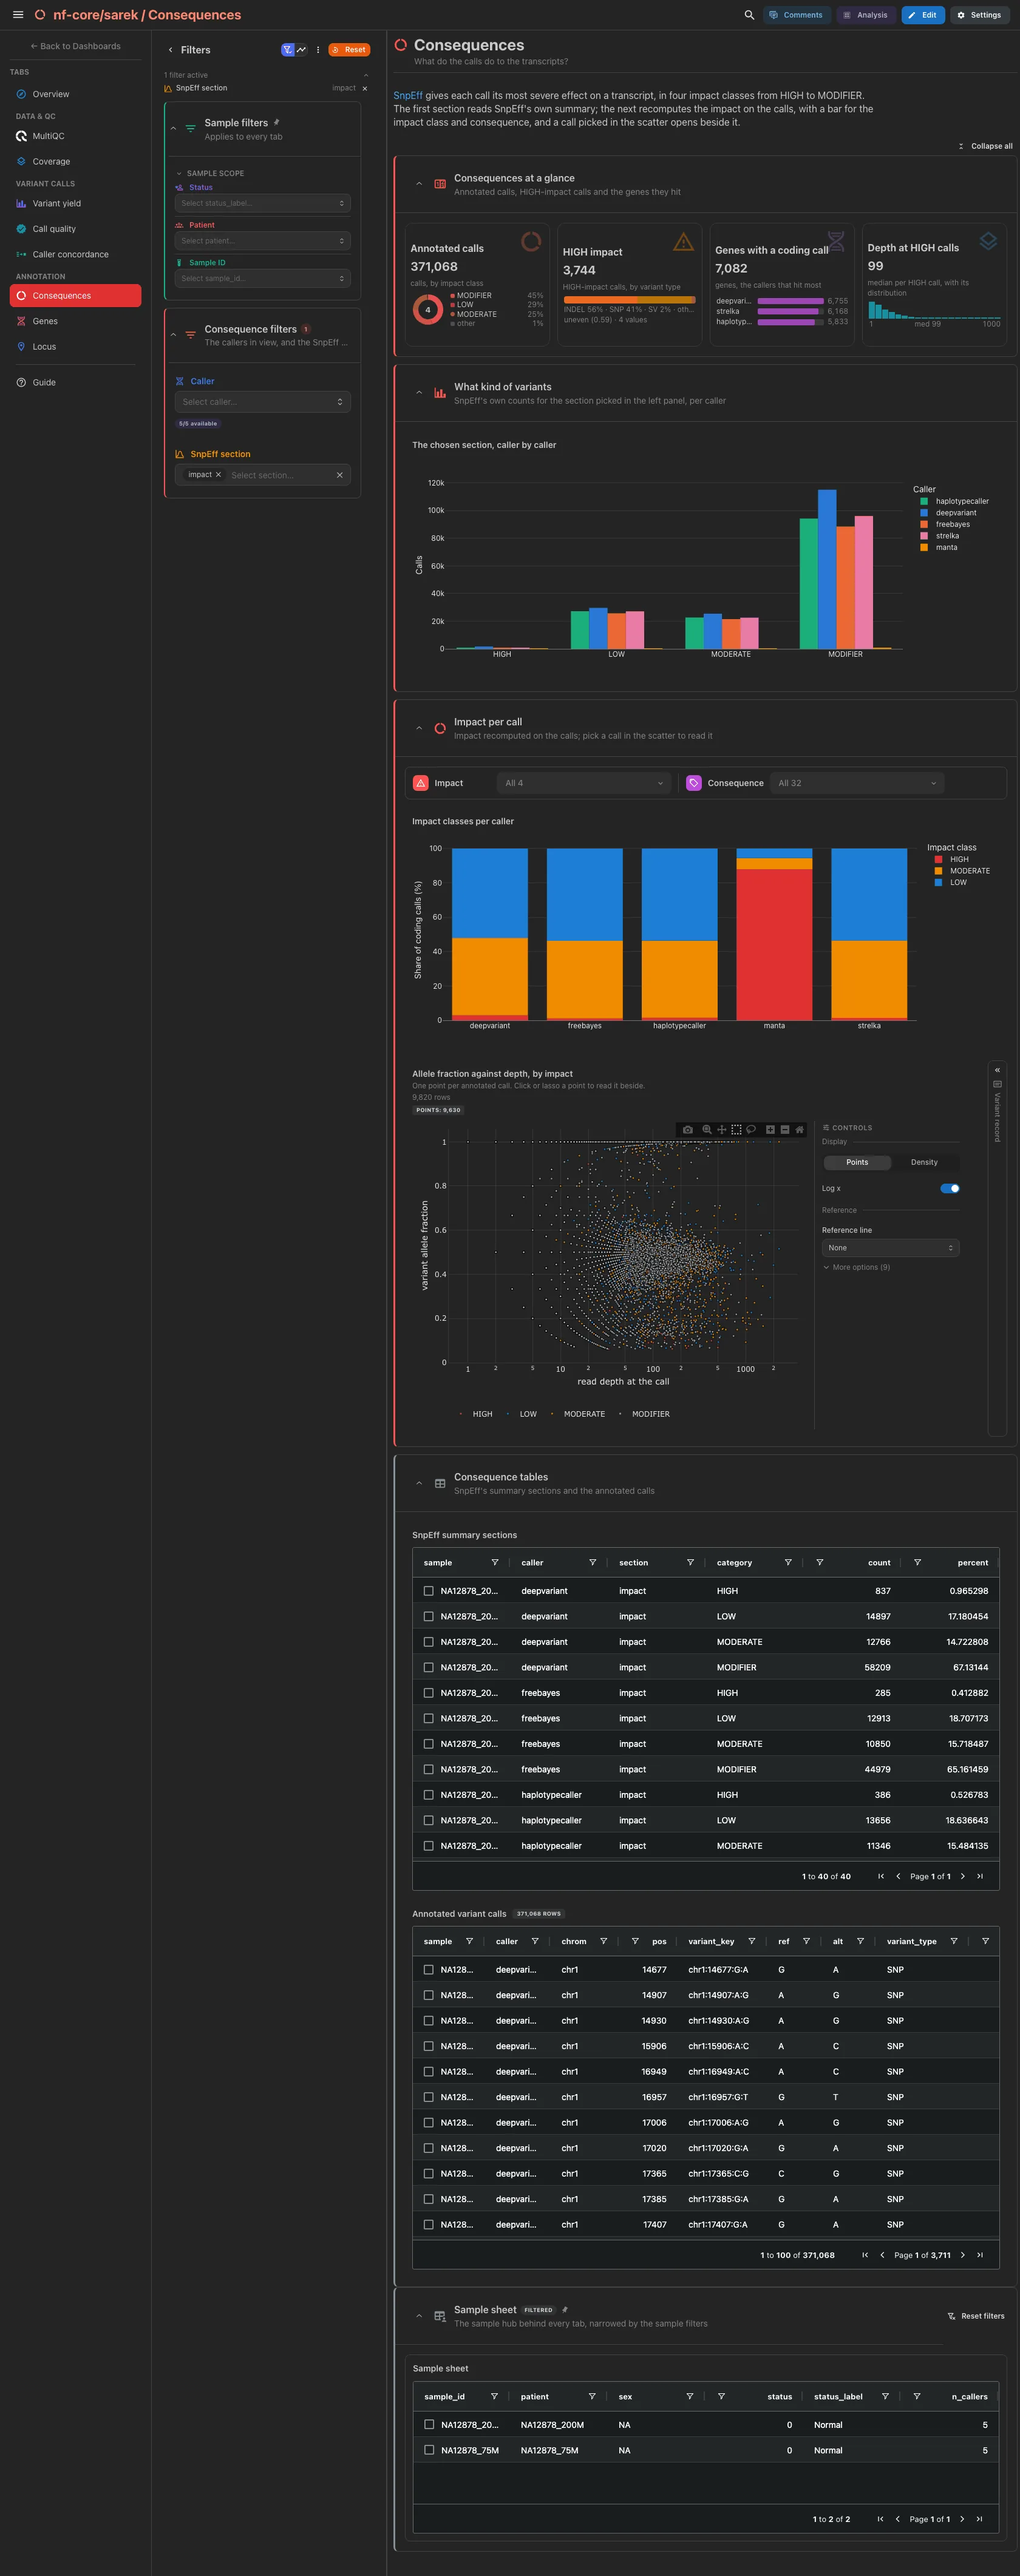
SnpEff gives each call its most severe effect on a transcript, in four impact classes. The annotated calls by impact class, the HIGH-impact calls by variant type, the genes with a HIGH or MODERATE call and the depth at HIGH-impact calls. Then SnpEff's own counts for the summary section picked in the left panel (opening on impact), caller by caller, and the impact recomputed on the calls: the impact classes per caller as shares (MODIFIER left out), and the allele fraction against depth scatter coloured by impact, with the record of the picked call beside it. The SnpEff summary and the annotated calls are collapsed.
Filters and components
Filters · Caller on snpeff_ann_variants and SnpEff section on
snpeff_csv_stats. Impact per call has its own bar, Impact class
and Consequence, rather than the left panel, because three cards pin
an impact class.
| Section | What it holds |
|---|---|
| Consequences at a glance | 4 cards |
| What kind of variants | The chosen section, caller by caller |
| Impact per call | Impact classes per caller, then 2 advanced visualizations: the impact scatter and the Variant record, with its own filter bar |
| Consequence tables (collapsed) | SnpEff summary sections, Annotated variant calls |
Annotation · Which genes carry the calls, and where on the protein?
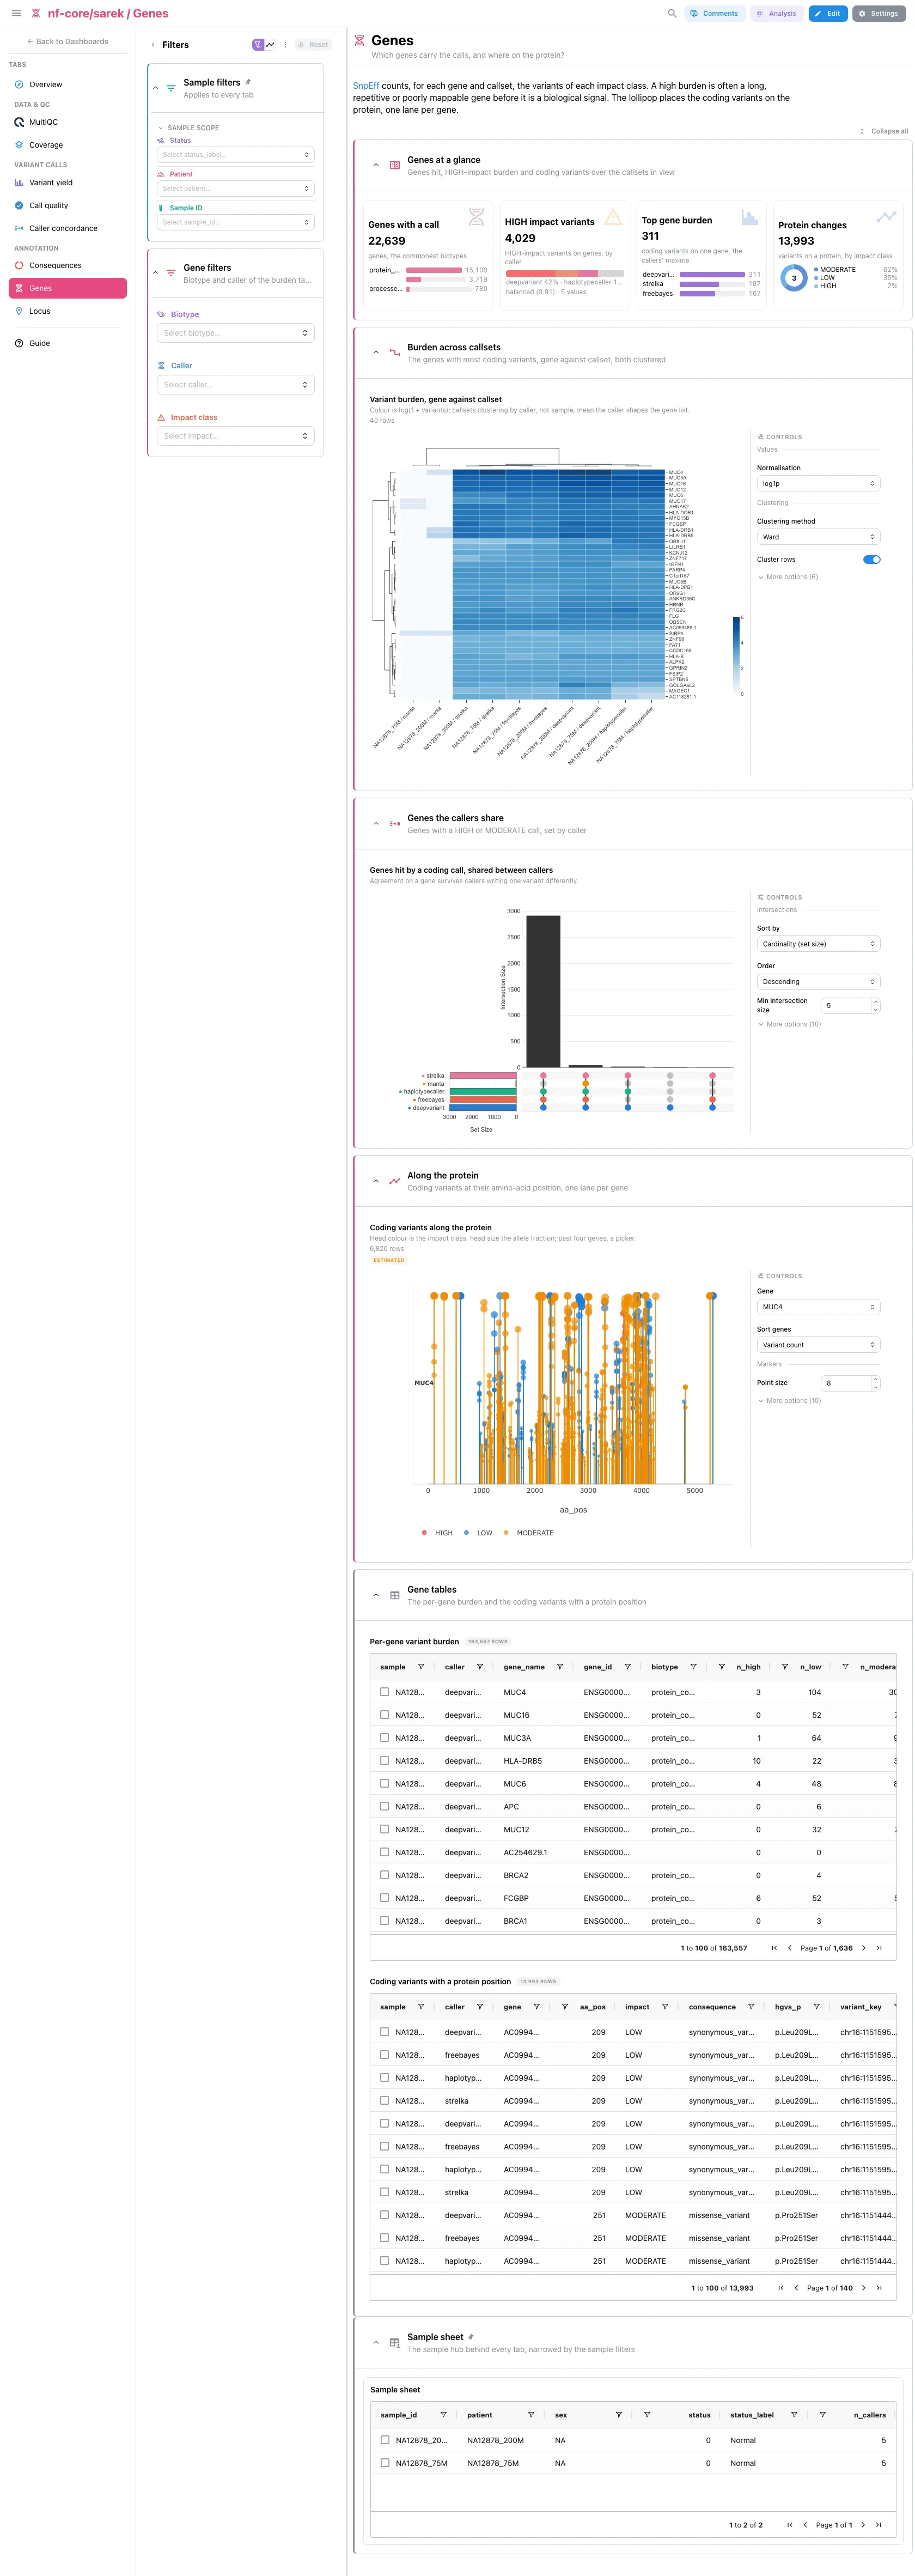
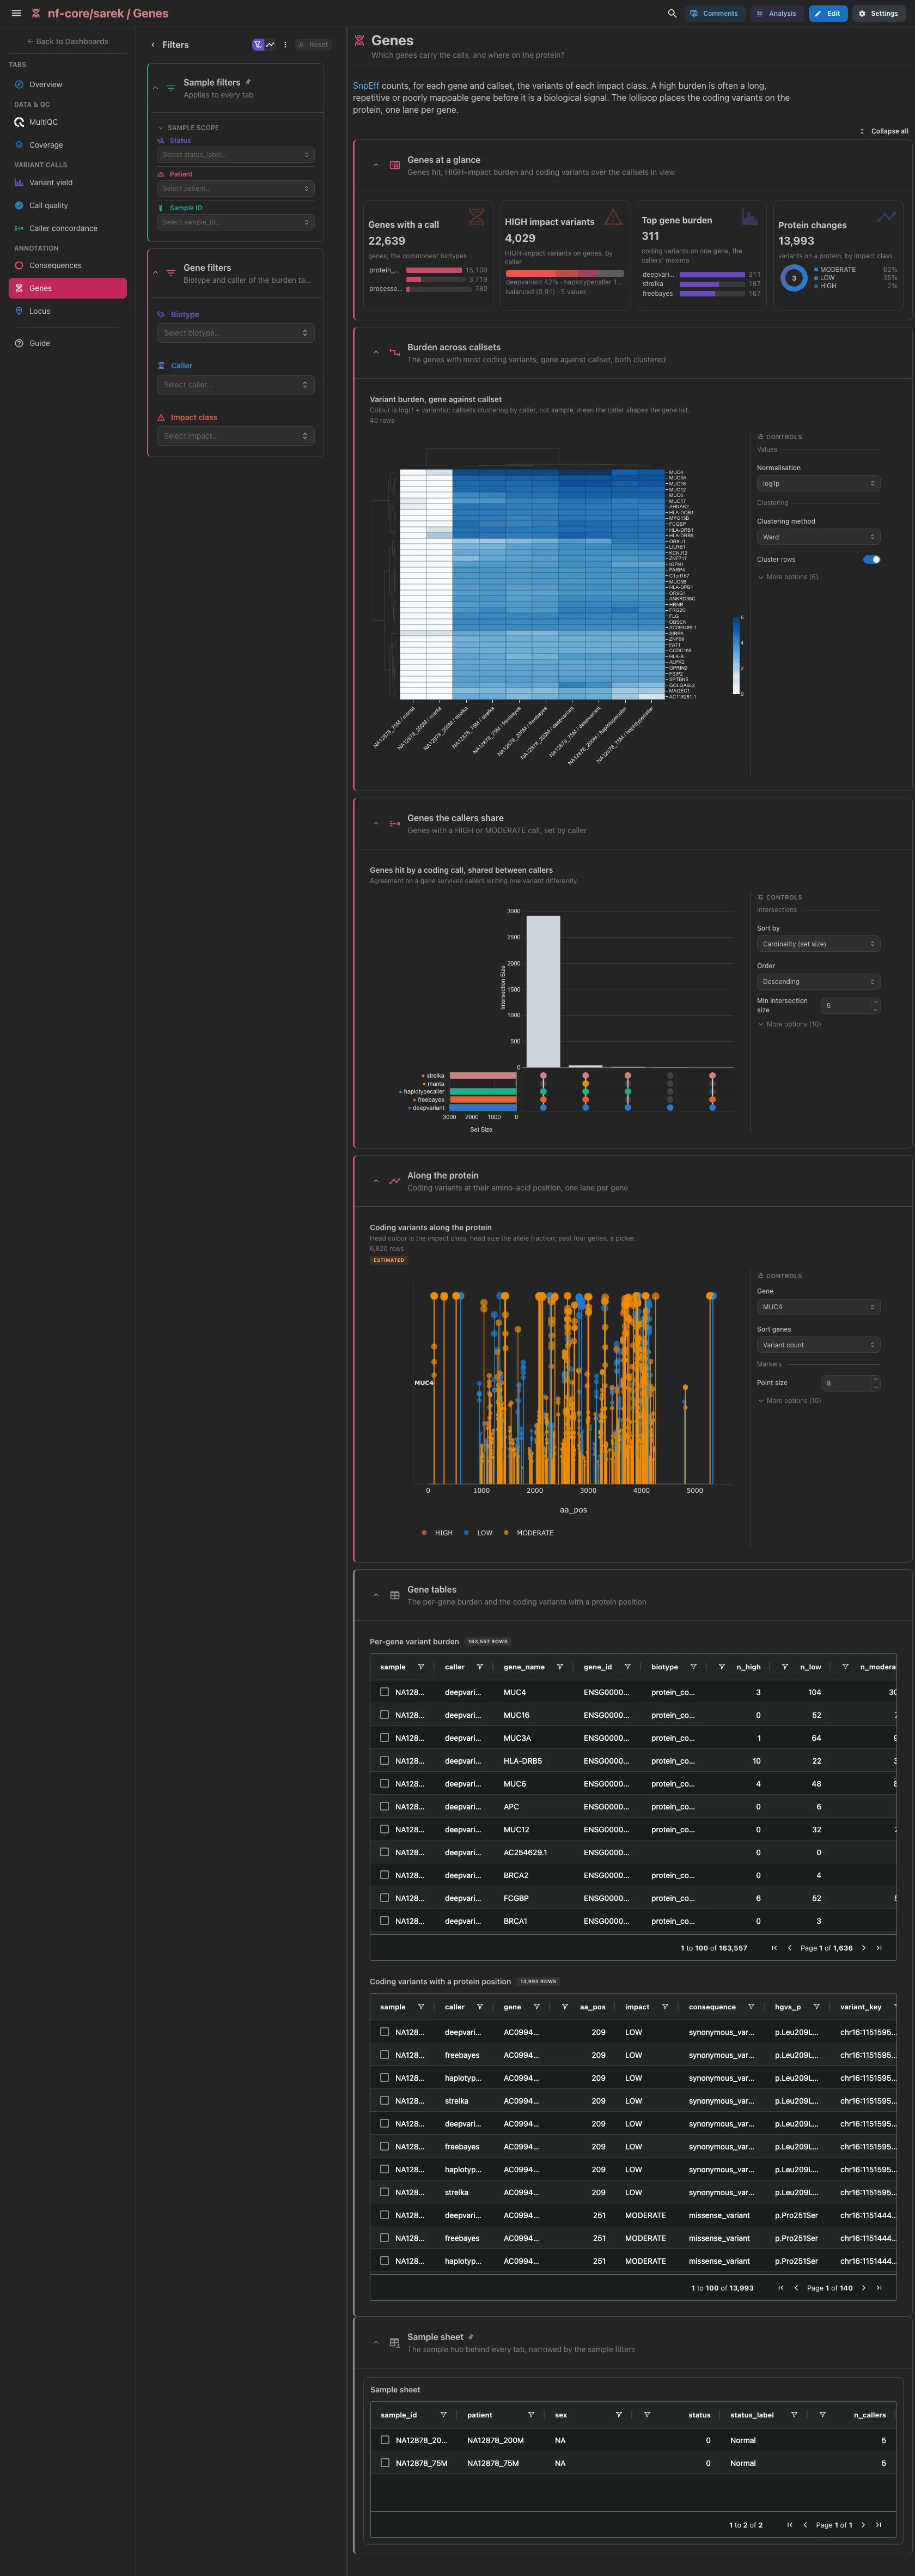
SnpEff's per-gene counts. The genes with a call by biotype, the HIGH-impact variants by caller, the top gene burden (the most HIGH or MODERATE variants on one gene, the callers' maxima) and the protein changes by impact class. Then the gene by callset burden heatmap, coloured by log(1 + variants) so one long gene does not wash out the rest, the UpSet of genes the callers share (fixed), and the coding variants along the protein, one lane per gene. A high burden is often a long, repetitive or poorly mappable gene before it is a biological signal. The per-gene burden and protein position tables are collapsed.
Filters and components
Filters · Biotype and Caller on snpeff_genes, and Impact
class on snpeff_protein_lollipop.
| Section | What it holds |
|---|---|
| Genes at a glance | 4 cards |
| Burden across callsets | 1 advanced visualization |
| Genes the callers share | 1 advanced visualization |
| Along the protein | 1 advanced visualization |
| Gene tables (collapsed) | Per-gene variant burden, Coding variants with a protein position |
Annotation · What do depth and calls show at one region?
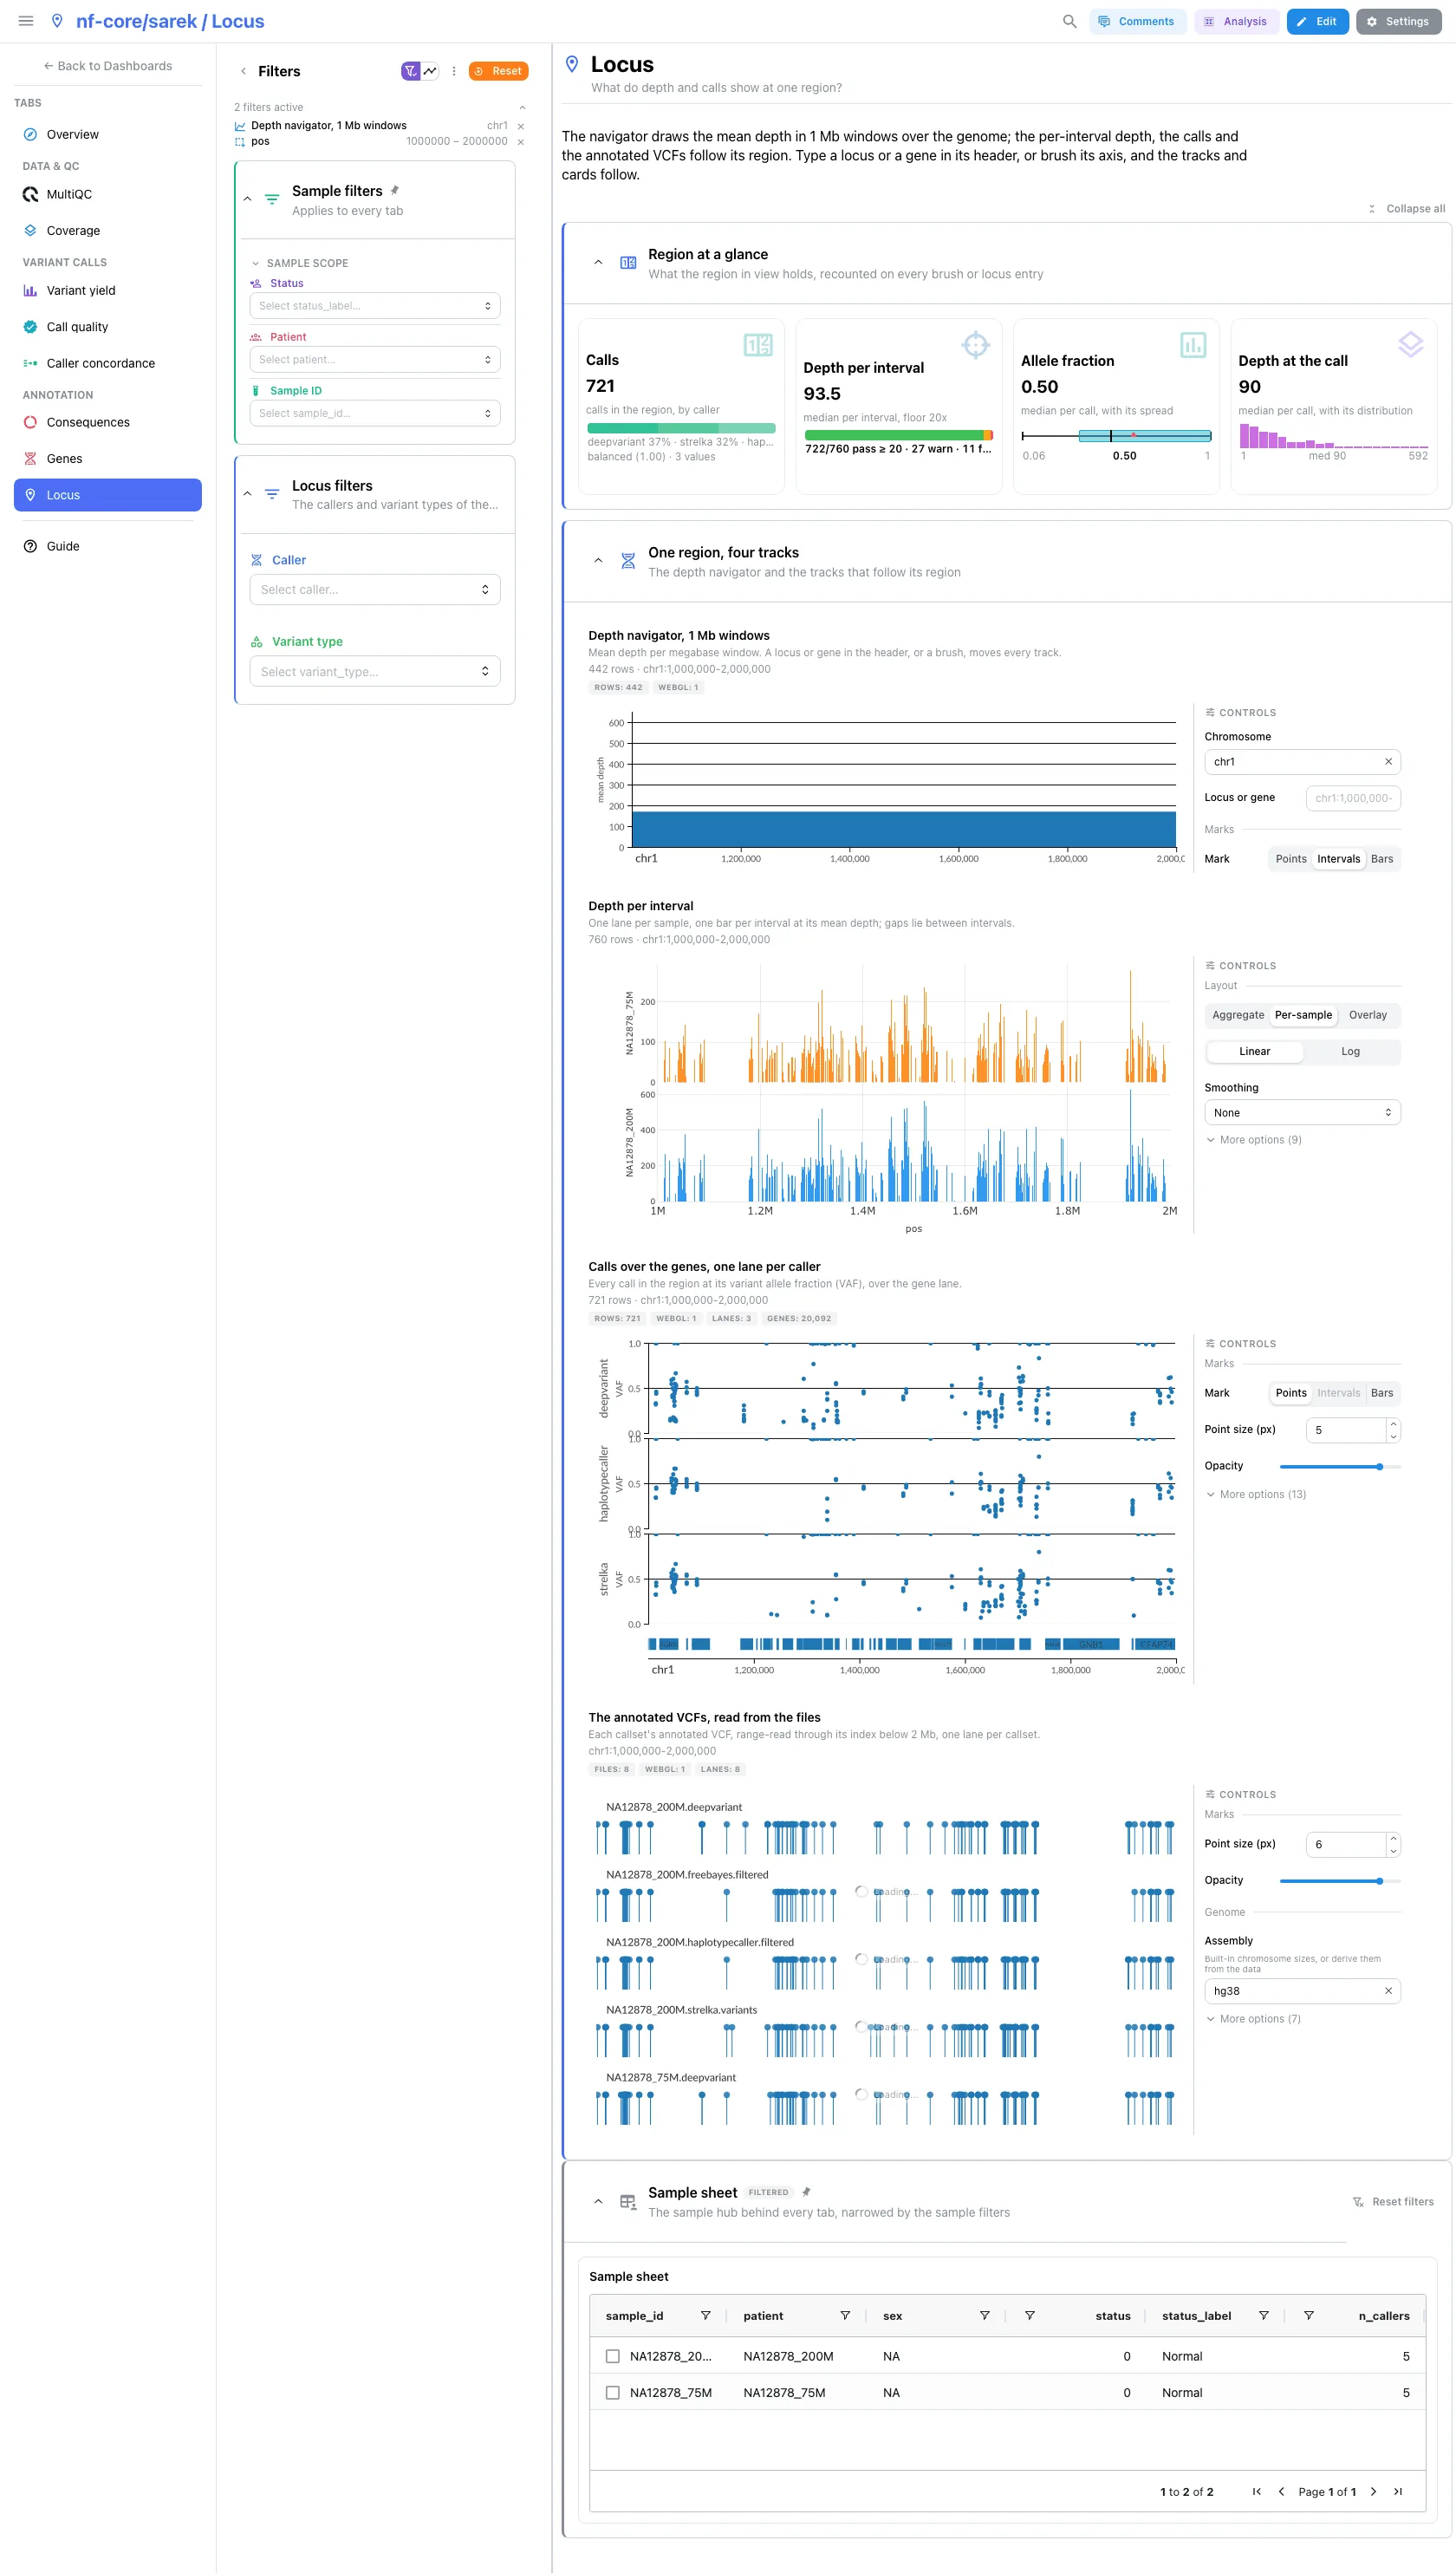
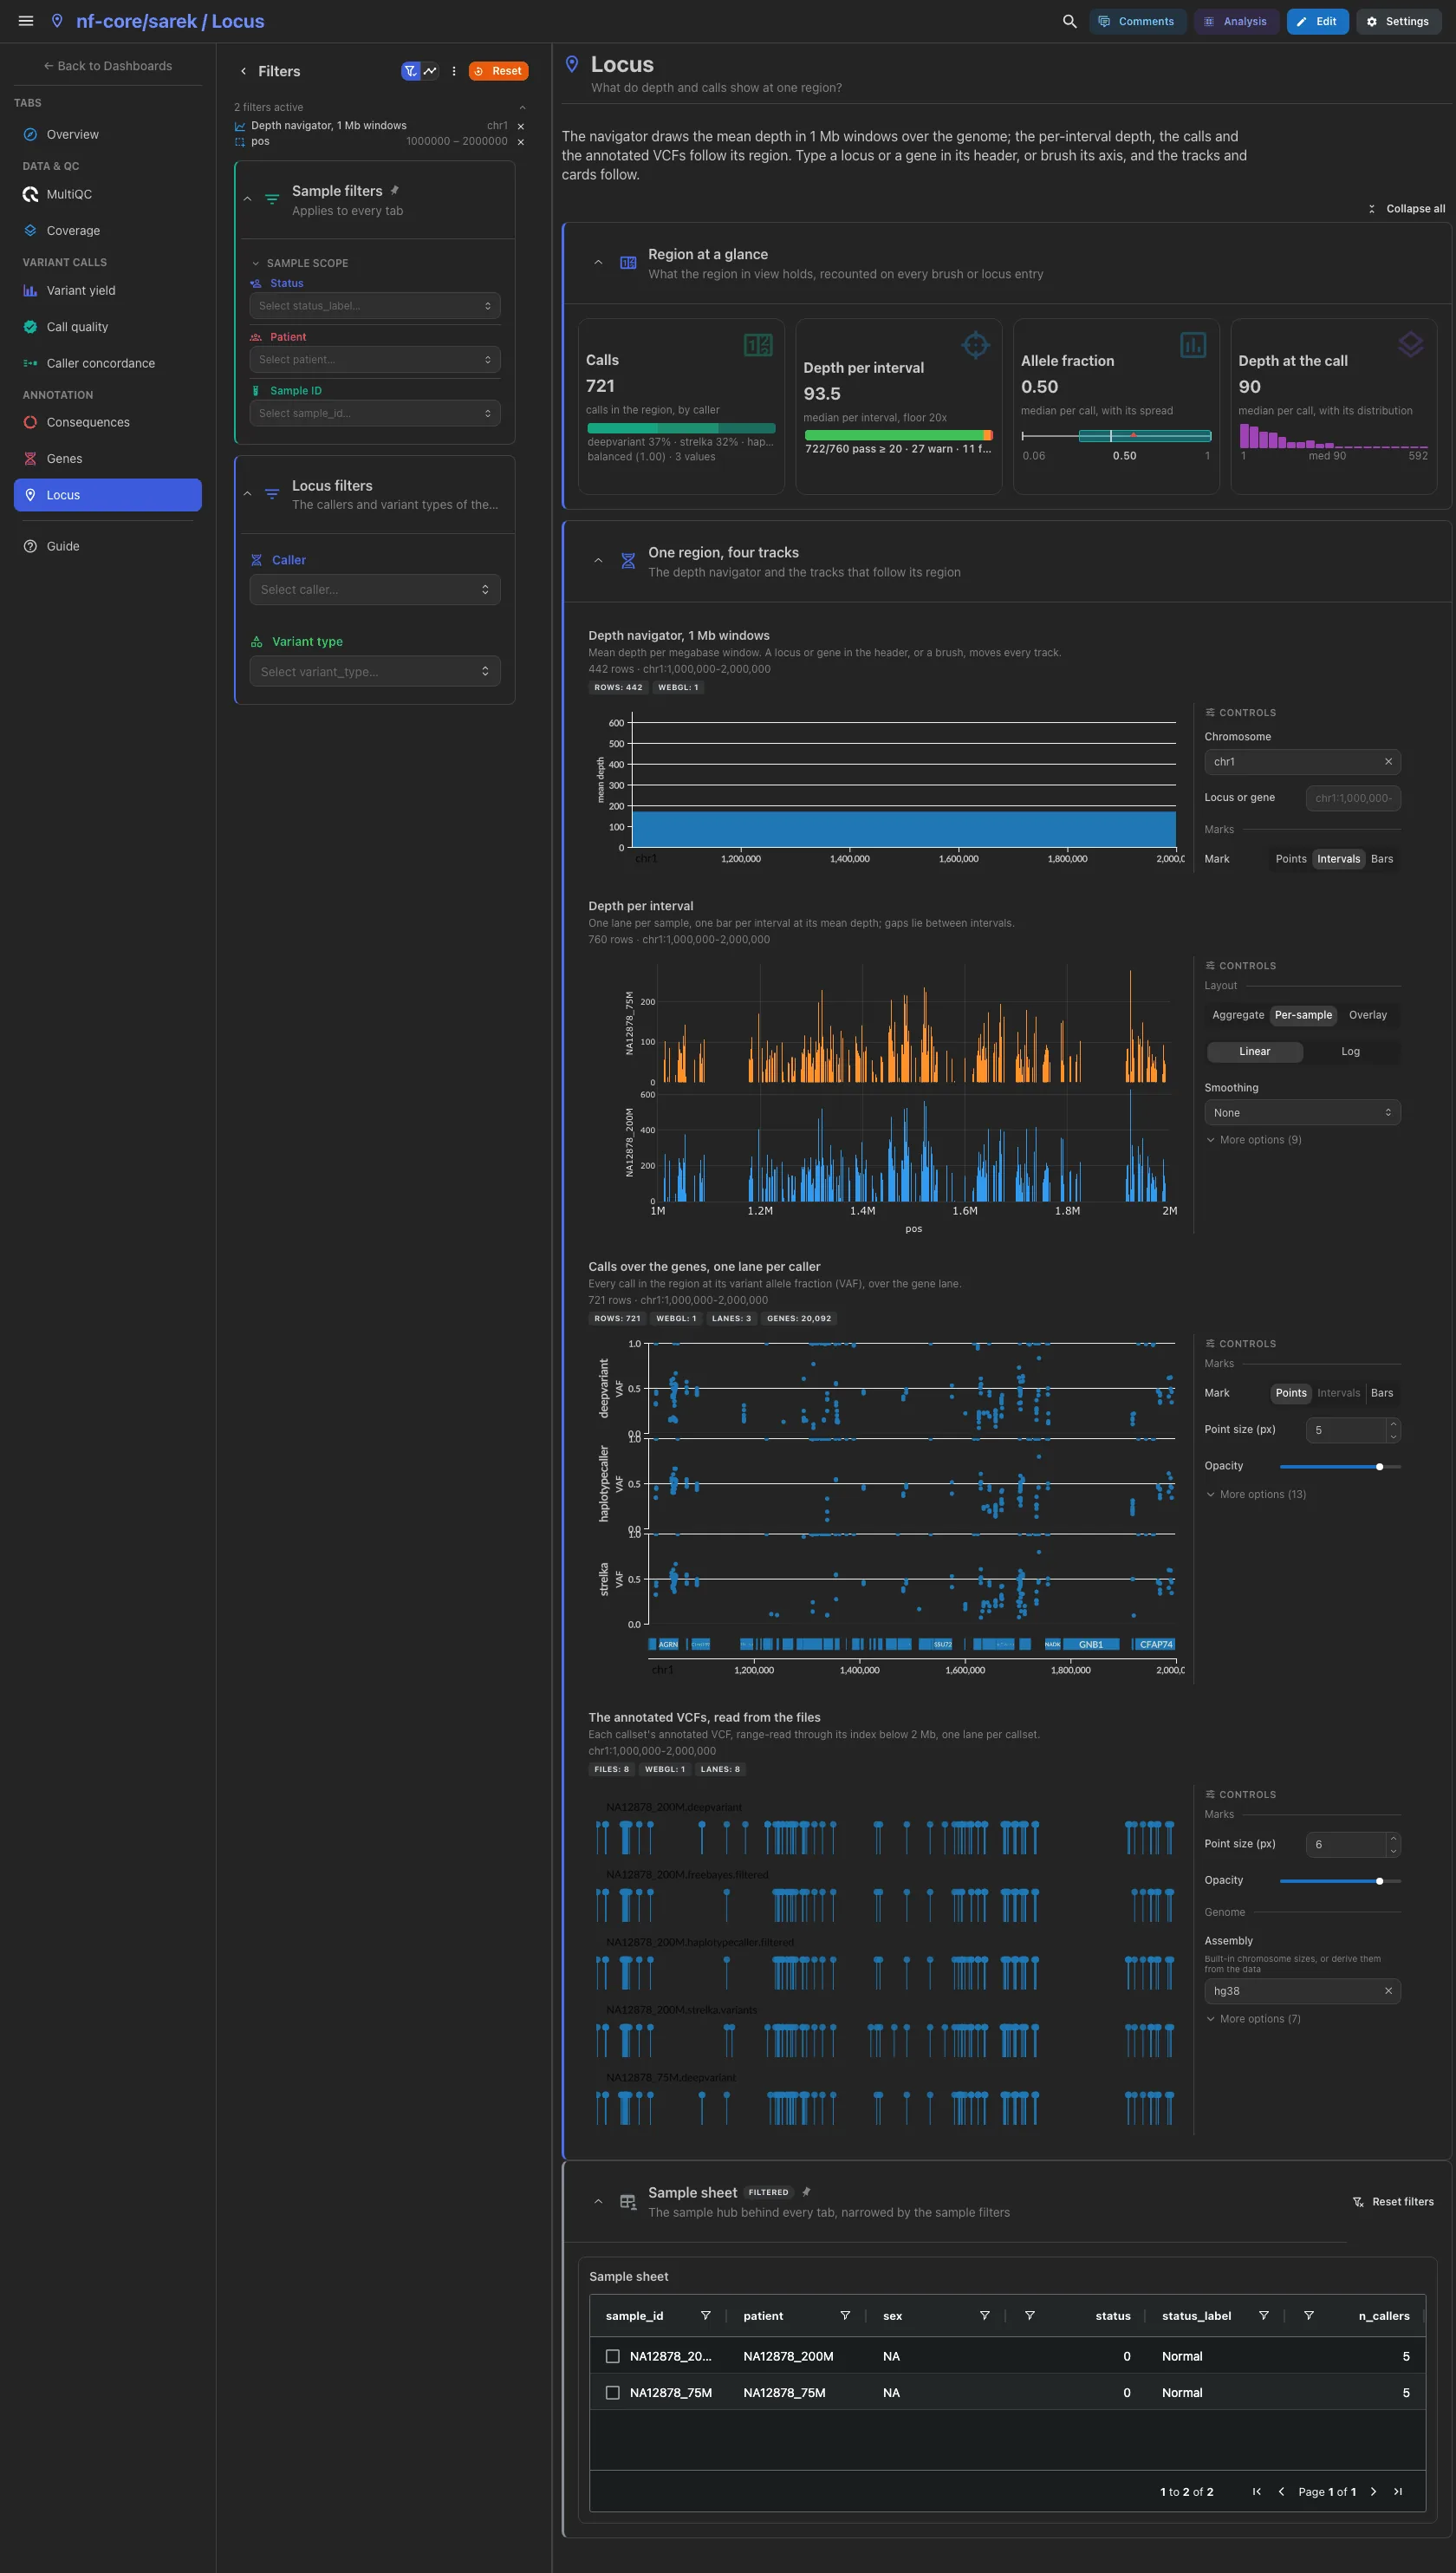
The locus tab stacks four tracks on one {GENOME} axis. The depth navigator,
the mean depth in 1 Mb windows, drives the others: a typed locus or gene, or a
brush on its axis, moves the depth per interval, the calls over the gene lane
(one lane per caller) and the annotated VCFs, range-read from their files
below 2 Mb. It opens on chr1:1,000,000-2,000,000. The four cards (calls by
caller, depth per interval, allele fraction, depth at the call) are recounted
on the region in view.
Filters and components
Filters · Caller and Variant type on vcf_variants, for the call
track and the cards.
| Section | What it holds |
|---|---|
| Region at a glance | 4 cards |
| One region, four tracks | 4 advanced visualizations: the depth navigator, the depth per interval, the calls over the genes and the annotated VCFs |
Tables and point views select on their entity column: the sample sheet on
sample_id; the contig, sex-check, FILTER and distribution tables and the
sex-check scatter on sample; the bcftools and SnpEff summary tables on
caller; the rainfall plot, the impact scatter and the call tables on
variant_key; the per-gene table on gene_name, which reaches the protein
lollipop. A pick narrows the other tiles of its collection and follows the
project links to the collections downstream of it. The variant record on
Consequences shows the call picked in the scatter beside it.
Running the pipeline
Depictio reads the output of nf-core/sarek, it does not run the pipeline. Run the pipeline first, with the callers you want to compare and SnpEff among the tools:
nextflow run nf-core/sarek -r 3.10.0 \
  --input samplesheet.csv \
  --genome GATK.GRCh38 \
  --tools haplotypecaller,deepvariant,strelka,freebayes,manta,snpeff \
  --outdir results -profile docker
Then point Depictio at the results. sarek 3.10.0 ships a MultiQC parquet, so no reprocess step is needed:
See nf-co.re/sarek/usage for full pipeline documentation.
Required data structure
Point depictio ingest at the directory holding the pipeline output. Depictio scans
recursively and matches on file name; the caller and sample directories under
reports/, variant_calling/ and annotation/ are read off the path.
<DATA_ROOT>/
├── csv/*.csv                                  # the hub: sarek's resume manifests
├── pipeline_info/
│   ├── params_*.json
│   └── *software*versions*.yml
├── multiqc/multiqc_data/multiqc.parquet       # native, no reprocess
├── reports/
│   ├── bcftools/<caller>/<sample>/*.bcftools_stats.txt
│   ├── vcftools/<caller>/<sample>/*.{TsTv.qual,FILTER.summary}   # optional
│   ├── mosdepth/<sample>/*.{mosdepth.summary.txt,regions.bed.gz}
│   └── snpeff/<caller>/<sample>/*_snpEff.{csv,genes.txt}         # optional
├── variant_calling/<caller>/<sample>/*.vcf.gz # one VCF per sample and caller
└── annotation/<caller>/<sample>/
    └── *_snpEff.ann.vcf.gz{,.tbi}             # optional; the index feeds the locus track
gVCFs are not read. The somatic outputs (ASCAT, CNVkit, MSIsensor-pro, NGSCheckMate) are declared optional so a somatic run ingests, but no tile binds them yet.
Validation runs
The template was validated against the AWS megatest of the 3.10.0 release,
results-8ccac7ad37b05dd792447763bf9671b719824587, on its
test_full_germline_ncbench_agilent/ profile: one NA12878 exome sequenced at two
depths, five germline callers (DeepVariant, FreeBayes, HaplotypeCaller, Manta,
Strelka) and both annotators. The screenshots above come from that run.
megatest.yaml lists the tables-only subset the template needs, plus the
per-caller VCFs and their SnpEff twins:
bash depictio/projects/nf-core/sarek/3.10.0/download_test_data.sh /tmp/sarek_test
depictio ingest /tmp/sarek_test --template nf-core/sarek/latest
Do not pass --project when ingesting: the dashboard is attached to the
project by name, so renaming it breaks a later depictio dashboard import.
Re-ingesting accumulates dashboards, so delete the project before repeating a run.
Additional resources
- nf-co.re/sarek: official pipeline documentation
- nf-co.re/sarek/3.10.0/results: AWS test results
- Template System Reference: YAML format, variables, conditionals
- Recipes: how to read, test, and write recipes
Authorship
 weber8thomas
Reviewing a template on your own data, or taking over a role here, is a contribution in itself: the contributing guide says what each one involves.