
The atacseq template covers the merged-library, broad-peak route of a standard nf-core/atacseq run:
- Overview: the run in four key figures, live findings and four figures, each linked to the tab that explains it
- Data & QC: the MultiQC report, the ataqv library quality (TSS enrichment, the fragment ladder, where the reads landed), and the deepTools and Picard signal tables
- Peak calls: MACS2 broad calls per library, where HOMER places them relative to genes, and one genomic region across libraries
- Comparison: the consensus peak set, which libraries agree on an interval, and where the libraries sit on the DESeq2 QC of its counts
One MultiQC parquet per run, in one of two places
The release pins MultiQC 1.13, which writes no parquet. The collection binds
the report the pipeline writes itself with MultiQC 1.31 or later swapped in,
which is what the Nextflow trigger ingests:
multiqc/broad_peak/multiqc_data/multiqc.parquet. For a run on the pinned
1.13, the reprocess step writes multiqc/multiqc_data/multiqc.parquet
instead and the collection binds that one:
The CLI ingests every parquet it finds under the data root as its own report,
so a tree must hold exactly one of the two: never reprocess a run that already
published a parquet. The two reports name their modules differently: the
pipeline's numbers a tool run at several levels (picard-1,
mlib_deeptools), a reprocessed one keeps the plain ids. The MultiQC tab
binds the panels both carry under one id, gives the fingerprint and the
insert sizes one tile per report on the same slot, and the import drops the
tiles the bound report lacks.
The broad-peak, merged-library route
The pipeline default calls broad peaks, so the calls are
macs2/broad_peak/*_peaks.broadPeak (BED6+3, no summit column) and a
--narrow_peak run is not bound here. 2.x publishes the whole peak tree twice,
per merged library and per merged replicate; only the merged-library level is
read, because the recipes match on file name and both levels would land in the
same table. No glob names the aligner, so bwa, bowtie2, chromap and STAR runs
bind identically.
No DESeq2 differential accessibility
nf-core/atacseq 2.0 removed the differential accessibility analysis, so this template has no Differential accessibility tab. What the pipeline still runs is a DESeq2 sample QC on the consensus counts, its PCA and its sample distances, and the Consensus tab reads both in its Sample space section.
Quick start
The results directory is the only thing you have to pass. The hub of the dashboard is
the samplesheet the run validated, pipeline_info/samplesheet.valid.csv,
which a template-local recipe turns into one row per merged library with its
group, replicate, read type, role and control. For a run aligned to another
build than hg38, add --var GENOME=<assembly>: it sets the genome axis of the
Locus tab.
depictio config nextflow --install     # once per machine
nextflow run nf-core/atacseq -profile docker --outdir results
No depictio ingest, and no template named: the pipeline ingests its own
output directory when it finishes and resolves this template from its own
manifest. See Nextflow trigger.
Reference
The template reads the validated samplesheet, the ataqv JSON reports, the
deepTools fingerprint and profile tables, the Picard MarkDuplicates metrics, the
MACS2 broad calls and their HOMER annotation, the consensus boolean and
fold-enrichment matrices, the DESeq2 QC of the consensus counts and the MultiQC
parquet. The preseq curve and the DESeq2 QC are optional: 2.x skips preseq by
default, and --skip_deseq2_qc or a design without replicated groups skips the
QC. 70 of its 122 components carry a use: catalog reference, so a tile says
where its panel comes from. The run writes no params.json, so nothing is set
from its parameters: GENOME is the only variable besides DATA_ROOT.
Self-adapting layout
The dashboard adapts to whatever the run actually produced: components bound to pruned or unparsed data collections are hidden, tabs left with no real visualizations are dropped entirely, and the remaining components are re-packed so there are no empty rows.
Template variables
Variables you provide when running the template: DATA_ROOT is the results directory given to depictio ingest, the others are set with --var NAME=value:
| Variable | Required | Description |
|---|---|---|
DATA_ROOT |
✓ | The atacseq --outdir: ALIGNER/merged_library/, fastqc/, trimgalore/, multiqc/, pipeline_info/, plus a MultiQC 1.31 or later parquet, either the pipeline's own under multiqc/broad_peak/multiqc_data/ or a reprocessed one under multiqc/multiqc_data/. |
GENOME |
— | UCSC assembly the run was aligned to (hg38, hg19, mm10, ...). Sets the genome axis of the Locus tab; pass --var GENOME= |
Data collections
21 data collections — 17 required 4 optional · 18 direct 3 derived.
Origin tells you whether a collection is real pipeline data or a reshape of it: direct = a pipeline output (scanned, or a recipe that reads raw files); derived = a recipe that reshapes one or more direct collections into the layout a visualization needs (no new measurement). Reads shows what produces it: a recipe .py transform, whose name links to its source on GitHub, or a raw file scanned off disk. (A direct collection can still have a recipe — one that merely parses/cleans the raw file; derived means the recipe reshapes another collection.)
| Tag | Origin | Type | Reads | Status |
|---|---|---|---|---|
sample_design |
direct | Table | recipe nf-core/atacseq/sample_design.py |
required |
samplesheet |
direct | Table | file samplesheet.valid.csv$ |
required |
multiqc_data |
direct |  MultiQC MultiQC |
file (?:.*/)?multiqc(?:/[^/]+)?/multiqc_data/multiqc.parquet$ |
required |
ataqv_metrics |
direct | Table | recipe ataqv/metrics.py |
required |
ataqv_fragment_length |
direct | Table | recipe ataqv/fragment_length.py |
required |
ataqv_tss_coverage |
direct | Table | recipe ataqv/tss_coverage.py |
required |
ataqv_chromosome_counts |
direct | Table | recipe ataqv/chromosome_counts.py |
required |
picard_markduplicates_metrics_raw |
direct | Table | file .*.mLb.mkD.sorted.MarkDuplicates.metrics.txt$ |
required |
picard_markduplicates_metrics |
derived | Table | recipe picard/markduplicates_metrics.py |
required |
preseq_ccurve_raw |
direct | Table | file .*.lc_extrap.txt$ |
optional |
preseq_complexity_curve |
derived | Table | recipe preseq/complexity_curve.py |
optional |
deeptools_fingerprint_metrics |
direct | Table | recipe deeptools/fingerprint_metrics.py |
required |
deeptools_plot_profile |
direct | Table | recipe deeptools/plot_profile.py |
required |
macs2_peak_summary |
direct | Table | recipe nf-core/atacseq/peak_summary.py |
required |
macs2_broad_peaks |
direct | Table | recipe macs2/broad_peaks.py |
required |
homer_annotated_peaks |
direct | Table | recipe homer/annotate_peaks.py |
required |
homer_tss_distance_profile |
derived | Table | recipe homer/tss_distance_profile.py |
required |
macs2_consensus_boolean |
direct | Table | recipe macs2/consensus_boolean.py |
required |
macs2_consensus_fc |
direct | Table | recipe macs2/consensus_fc.py |
required |
deseq2_qc_pca |
direct | Table | recipe nf-core/atacseq/deseq2_qc_pca.py |
optional |
deseq2_qc_sample_dists |
direct | Table | recipe deseq2/qc_sample_dists.py |
optional |
Cross-DC links
22 links — selecting a value in the source collection filters the target. The join column is shown after the source.
| Source · column | Target | Filters | |
|---|---|---|---|
samplesheet · sample |
→ | multiqc_data |
Filter the read-level MultiQC panels by the sequencing libraries picked in the left panel |
sample_design · sample |
→ | multiqc_data |
Filter the MultiQC panels by the samples picked in the left rail |
sample_design · sample |
→ | macs2_peak_summary |
Filter the peak QC summary by the samples picked in the left rail |
sample_design · sample |
→ | ataqv_metrics |
Filter the ataqv metric table by the samples picked in the left rail |
sample_design · sample |
→ | ataqv_fragment_length |
Filter the fragment-length ladder by the samples picked in the left rail |
sample_design · sample |
→ | ataqv_tss_coverage |
Filter the TSS coverage profiles by the samples picked in the left rail |
sample_design · sample |
→ | ataqv_chromosome_counts |
Filter the read-distribution matrix by the samples picked in the left rail |
sample_design · sample |
→ | picard_markduplicates_metrics |
Filter the duplication metrics by the samples picked in the left rail |
sample_design · sample |
→ | preseq_complexity_curve |
Filter the complexity curves by the samples picked in the left rail |
sample_design · sample |
→ | deeptools_fingerprint_metrics |
Filter the fingerprint metrics by the samples picked in the left rail |
sample_design · sample |
→ | deeptools_plot_profile |
Filter the metagene profiles by the samples picked in the left rail |
sample_design · merged_library |
→ | macs2_broad_peaks |
Filter the peak table by the samples picked in the left rail |
sample_design · merged_library |
→ | homer_annotated_peaks |
Filter the peak annotation by the samples picked in the left rail |
sample_design · merged_library |
→ | homer_tss_distance_profile |
Filter the TSS distance profiles by the samples picked in the left rail |
macs2_broad_peaks · peak_id |
→ | homer_annotated_peaks |
Carry a peak selected on the MACS2 panels over to its HOMER annotation |
homer_annotated_peaks · peak_id |
→ | macs2_broad_peaks |
Carry a peak selected in the annotation table back to the MACS2 panels |
macs2_broad_peaks · chr |
→ | macs2_consensus_boolean |
A region typed or brushed on the peak navigator narrows the consensus intervals |
macs2_broad_peaks · chr |
→ | homer_annotated_peaks |
A region typed or brushed on the peak navigator narrows the HOMER annotation track |
macs2_consensus_boolean · peak_id |
→ | macs2_consensus_fc |
Carry a consensus interval selected on the overlap panels over to the signal heatmap |
macs2_consensus_fc · peak_id |
→ | macs2_consensus_boolean |
Carry a consensus interval selected on the signal heatmap back to the overlap panels |
sample_design · sample |
→ | deseq2_qc_pca |
Filter the consensus PCA by the samples picked in the left rail |
sample_design · sample |
→ | deseq2_qc_sample_dists |
Filter the consensus distance matrix by the samples picked in the left rail |
Recipes
Each recipe reshapes raw pipeline output into a tidy table. The name links to its source; Output lists the validated OUTPUT_SCHEMA columns.
| Recipe | Transforms | Output |
|---|---|---|
ataqv/chromosome_counts.py |
Reads per reference sequence, per library, from the ataqv JSON reports. | sample, chromosome, read_count, fraction_of_reads, log10_read_count |
ataqv/fragment_length.py |
Fragment-length distribution of every ATAC library, in long form. | sample, fragment_length, read_count, fraction_of_all_reads, fragment_class |
ataqv/metrics.py |
Per-library ATAC quality metrics from the ataqv JSON reports. | sample, tss_enrichment, total_reads, hqaa, hqaa_fraction, hqaa_in_peaks, hqaa_overlapping_peaks_percent, total_autosomal_reads, total_mitochondrial_reads, mitochondrial_fraction, duplicate_fraction, duplicate_fraction_in_peaks, duplicate_fraction_not_in_peaks, peak_duplicate_ratio, total_peaks, total_peak_territory, hqaa_tf_count, hqaa_mononucleosomal_count, short_mononucleosomal_ratio, max_fraction_reads_from_single_autosome, median_mapq, properly_paired_fraction, maximum_proper_pair_fragment_size, median_fragment_length, ataqv_version |
ataqv/tss_coverage.py |
Coverage profile around transcription start sites, in long form. | sample, position, coverage |
deeptools/fingerprint_metrics.py |
Per-sample deepTools fingerprint metrics, one row per library. | sample, auc, synthetic_auc, auc_ratio, x_intercept, synthetic_x_intercept, elbow_point, synthetic_elbow_point, synthetic_js_distance |
deeptools/plot_profile.py |
deepTools metagene profile in long form, one row per sample and bin. | sample, group, bin, bin_label, signal |
deseq2/qc_sample_dists.py |
The DESeq2 QC sample-distance matrix the pipeline already computed. | sample |
homer/annotate_peaks.py |
Tidy HOMER annotatePeaks.pl output into a per-peak annotation table. |
sample, peak_id, chr, start, end, strand, peak_score, annotation_class, annotation, distance_to_tss, nearest_promoter_id, gene_name, gene_type |
homer/tss_distance_profile.py |
Where each sample's peaks sit relative to the nearest TSS, pre-binned. | sample, distance_to_tss, peak_count, fraction |
macs2/broad_peaks.py |
Concatenate MACS2 broadPeak calls into one tidy peak table. | sample, peak_id, chr, start, end, width, midpoint, score, fold_enrichment, neg_log10_pvalue, neg_log10_qvalue |
macs2/consensus_boolean.py |
Consensus peak x sample presence matrix from MACS2 consensus boolean tables. | peak_id, consensus_set, interval_id, chr, start, end, num_peaks, num_samples |
macs2/consensus_fc.py |
Fold-enrichment matrix of the strongest MACS2 consensus peaks. | peak_id, consensus_set, interval_id, chr, region, support |
nf-core/atacseq/deseq2_qc_pca.py |
DESeq2 QC principal components of the consensus counts, with each sample's group. | sample_id, dim_1, dim_2, dim_1_percent, dim_2_percent, pca_set, group |
nf-core/atacseq/peak_summary.py |
Per-sample MACS2 peak QC for atacseq 2.x: call count, FRiP score, peak spreads. | sample, num_peaks, frip_score, width_median, width_mean, width_max, fold_enrichment_median, fold_enrichment_mean, neg_log10_qvalue_median, neg_log10_pvalue_median |
nf-core/atacseq/sample_design.py |
One row per ATAC sample, derived from the samplesheet the run validated. | sample, merged_library, group, replicate, replicate_label, read_type, role, control, n_libraries, libraries |
picard/markduplicates_metrics.py |
Duplication metrics from a Picard MarkDuplicates report. | sample, library, unpaired_reads_examined, read_pairs_examined, unmapped_reads, unpaired_read_duplicates, read_pair_duplicates, read_pair_optical_duplicates, duplicate_reads, reads_after_dedup, percent_duplication, estimated_library_size |
preseq/complexity_curve.py |
Library complexity curve with its confidence ribbon, one row per read depth. | sample, total_reads, expected_distinct, lower_ci, upper_ci, ci_width |
Dashboard tabs
One dashboard: the Overview, then seven child tabs in three groups, read as a funnel from library quality to the peaks the libraries agree on. Each tab below carries the same icon and colour the dashboard gives it, so the page and the app read alike.
| Group | Tabs |
|---|---|
| Data & QC | MultiQC, ATAC quality, Signal |
| Peak calls | Peaks, Annotation, Locus |
| Comparison | Consensus |
Each child tab opens with a short intro and a strip of four cards, then at most
three open sections; tables and details follow, collapsed. The persistent Sample
filters (group, sample, replicate) sit in the left panel and narrow every tab
through the project links; QC thresholds (TSS enrichment, FRiP, peaks called)
sit collapsed under them. The Sample sheet and Reference tables (the
per-library peak QC) are pinned, collapsed, to the bottom of every child tab. The
template has no metadata file and no grouping variable: every grouped tile reads
the samplesheet's group column. Each library has two spellings, bare and
.mLb.clN, and the hub carries both, so one pick in the filter reaches every
panel. The consensus matrices have the libraries as columns, so the sample
filters do not narrow them.
Chromatin accessibility, from library quality to the peaks the libraries agree on.
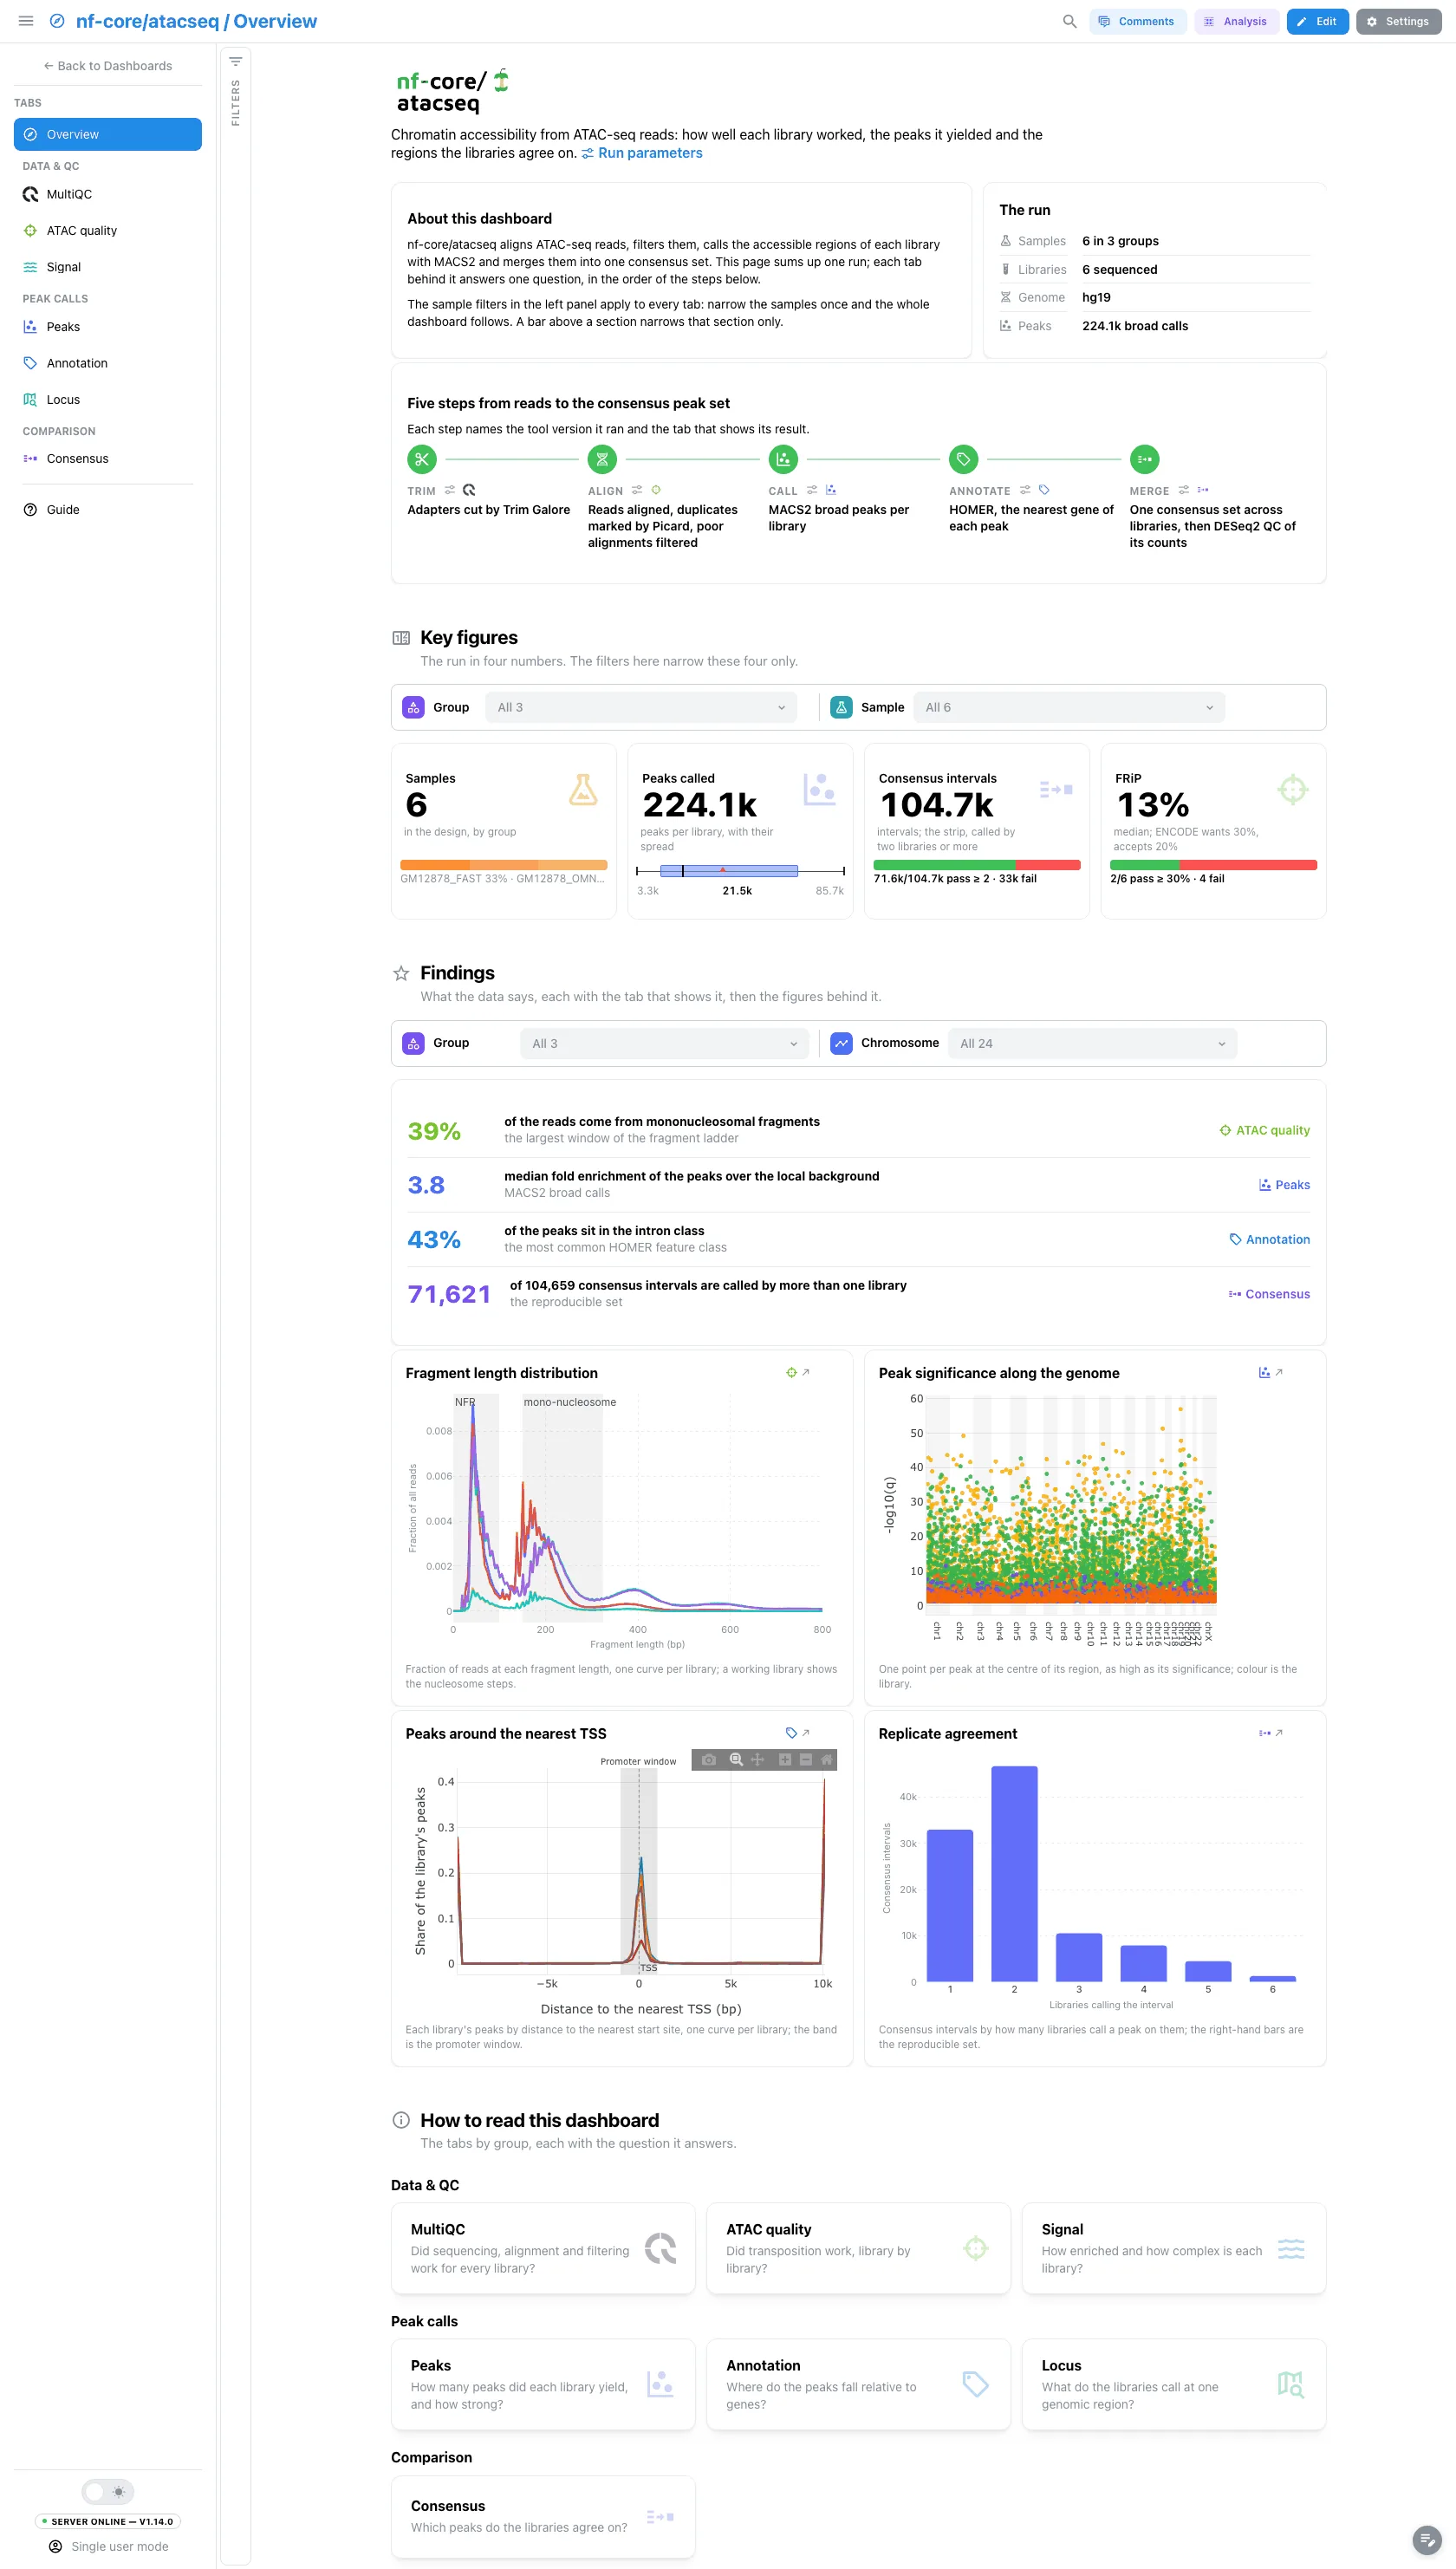
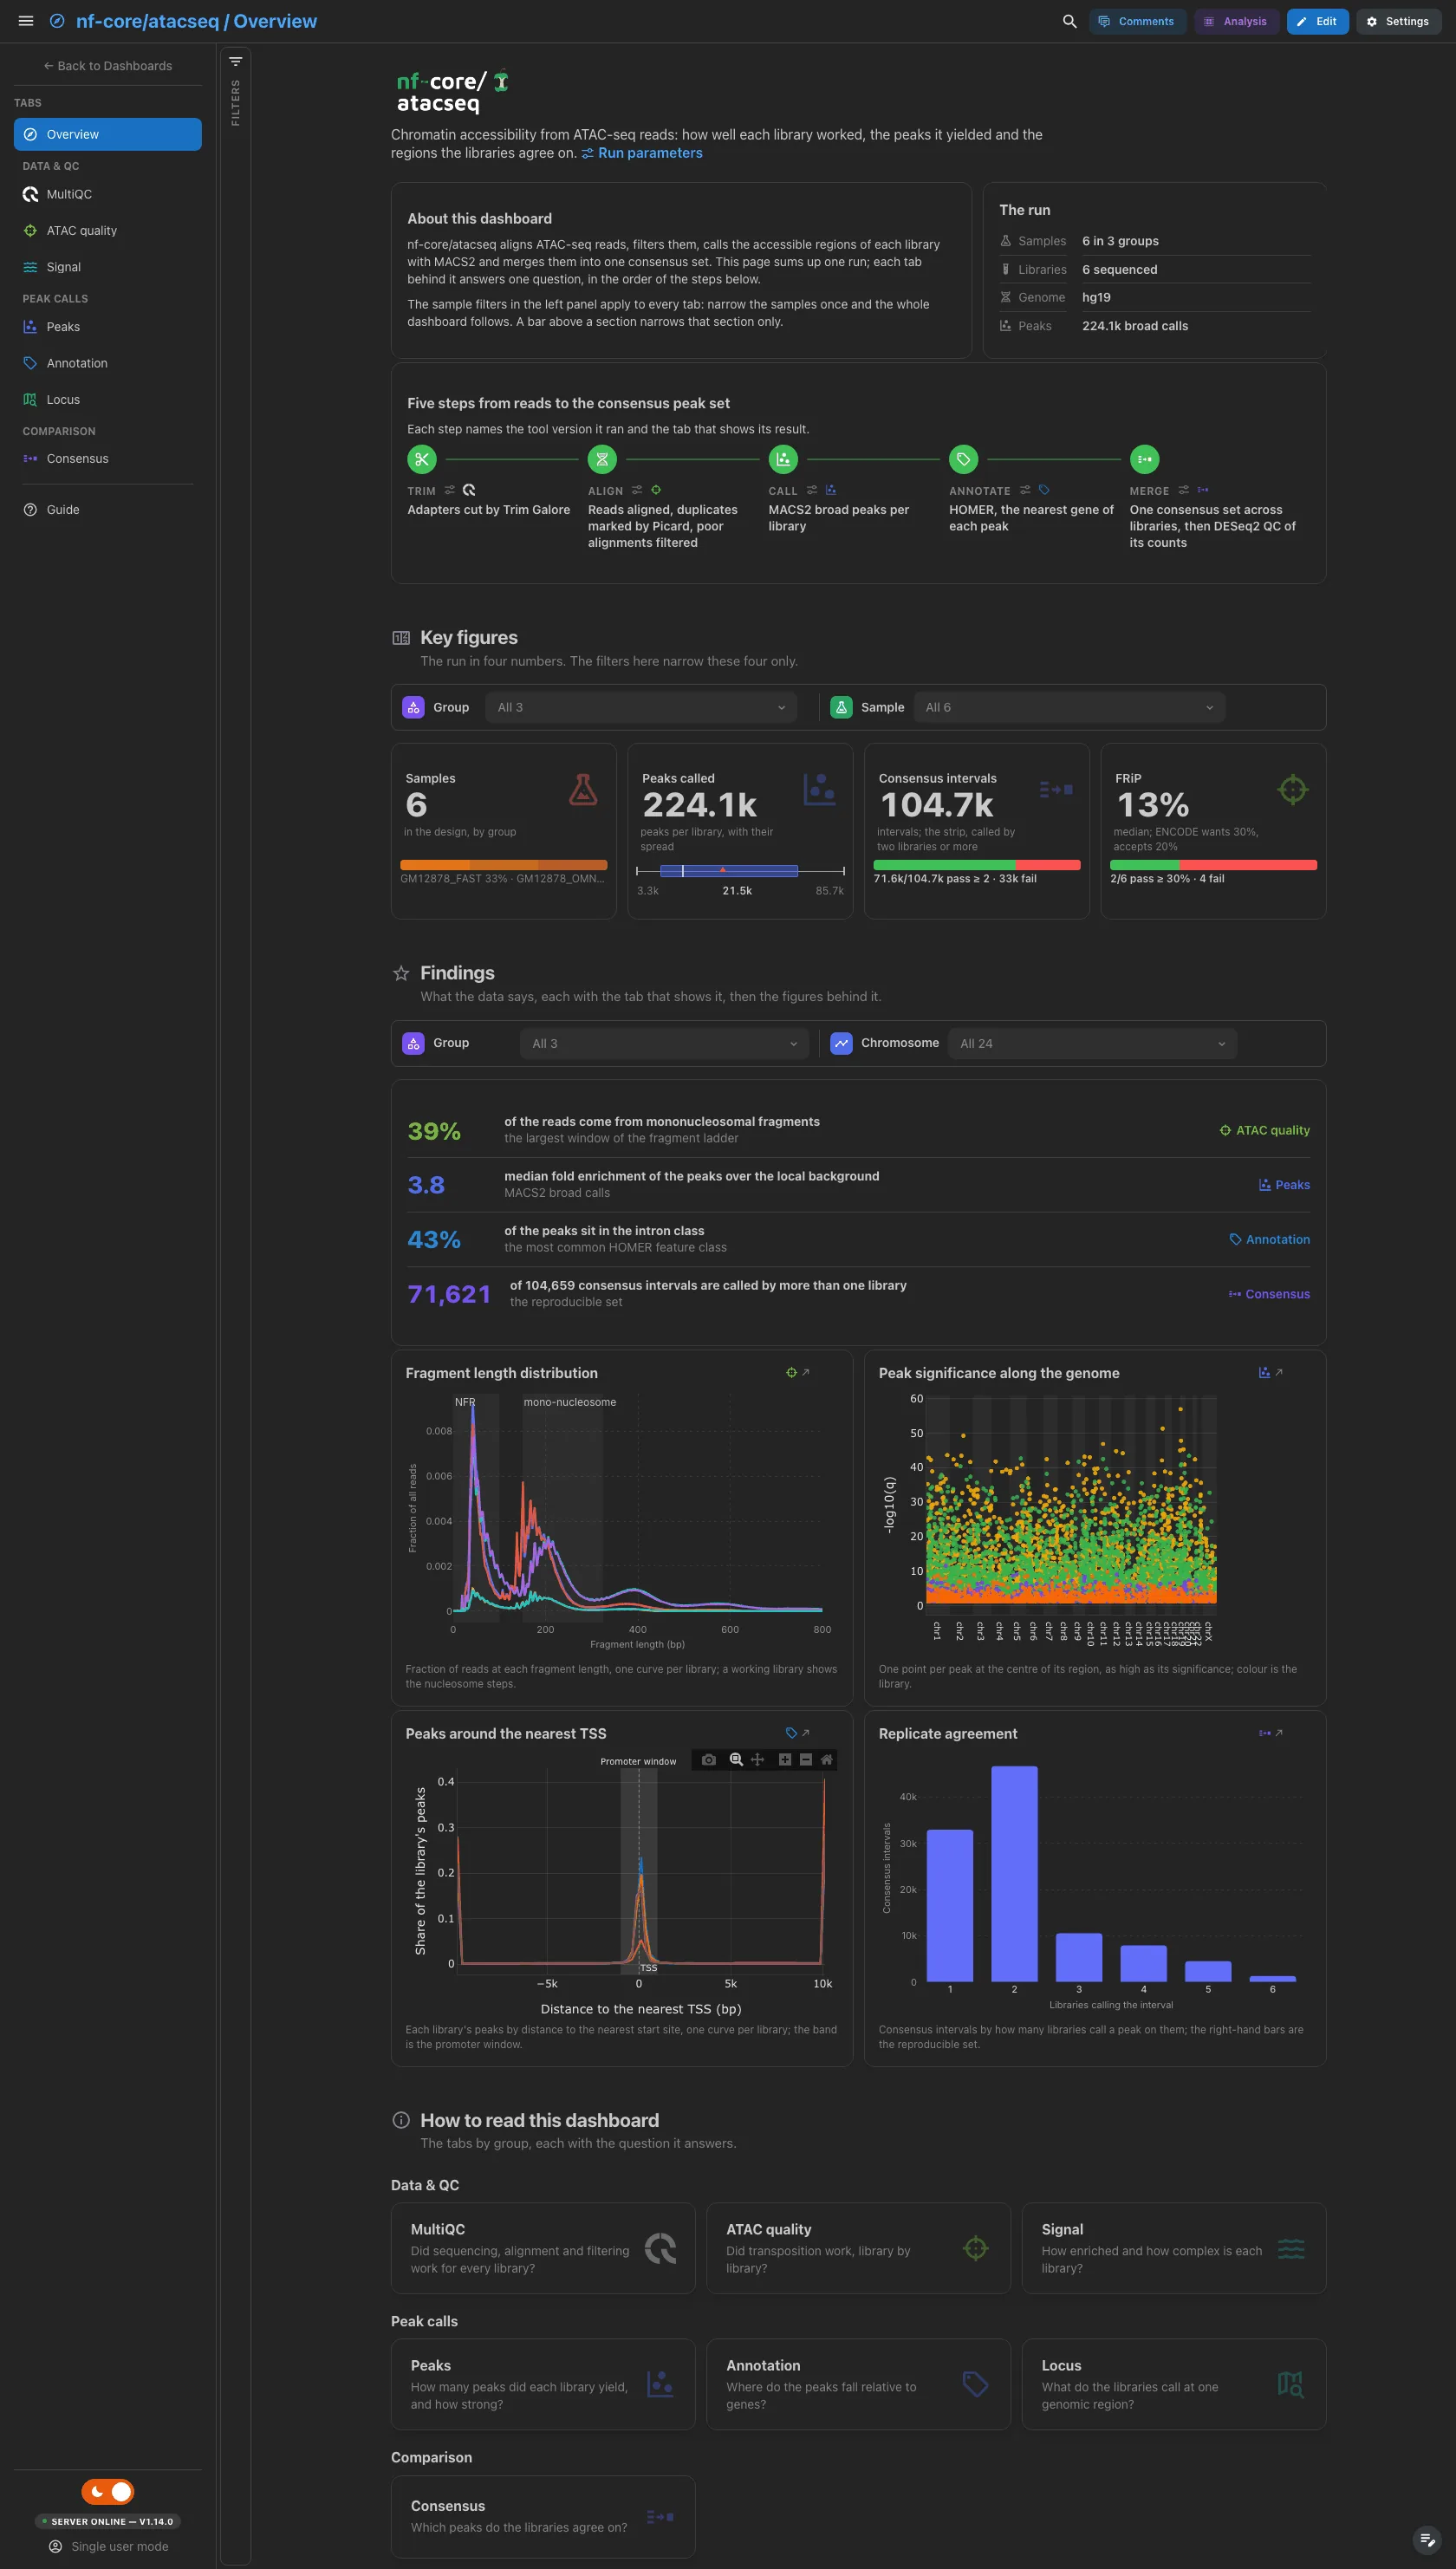
A short hero links the run parameters, which for atacseq 2.x are the software
versions: the run ships no params.json. About this dashboard says how the
two filter levels work, The run lists the samples and groups, the sequenced
libraries, the genome build and the peaks called, and Pipeline walks the five
steps from trimming to the consensus merge, each linked to its tool version and
its tab. The findings are live values: they follow the filters, and a route that
lacks their data drops them. The fragment ladder takes the first figure slot: it
is the ATAC-specific check a reader looks at first.
Filters and components
Filters · the left panel starts collapsed. Key figures has its own filter bar (group and sample), and so does Findings (group and chromosome): each narrows its own section only. The consensus card reads a table with the libraries as columns, which the Key figures bar does not reach.
| Section | What it holds |
|---|---|
| Top | Hero, About this dashboard, The run, Pipeline |
| Key figures | 4 headline cards: samples, peaks called, consensus intervals, FRiP |
| Findings | Live result rows, then 4 figures: the fragment ladder, the peak significance along the genome, the peaks around the nearest start site and the consensus intervals by the number of libraries calling them |
| How to read this dashboard | The tabs by group, each with its question |
Data & QC · Did sequencing, alignment and filtering work for every library?
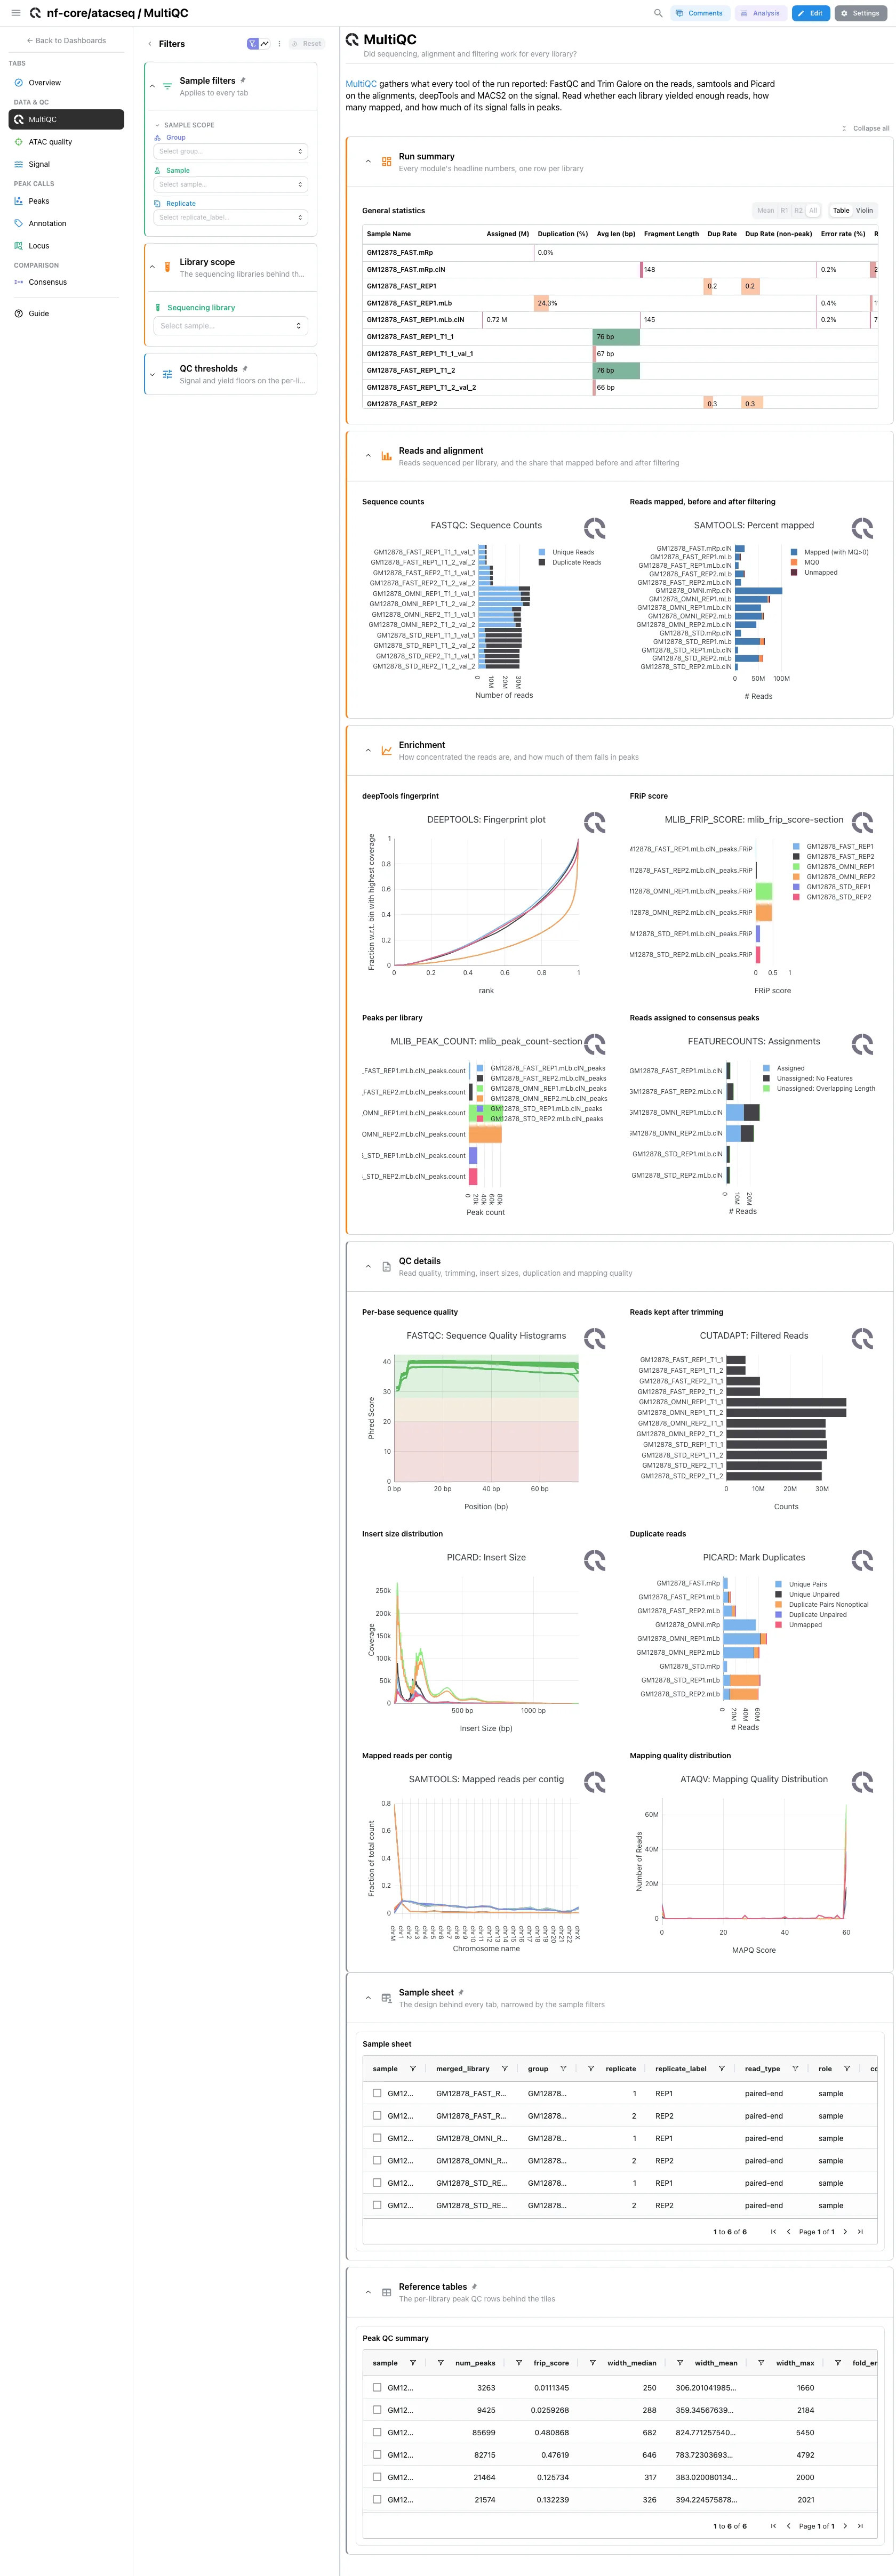
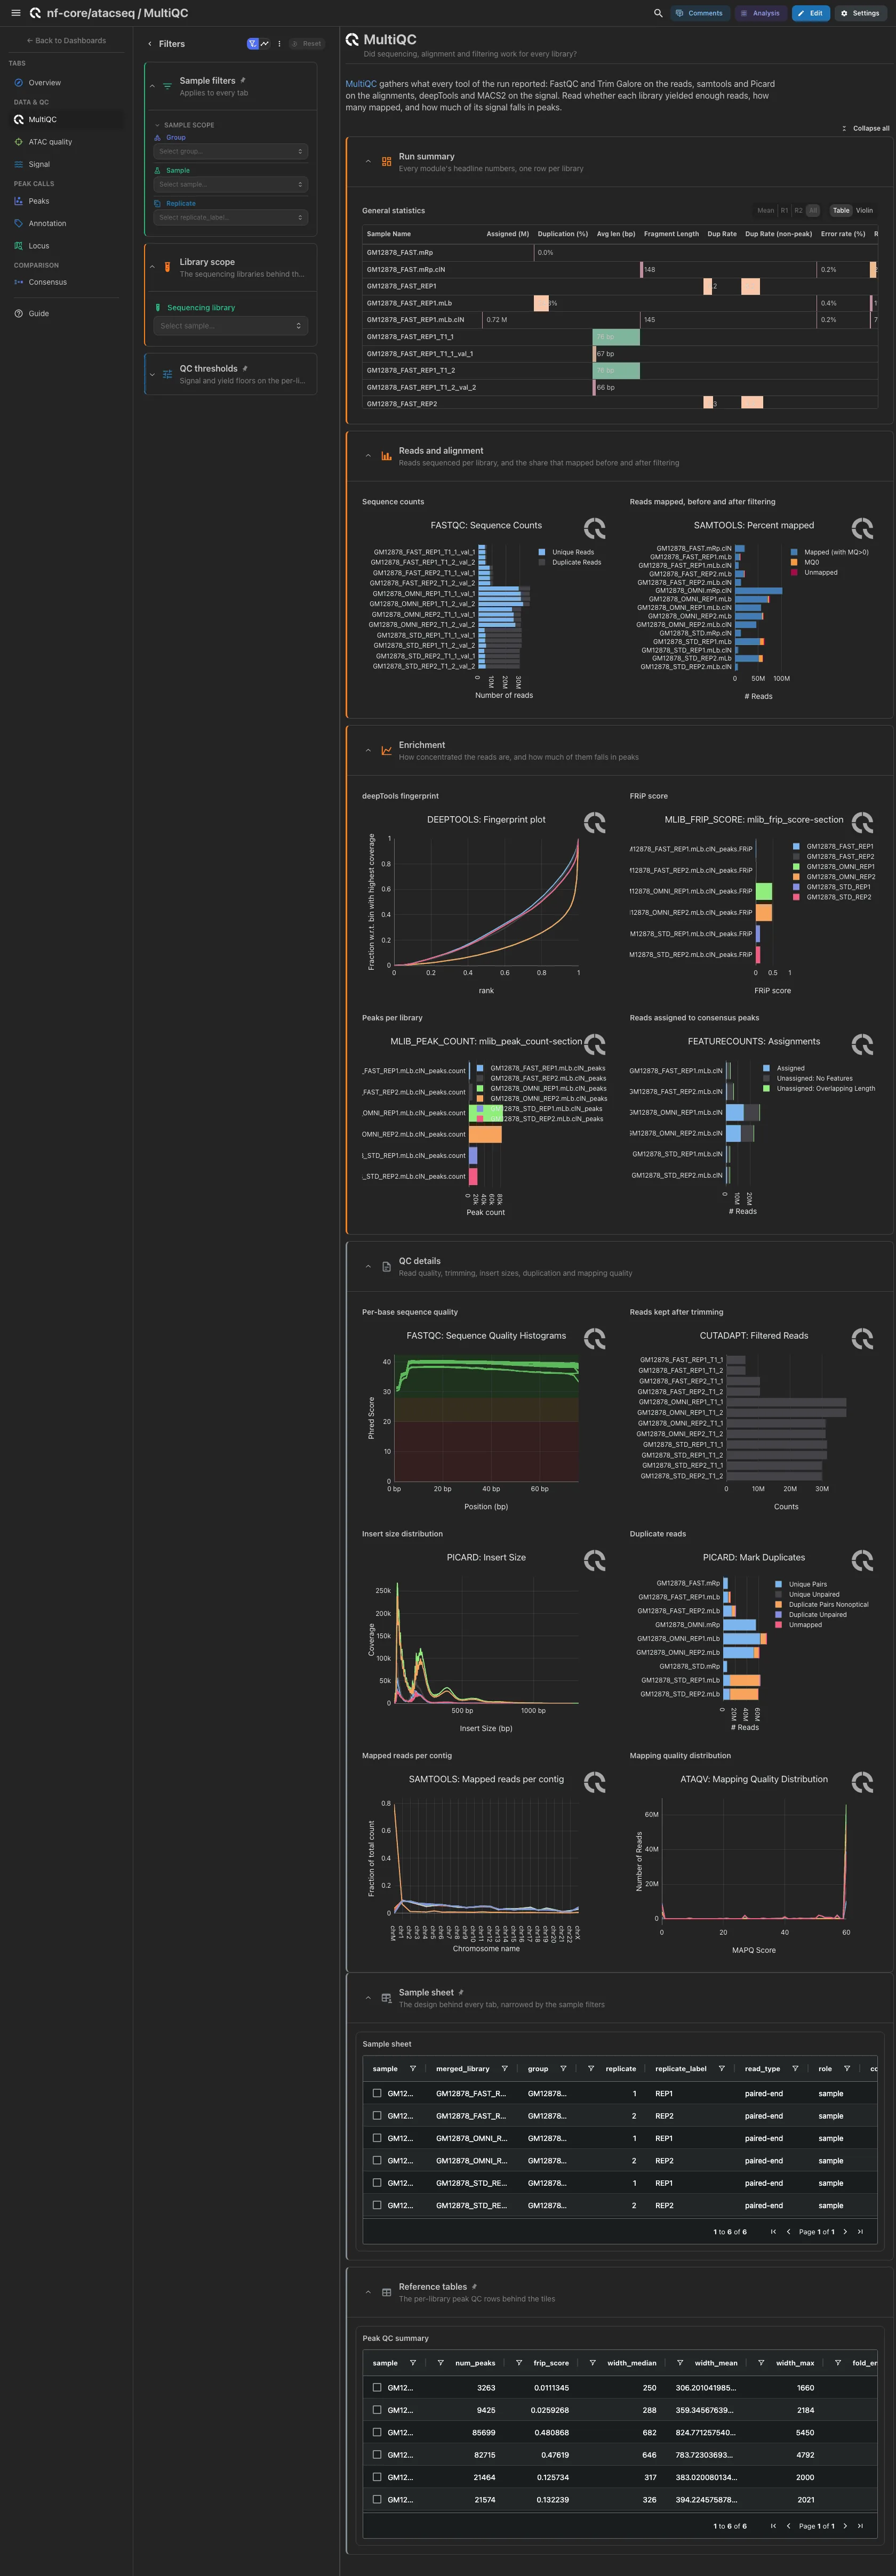
MultiQC panels only. Open: general statistics, FastQC sequence counts beside samtools percent mapped, then the deepTools fingerprint, FRiP scores, peaks per library and featureCounts assignments. Per-base quality, Trim Galore kept reads, Picard insert sizes and duplicates, mapped reads per contig and the ataqv mapping quality are collapsed. The general statistics, featureCounts and ataqv tiles exist on a reprocessed report only, and the import drops them on the pipeline's own.
Filters and components
Filters · Sequencing library on samplesheet, in its own Library
scope group: the read-level panels are keyed on the sequencing library, a
finer grain than the sample every other tab works in.
| Section | What it holds |
|---|---|
| Run summary | 1 MultiQC panel |
| Reads and alignment | 2 MultiQC panels |
| Enrichment | 4 MultiQC panels (the fingerprint has one tile per report, on one slot) |
| QC details (collapsed) | 6 MultiQC panels (the insert sizes have one tile per report, on one slot) |
Data & QC · Did transposition work, library by library?
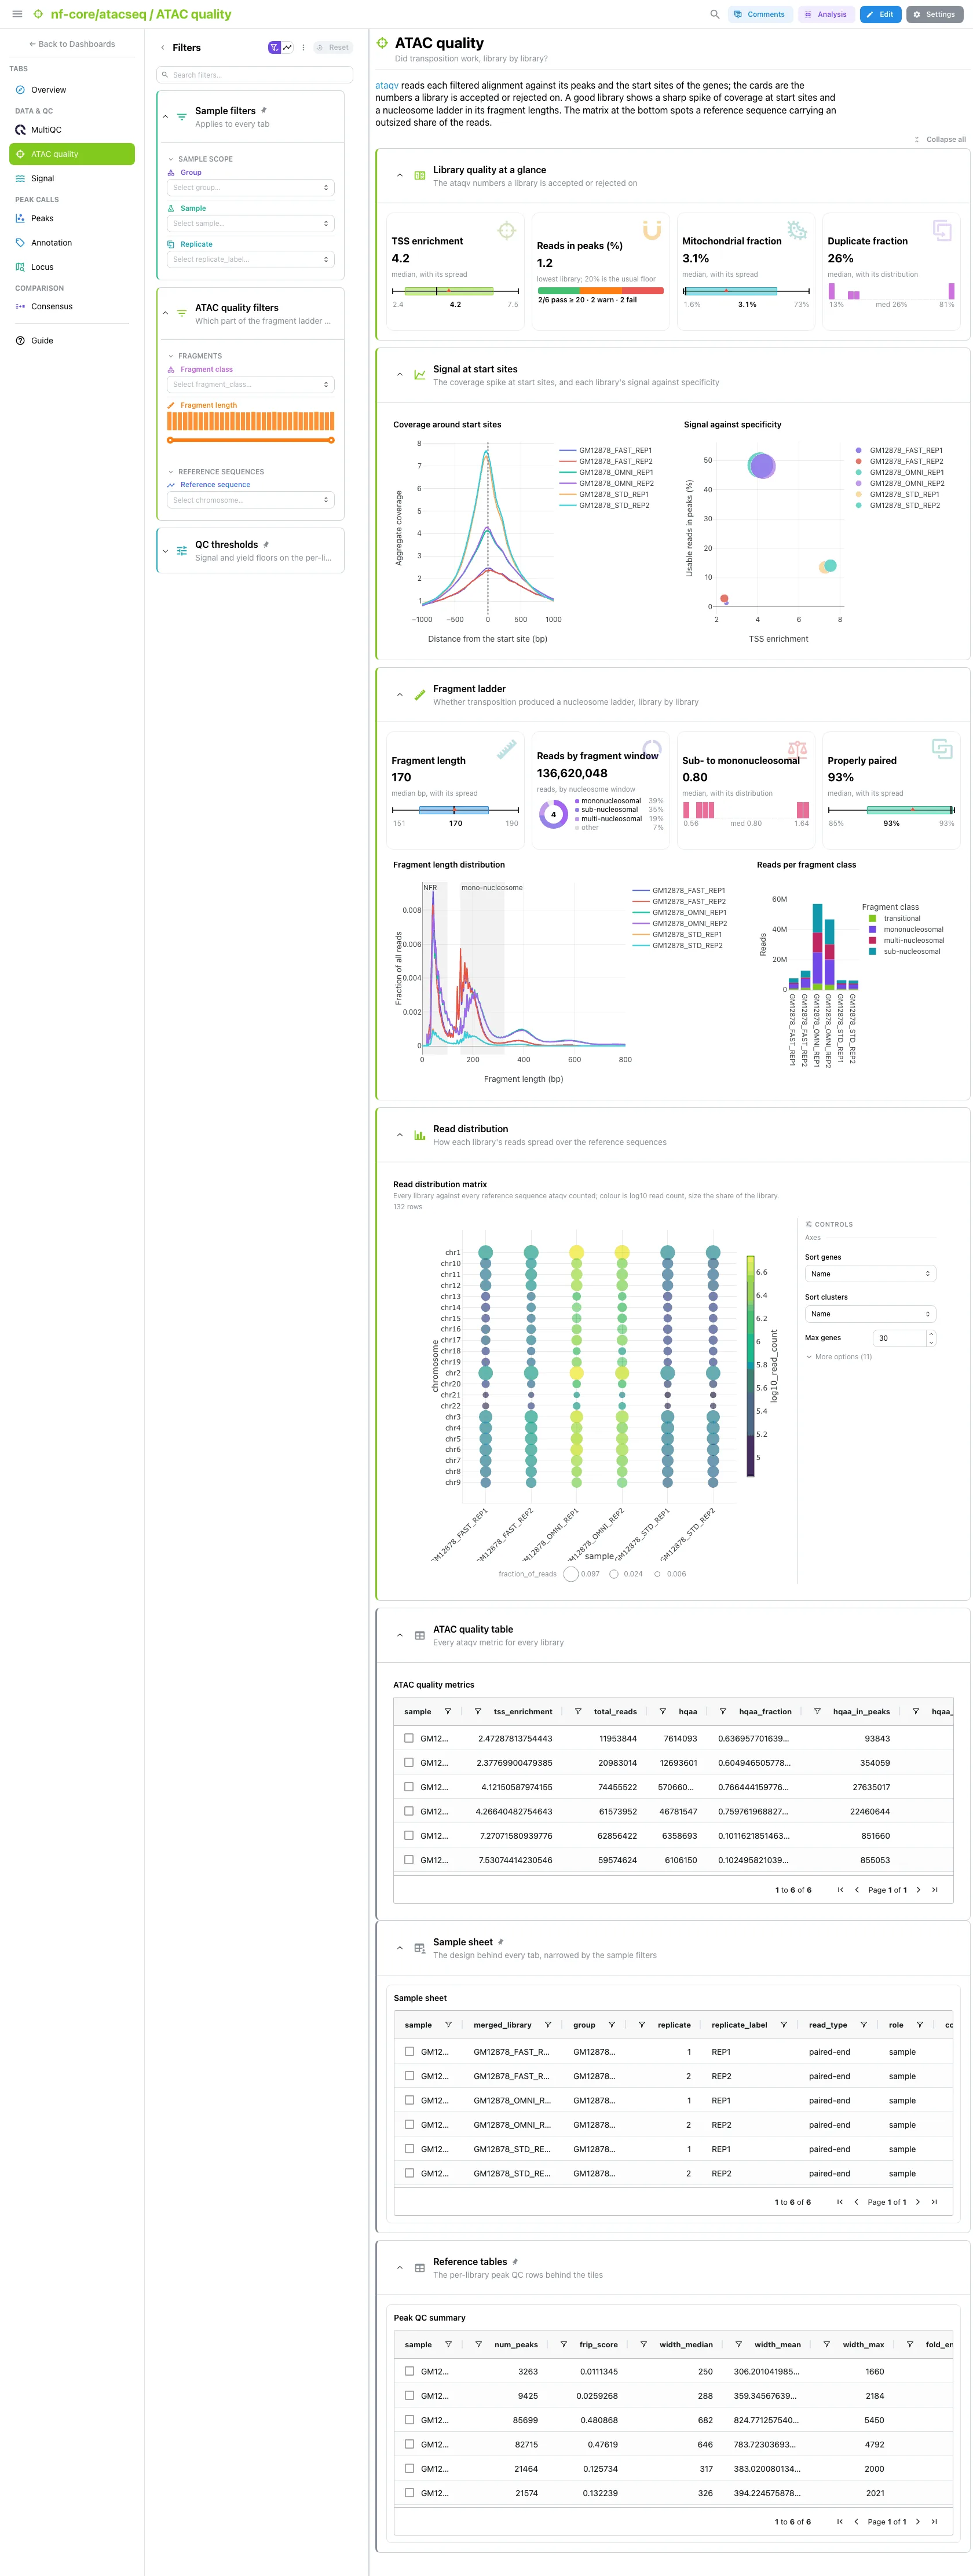
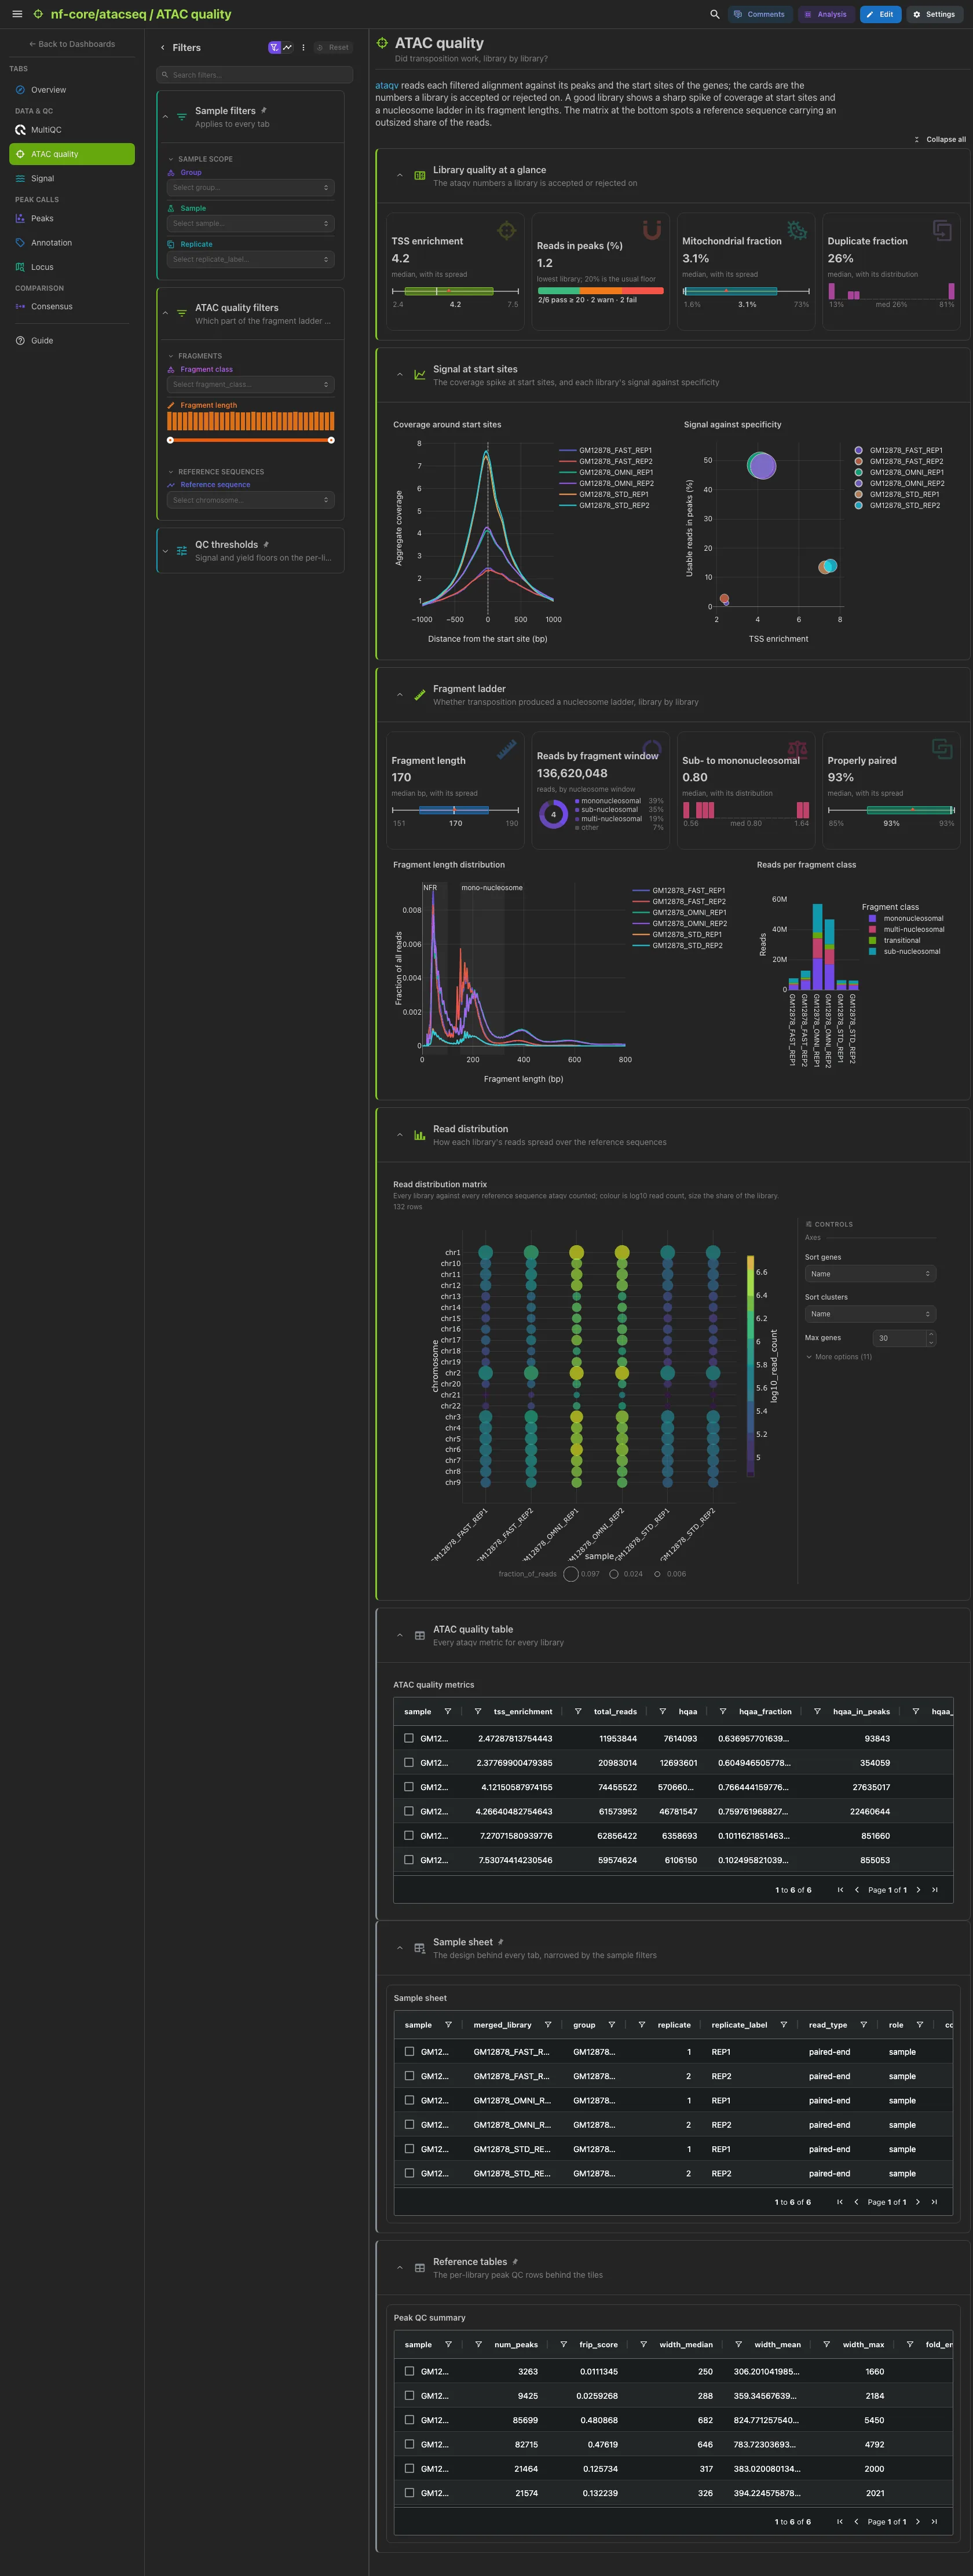
The ataqv numbers a library is accepted or rejected on: TSS enrichment, the
lowest share of reads in peaks, the mitochondrial fraction and the duplicate
fraction. Then the coverage around start sites beside the signal against
specificity scatter, where a lasso selects libraries. The fragment ladder has
four cards of its own (fragment length, reads by nucleosome window, the sub- to
mononucleosomal ratio, properly paired reads), the fragment-length curve with
the nucleosome-free and mononucleosome windows shaded, and the reads per
fragment class. The read distribution matrix closes the tab: read its chrM row
first, since a high share there is the classic ATAC failure.
Filters and components
Filters · Fragment class and a Fragment length range on
ataqv_fragment_length, plus Reference sequence on
ataqv_chromosome_counts.
| Section | What it holds |
|---|---|
| Library quality at a glance | 4 cards |
| Signal at start sites | 1 line chart + 1 scatter |
| Fragment ladder | 4 cards, 1 line chart + 1 bar |
| Read distribution | 1 advanced visualization |
| ATAC quality table (collapsed) | ATAC quality metrics |
Single-end libraries read thinner
ataqv writes no per-reference counts and no TSS values for single-end libraries, so they are absent from the read distribution matrix and from the TSS readings.
Data & QC · How enriched and how complex is each library?
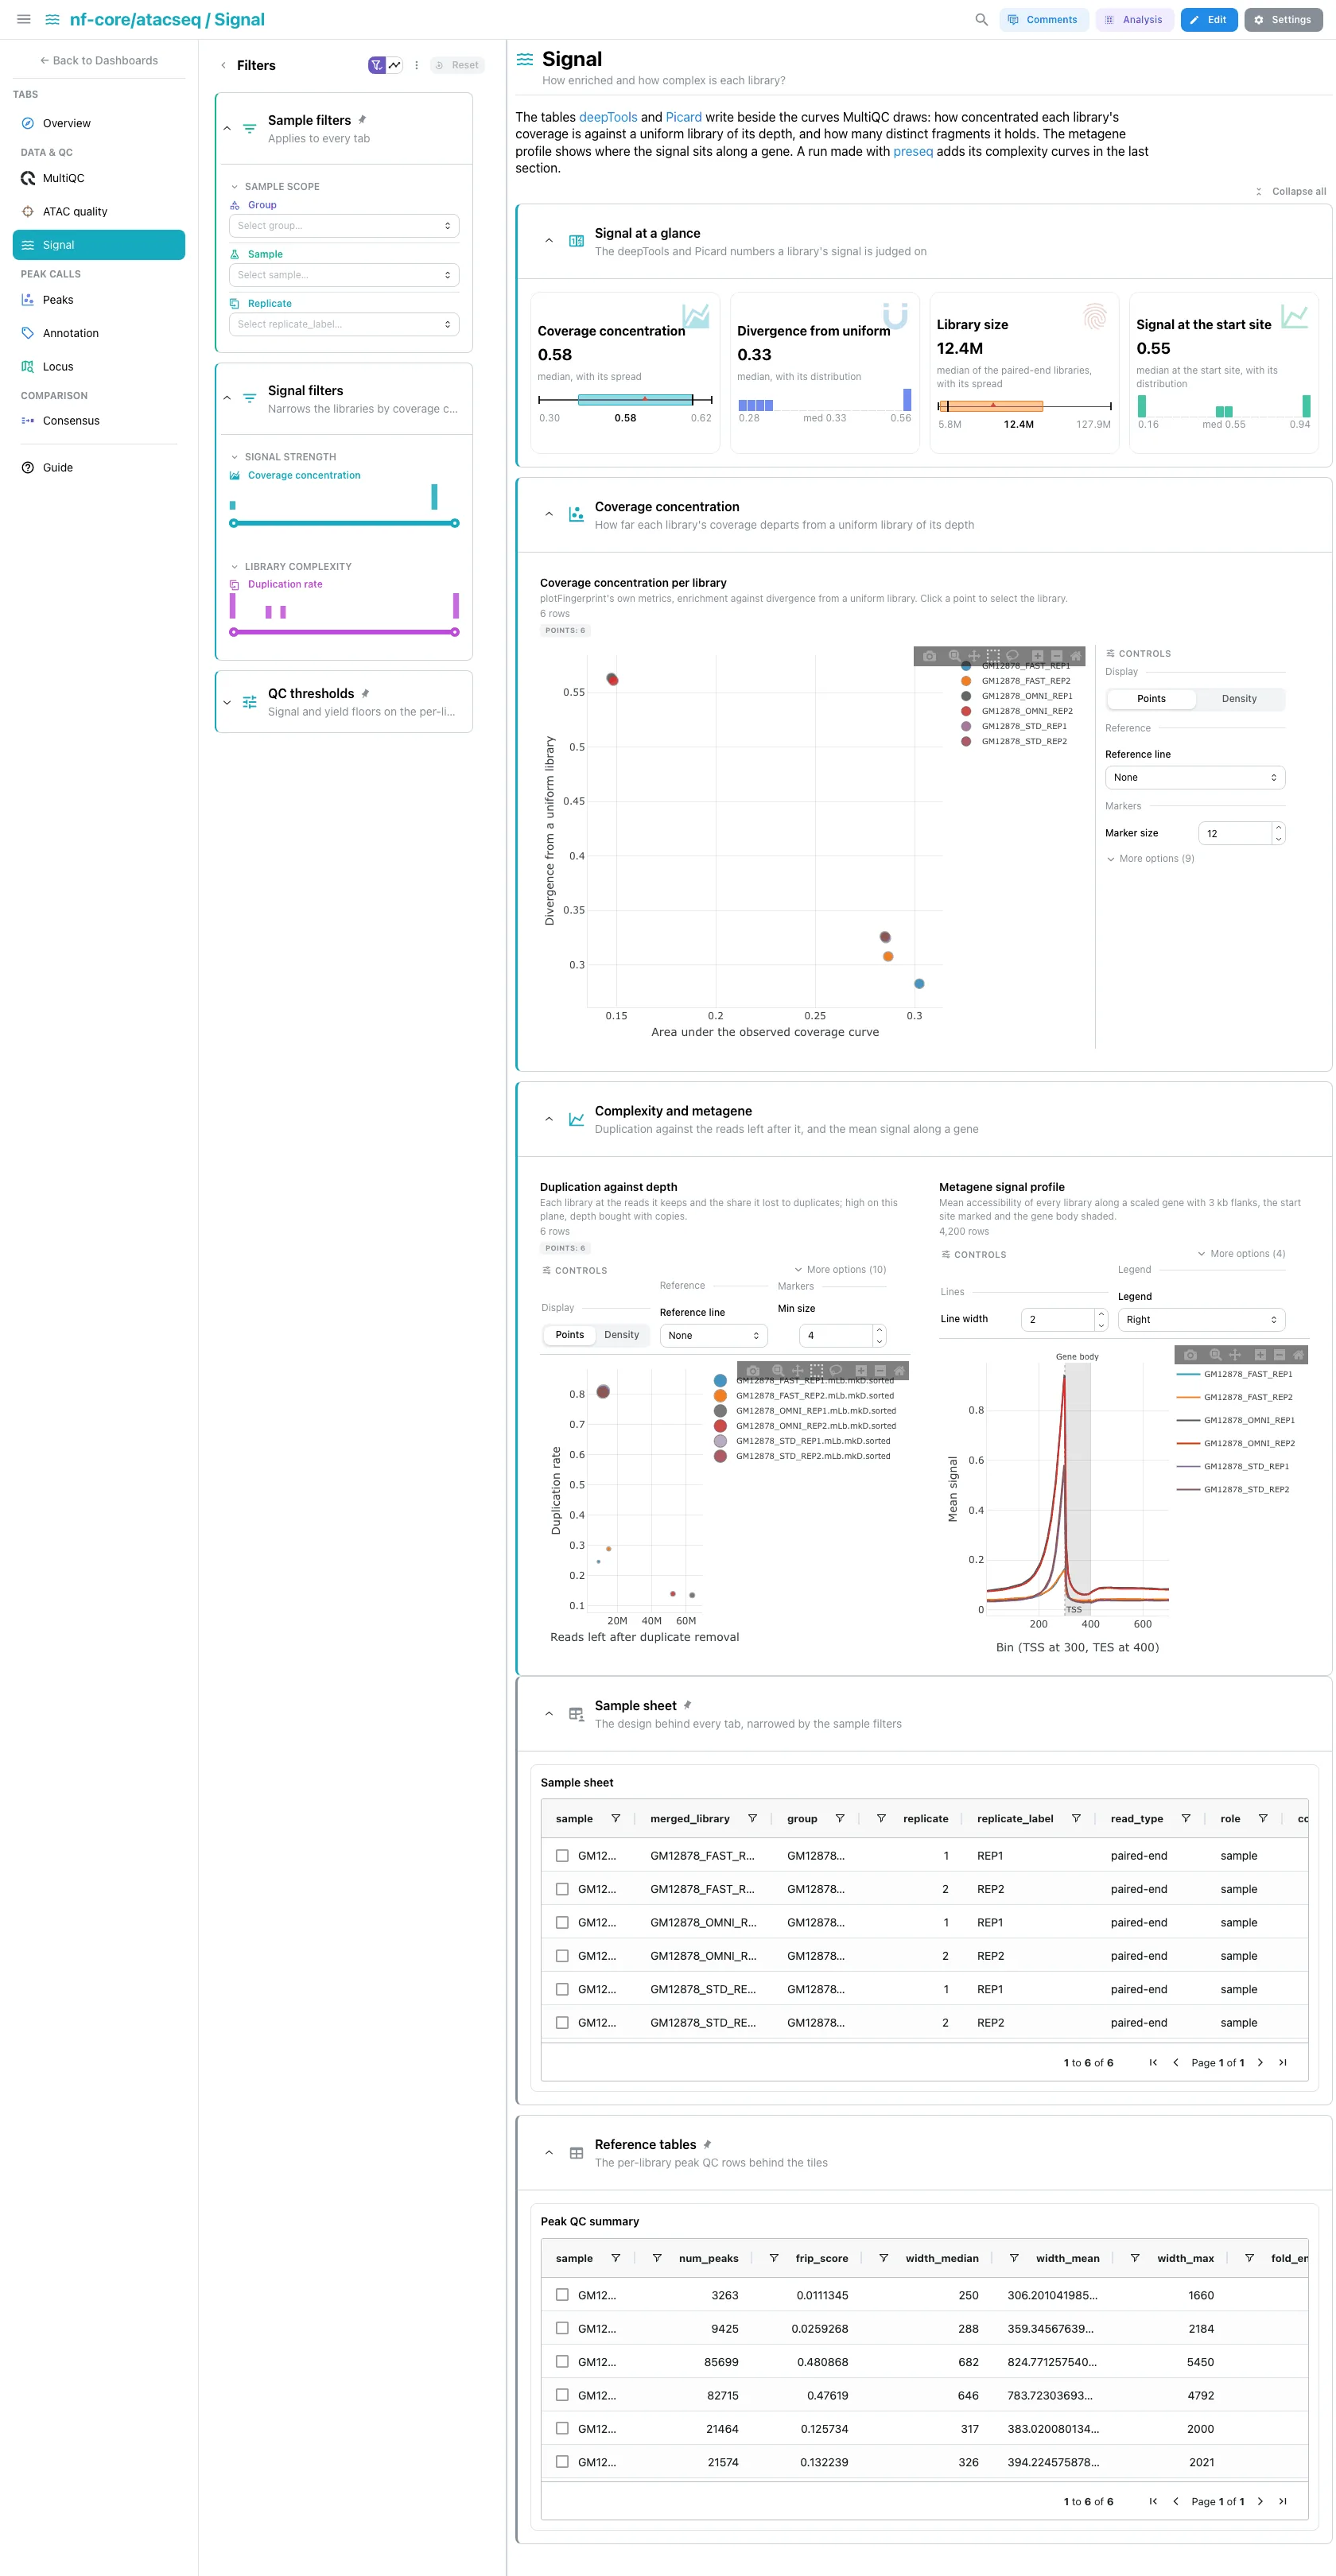
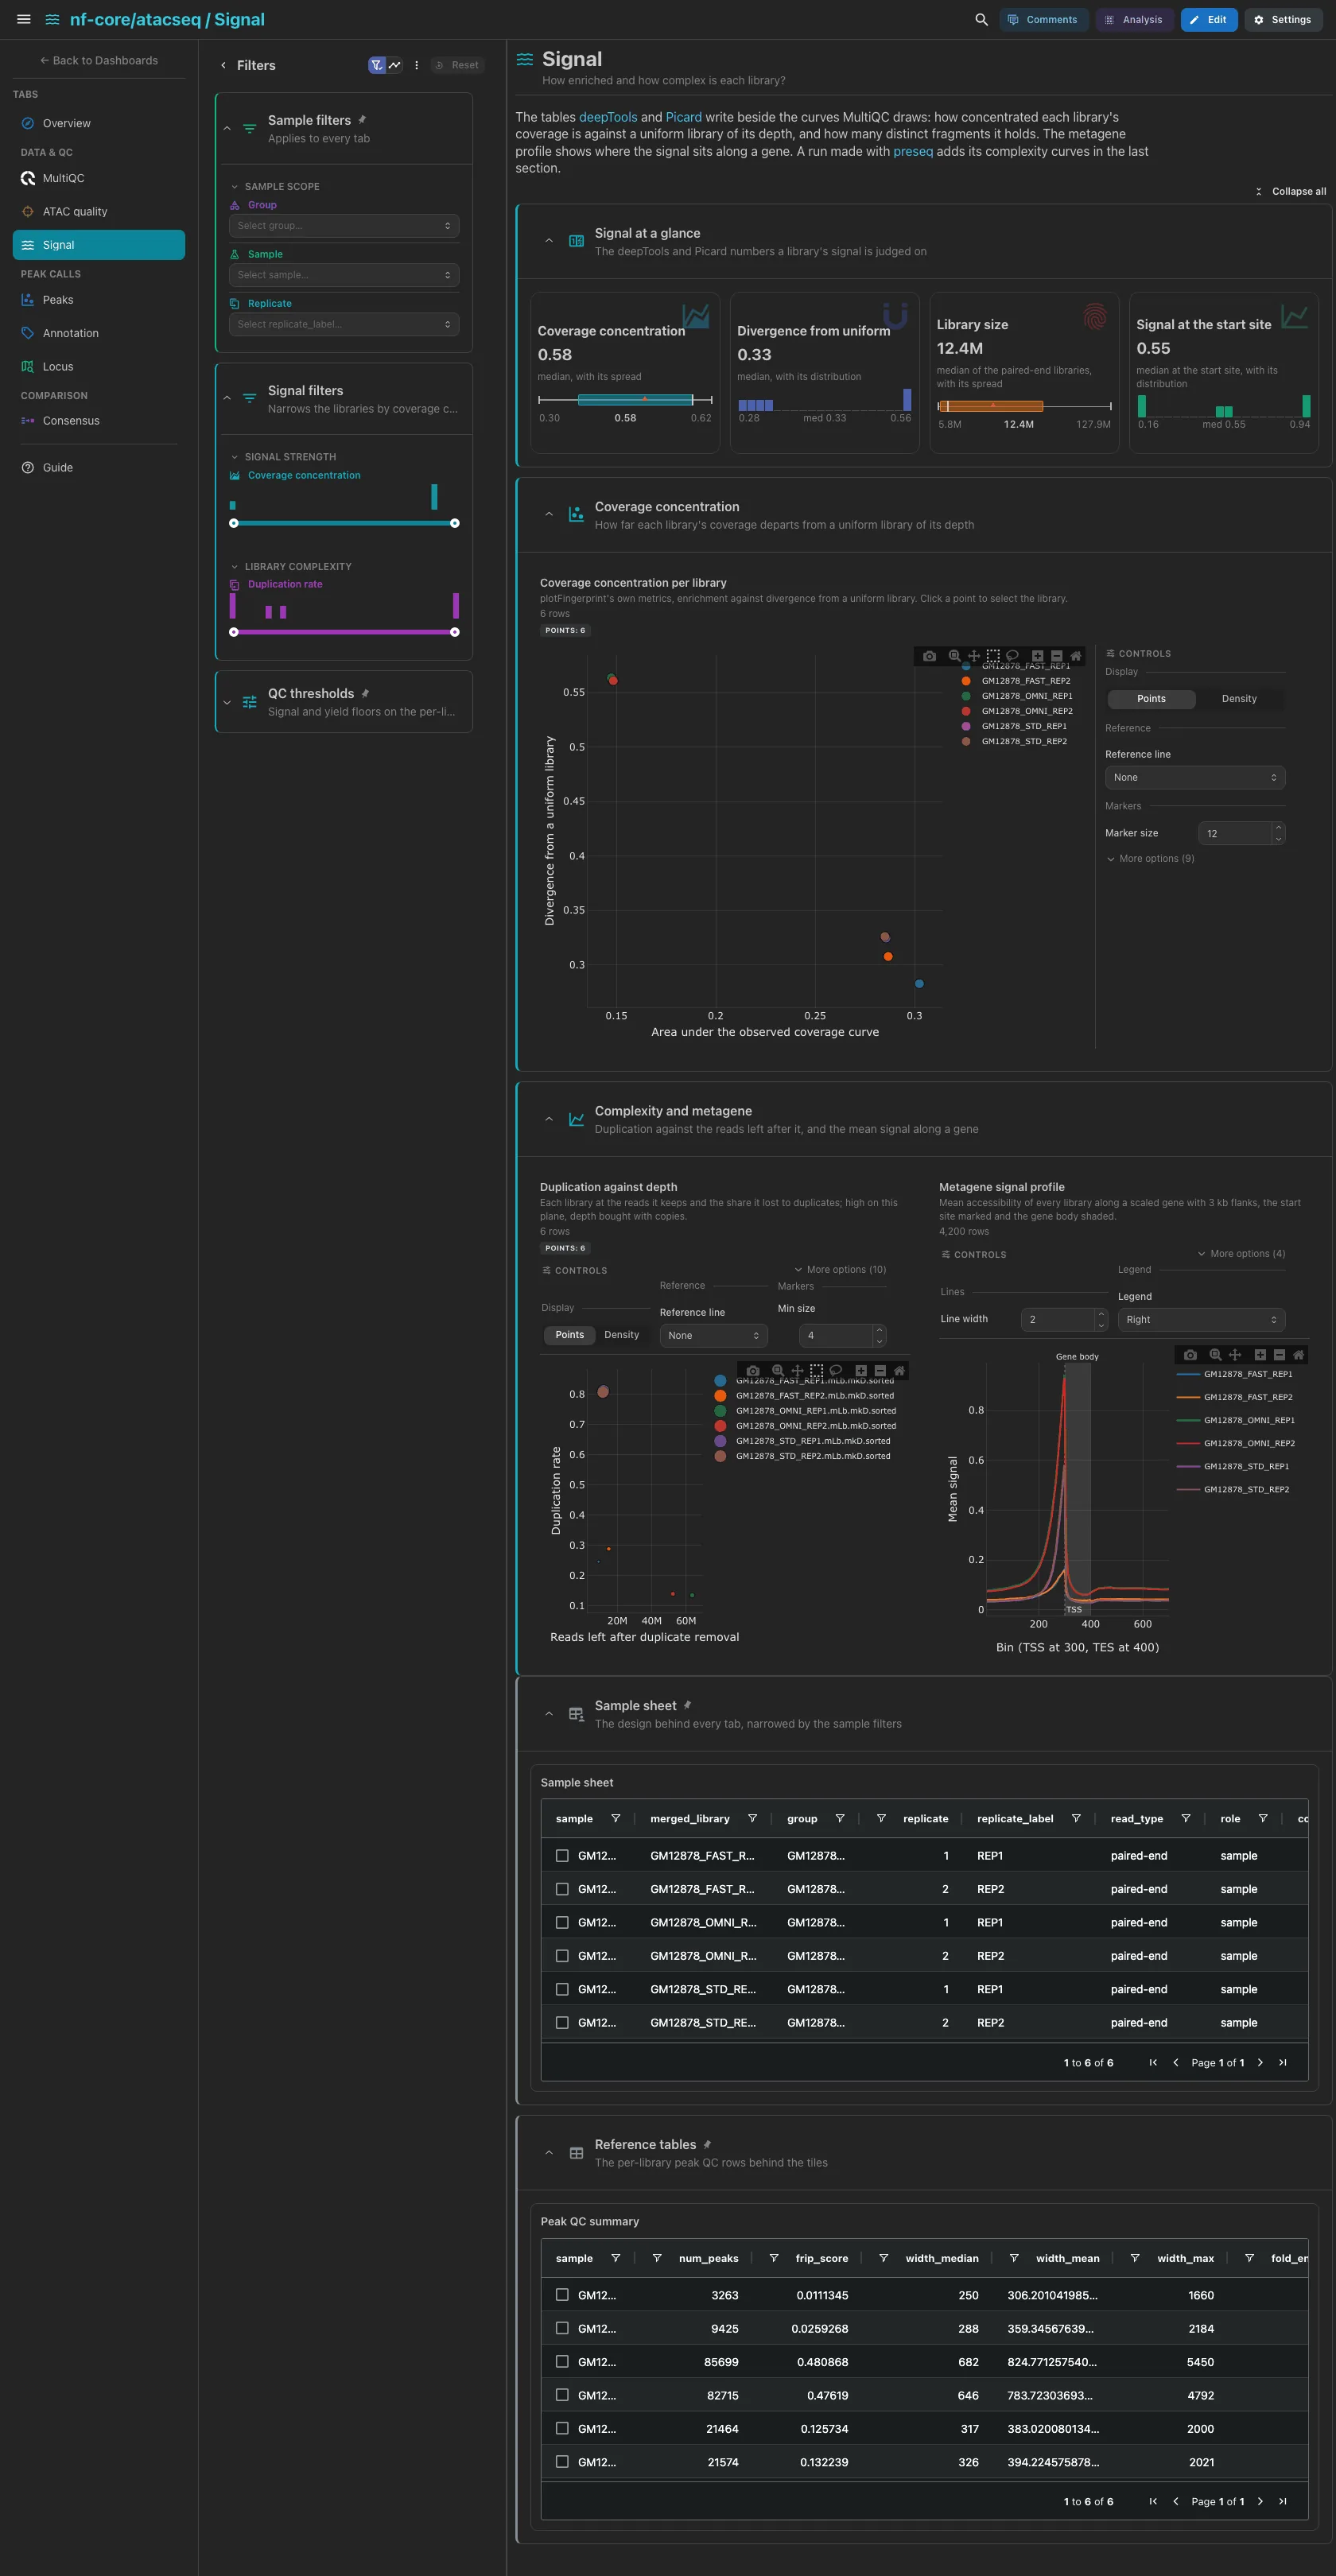
The tables deepTools and Picard write beside the curves MultiQC draws. The coverage concentration, the divergence from a uniform library, the library size Picard estimates and the metagene signal at the start site. Then the fingerprint scatter, and Picard's duplication against depth beside the deepTools metagene profile, with the start site marked and the gene body shaded. Picard makes no size estimate for single-end reads, so the library-size card is the median of the paired-end libraries.
Filters and components
Filters · a Coverage concentration range on
deeptools_fingerprint_metrics, a Duplication rate range on
picard_markduplicates_metrics and, on a preseq run, an Extrapolated
depth range on preseq_complexity_curve.
| Section | What it holds |
|---|---|
| Signal at a glance | 4 cards |
| Coverage concentration | 1 advanced visualization |
| Complexity and metagene | 2 advanced visualizations |
| Complexity curve (collapsed) | 1 advanced visualization, preseq runs only |
The complexity curve needs preseq
preseq is off by default in 2.x, so the Complexity curve section and the
depth filter drop unless the run passed --skip_preseq false. Picard's
duplication holds the complexity reading on every route.
Peak calls · How many peaks did each library yield, and how strong?
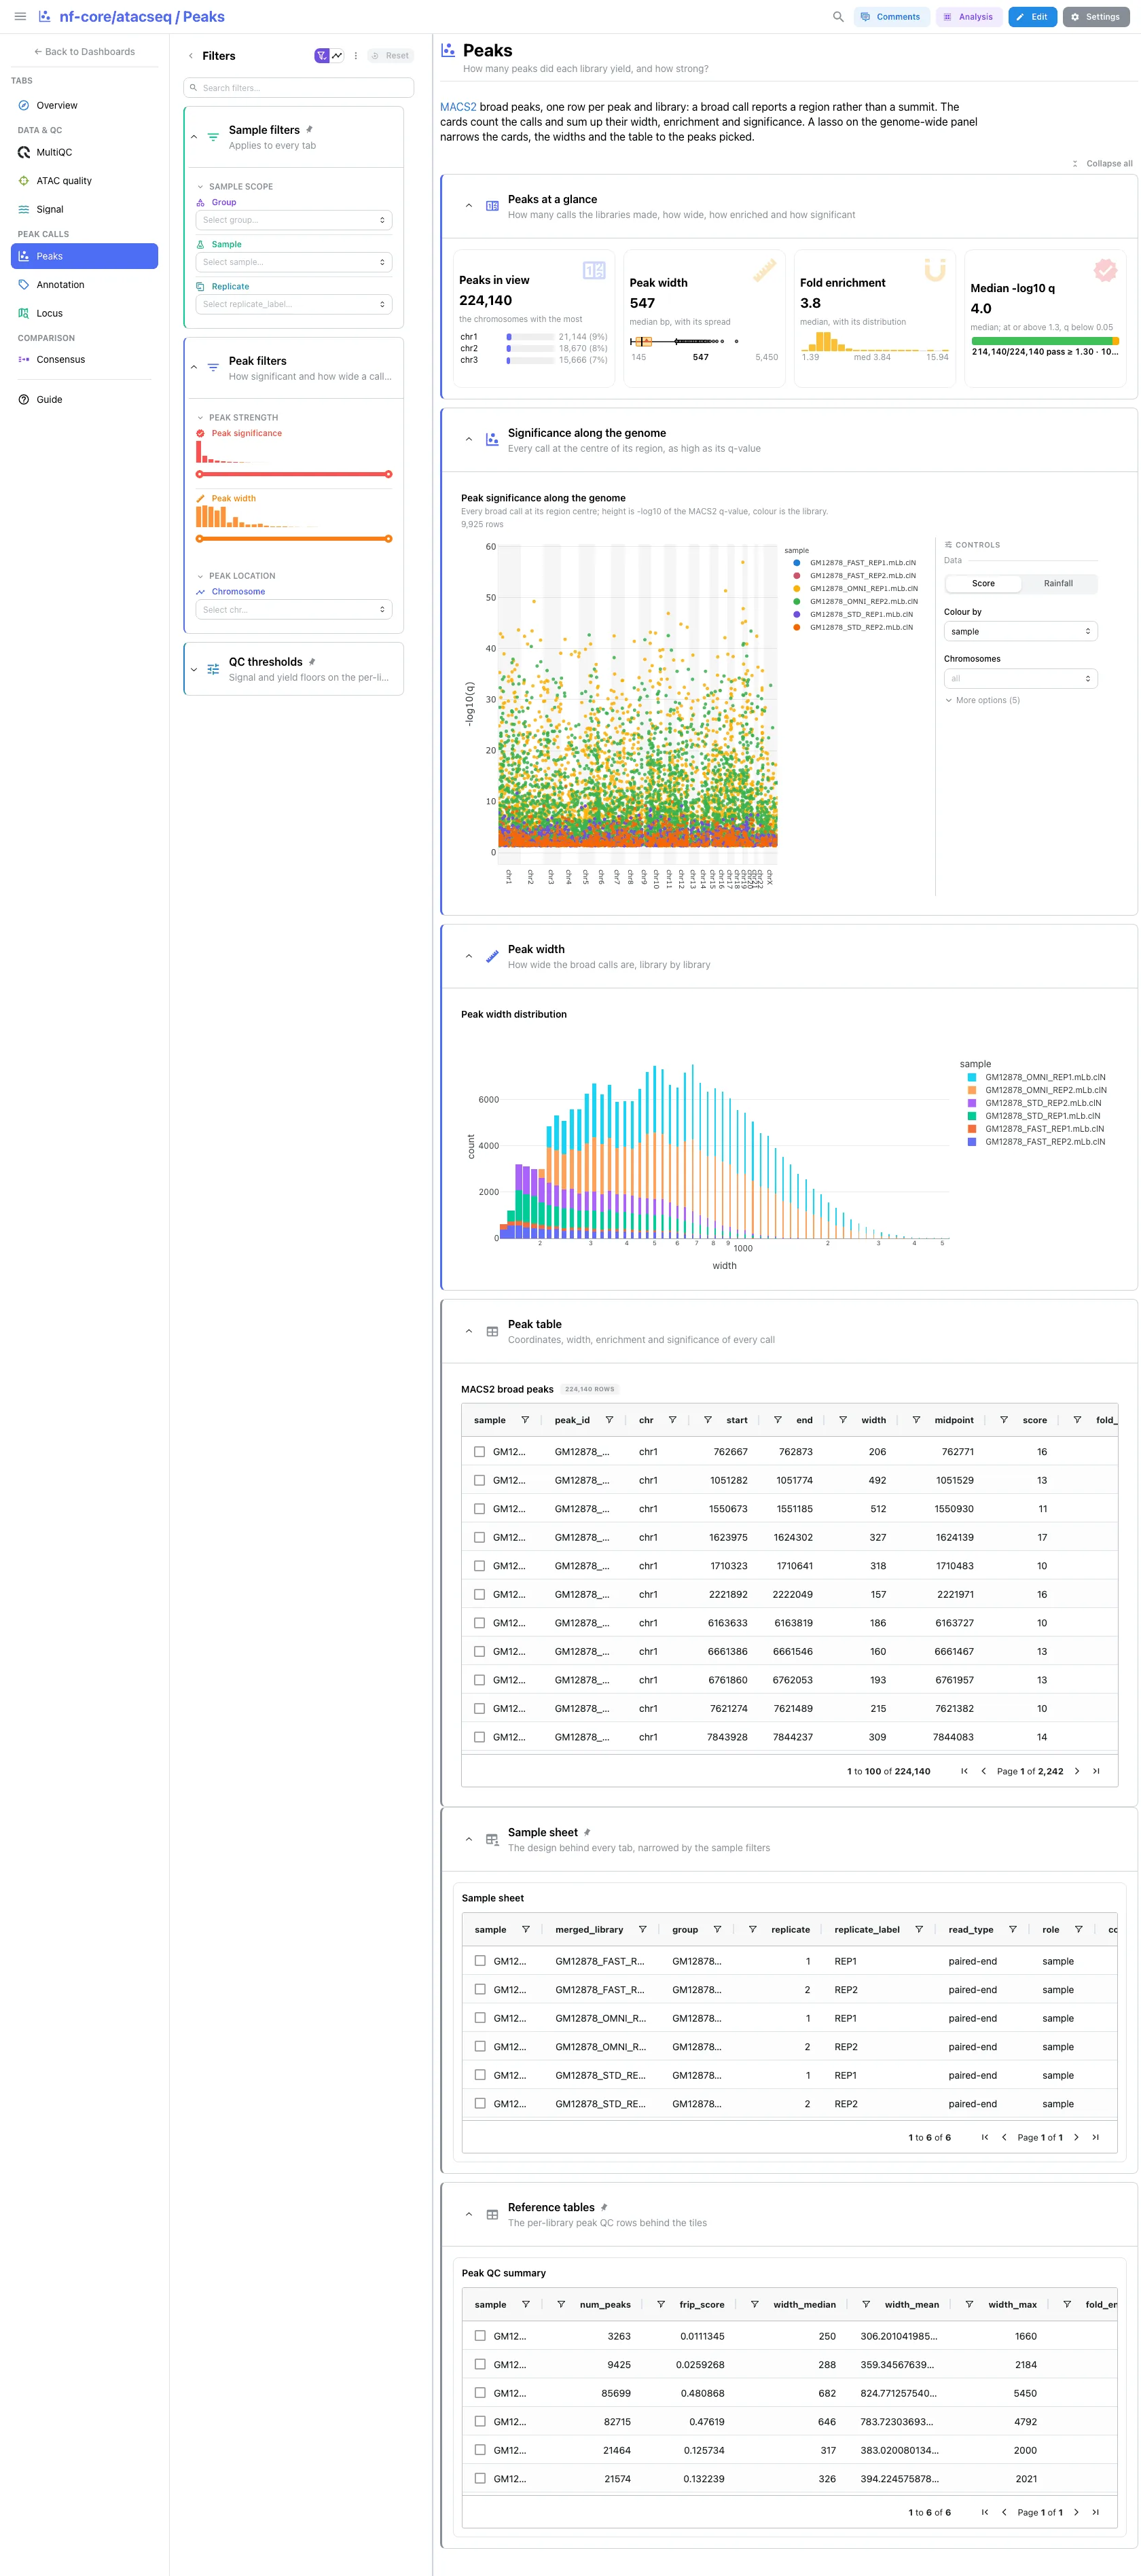
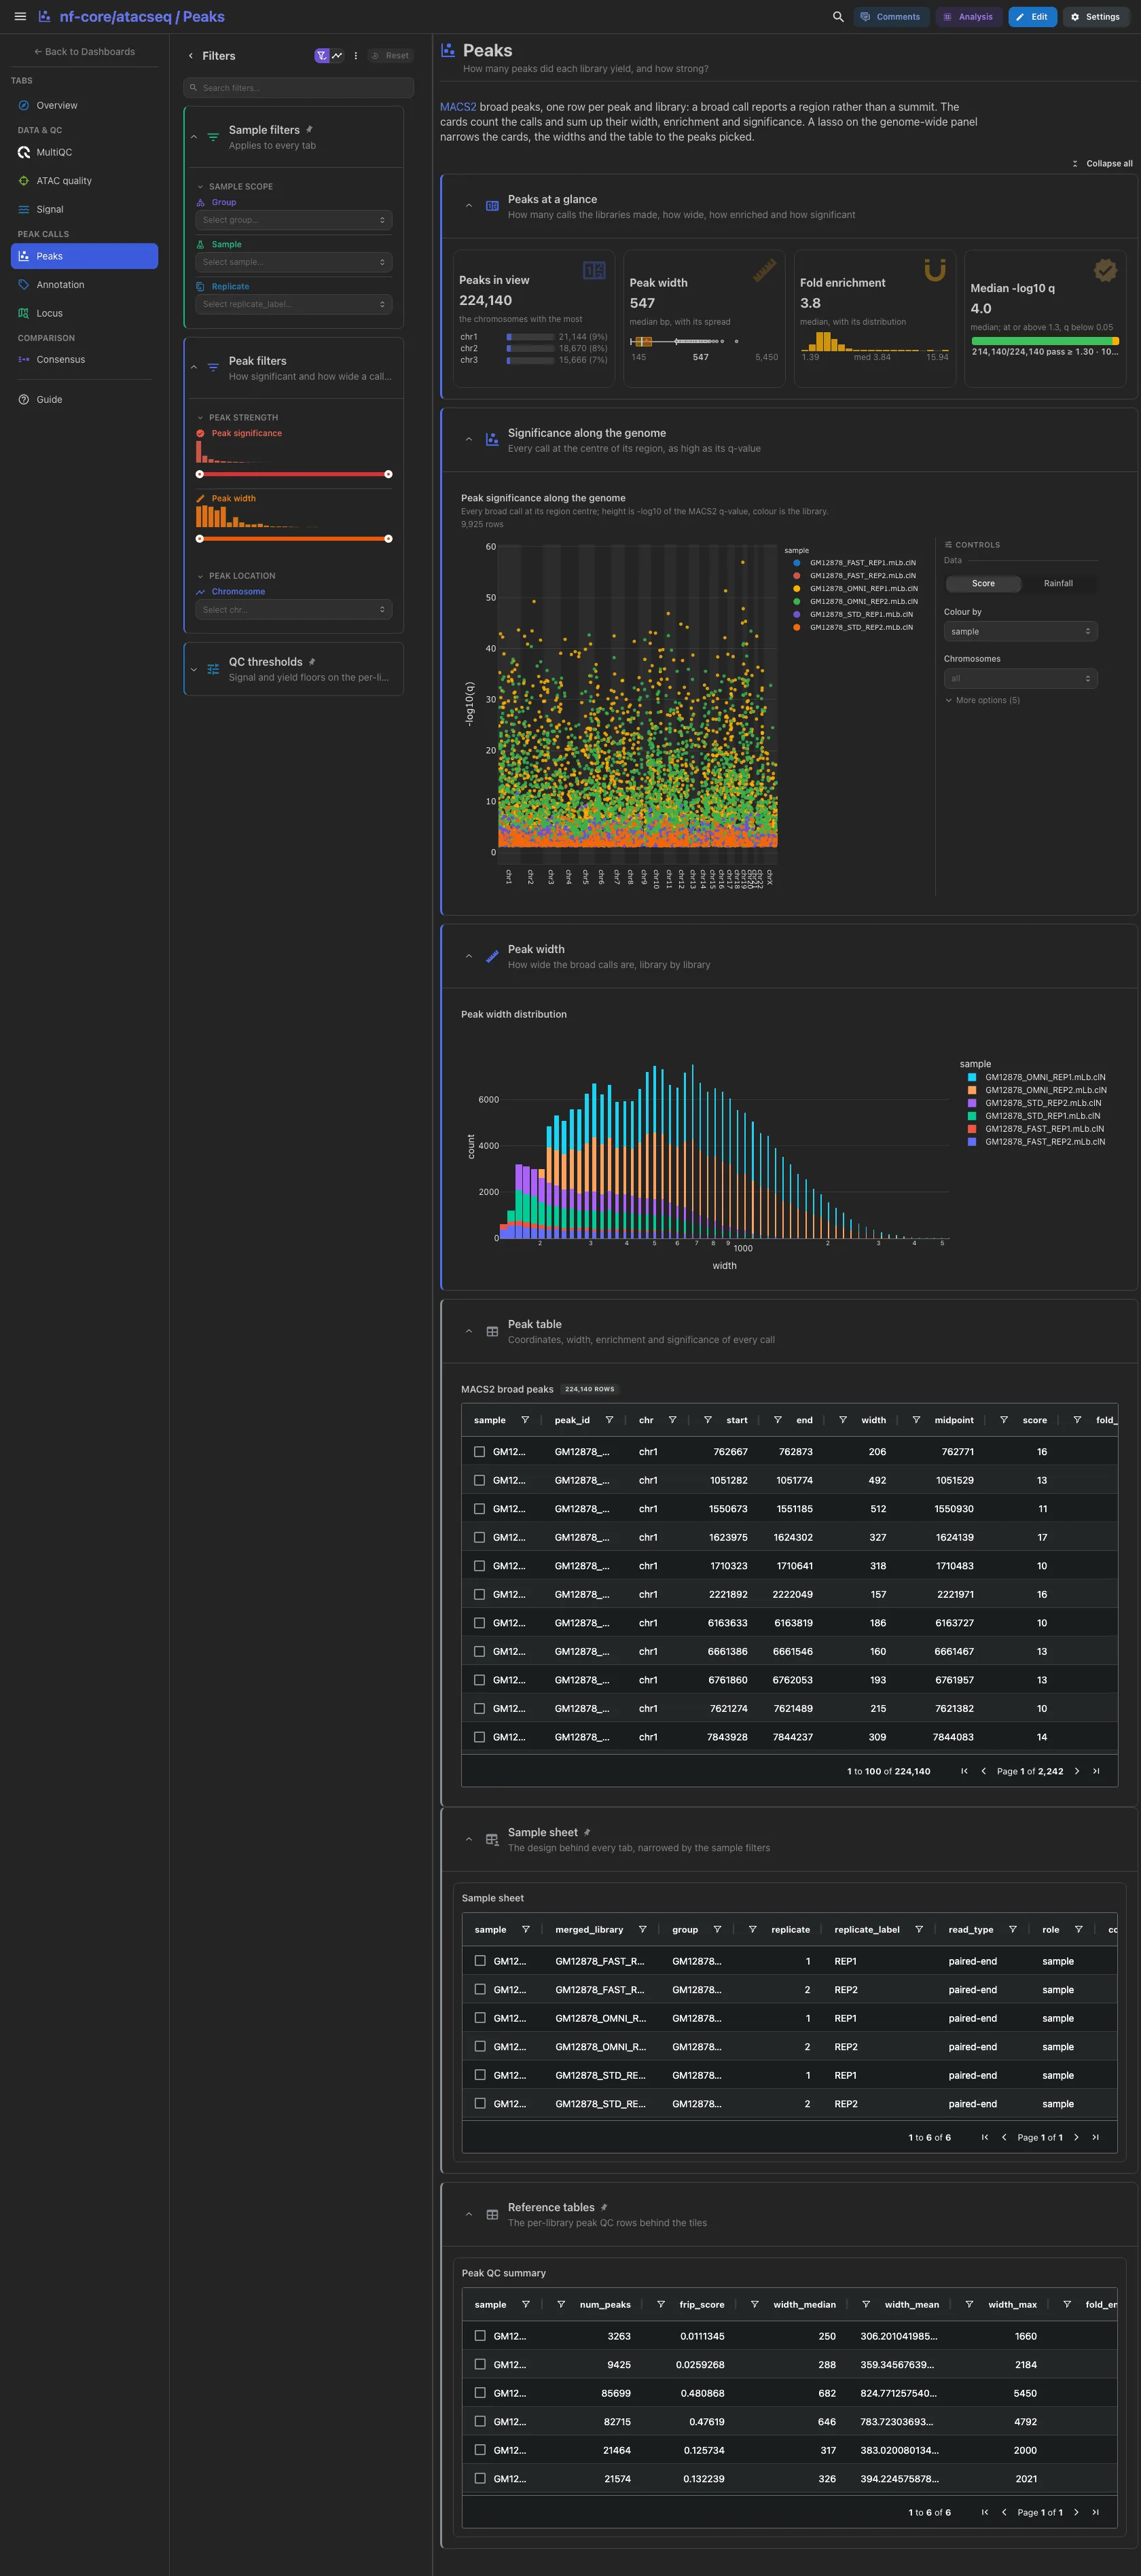
MACS2 broad calls, one row per peak and library: a broad call reports a region
rather than a summit. The peaks in view, their width, their fold enrichment and
the median -log10(q), with the line at q 0.05. Then the significance along the
genome, where a lasso narrows the cards, the widths and the table to the peaks
picked, and the width distribution on a log axis.
Filters and components
Filters · Peak significance and Peak width ranges, and
Chromosome, all on macs2_broad_peaks.
| Section | What it holds |
|---|---|
| Peaks at a glance | 4 cards |
| Significance along the genome | 1 advanced visualization |
| Peak width | 1 histogram |
| Peak table (collapsed) | MACS2 broad peaks |
Peak calls · Where do the peaks fall relative to genes?
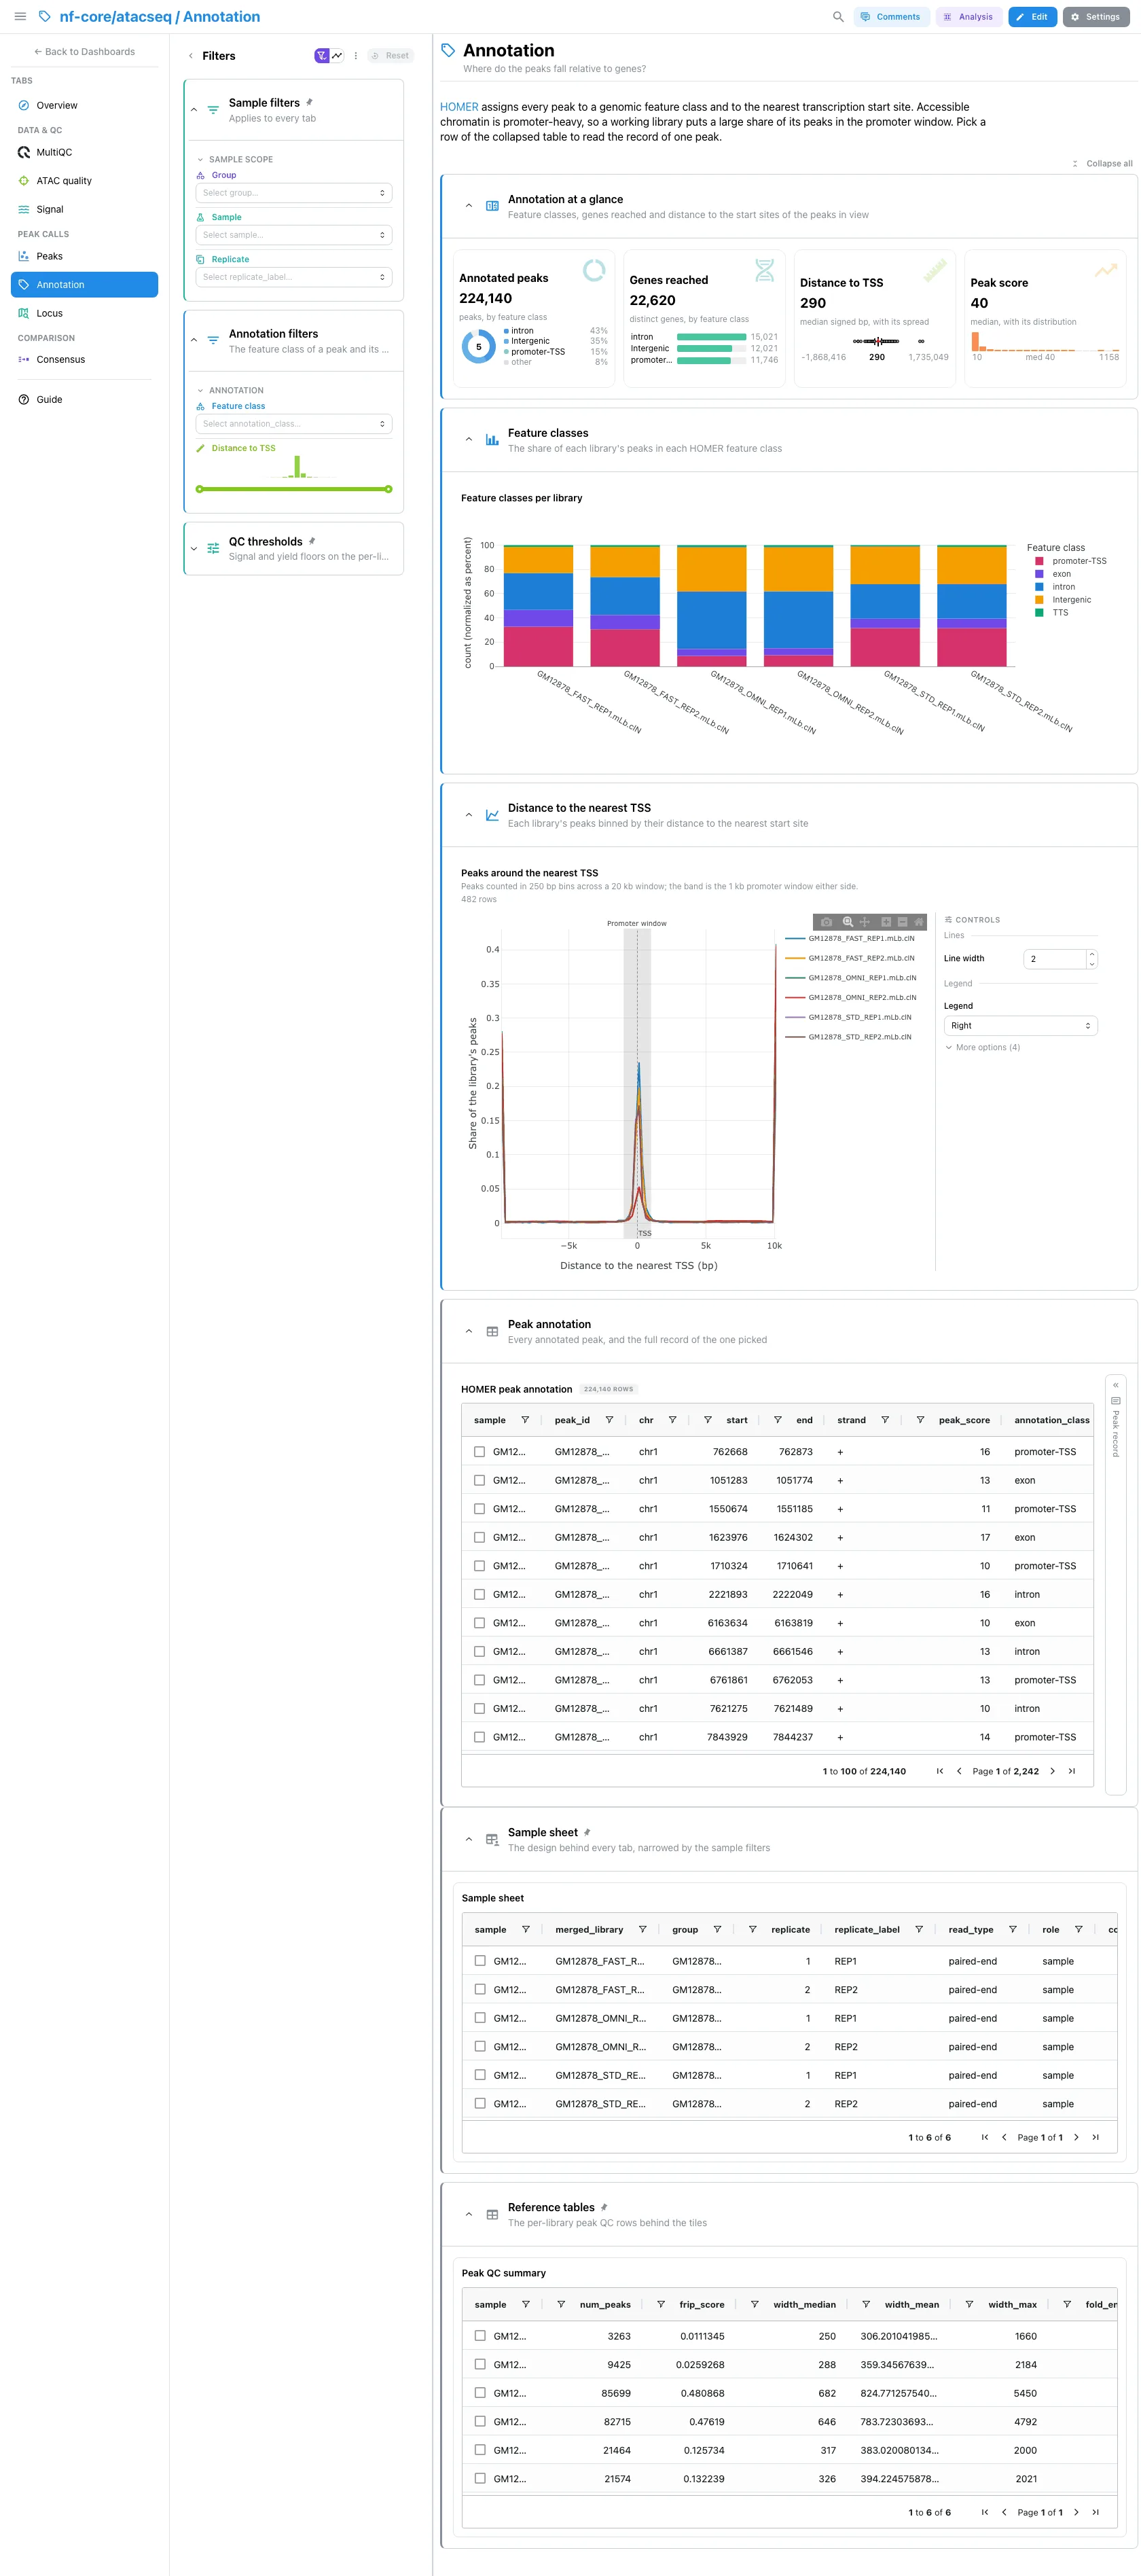
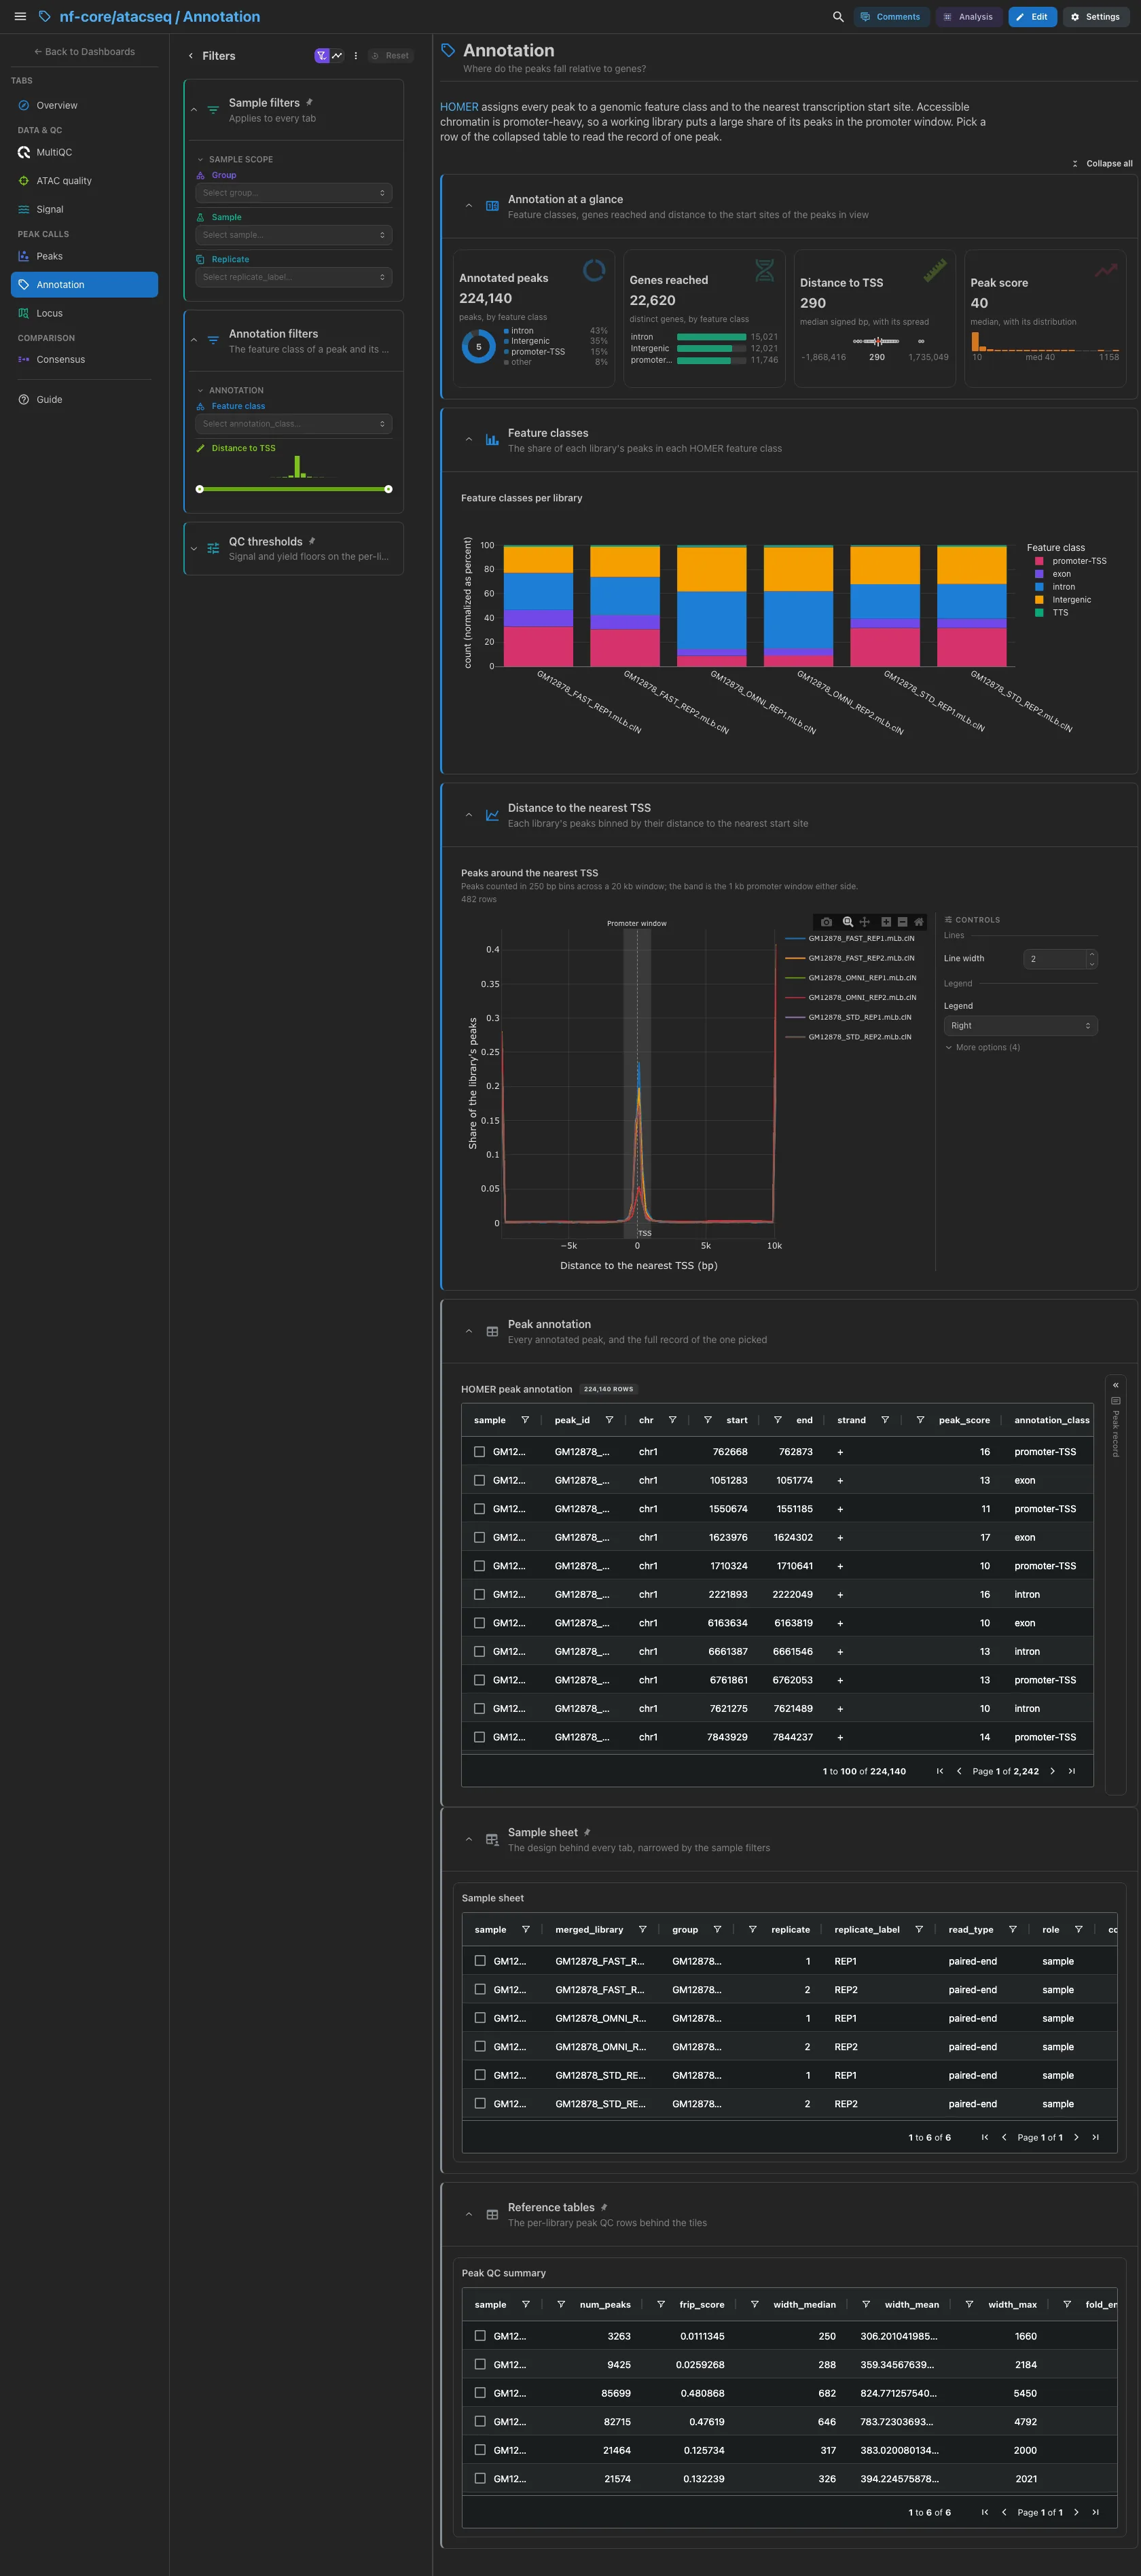
HOMER assigns every peak to a feature class and to the nearest start site. The annotated peaks by feature class, the genes reached, the distance to the nearest start site and the peak score. Then the feature classes per library as 100% bars, and the peaks around the nearest start site with the promoter window shaded. Accessible chromatin is promoter-heavy, so a working library puts a large share of its peaks there. The collapsed HOMER table has a peak record card beside it, which waits for a picked row.
Filters and components
Filters · Feature class and a Distance to TSS range on
homer_annotated_peaks.
| Section | What it holds |
|---|---|
| Annotation at a glance | 4 cards |
| Feature classes | 1 histogram |
| Distance to the nearest TSS | 1 advanced visualization |
| Peak annotation (collapsed) | HOMER peak annotation + a peak record card |
Peak calls · What do the libraries call at one genomic region?
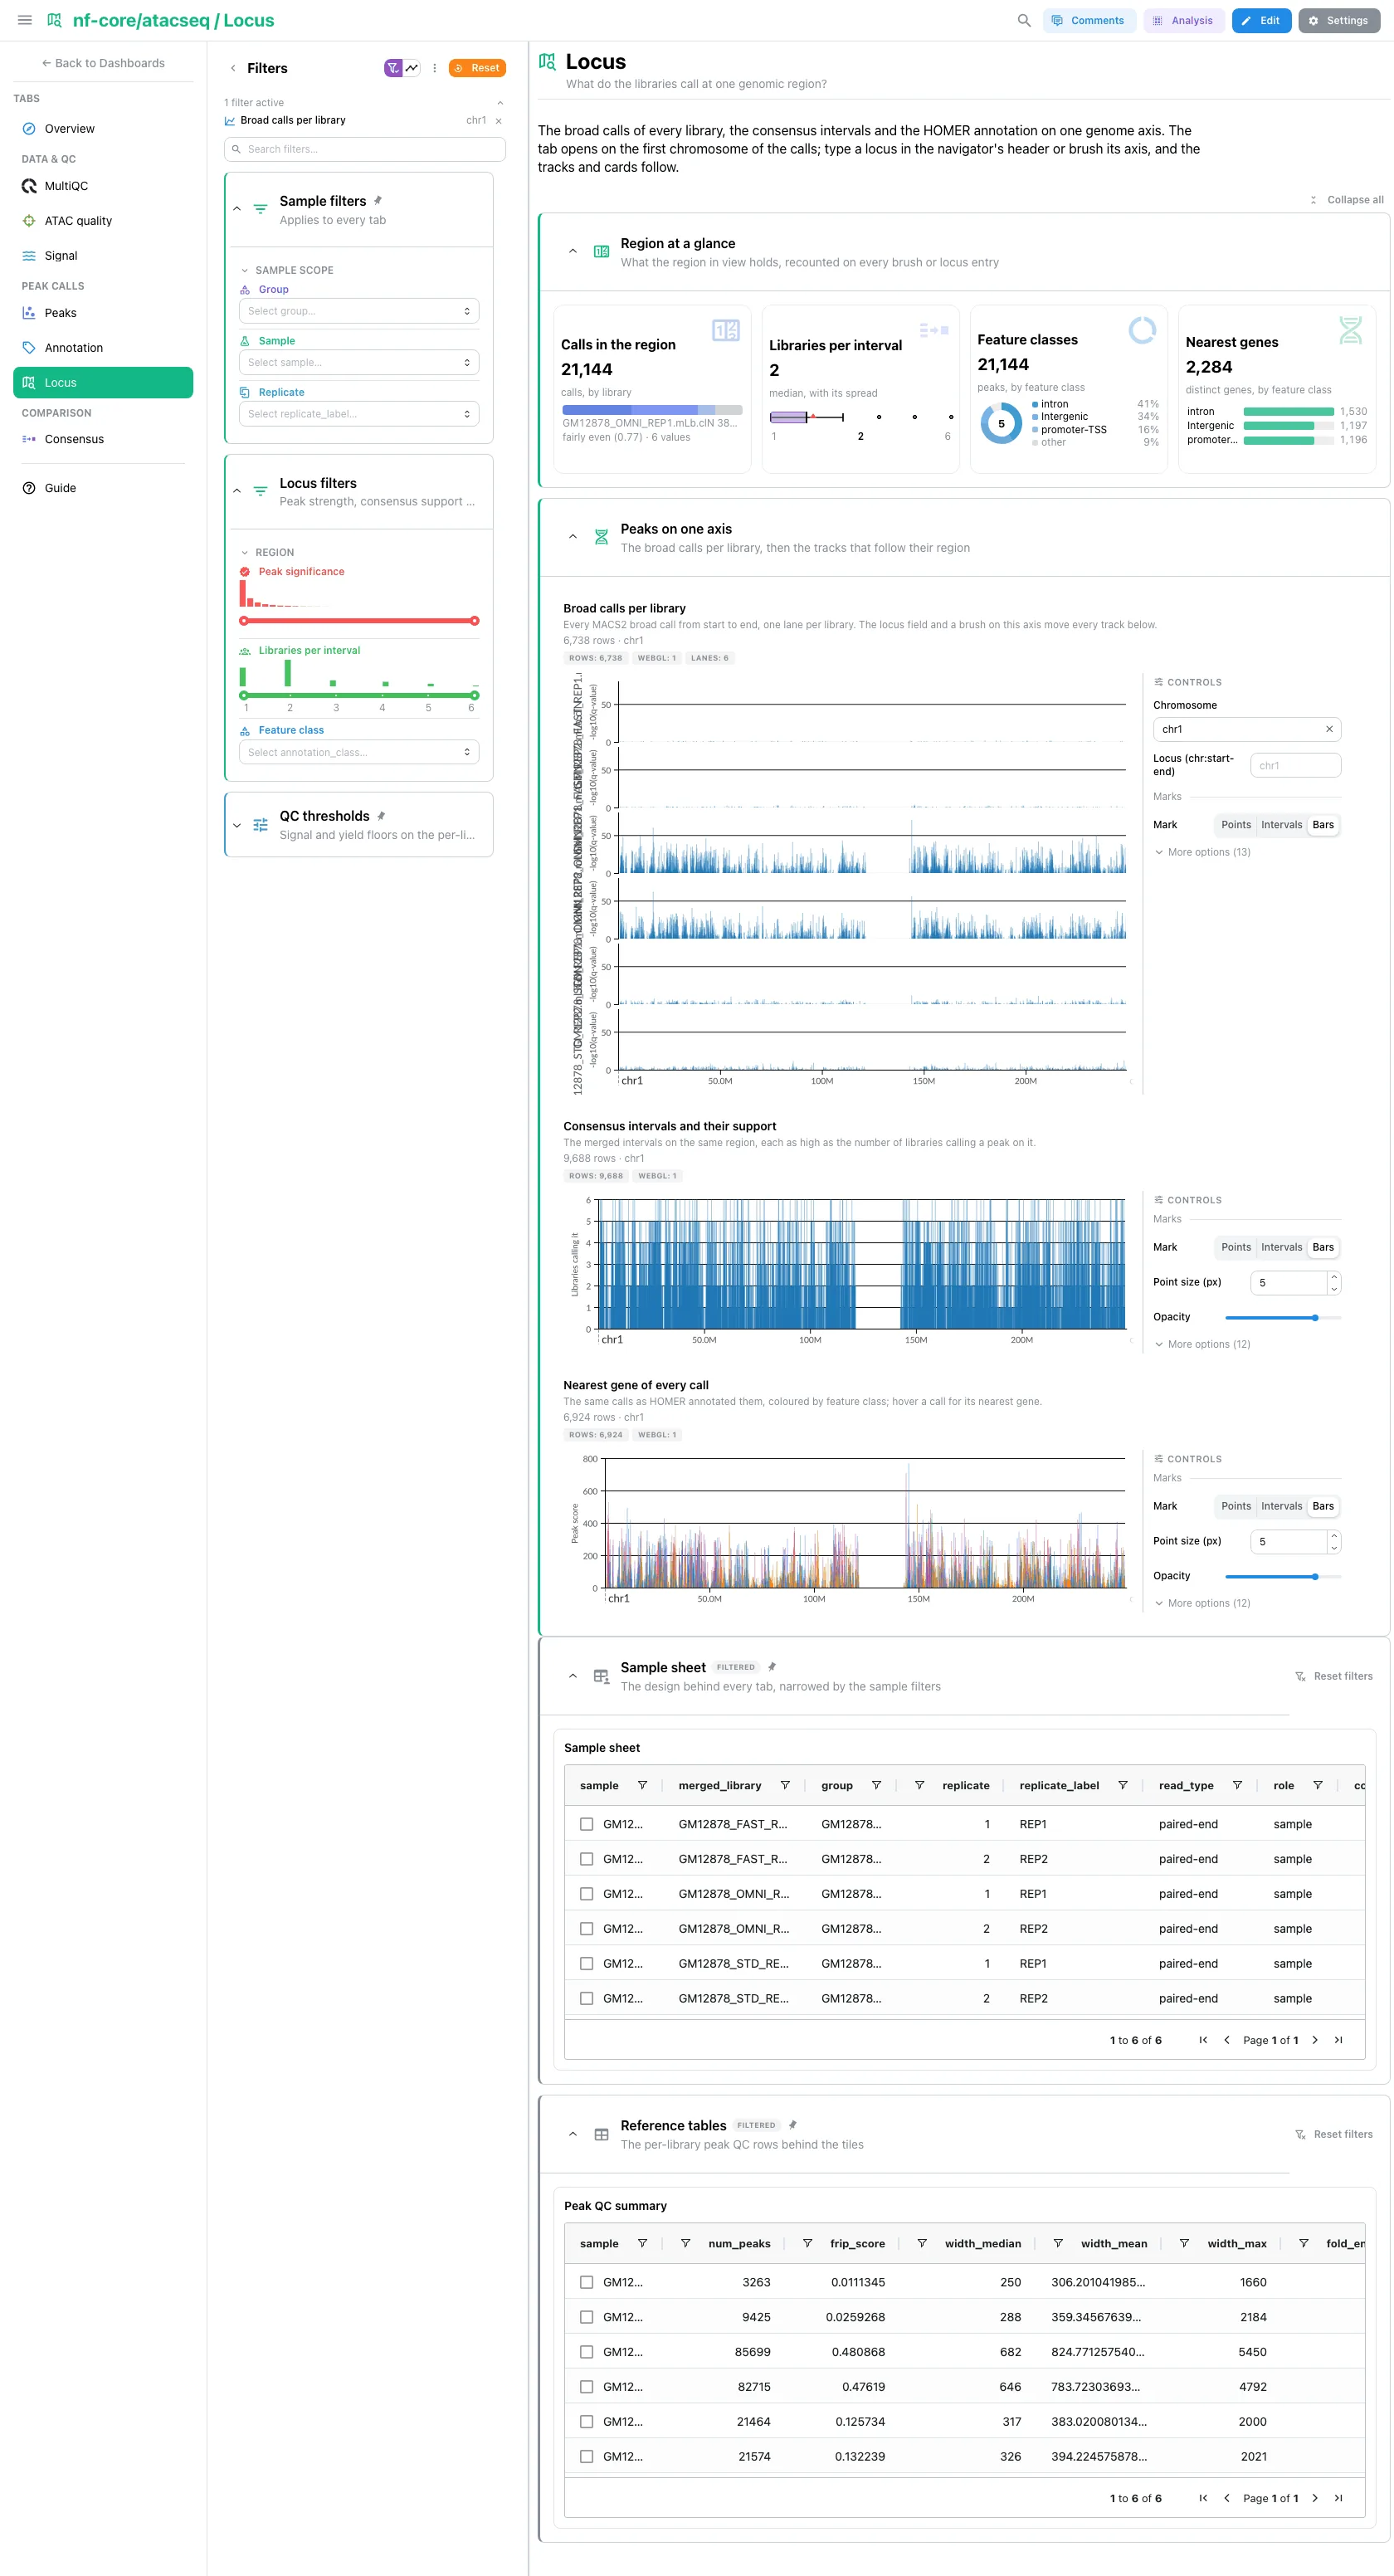
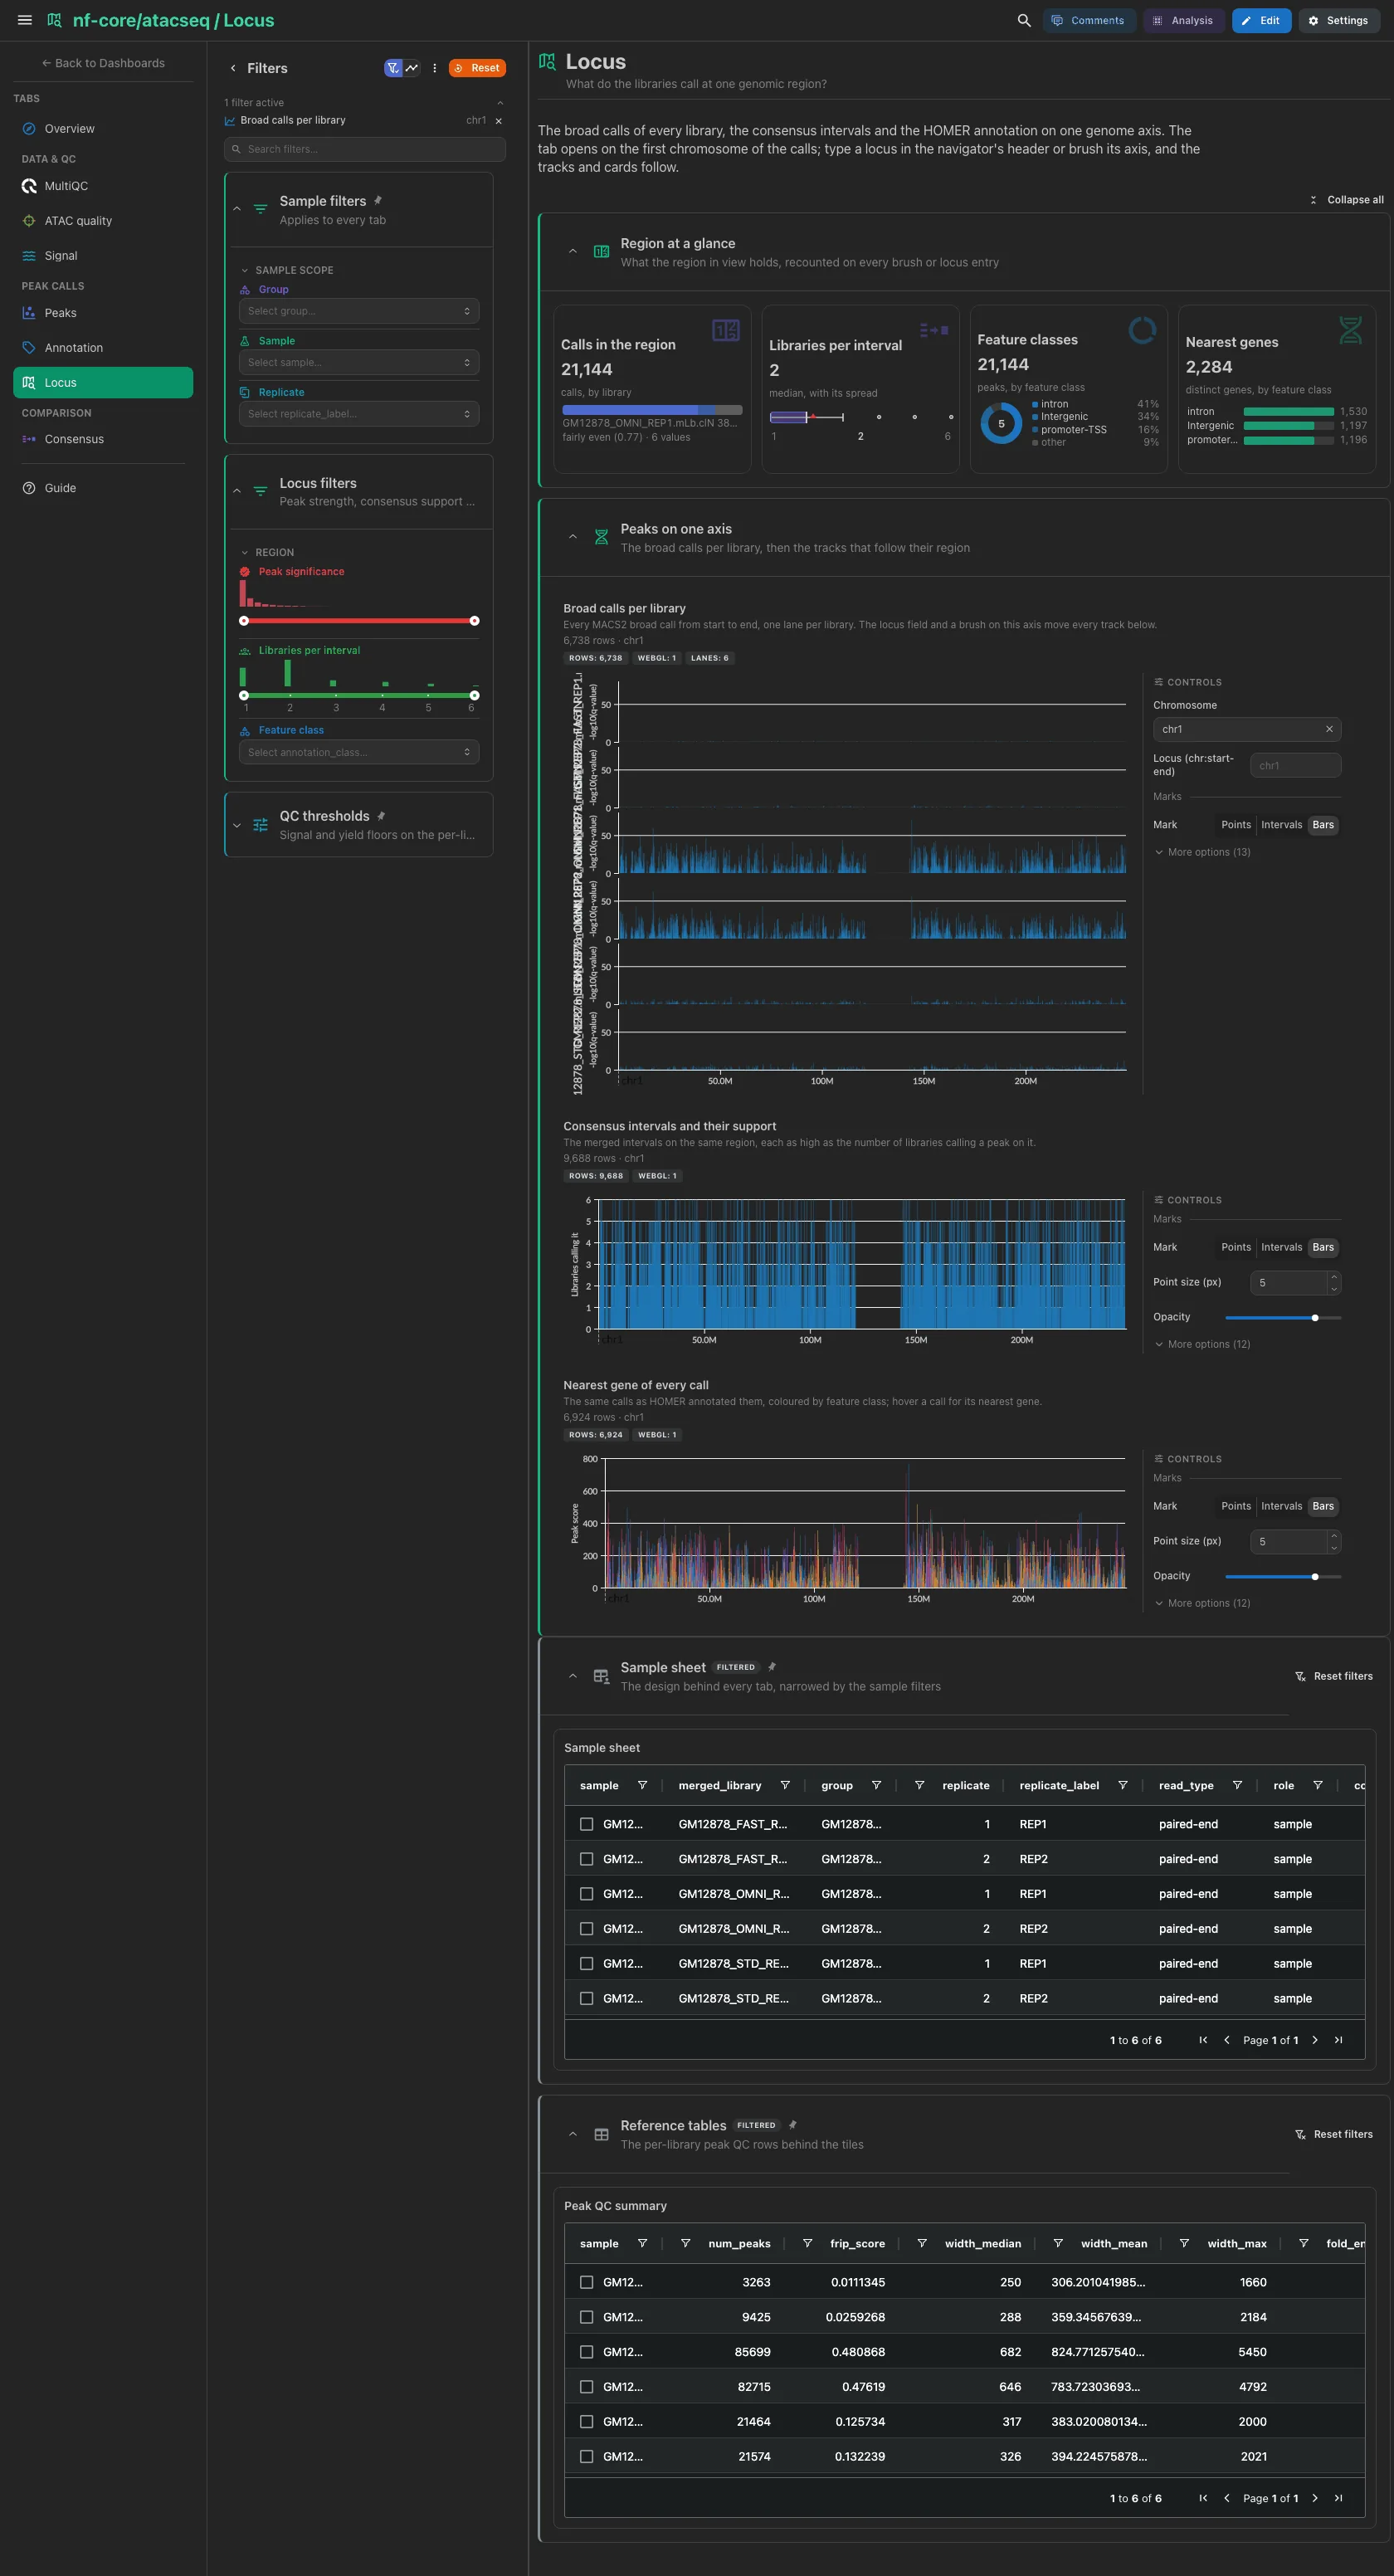
Three collections on one genome axis. The cards count what the region in view
holds and follow it as the tracks do. The navigator draws the broad calls, one
lane per library, on the GENOME assembly, and opens on the first chromosome
the calls carry: type a locus in its header or brush its axis, and the
consensus intervals (as high as their support) and the HOMER annotation
(coloured by feature class) follow. The HOMER track stands in for a gene lane,
which is bundled for hg38 and mm10 only.
Filters and components
Filters · Peak significance on macs2_broad_peaks, Libraries per
interval on macs2_consensus_boolean and Feature class on
homer_annotated_peaks.
| Section | What it holds |
|---|---|
| Region at a glance | 4 cards |
| Peaks on one axis | 3 advanced visualizations |
Comparison · Which peaks do the libraries agree on?
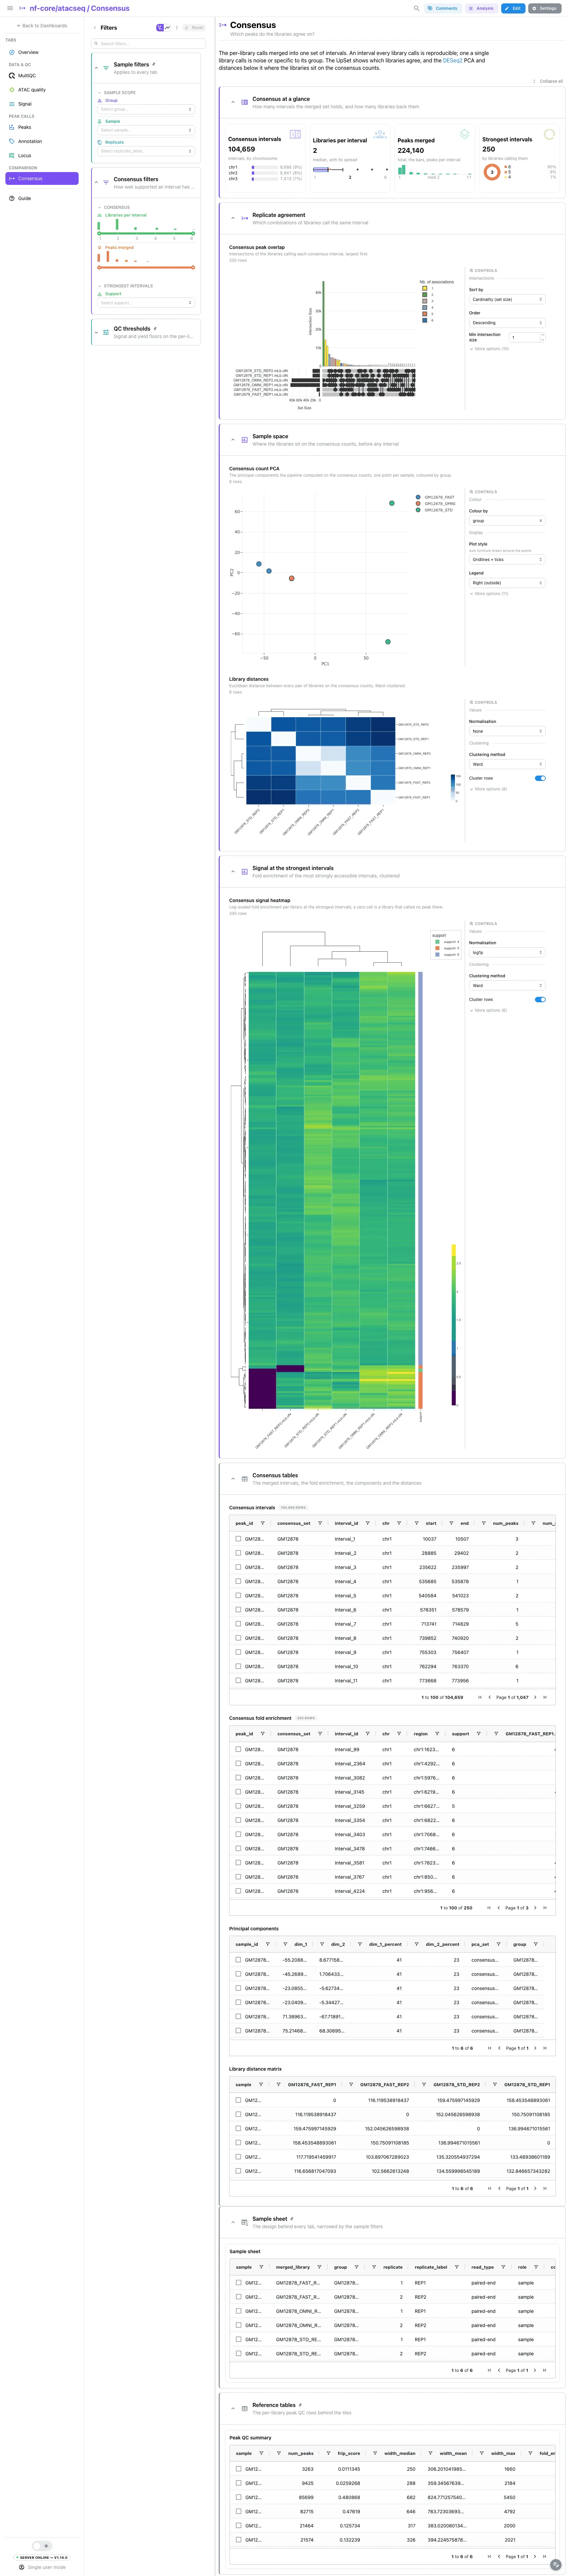
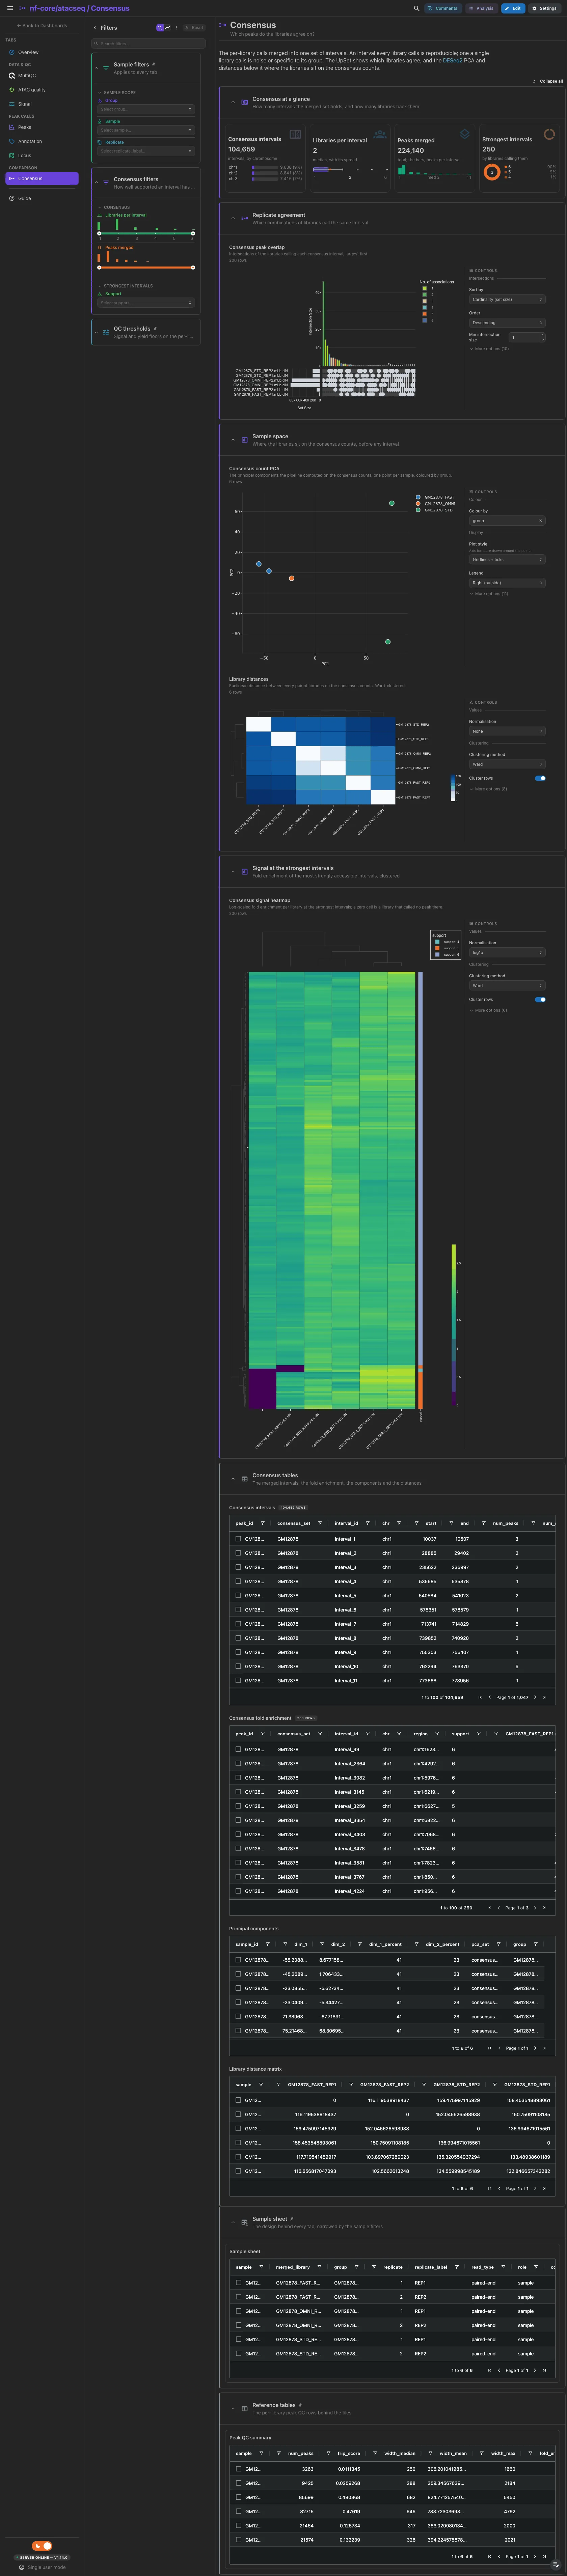
The per-library calls merged into one set of intervals. The consensus intervals, the libraries per interval, the peaks merged and the support of the strongest intervals. Then the UpSet of the libraries calling each interval, and the sample space: the pipeline's DESeq2 PCA of the consensus counts, coloured by group, above the library distance heatmap, where replicates of a group should sit together. The fold-enrichment heatmap over the strongest intervals sits folded below them, since it grows to one row per interval.
Filters and components
Filters · Libraries per interval and Peaks merged ranges on
macs2_consensus_boolean, plus Support on macs2_consensus_fc.
| Section | What it holds |
|---|---|
| Consensus at a glance | 4 cards |
| Replicate agreement | 1 advanced visualization (UpSet) |
| Sample space | 2 advanced visualizations |
| Signal at the strongest intervals (collapsed) | 1 advanced visualization |
| Consensus tables (collapsed) | Consensus intervals, Consensus fold enrichment, Principal components, Library distance matrix |
The sample space needs replicated groups
The DESeq2 QC is skipped with --skip_deseq2_qc and for a design without
replicated groups. The Sample space section and its two tables then drop,
and the rest of the tab stays as it is.
Running the pipeline
Depictio reads the output of nf-core/atacseq, it does not run the pipeline. Run the pipeline first, then ingest, regenerating the MultiQC report only if the run kept the release's MultiQC 1.13:
nextflow run nf-core/atacseq -r 2.1.2 -profile docker \
  --input samplesheet.csv --genome GRCh37

python -m depictio.dev_scripts.multiqc_reprocess --src results/ --dest results/

depictio ingest results/ --template nf-core/atacseq/latest --var GENOME=hg19
GRCh37 is the iGenomes name of the UCSC hg19 assembly, which is what
GENOME takes.
See nf-co.re/atacseq/usage for full pipeline documentation.
Required data structure
Point depictio ingest at the directory holding the pipeline output. Depictio scans
recursively and every recipe matches on file name, so a run aligned with another
aligner binds identically. Keep the merged_replicate/ tree out for that same
reason.
<DATA_ROOT>/
├── pipeline_info/
│   ├── samplesheet.valid.csv                     # the hub: one row per merged library
│   └── software_versions.yml
├── multiqc/broad_peak/multiqc_data/
│   └── multiqc.parquet                           # or multiqc/multiqc_data/ after a reprocess
├── fastqc/zips/, trimgalore/                     # raw and trimmed reads
└── bwa/merged_library/
    ├── samtools_stats/                           # *.mLb.mkD.* and *.mLb.clN.*
    ├── picard_metrics/                           # MarkDuplicates, CollectMultipleMetrics
    ├── deeptools/{plotfingerprint,plotprofile}/
    ├── preseq/*.lc_extrap.txt                    # optional: --skip_preseq false only
    ├── ataqv/broad_peak/*.ataqv.json             # the ATAC quality reports
    └── macs2/broad_peak/
        ├── *.mLb.clN_peaks.broadPeak             # BED6+3, no summit column
        ├── *.mLb.clN_peaks.annotatePeaks.txt     # HOMER annotation
        ├── qc/                                   # peak QC summary and FRiP per library
        └── consensus/
            ├── consensus_peaks.mLb.clN.boolean.txt
            └── deseq2/*.{pca.vals,sample.dists}.txt  # optional: the DESeq2 QC
Validation runs
No AWS megatest is usable for 2.1.2: the 2.1.1 and 2.1.2 prefixes in the bucket
each hold a single 12 GB object, so nothing can be mirrored from them. The
template was validated on EMBL HPC runs of the release instead (keys
atacseq2-*): the test profile under each of the four aligners (bwa, bowtie2,
chromap and STAR), test_controls for a run with input controls, and the
megatest profile test_full on hg19, ingested with --var GENOME=hg19.
megatest.yaml describes that run file by file, so a usable S3 run can be pinned
later without rewriting it. The screenshots above come from a test_full run of
an earlier, four-tab layout of the dashboard; the current layout has not been
captured yet.
Do not pass --project when ingesting: the dashboard is attached to the
project by name, so renaming it breaks a later depictio dashboard import.
Re-ingesting accumulates dashboards, so delete the project before repeating a run.
Additional resources
- nf-co.re/atacseq: official pipeline documentation
- nf-co.re/atacseq/2.1.2/results: AWS test results
- Template System Reference: YAML format, variables, conditionals
- Recipes: how to read, test, and write recipes
Authorship
 weber8thomas
Reviewing a template on your own data, or taking over a role here, is a contribution in itself: the contributing guide says what each one involves.