

The scrnaseq template follows a 10x run from the raw reads to the genes that mark each cluster:
- Overview: the run in four key figures, live findings and four figures, each linked to the tab that explains it
- Data & QC: FastQC and Cell Ranger's own summary from the MultiQC report, and each library's metrics against 10x Genomics' cut-offs
- Cells: the barcodes called as cells and the ambient RNA removed, how the aligner routes agree, the MAD rules that flag a cell, the UMAP and t-SNE, and the clusters with their cell cycle
- Genes: the marker genes of each cluster, and two lassoed groups of cells tested gene by gene
The persistent Sample filters sit in the left panel and narrow every tab. On
the tabs that draw cells, the collapsed Cell filters (cluster, QC status, UMIs
and genes per cell) compose forward through the cluster_label links, so a
cluster picked there narrows the cluster, marker, per-cell expression and
cell-cycle tables alike.
The Cell Ranger route carries the dashboard
Only --aligner cellranger (the pipeline default) publishes the matrices,
the secondary analysis and a MultiQC report the template reads, so it is
required. The simpleaf and kallisto routes are optional and feed the Aligner
Concordance tab only; a Cell Ranger-only run has no Aligner Concordance tab.
Two readings assume a human reference
The mitochondrial share and the MAD mito rule read gene symbols starting
with MT-, and the cell-cycle scores read the human Tirosh gene sets. On
another organism, or a reference without mitochondrial genes, the mito
columns read 0 and the phase degrades to NA. The dashboard therefore leads
with the top-20 gene share and the ribosomal share.
Quick start
Pass the results root. The sample hub reads the samplesheet the
run was launched with, which the pipeline does not publish: copy it anywhere
under the results root first (for example input/samplesheet.csv). To keep
the lineage markers of your tissue on the per-cell marker tiles, name them:
depictio ingest /path/to/scrnaseq_results \
--template nf-core/scrnaseq/latest \
--var MARKER_PANEL=GENE1,GENE2,GENE3
| Variable | Default | Role |
|---|---|---|
MARKER_PANEL |
none | Comma-separated gene symbols the Markers violins and the colour menu of the Embeddings gene UMAP always carry. Unset, or with none of its genes in the reference, the tiles use the top markers of every graph-based cluster |
depictio config nextflow --install     # once per machine
nextflow run nf-core/scrnaseq -r 4.2.0 -profile docker --outdir results
No depictio ingest, and no template named: the pipeline ingests its own
output directory when it finishes and resolves this template from its own
manifest. See Nextflow trigger.
Reference
The template reads the MultiQC report and Cell Ranger's outs/ directory: the
per-sample metrics_summary.csv, the raw and filtered feature-barcode matrices
and the analysis/ tables (every clustering, the UMAP, t-SNE and PCA
projections, the feature dispersion and the marker genes of every resolution).
Cell Ranger writes no sample column, so raw scans carry the file path and
recipes recover the sample from it. The knee curve is summed straight out of the
raw MatrixMarket file with a streaming scan, never a dense matrix.
Self-adapting layout
The dashboard adapts to whatever the run actually produced: components bound to pruned or unparsed data collections are hidden, tabs left with no real visualizations are dropped entirely, and the remaining components are re-packed so there are no empty rows.
Template variables
Variables you provide when running the template: DATA_ROOT is the results directory given to depictio ingest, the others are set with --var NAME=value:
| Variable | Required | Description |
|---|---|---|
DATA_ROOT |
✓ | Root directory of the megatest results: one subdirectory per --aligner route (aligner_cellranger/ required; aligner_simpleaf/, aligner_kallisto/ optional, feed the Aligner concordance tab) plus aligner_cellranger/multiqc/multiqc_data/multiqc.parquet. |
MARKER_PANEL |
— | Optional comma-separated gene symbols the per-cell marker tiles (Markers violin, gene UMAP Colour by menu) always carry, e.g. the lineage markers of the tissue. Unset, or with none of its genes in the reference, the tiles use the top markers of every graph-based cluster instead. |
Data collections
56 data collections — 34 required 22 optional · 32 direct 24 derived.
Origin tells you whether a collection is real pipeline data or a reshape of it: direct = a pipeline output (scanned, or a recipe that reads raw files); derived = a recipe that reshapes one or more direct collections into the layout a visualization needs (no new measurement). Reads shows what produces it: a recipe .py transform, whose name links to its source on GitHub, or a raw file scanned off disk. (A direct collection can still have a recipe — one that merely parses/cleans the raw file; derived means the recipe reshapes another collection.)
| Tag | Origin | Type | Reads | Status |
|---|---|---|---|---|
samplesheet |
direct | Table | file samplesheet.csv$ |
required |
samples |
direct | Table | recipe nf-core/scrnaseq/samples.py |
required |
multiqc_data |
direct |  MultiQC MultiQC |
file (?:.*/)?multiqc(?:/[^/]+)?/multiqc_data/multiqc.parquet$ |
required |
cellranger_metrics_raw |
direct | Table | file (?:.*/)?cellranger/count/[^/]+/outs/metrics_summary.csv$ |
required |
cellranger_metrics |
derived | Table | recipe cellranger/metrics_summary.py |
required |
cellranger_library_metrics_long |
derived | Table | recipe cellranger/library_metrics_long.py |
required |
cellranger_mapping_breakdown |
derived | Table | recipe cellranger/mapping_breakdown.py |
required |
cellranger_raw_matrix_raw |
direct | Table | file (?:.*/)?raw_feature_bc_matrix/matrix.mtx.gz$ |
required |
cellranger_raw_barcodes_raw |
direct | Table | file (?:.*/)?raw_feature_bc_matrix/barcodes.tsv.gz$ |
required |
cellranger_filtered_barcodes_raw |
direct | Table | file (?:.*/)?filtered_feature_bc_matrix/barcodes.tsv.gz$ |
required |
cellranger_barcode_rank |
derived | Table | recipe cellranger/barcode_rank.py |
required |
cellranger_clusters_raw |
direct | Table | file (?:.*/)?analysis/clustering/gene_expression_graphclust/clusters.csv$ |
required |
cellranger_kmeans_clusters_raw |
direct | Table | file (?:.*/)?analysis/clustering/gene_expression_kmeans_[0-9]+_clusters/clusters.csv$ |
required |
cellranger_umap_raw |
direct | Table | file (?:.*/)?analysis/umap/[^/]+/projection.csv$ |
required |
cellranger_tsne_raw |
direct | Table | file (?:.*/)?analysis/tsne/[^/]+/projection.csv$ |
required |
cellranger_pca_raw |
direct | Table | file (?:.*/)?analysis/pca/[^/]+/projection.csv$ |
required |
cellranger_pca_variance_raw |
direct | Table | file (?:.*/)?analysis/pca/[^/]+/variance.csv$ |
required |
cellranger_pca_variance |
derived | Table | recipe cellranger/pca_variance.py |
required |
cellranger_dispersion_raw |
direct | Table | file (?:.*/)?analysis/pca/[^/]+/dispersion.csv$ |
required |
cellranger_features_selected_raw |
direct | Table | file (?:.*/)?analysis/pca/[^/]+/features_selected.csv$ |
required |
cellranger_diffexp_raw |
direct | Table | file (?:.*/)?analysis/diffexp/gene_expression_[^/]+/differential_expression.csv$ |
required |
cellranger_diffexp |
derived | Table | recipe cellranger/diffexp.py |
required |
cellranger_filtered_matrix_raw |
direct | Table | file (?:.*/)?filtered_feature_bc_matrix/matrix.mtx.gz$ |
required |
cellranger_filtered_features_raw |
direct | Table | file (?:.*/)?filtered_feature_bc_matrix/features.tsv.gz$ |
required |
cellranger_hvg_dispersion |
derived | Table | recipe cellranger/hvg_dispersion.py |
required |
cellranger_filtered_barcode_index_raw |
direct | Table | file (?:.*/)?filtered_feature_bc_matrix/barcodes.tsv.gz$ |
required |
cellranger_cellbender_barcodes_raw |
direct | Table | file (?:.*/)?cellranger/[/]+/cellbender_removebackground/[/]+_cell_barcodes.csv$ |
optional |
cellranger_cell_qc |
derived | Table | recipe cellranger/cell_qc.py |
required |
cellranger_cluster_summary |
derived | Table | recipe cellranger/cluster_summary.py |
required |
cellranger_marker_expression |
derived | Table | recipe cellranger/marker_expression.py |
required |
cellranger_marker_matrix |
derived | Table | recipe cellranger/marker_matrix.py |
required |
cellranger_cell_expression |
derived | Table | recipe cellranger/cell_expression.py |
required |
cellranger_cell_expression_long |
derived | Table | recipe cellranger/cell_expression_long.py |
required |
cellranger_cell_cycle |
derived | Table | recipe cellranger/cell_cycle.py |
required |
cellranger_cell_funnel |
derived | Table | recipe cellranger/cell_funnel.py |
required |
cellbender_metrics_raw |
direct | Table | file (?:.*/)?cellranger/[/]+/cellbender_removebackground/[/]+_metrics.csv$ |
optional |
cellbender_metrics |
derived | Table | recipe cellbender/metrics.py |
optional |
simpleaf_featuredump_raw |
direct | Table | file (?:.*/)?simpleaf/[^/]+/simpleaf_quant/af_quant/featureDump.txt$ |
optional |
simpleaf_cellbender_barcodes_raw |
direct | Table | file (?:.*/)?simpleaf/[/]+/cellbender_removebackground/[/]+_cell_barcodes.csv$ |
optional |
simpleaf_mapinfo_raw |
direct | Table | file (?:.*/)?simpleaf/[^/]+/simpleaf_quant/af_map/map_info.json$ |
optional |
simpleaf_quantjson_raw |
direct | Table | file (?:.*/)?simpleaf/[^/]+/simpleaf_quant/af_quant/quant.json$ |
optional |
qcatch_metrics_raw |
direct | Table | file (?:.*/)?simpleaf/[/]+/qcatch/[/]+_metrics_summary.csv$ |
optional |
simpleaf_cellbender_metrics_raw |
direct | Table | file (?:.*/)?simpleaf/[/]+/cellbender_removebackground/[/]+_metrics.csv$ |
optional |
simpleaf_barcode_rank |
derived | Table | recipe simpleaf/barcode_rank.py |
optional |
simpleaf_mapping_metrics |
derived | Table | recipe simpleaf/mapping_metrics.py |
optional |
qcatch_metrics_summary |
derived | Table | recipe qcatch/metrics_summary.py |
optional |
simpleaf_cellbender_metrics |
derived | Table | recipe nf-core/scrnaseq/simpleaf_cellbender_metrics.py |
optional |
kallisto_run_info_raw |
direct | Table | file (?:.*/)?kallisto/[^/]+.count/run_info.json$ |
optional |
kallisto_inspect_raw |
direct | Table | file (?:.*/)?kallisto/[^/]+.count/inspect.json$ |
optional |
kallisto_barcodes_raw |
direct | Table | file (?:.*/)?kallisto/[^/]+.count/counts_filtered/cells_x_genes.barcodes.txt$ |
optional |
kallisto_cellbender_barcodes_raw |
direct | Table | file (?:.*/)?kallisto/[/]+/cellbender_removebackground/[/]+_cell_barcodes.csv$ |
optional |
kallisto_cellbender_metrics_raw |
direct | Table | file (?:.*/)?kallisto/[/]+/cellbender_removebackground/[/]+_metrics.csv$ |
optional |
kallisto_run_metrics |
derived | Table | recipe kallisto/run_metrics.py |
optional |
kallisto_cellbender_metrics |
derived | Table | recipe nf-core/scrnaseq/kallisto_cellbender_metrics.py |
optional |
cell_calls_by_method |
derived | Table | recipe cellranger/cell_calls_by_method.py |
optional |
aligner_summary |
derived | Table | recipe cellranger/aligner_summary.py |
optional |
Cross-DC links
25 links — selecting a value in the source collection filters the target. The join column is shown after the source.
| Source · column | Target | Filters | |
|---|---|---|---|
samples · sample_id |
→ | multiqc_data |
Filter the MultiQC panels by the samples picked in the left panel |
samples · sample_id |
→ | cellranger_metrics |
Filter the Cell Ranger metrics table by the samples picked in the left panel |
samples · sample_id |
→ | cellranger_library_metrics_long |
Filter the thresholded library-metrics table by the samples picked in the left panel |
samples · sample_id |
→ | cellranger_mapping_breakdown |
Filter the mapping-region breakdown by the samples picked in the left panel |
samples · sample_id |
→ | cellranger_barcode_rank |
Filter the barcode-rank curve by the samples picked in the left panel |
samples · sample_id |
→ | cellranger_cell_qc |
Filter the per-cell QC hub by the samples picked in the left panel |
samples · sample_id |
→ | cellranger_cluster_summary |
Filter the cluster summary by the samples picked in the left panel |
samples · sample_id |
→ | cellranger_pca_variance |
Filter the PCA scree by the samples picked in the left panel |
samples · sample_id |
→ | cellranger_diffexp |
Filter the marker-gene table by the samples picked in the left panel |
samples · sample_id |
→ | cellbender_metrics |
Filter the CellBender metrics by the samples picked in the left panel |
samples · sample_id |
→ | simpleaf_barcode_rank |
Filter the simpleaf barcode-rank curve by the samples picked in the left panel |
samples · sample_id |
→ | simpleaf_mapping_metrics |
Filter the simpleaf mapping metrics by the samples picked in the left panel |
samples · sample_id |
→ | qcatch_metrics_summary |
Filter the QCatch metrics by the samples picked in the left panel |
samples · sample_id |
→ | kallisto_run_metrics |
Filter the kallisto run metrics by the samples picked in the left panel |
cellranger_cell_qc · cluster_label |
→ | cellranger_cluster_summary |
Carry a cluster selected on the cell hub over to the cluster summary |
cellranger_cell_qc · cluster_label |
→ | cellranger_marker_expression |
Carry a cluster selected on the cell hub over to its marker expression |
cellranger_cell_qc · cluster_label |
→ | cellranger_diffexp |
Carry a cluster selected on the cell hub over to its marker genes |
cellranger_cell_qc · cluster_label |
→ | cellranger_cell_expression |
Carry a cluster selected on the cell hub over to the per-cell expression matrix |
cellranger_cell_qc · cluster_label |
→ | cellranger_cell_expression_long |
Carry a cluster selected on the cell hub over to the melted marker expression |
cellranger_cell_qc · cluster_label |
→ | cellranger_cell_cycle |
Carry a cluster selected on the cell hub over to its cell-cycle scores |
samples · sample_id |
→ | cellranger_hvg_dispersion |
Filter the gene dispersion cloud by the samples picked in the left panel |
samples · sample_id |
→ | cellranger_cell_expression |
Filter the per-cell expression matrix by the samples picked in the left panel |
samples · sample_id |
→ | cellranger_cell_expression_long |
Filter the melted marker expression by the samples picked in the left panel |
samples · sample_id |
→ | cellranger_cell_cycle |
Filter the cell-cycle scores by the samples picked in the left panel |
samples · sample_id |
→ | cellranger_cell_funnel |
Filter the cell-calling funnel by the samples picked in the left panel |
Recipes
Each recipe reshapes raw pipeline output into a tidy table. The name links to its source; Output lists the validated OUTPUT_SCHEMA columns.
| Recipe | Transforms | Output |
|---|---|---|
cellbender/metrics.py |
CellBender's per-sample ambient-RNA removal metrics, pivoted to one row per sample. | sample, total_raw_counts, total_output_counts, total_counts_removed, fraction_counts_removed, expected_cells, found_cells, ratio_of_found_cells_to_expected_cells, target_fpr |
cellranger/aligner_summary.py |
One row per --aligner route, the headline numbers a reader compares them on. |
aligner, cells_called, cellbender_cells, median_umi_per_cell, mapping_rate |
cellranger/barcode_rank.py |
Barcode-rank ("knee") curve from the raw feature-barcode matrix. | sample, rank, umi_count, is_cell |
cellranger/cell_calls_by_method.py |
One row per barcode called a cell by ANY method, across all three aligner routes. | barcode_core, cellranger, cellranger_cellbender, simpleaf_cellbender, kallisto, kallisto_cellbender, n_callers |
cellranger/cell_cycle.py |
Cell-cycle phase per cell, from the Tirosh S and G2/M gene sets. | sample, barcode, cluster_label, s_score, g2m_score, phase, n_s_genes, n_g2m_genes |
cellranger/cell_expression.py |
One row per called cell, one column per panel gene: the table that turns the | sample, barcode, cluster_label, qc_status, umap_1, umap_2 |
cellranger/cell_expression_long.py |
A marker-panel slice of cellranger_cell_expression, melted: one row per |
sample, barcode, cluster_label, qc_status, gene, expression |
cellranger/cell_funnel.py |
The filtering waterfall: how many barcodes survive each step, per sample. | sample, barcodes_observed, cells_called, cellbender_cells, cells_qc_pass, pct_called, pct_qc_pass |
cellranger/cell_qc.py |
The cell hub: one row per called cell (filtered-matrix barcode), with QC | sample, barcode, barcode_core, n_umi, n_genes, pct_mito, pct_ribo, pct_hb, pct_top20, log10_n_umi, log10_n_genes, graphclust, cluster_label, kmeans_2, kmeans_3, kmeans_4, kmeans_5, kmeans_6, kmeans_7, kmeans_8, kmeans_9, kmeans_10, umap_1, umap_2, tsne_1, tsne_2, pc_1, pc_2, pc_3, cellbender_cell, mad_low_umi, mad_low_genes, mad_high_top20, mad_high_mito, qc_status, qc_reason, qc_flagged |
cellranger/cluster_summary.py |
One row per graph-based cluster, summarising cellranger_cell_qc. |
sample, graphclust, cluster_label, n_cells, pct_cells, median_n_umi, median_n_genes, median_pct_mito, pct_flagged, pct_cellbender_cell |
cellranger/diffexp.py |
Cluster marker genes from Cell Ranger's differential-expression tables. | sample, resolution, cluster, cluster_label, rank_in_cluster, gene_id, gene, mean_counts, log2fc, adjusted_pvalue |
cellranger/hvg_dispersion.py |
Feature selection, the step between the count matrix and the PCA nobody sees. | sample, gene, normalized_dispersion, mean_expression, detection_rate, selection |
cellranger/library_metrics_long.py |
Long, threshold-annotated form of the 5 metrics 10x's QC guidance gives a | sample, metric, value, unit, threshold, status |
cellranger/mapping_breakdown.py |
Long region breakdown of Cell Ranger's confidently-mapped-reads accounting, | sample, region, fraction |
cellranger/marker_expression.py |
Dot-plot table: mean log-normalised expression and detection rate of the | cluster_label, gene, mean_expression, frac_expressing |
cellranger/marker_matrix.py |
Wide companion to cellranger_marker_expression, for the complex_heatmap |
gene |
cellranger/metrics_summary.py |
Tidy Cell Ranger's per-sample metrics_summary.csv into typed columns. |
sample, estimated_cells, mean_reads_per_cell, median_genes_per_cell, number_of_reads, valid_barcodes_pct, sequencing_saturation_pct, q30_barcode_pct, q30_rna_read_pct, q30_umi_pct, reads_mapped_confidently_transcriptome_pct, reads_mapped_antisense_pct, fraction_reads_in_cells_pct, total_genes_detected, median_umi_counts_per_cell, valid_barcodes_frac, sequencing_saturation_frac, q30_barcode_frac, q30_rna_read_frac, q30_umi_frac, reads_mapped_confidently_transcriptome_frac, reads_mapped_antisense_frac, fraction_reads_in_cells_frac |
cellranger/pca_variance.py |
Variance explained by each of Cell Ranger's reported PCA components. | sample, pc, variance_explained |
kallisto/run_metrics.py |
kallisto | bustools (kb count) run headline numbers, one row per sample. | sample, n_processed, n_pseudoaligned, p_pseudoaligned, n_barcodes, cells_called |
nf-core/scrnaseq/kallisto_cellbender_metrics.py |
CellBender's per-sample metrics on the kallisto route. | sample, total_raw_counts, total_output_counts, total_counts_removed, fraction_counts_removed, expected_cells, found_cells, ratio_of_found_cells_to_expected_cells, target_fpr |
nf-core/scrnaseq/samples.py |
One row per scRNA-seq sample, from the samplesheet the pipeline validated. | sample_id, expected_cells, n_lanes |
nf-core/scrnaseq/simpleaf_cellbender_metrics.py |
CellBender's per-sample metrics on the simpleaf route. | sample, total_raw_counts, total_output_counts, total_counts_removed, fraction_counts_removed, expected_cells, found_cells, ratio_of_found_cells_to_expected_cells, target_fpr |
qcatch/metrics_summary.py |
Tidy QCatch's per-sample <sample>_metrics_summary.csv into typed columns. |
sample, retained_cells, processed_cells, mean_reads_per_retained_cell, median_umi_per_retained_cell, median_genes_per_retained_cell, total_genes_detected, mapping_rate_pct, sequencing_saturation_pct |
simpleaf/barcode_rank.py |
Barcode-rank ("knee") curve from simpleaf/alevin-fry's per-barcode feature dump. | sample, aligner, rank, umi_count, is_cell |
simpleaf/mapping_metrics.py |
simpleaf/alevin-fry mapping headline numbers, one row per sample. | sample, num_processed, num_mapped, mapping_rate, num_cells |
Dashboard tabs
One dashboard: the Overview, then nine child tabs in three groups, read as a funnel from the reads to the cells, their clusters and the genes that mark them. Each tab below carries the same icon and colour the dashboard gives it, so the page and the app read alike.
| Group | Tabs |
|---|---|
| Data & QC | MultiQC, Library QC |
| Cells | Cell Calling, Aligner Concordance, Cell QC, Embeddings, Clusters |
| Genes | Markers, Compare Selections |
Each child tab opens with a short intro and a strip of two to four cards, then at
most three open sections; tables and details follow, collapsed. The persistent
Sample filters (the sample) sit in the left panel and narrow every tab through
the sample links. The persistent Cell filters (cluster, QC status, UMIs and genes
per cell, on the per-cell QC table) sit collapsed at the bottom of the panel on the
four tabs that draw cells: Cell QC, Embeddings, Clusters and Markers. A cluster
picked there narrows the cluster summary, marker, expression and cell-cycle tables
through the cluster_label links. The Sample sheet is pinned, collapsed, to the
bottom of every child tab. Cell Ranger clusters each sample on its own, so on a
multi-sample run a cluster label shared by two samples is not the same population.
Droplet single-cell RNA-seq, from reads to called cells, clusters and their marker genes.
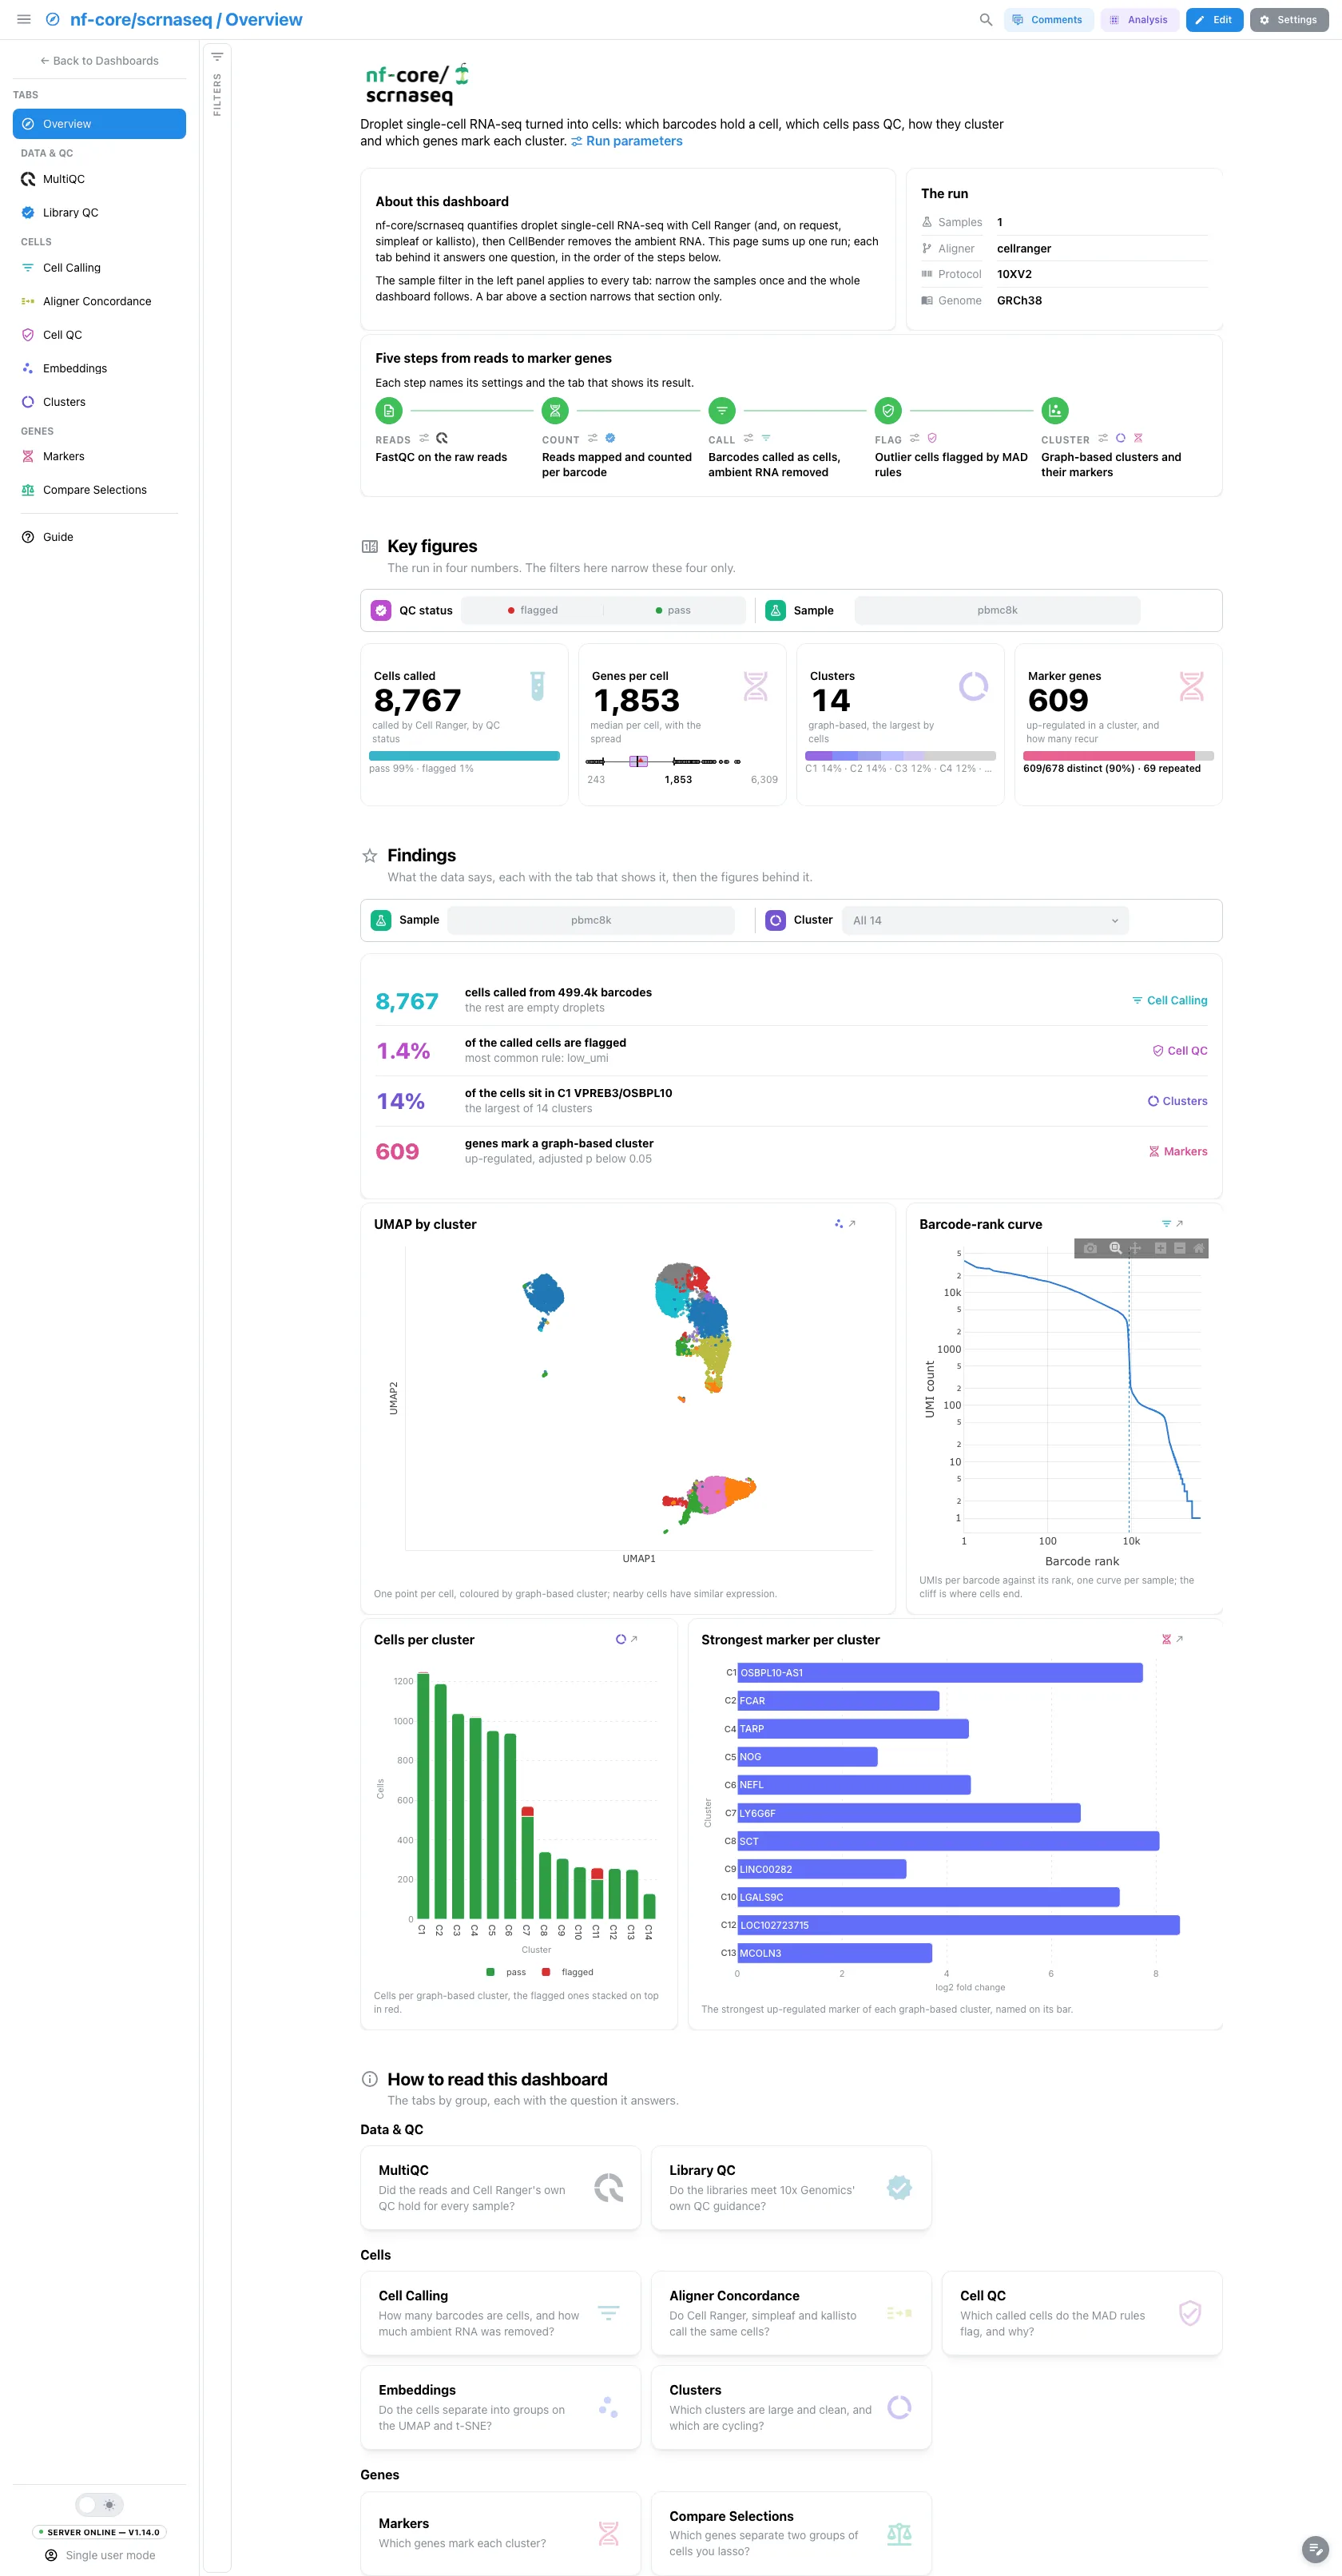
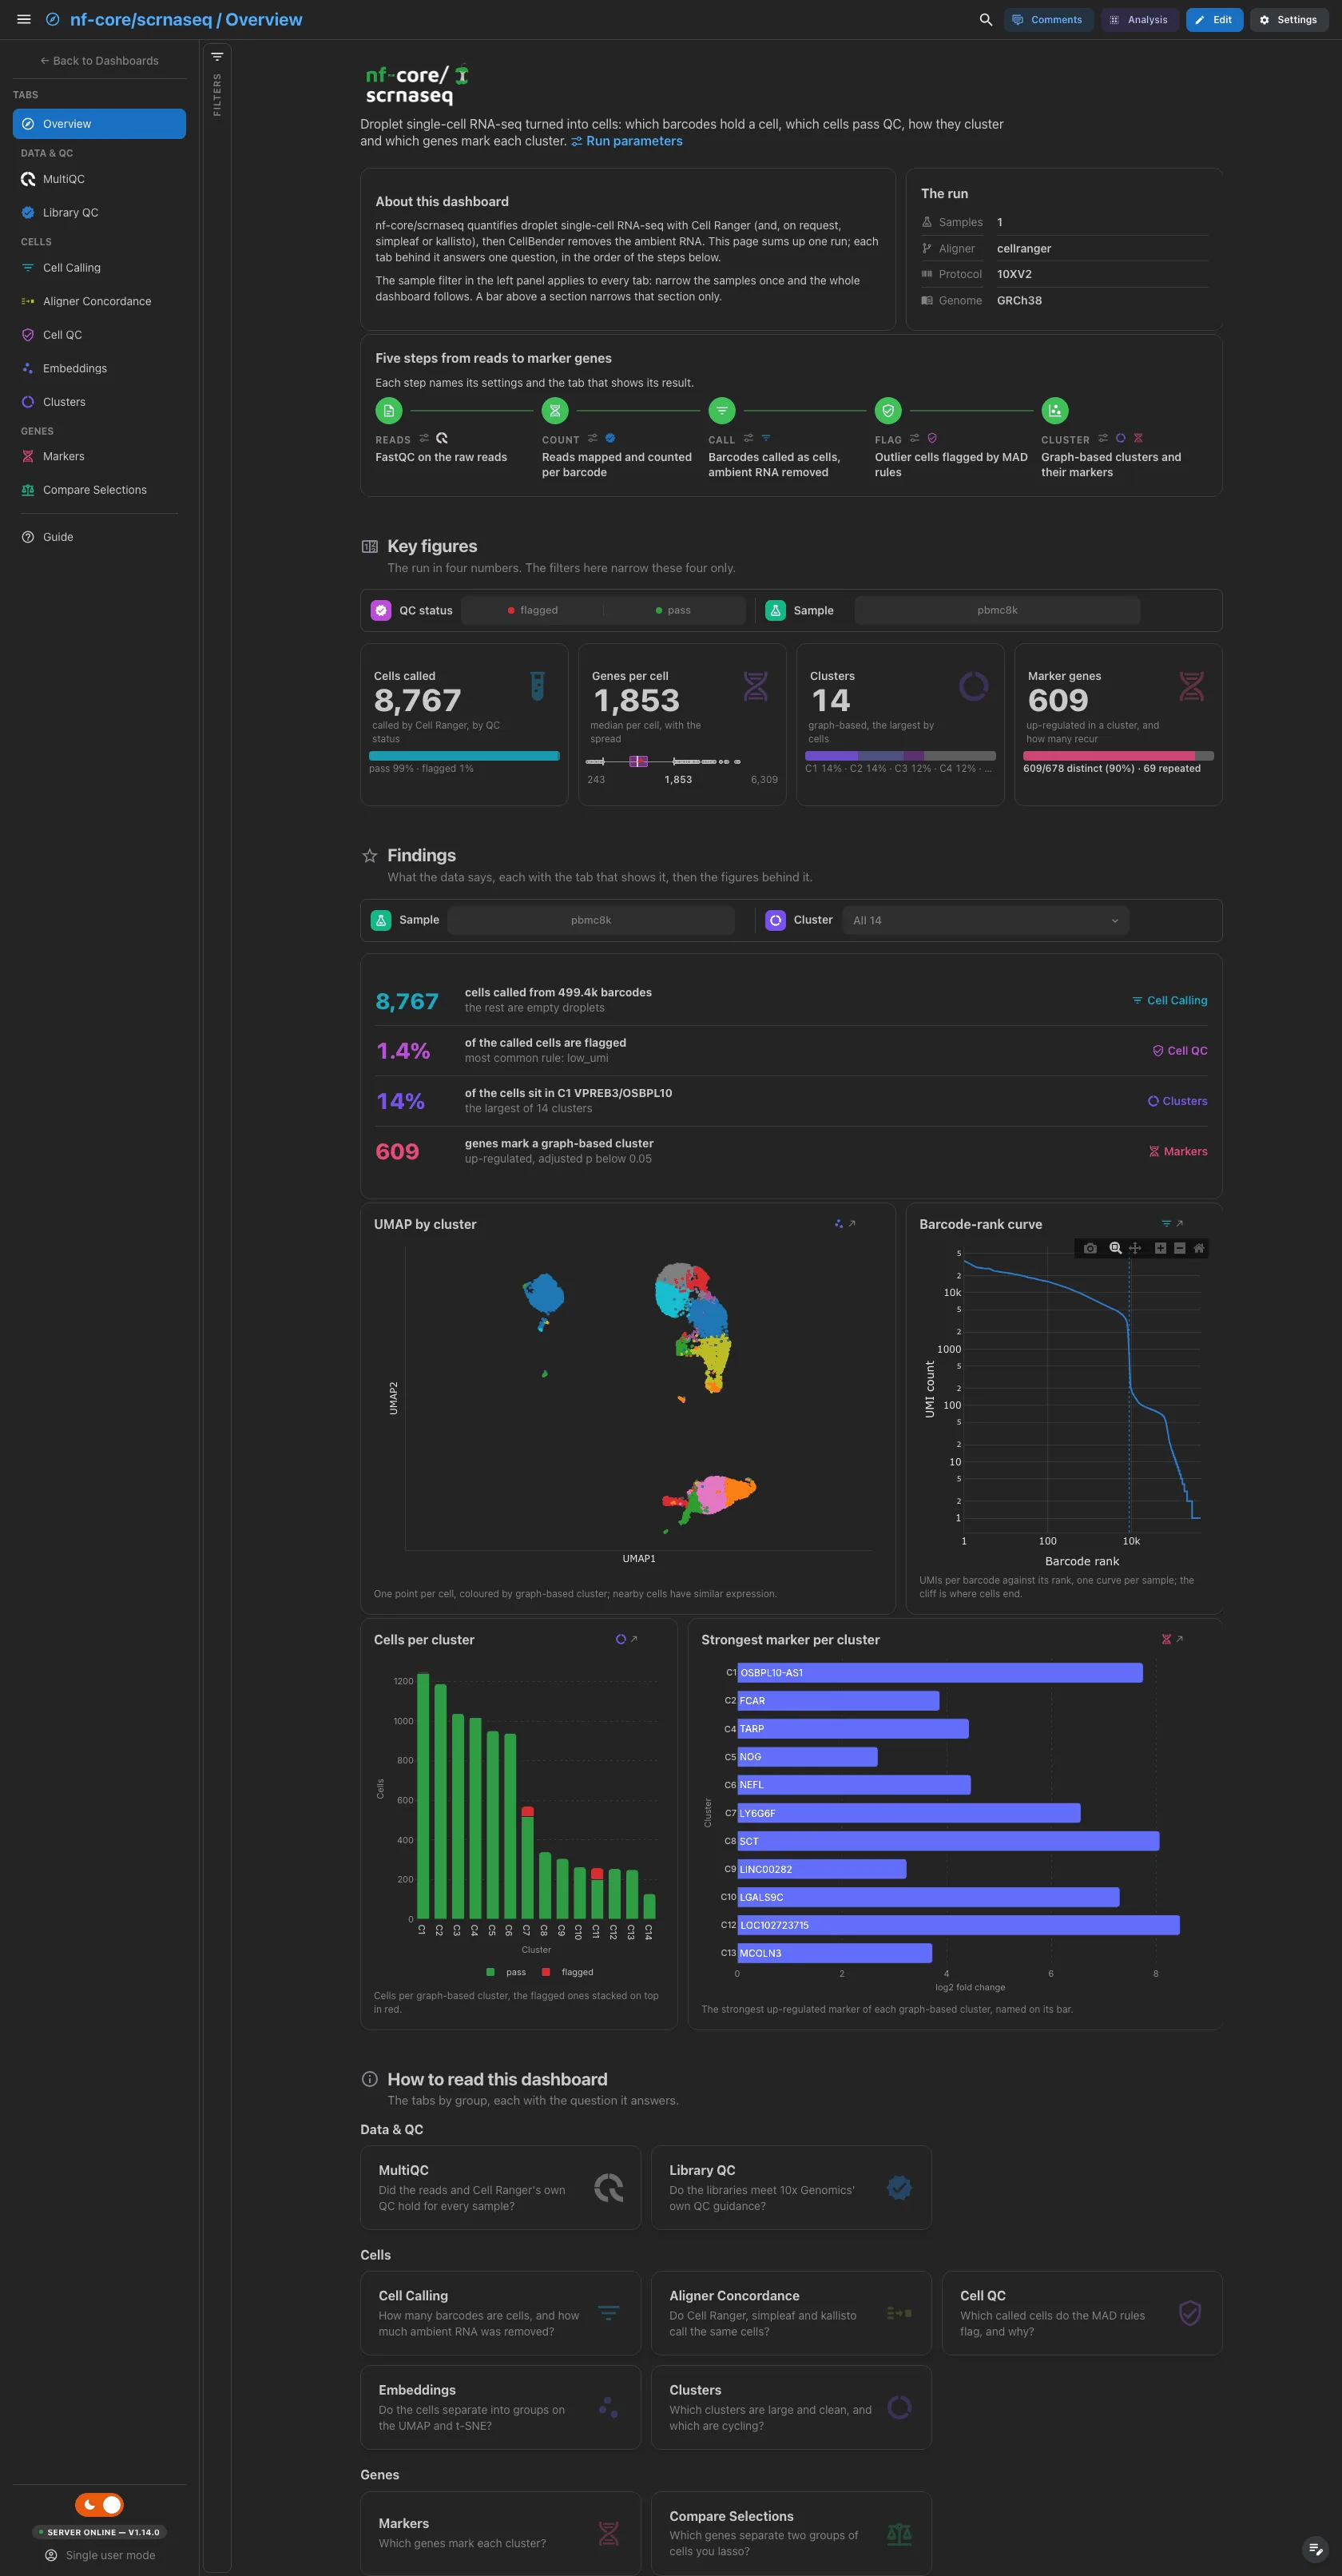
A short hero links the run parameters. About this dashboard says how the two filter levels work, The run lists the samples, the aligner, the protocol and the genome, and Pipeline walks the five steps from reads to marker genes (reads, count, call, flag, cluster), each linked to its parameters and its tab. Every key figure, finding and highlight reads the Cell Ranger route, which every run writes. The findings are live values: they follow the filters.
Filters and components
Filters · the left panel starts collapsed. Key figures has its own filter bar (the QC status and the sample), and so does Findings (the sample and the cluster): each narrows its own section only.
| Section | What it holds |
|---|---|
| Top | Hero, About this dashboard, The run, Pipeline |
| Key figures | 4 headline cards: cells called, genes per cell, clusters, marker genes |
| Findings | Live result rows, then 4 figures: the UMAP by cluster, the barcode-rank curve, the cells per cluster with the flagged ones on top and the strongest marker of each cluster |
| How to read this dashboard | The tabs by group, each with its question |
Data & QC · Did the reads and Cell Ranger's own QC hold for every sample?
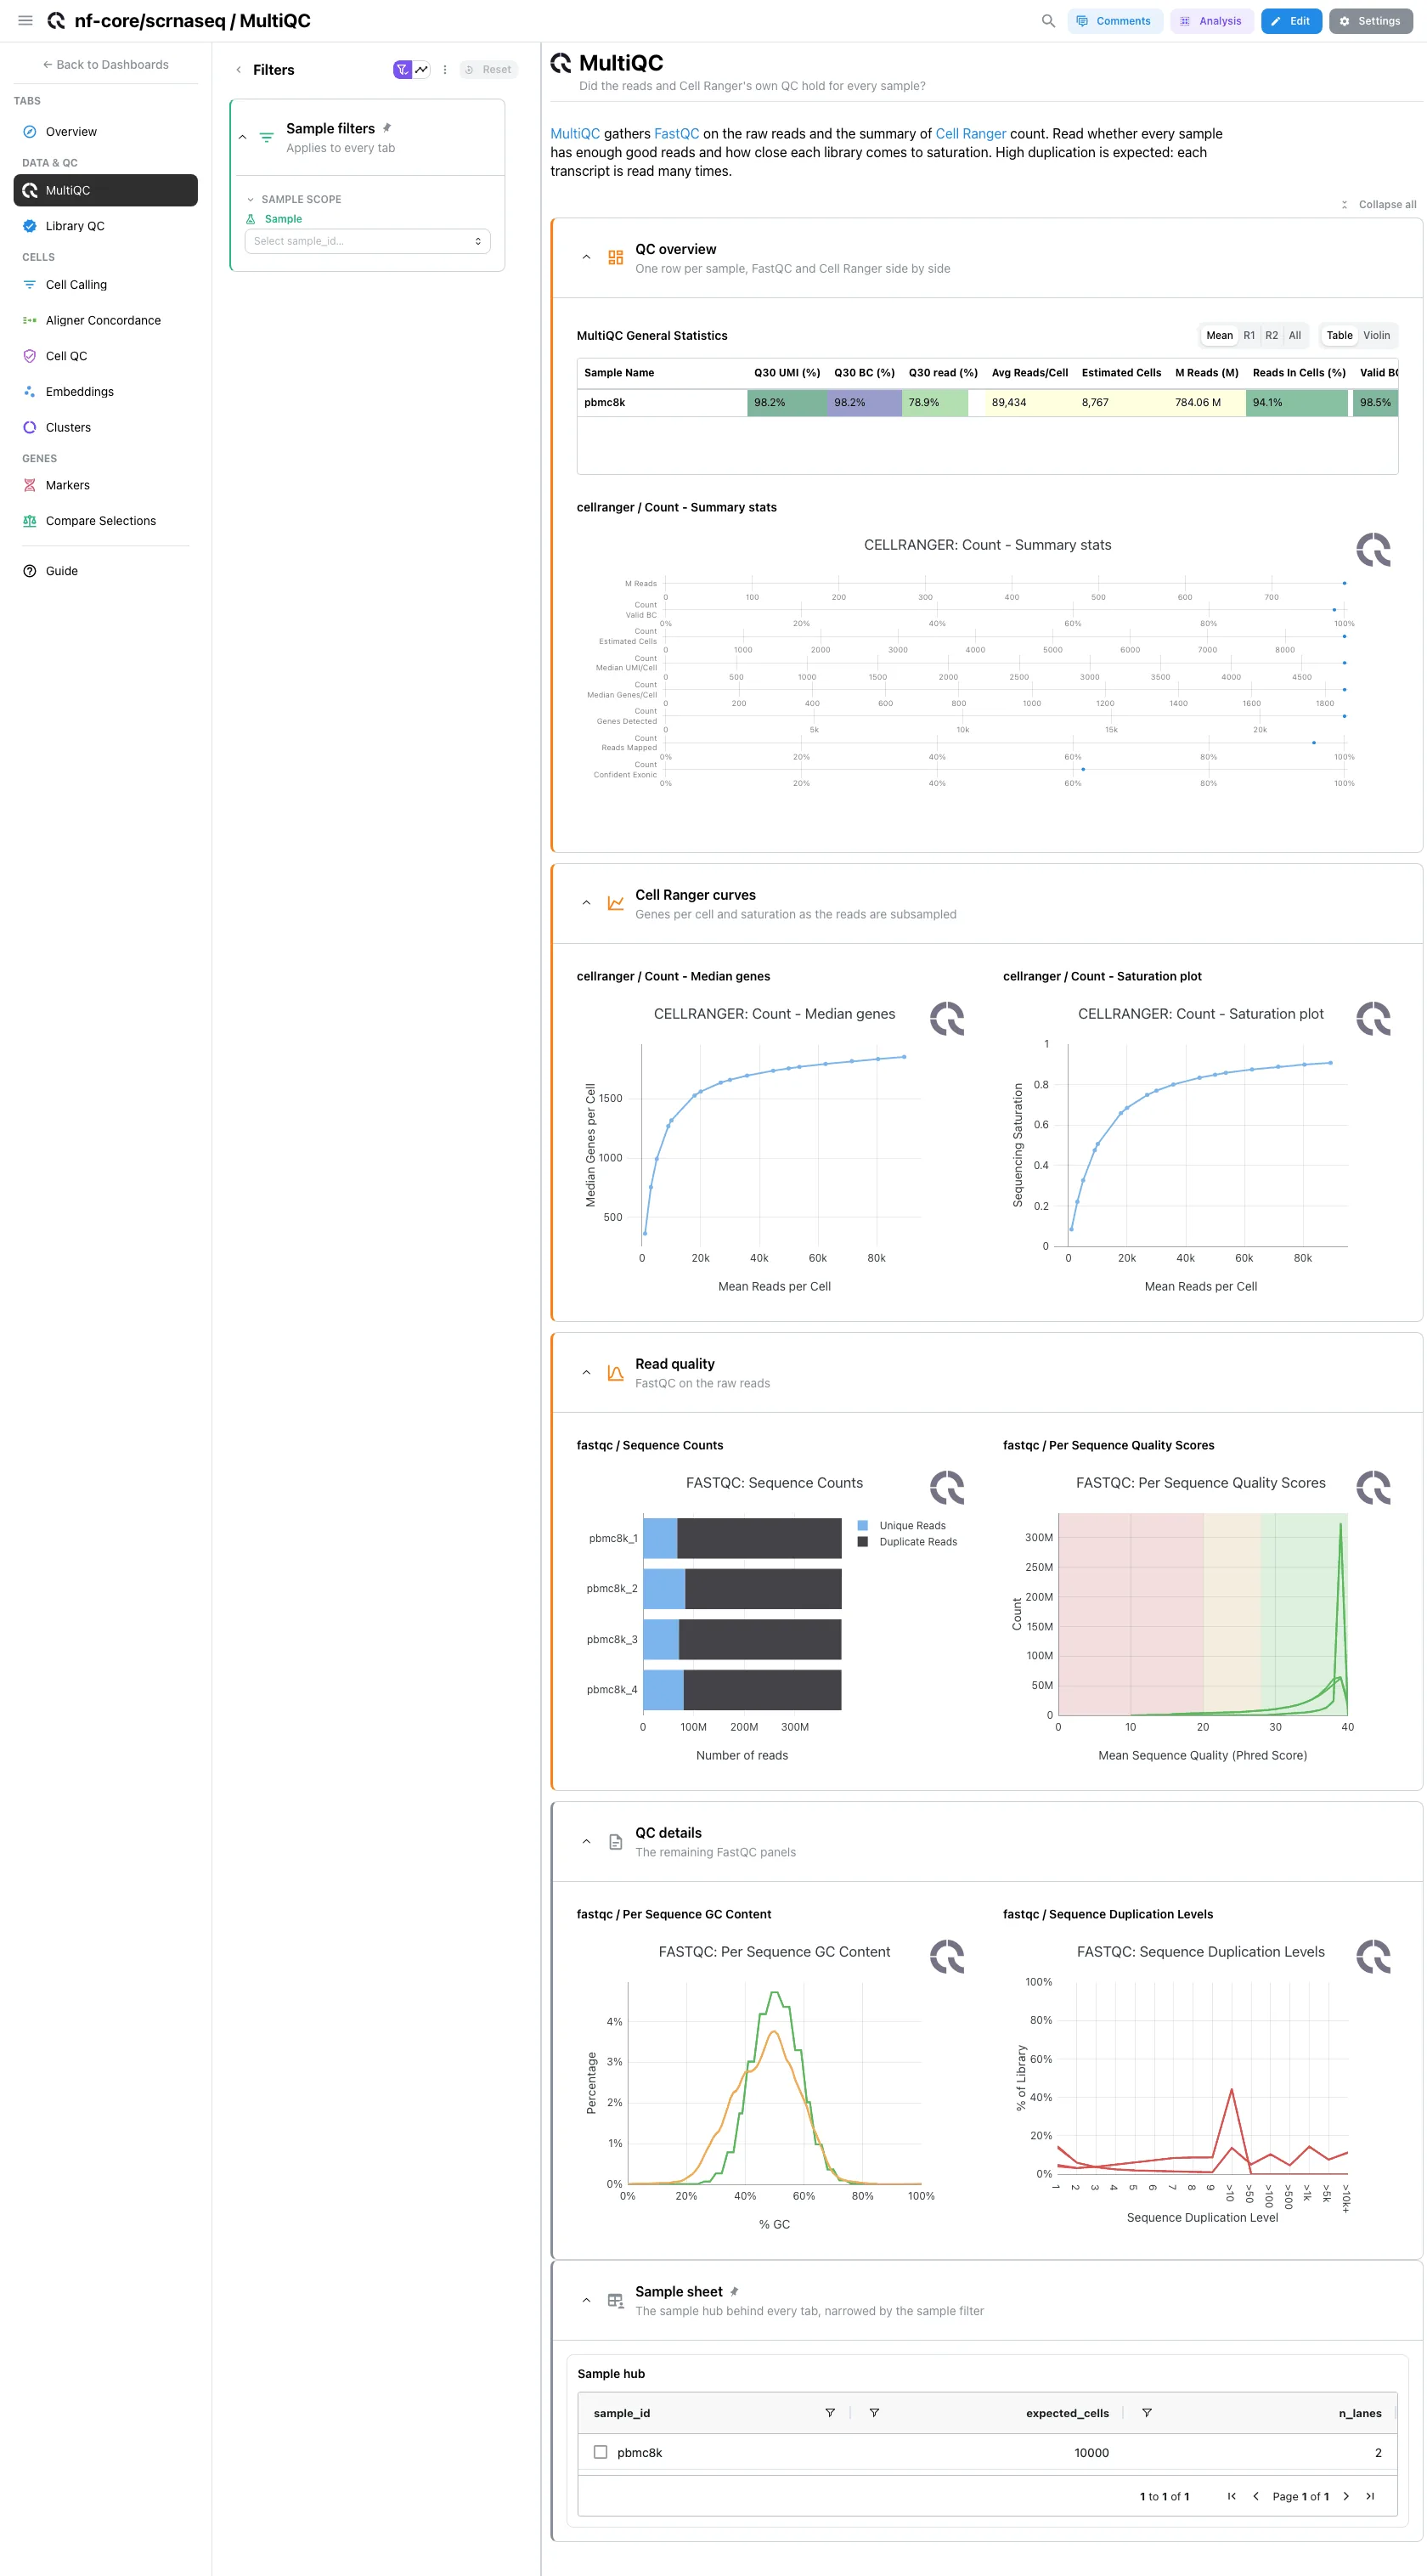
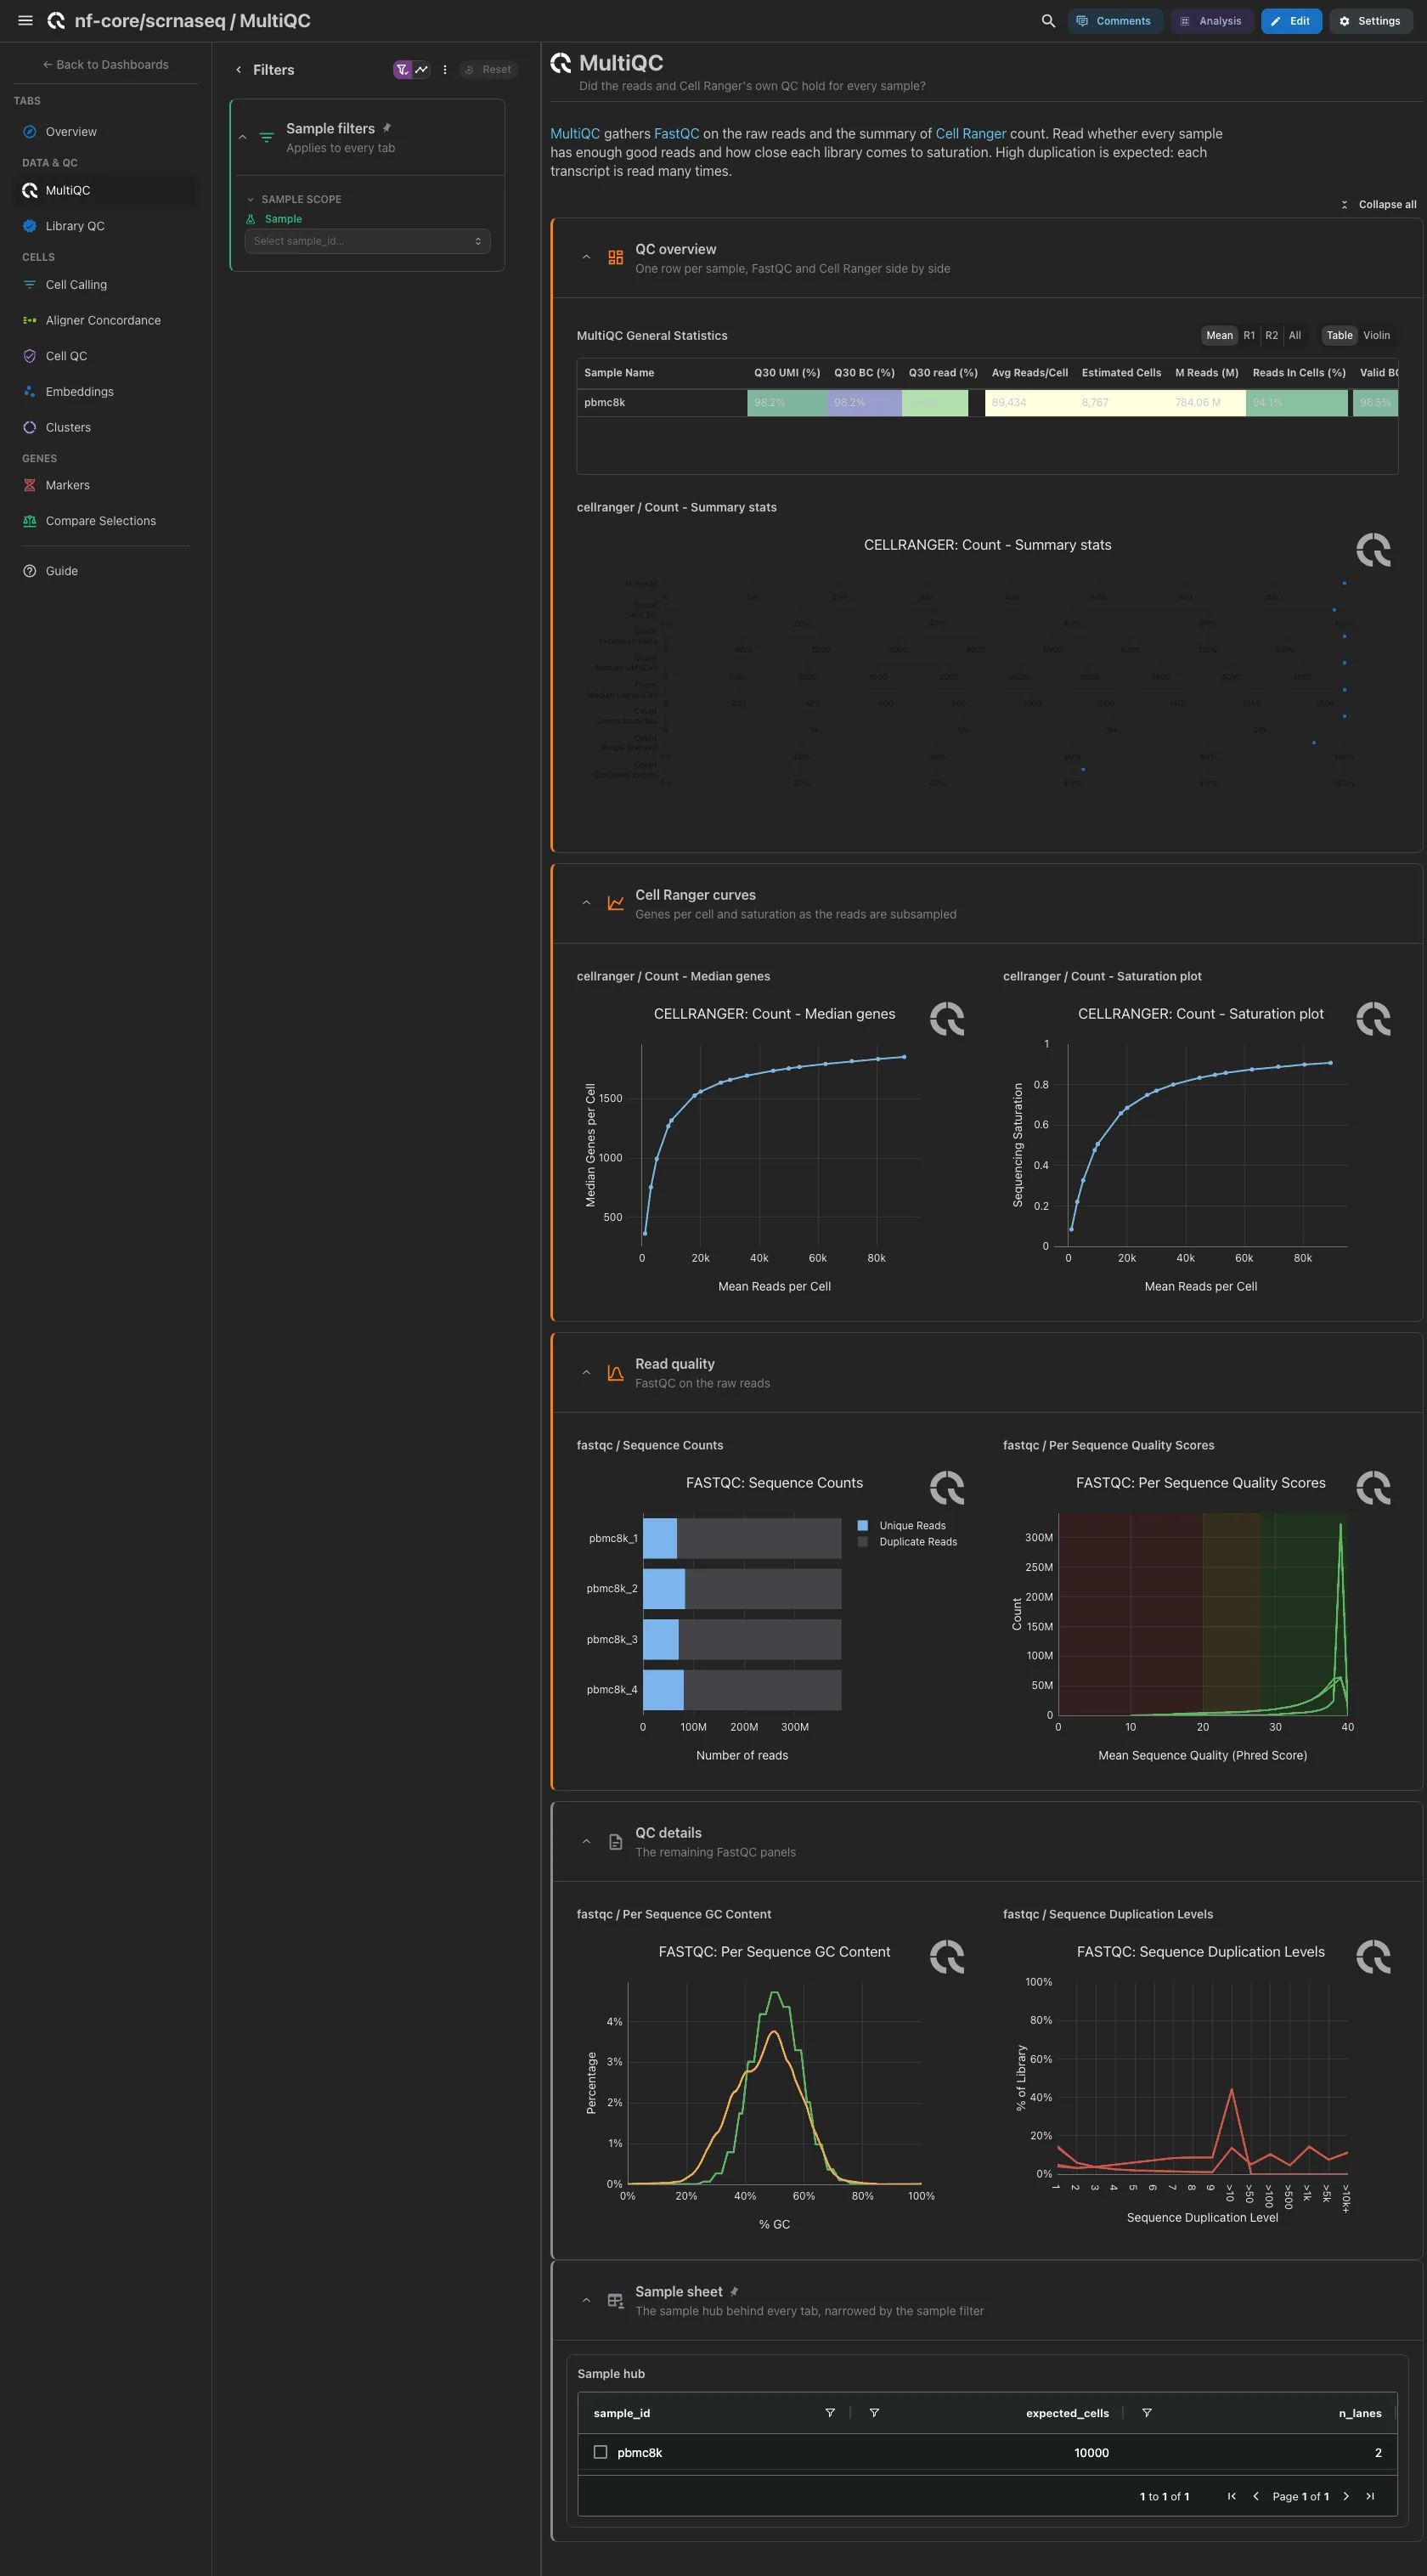
MultiQC panels only, from the pipeline's own report. Open: the general statistics and Cell Ranger count's summary table, then its median-genes and saturation curves, then the FastQC sequence counts and per-sequence quality. GC content and duplication are collapsed; duplication runs high by design, since each transcript is read many times. Cell Ranger's own barcode-rank panel is left out: the Cell Calling tab draws the same curve with the called cells marked.
Filters and components
Filters · no filter of its own: the persistent Sample filter reaches
the report through the sample link.
| Section | What it holds |
|---|---|
| QC overview | 2 MultiQC panels |
| Cell Ranger curves | 2 MultiQC panels |
| Read quality | 2 MultiQC panels |
| QC details (collapsed) | 2 MultiQC panels |
Data & QC · Do the libraries meet 10x Genomics' own QC guidance?
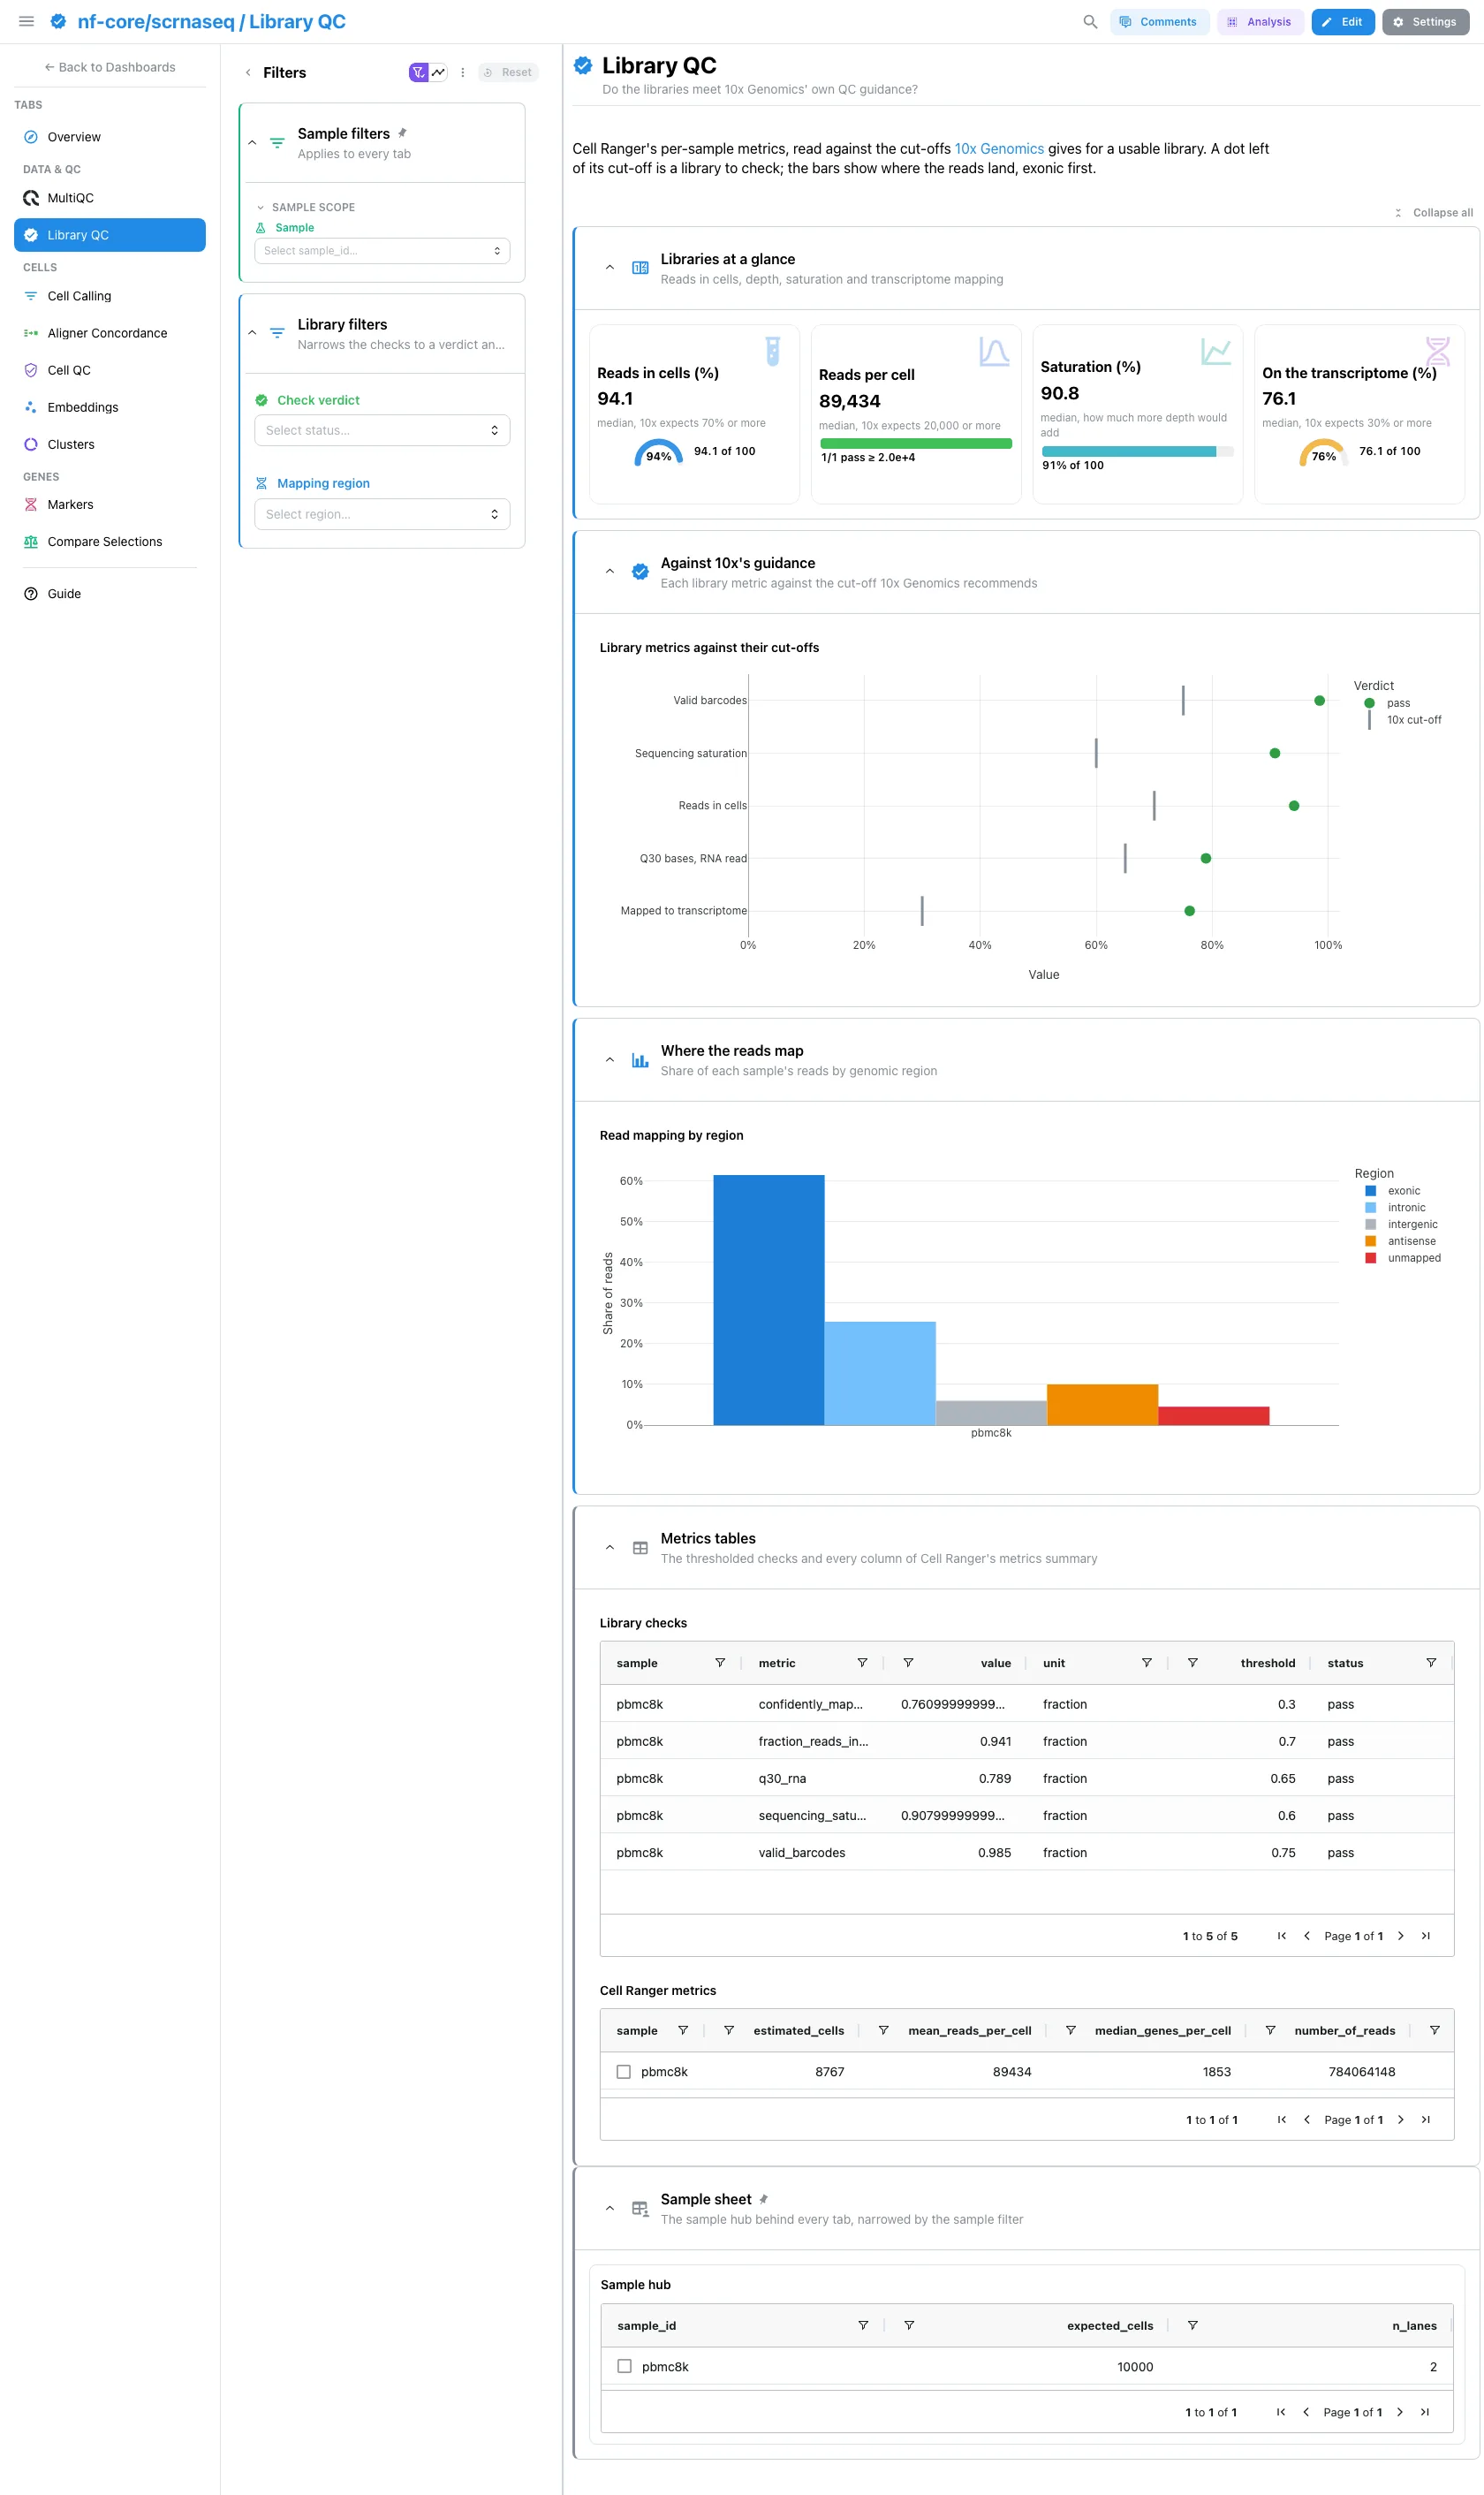
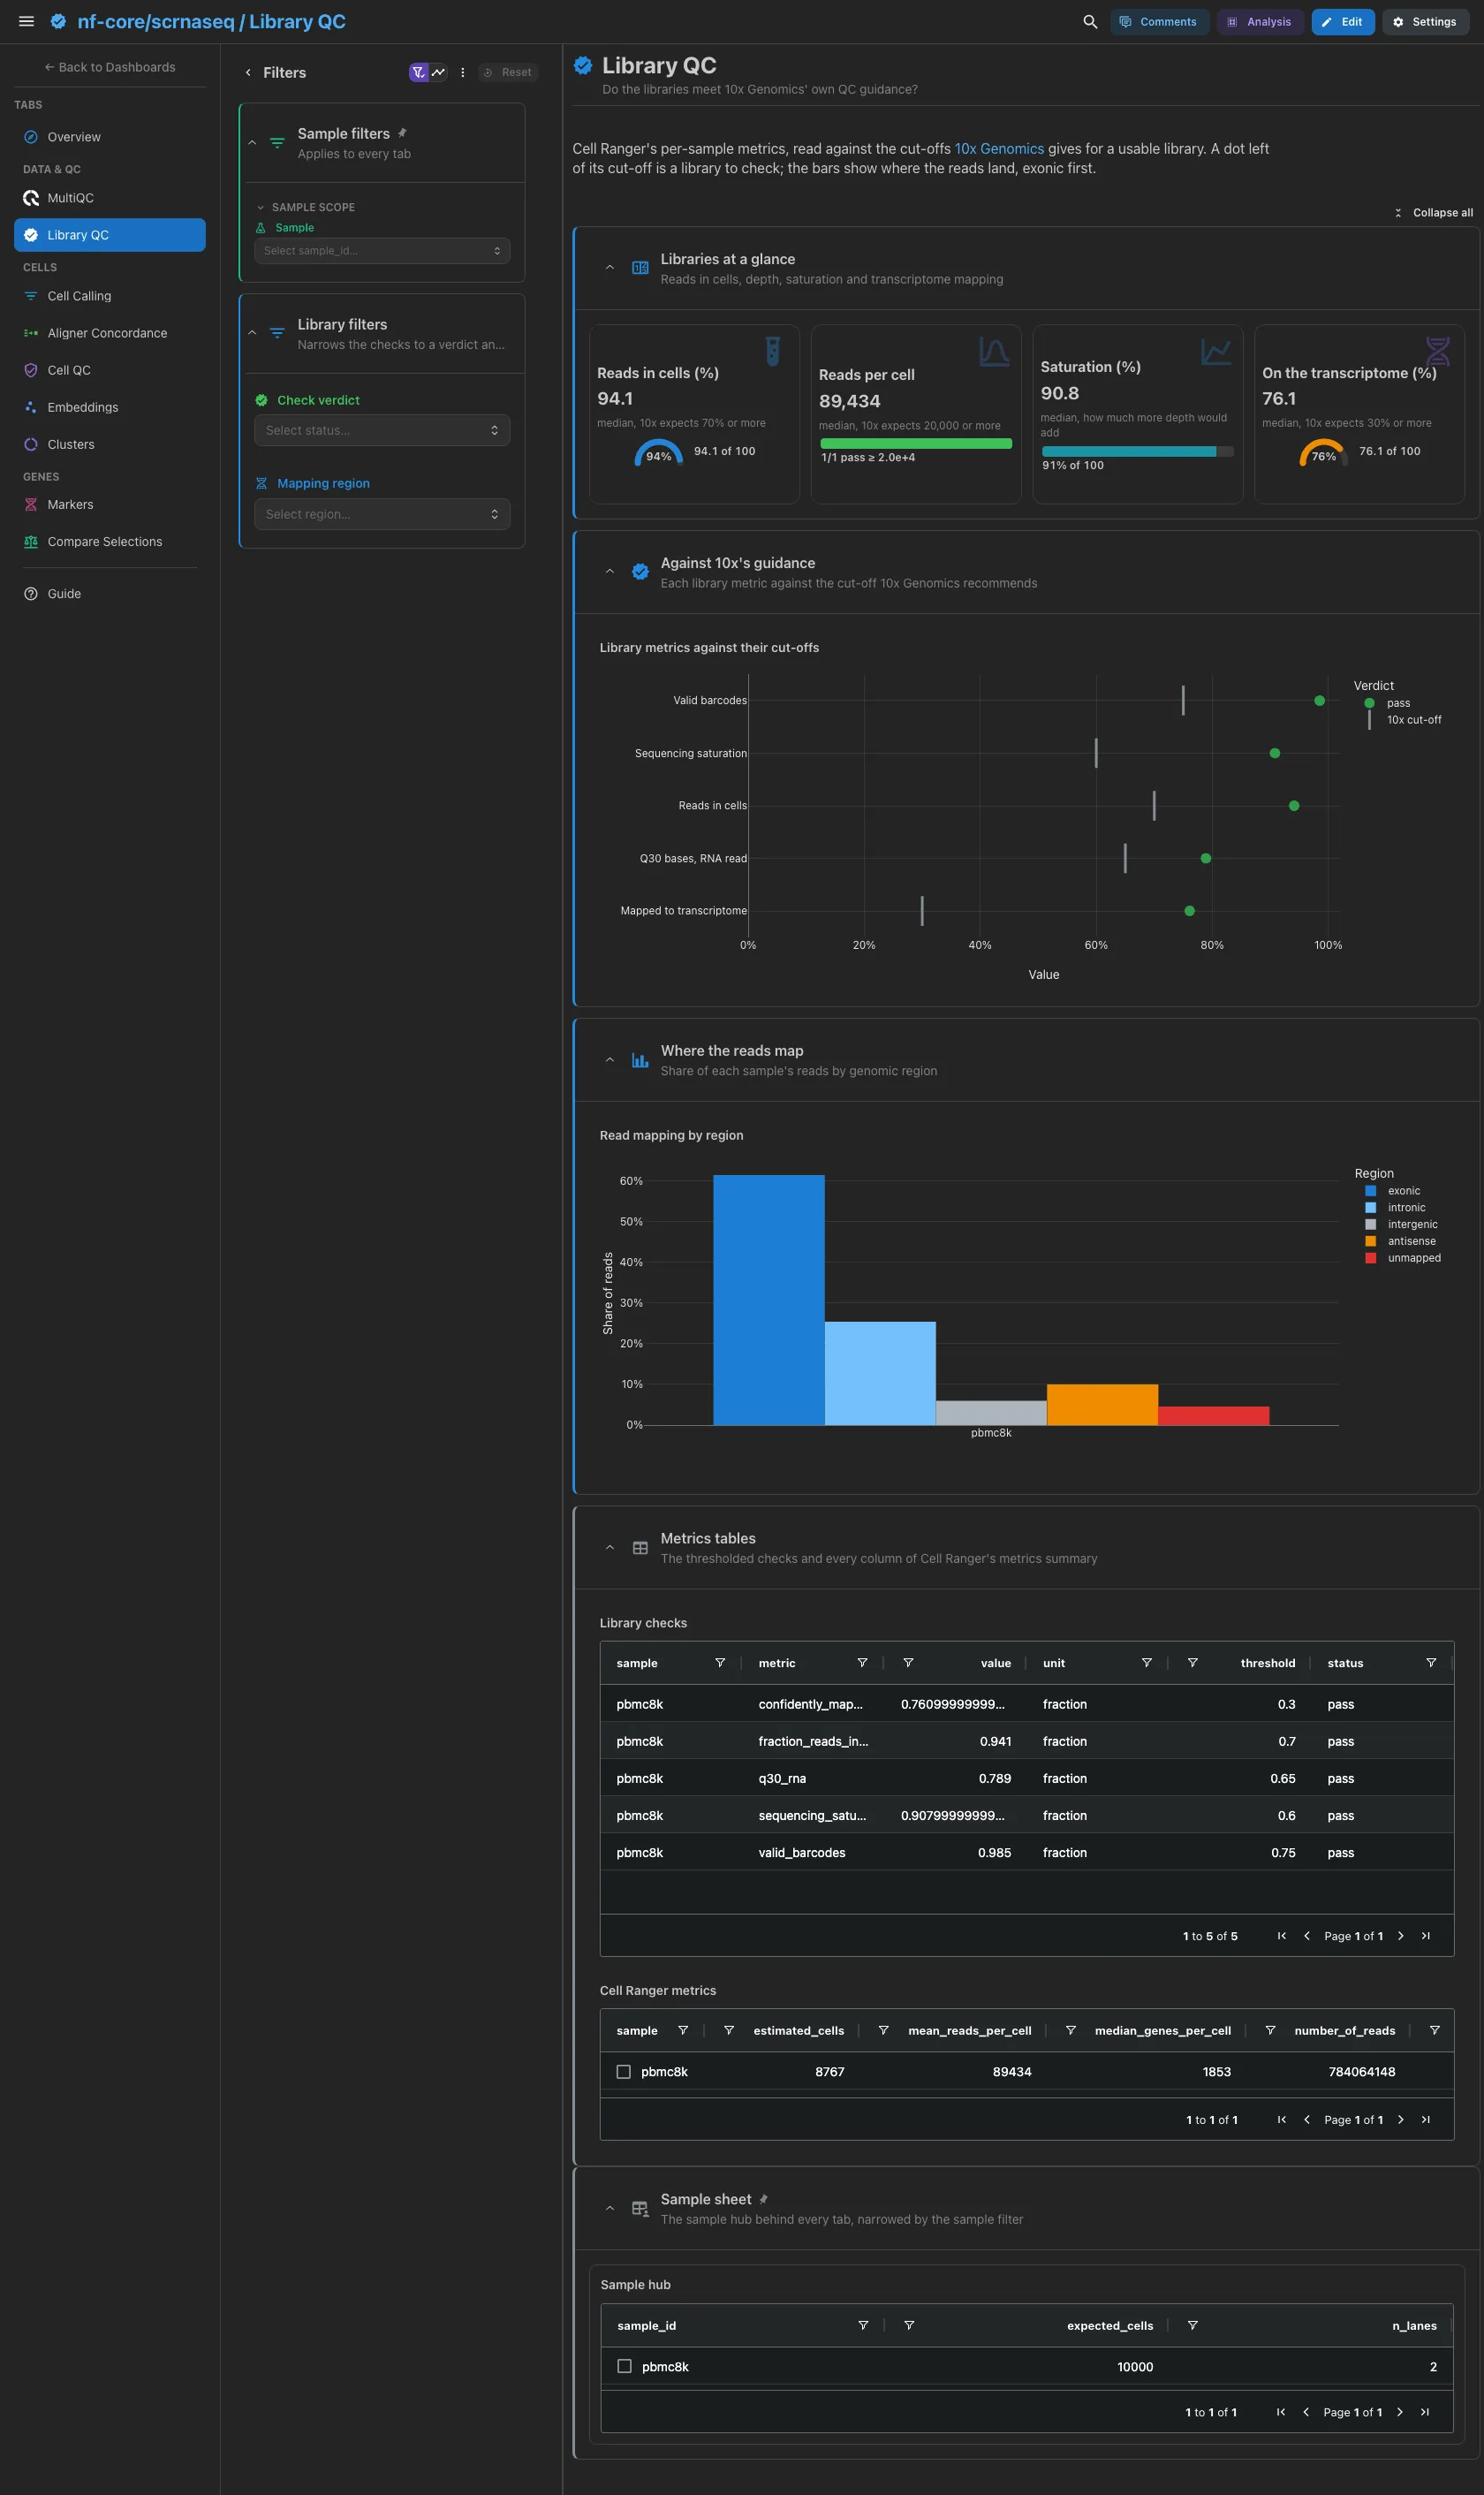
The reads in cells, the sequencing saturation and the reads on the transcriptome as levels out of 100, and the reads per cell with the samples counted against the 20,000 10x recommends. Then each library metric (saturation, reads in cells, valid barcodes, Q30 on the RNA read, mapped to the transcriptome) as a dot coloured by its verdict beside a grey tick at the 10x cut-off, and the reads by genomic region, grouped rather than stacked because antisense overlaps exonic and intronic. The checks table and Cell Ranger's metrics are collapsed.
Filters and components
Filters · Check verdict on cellranger_library_metrics_long and
Mapping region on cellranger_mapping_breakdown.
| Section | What it holds |
|---|---|
| Libraries at a glance | 4 cards |
| Against 10x's guidance | Library metrics against their cut-offs |
| Where the reads map | Read mapping by region |
| Metrics tables (collapsed) | Library checks, Cell Ranger metrics |
Cells · How many barcodes are cells, and how much ambient RNA was removed?
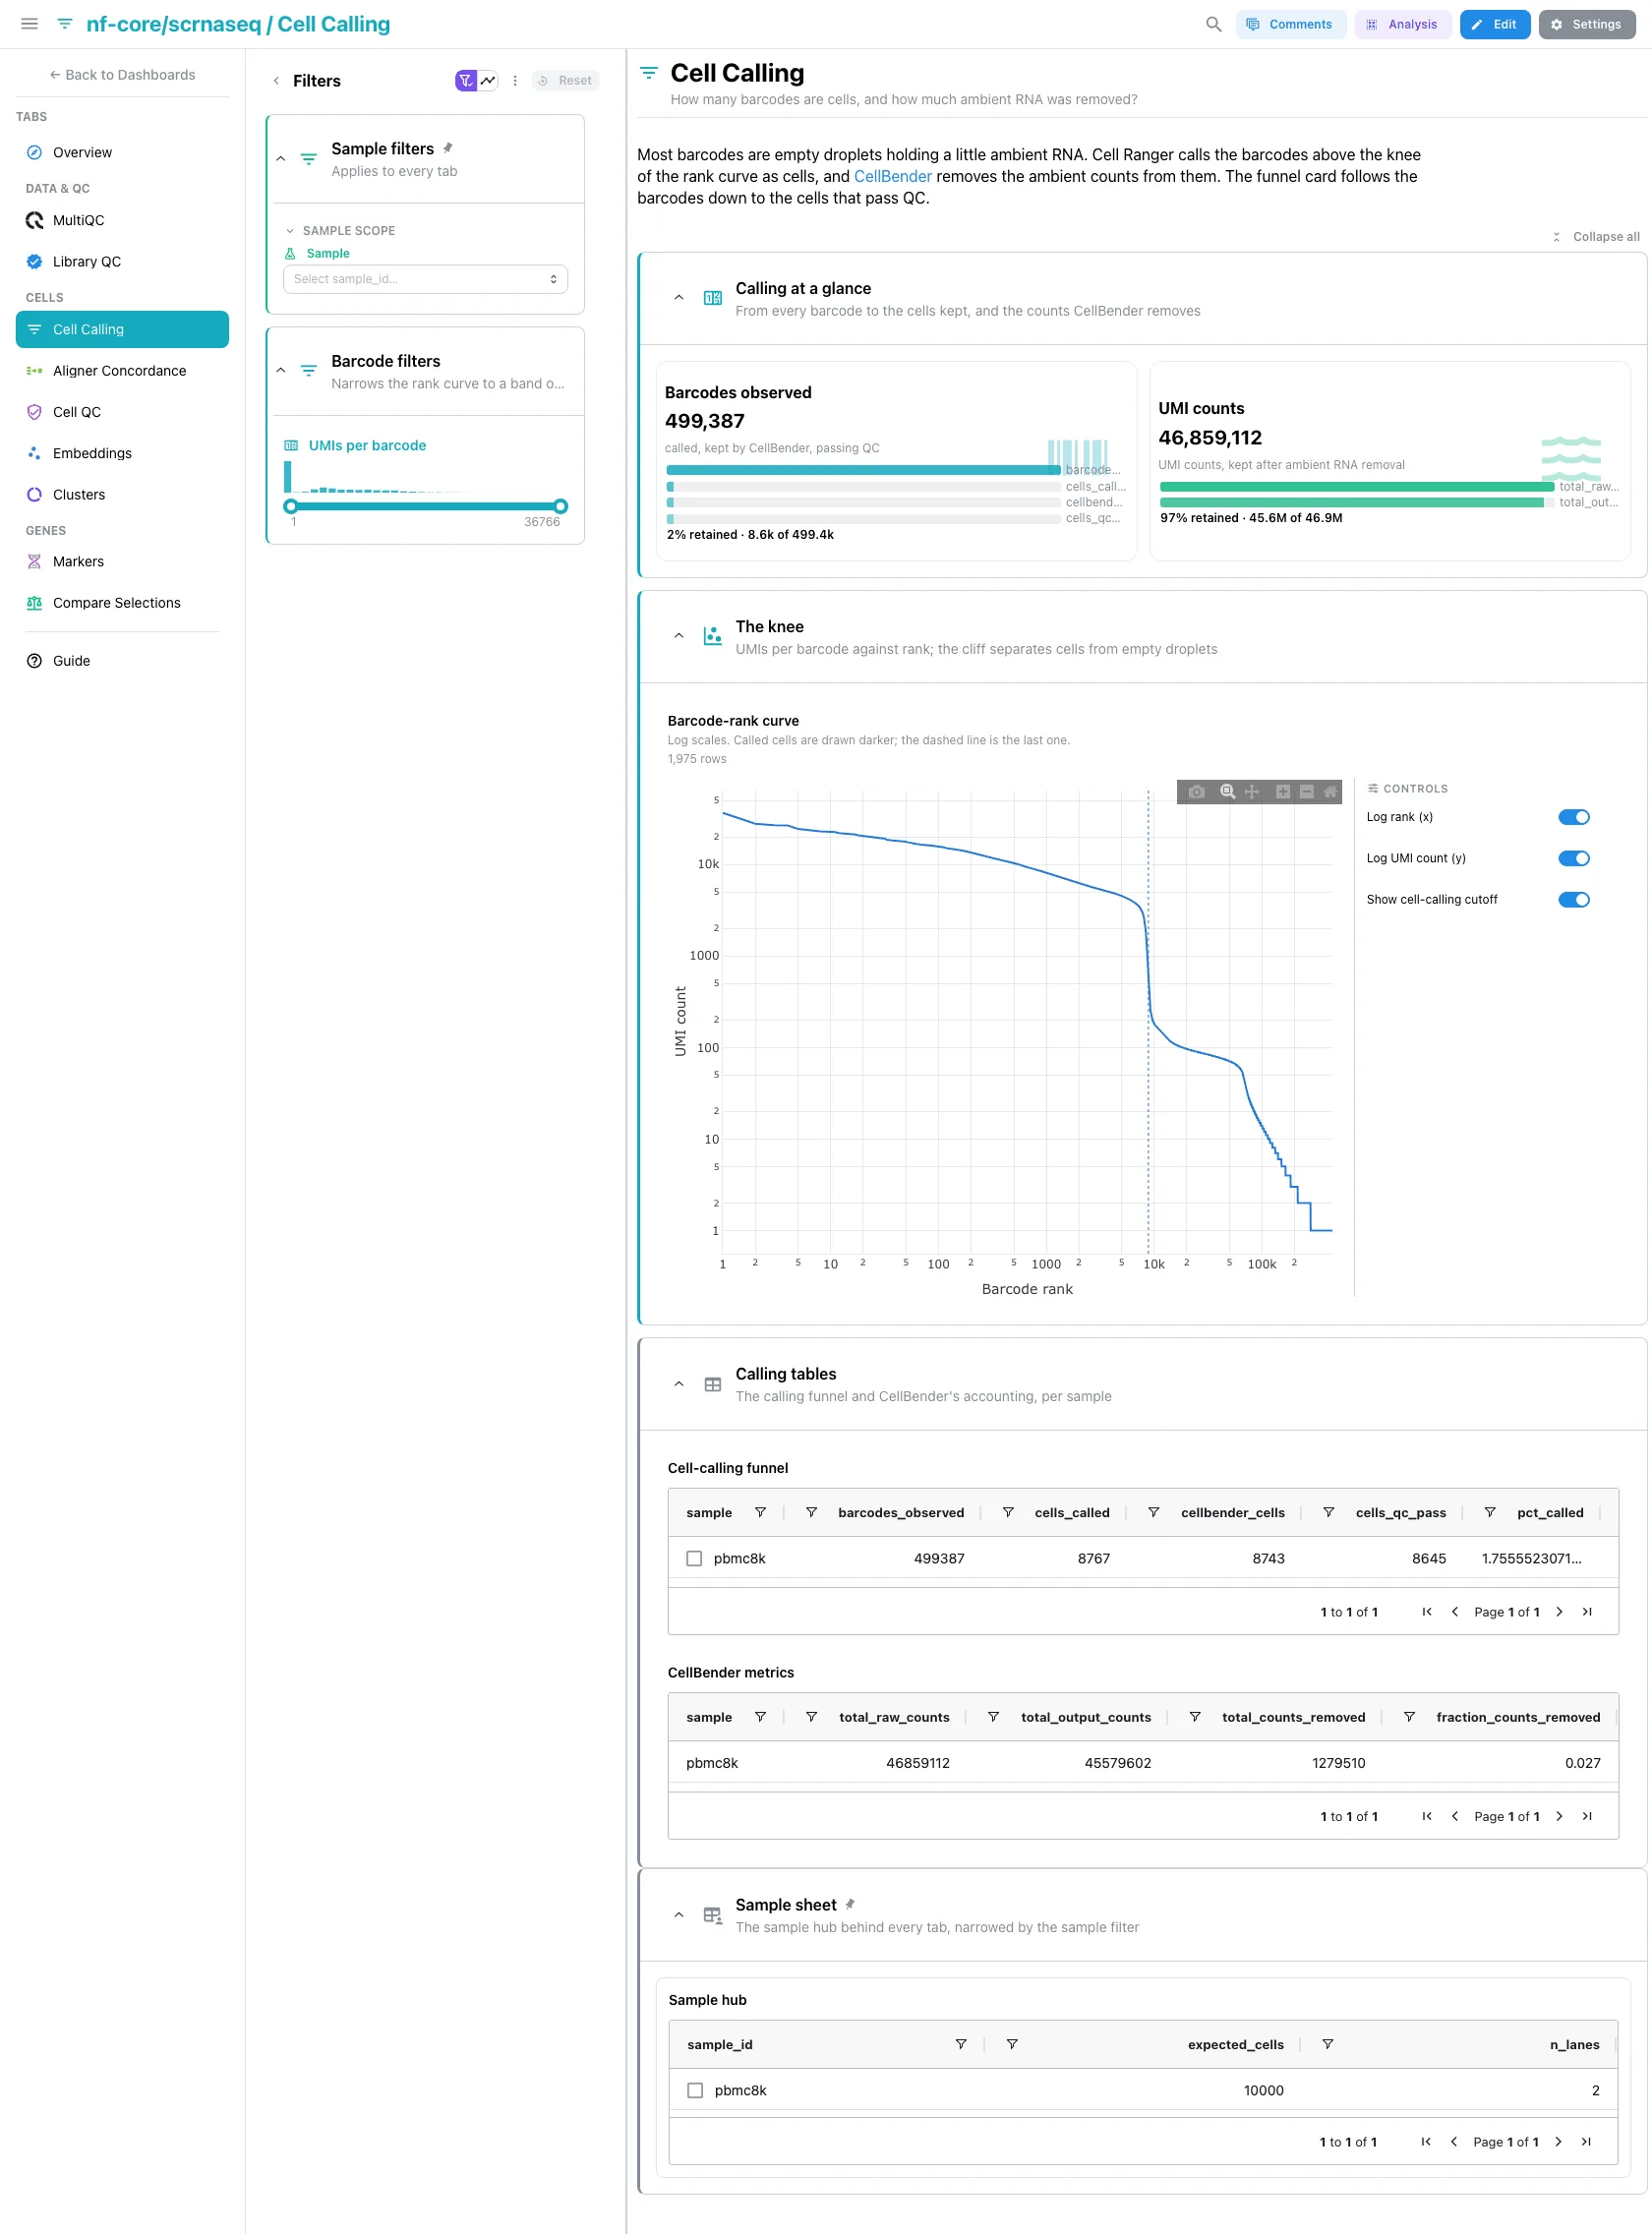
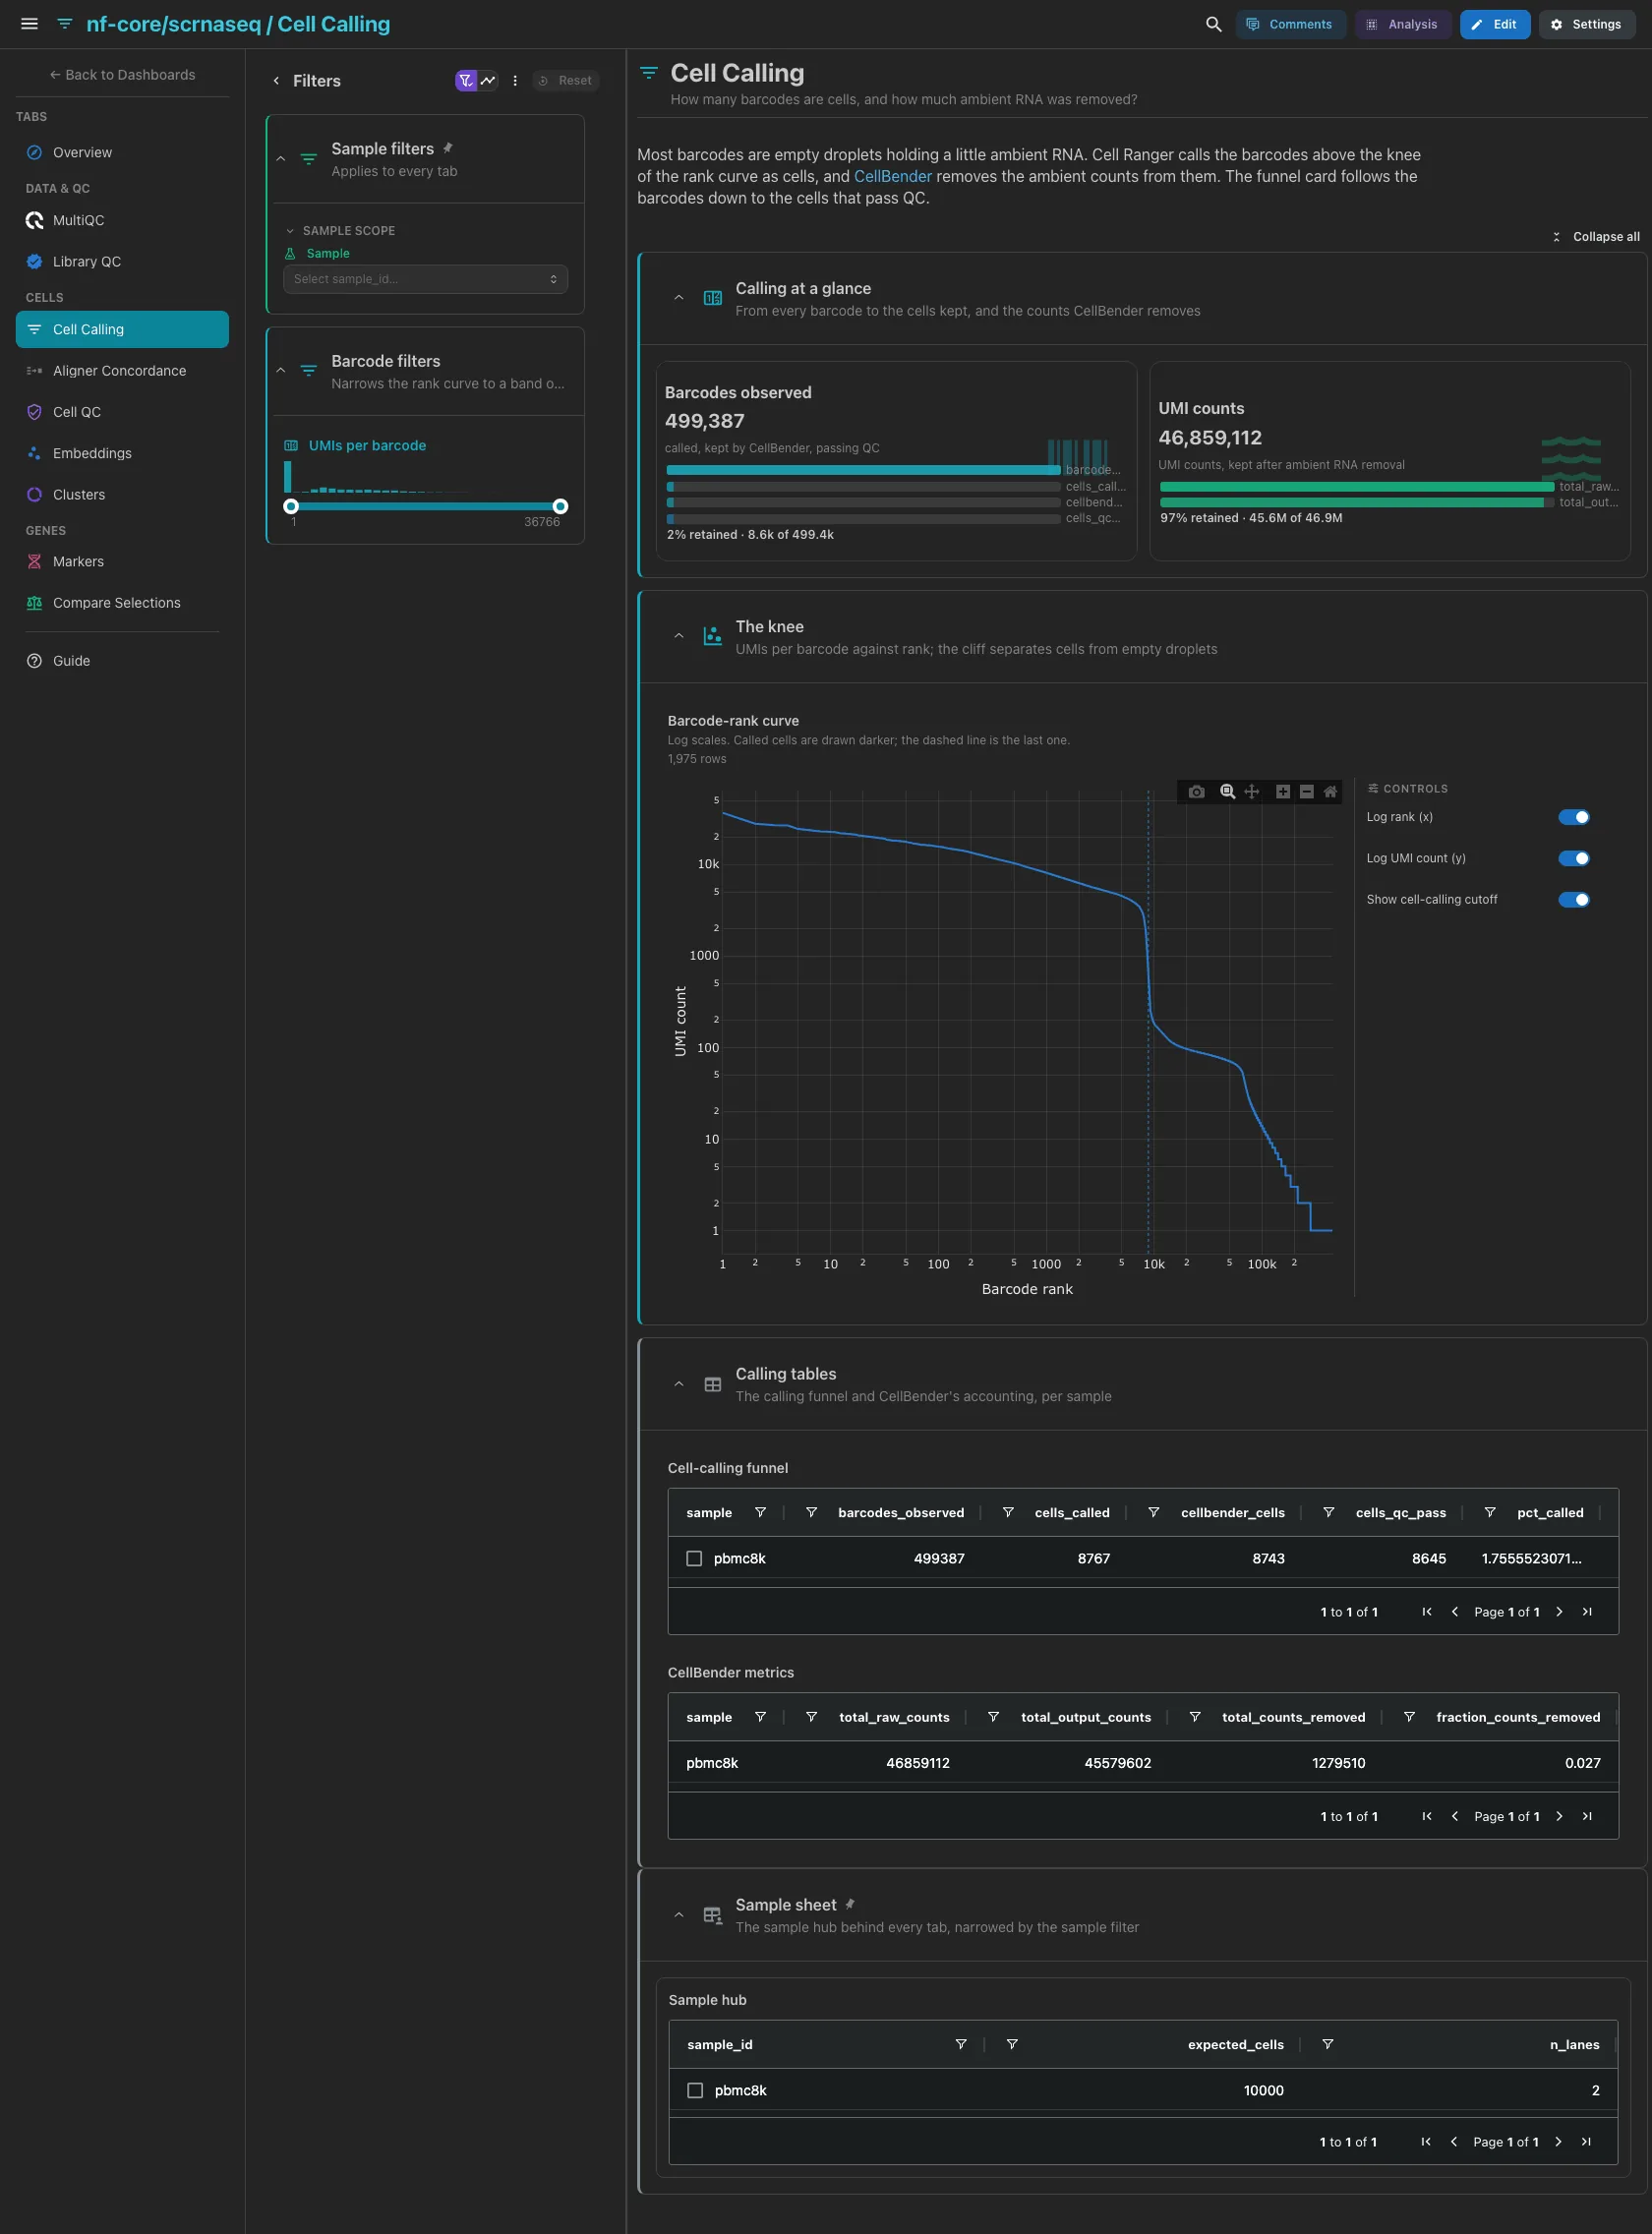
The barcodes observed, followed down to the cells Cell Ranger calls, the cells CellBender keeps and the cells that pass QC, each stage a subset of the one before; then the UMI counts CellBender keeps out of the raw counts. Then the barcode-rank ("knee") curve, computed off the raw matrix, one curve per sample with the called cells drawn darker. Most barcodes are empty droplets: the cliff is where the cells end. The calling funnel and CellBender's metrics are collapsed.
Filters and components
Filters · a UMIs per barcode range on cellranger_barcode_rank.
| Section | What it holds |
|---|---|
| Calling at a glance | 2 cards |
| The knee | 1 advanced visualization |
| Calling tables (collapsed) | Cell-calling funnel, CellBender metrics |
Without CellBender
A --skip_cellbender run has no CellBender card or table here, and the
funnel card widens. The funnel's CellBender stage and the CellBender shares
on Clusters read empty.
Cells · Do Cell Ranger, simpleaf and kallisto call the same cells?
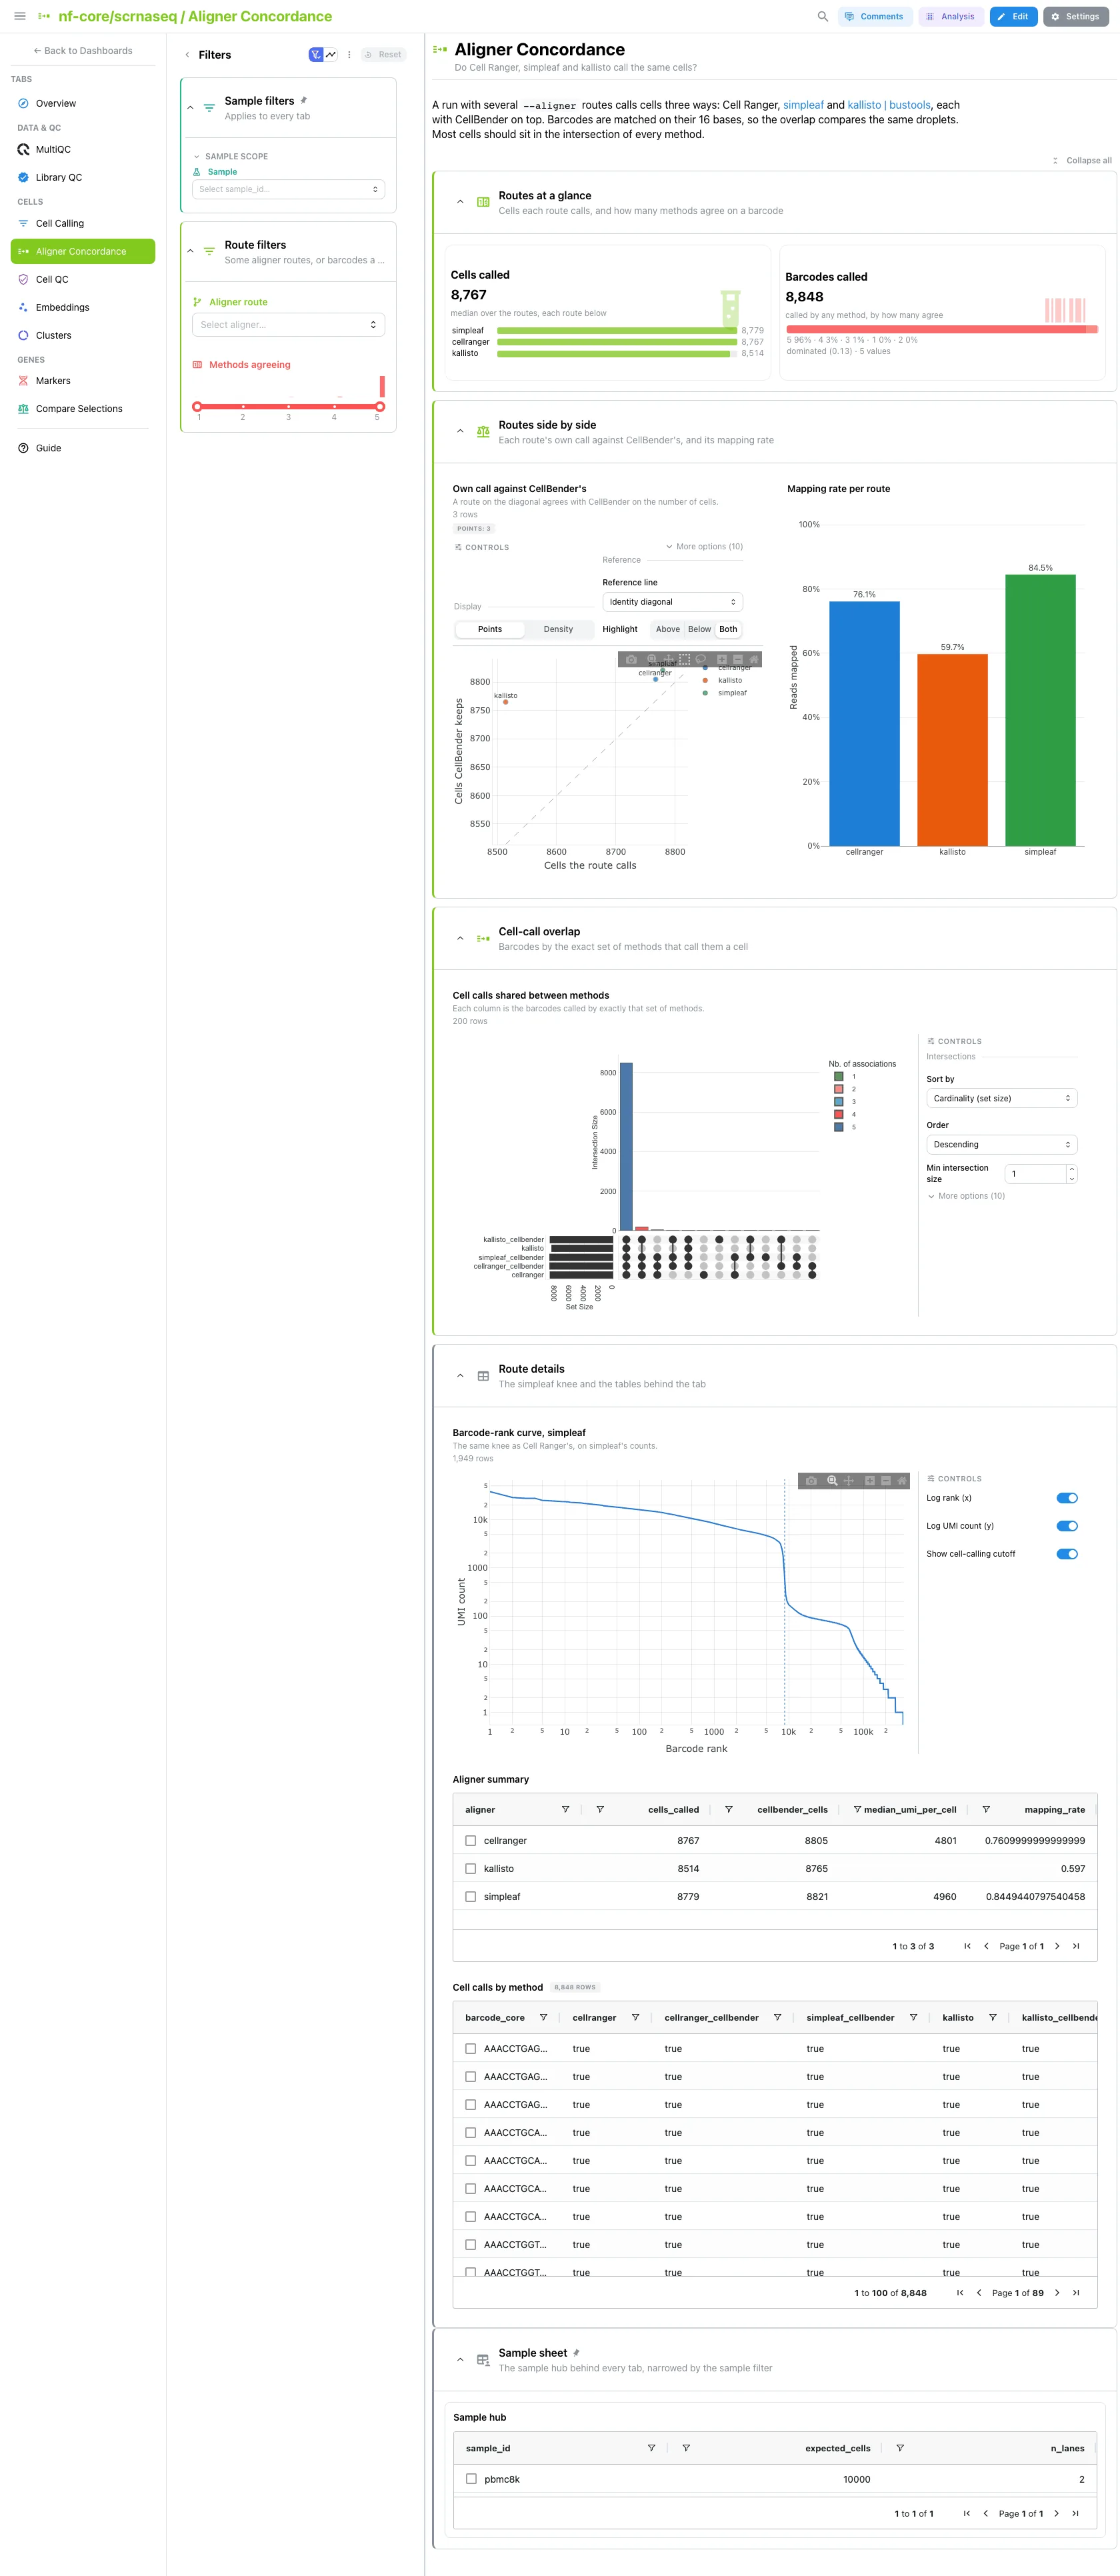
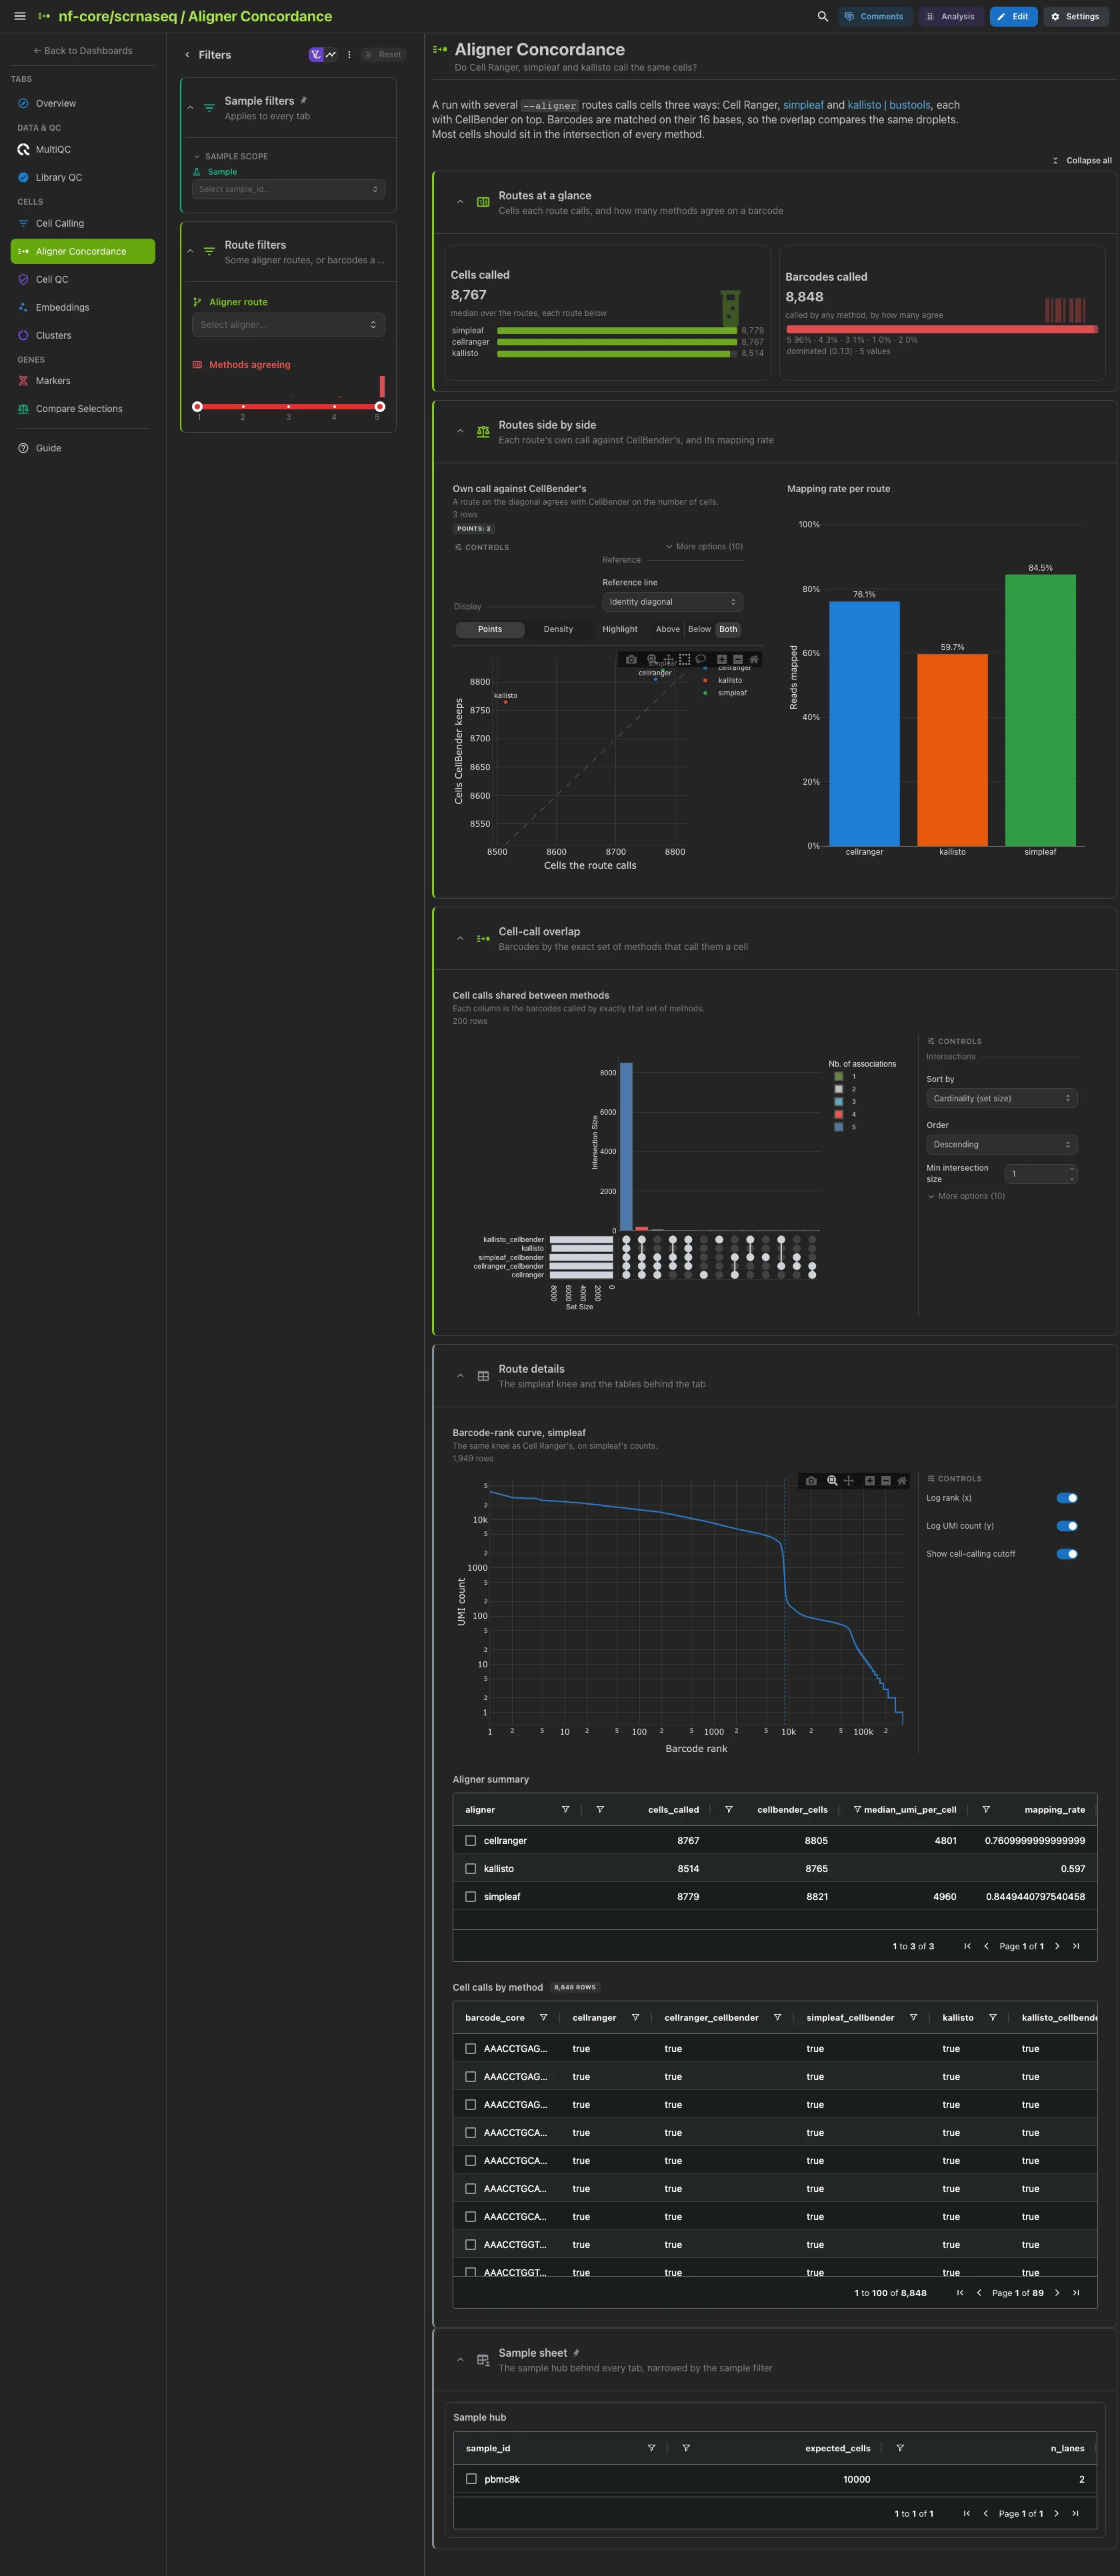
A run with several --aligner routes calls cells three ways, each with
CellBender on top. The cells each route calls, and the barcodes any method calls,
split by how many methods agree. Then each route's own call against CellBender's
on it (the diagonal is agreement) beside its mapping rate, and the UpSet of the
five cell calls, matched on the bare 16-base barcode so the overlap compares the
same droplets. Most cells should sit in the intersection of every method.
simpleaf's knee curve and both tables are collapsed.
Filters and components
Filters · Aligner route on aligner_summary and a Methods agreeing
range on cell_calls_by_method.
| Section | What it holds |
|---|---|
| Routes at a glance | 2 cards |
| Routes side by side | 1 advanced visualization + Mapping rate per route |
| Cell-call overlap | 1 advanced visualization |
| Route details (collapsed) | 1 advanced visualization (the simpleaf knee), Aligner summary, Cell calls by method |
Only with more than one route
Every collection this tab reads is optional. A Cell Ranger-only run, the pipeline default, has no Aligner Concordance tab.
Cells · Which called cells do the MAD rules flag, and why?
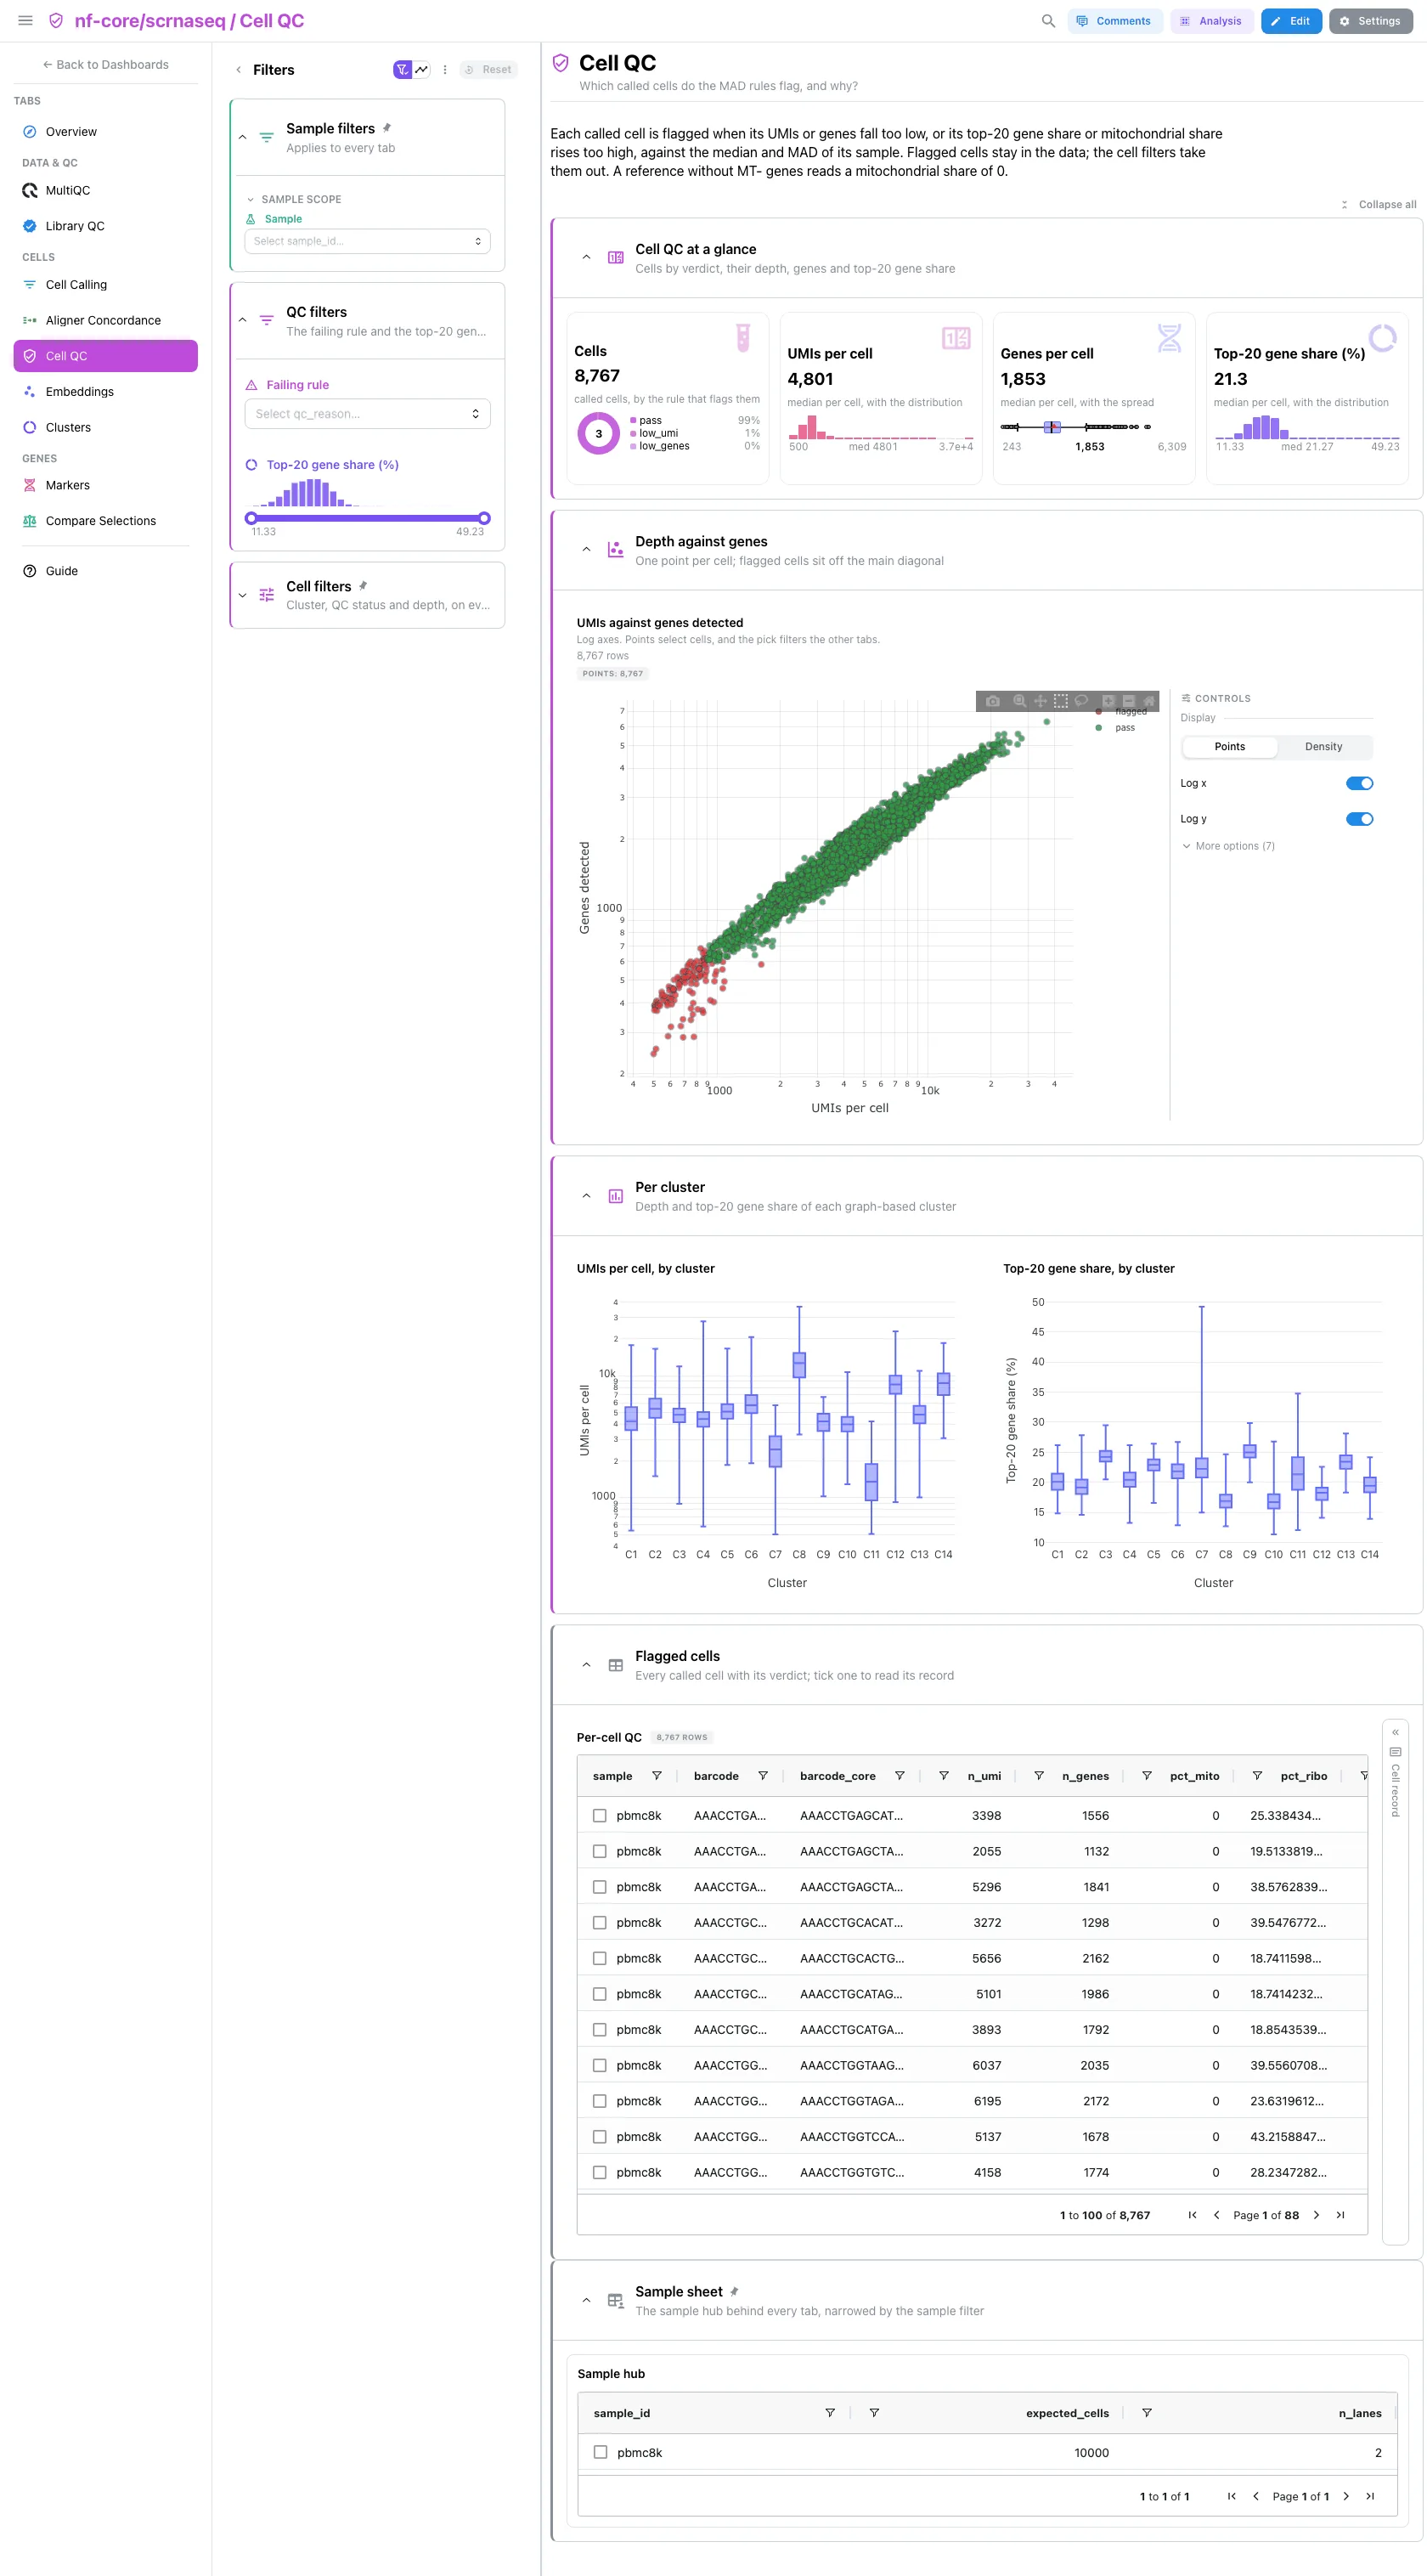
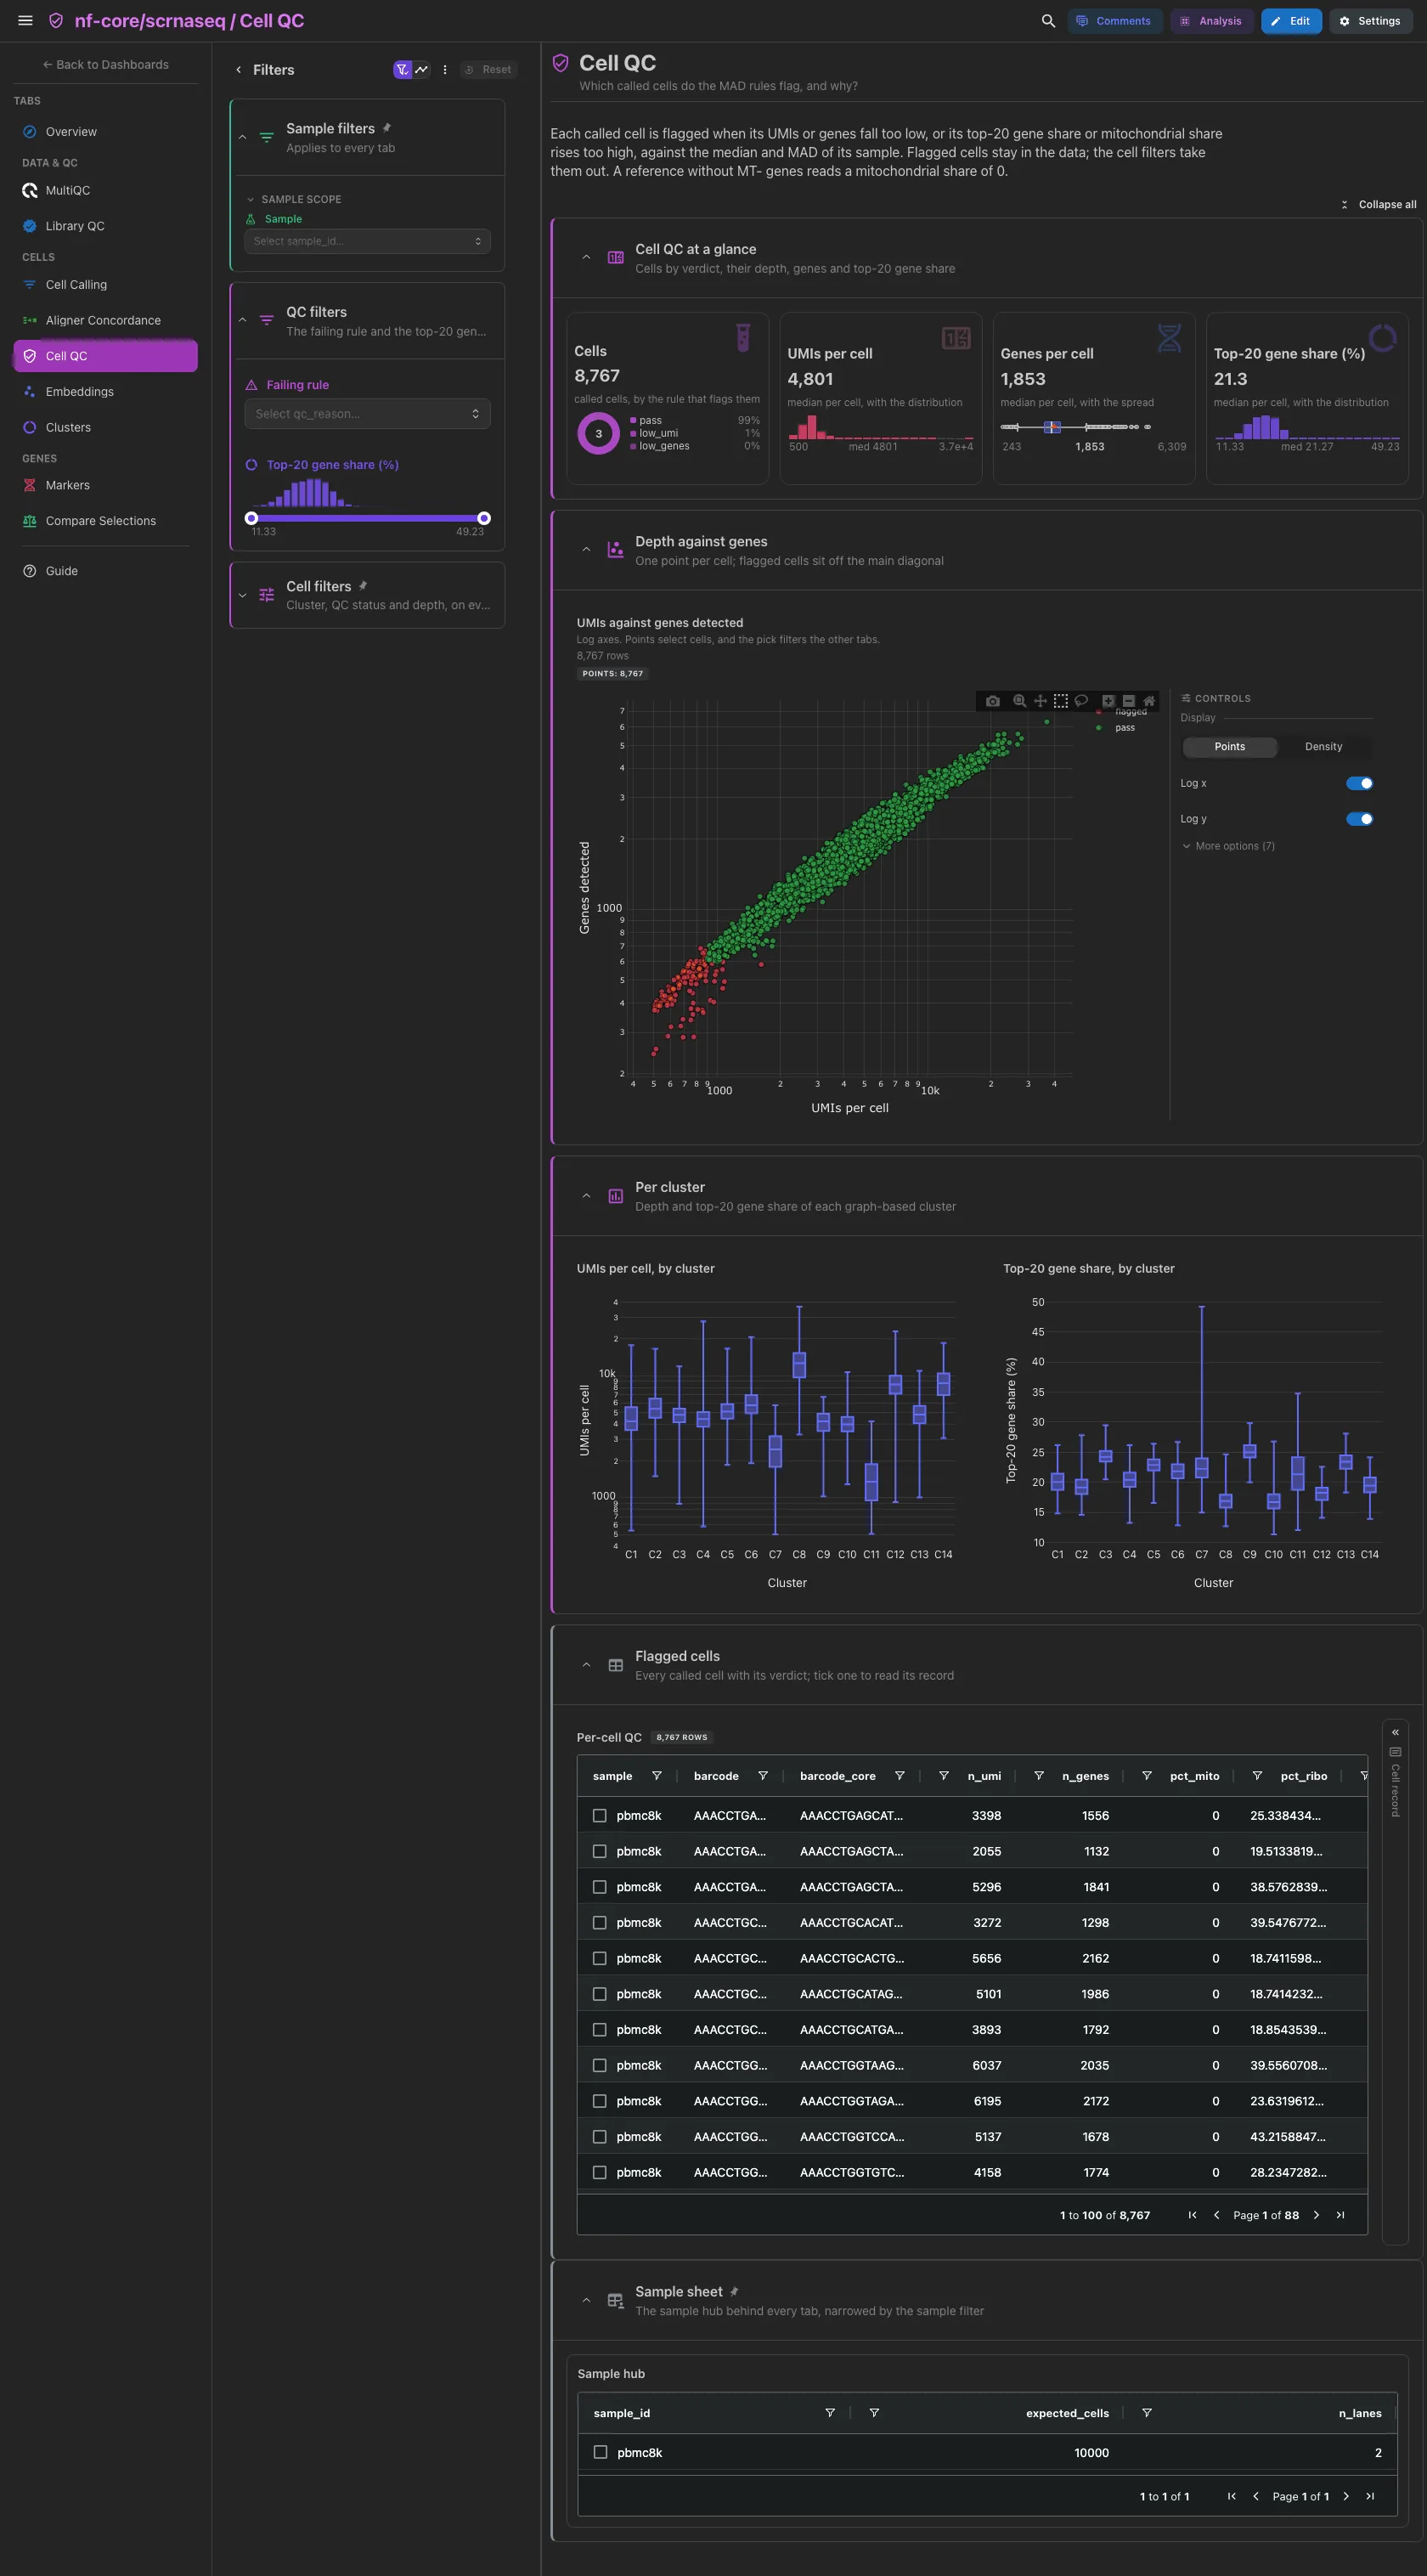
The called cells as a ring by the rule that flags them, the UMIs and the genes per cell, and the top-20 gene share. Then UMIs against genes per cell on log axes, coloured by QC status, and the UMIs and top-20 share per cluster as boxes. The rules run per sample on log1p values: 5 MAD below the median for UMIs and genes, 5 MAD above for the top-20 share, the median plus 3 MAD or 8% for the mitochondrial share. Flagged cells stay in the data; the cell filters take them out. The per-cell table is collapsed, with a cell record beside it.
Filters and components
Filters · Failing rule and a Top-20 gene share (%) range on
cellranger_cell_qc, plus the cell filters.
| Section | What it holds |
|---|---|
| Cell QC at a glance | 4 cards |
| Depth against genes | 1 advanced visualization |
| Per cluster | UMIs per cell, by cluster, Top-20 gene share, by cluster |
| Flagged cells (collapsed) | Per-cell QC + a cell record card |
Cells · Do the cells separate into groups on the UMAP and t-SNE?
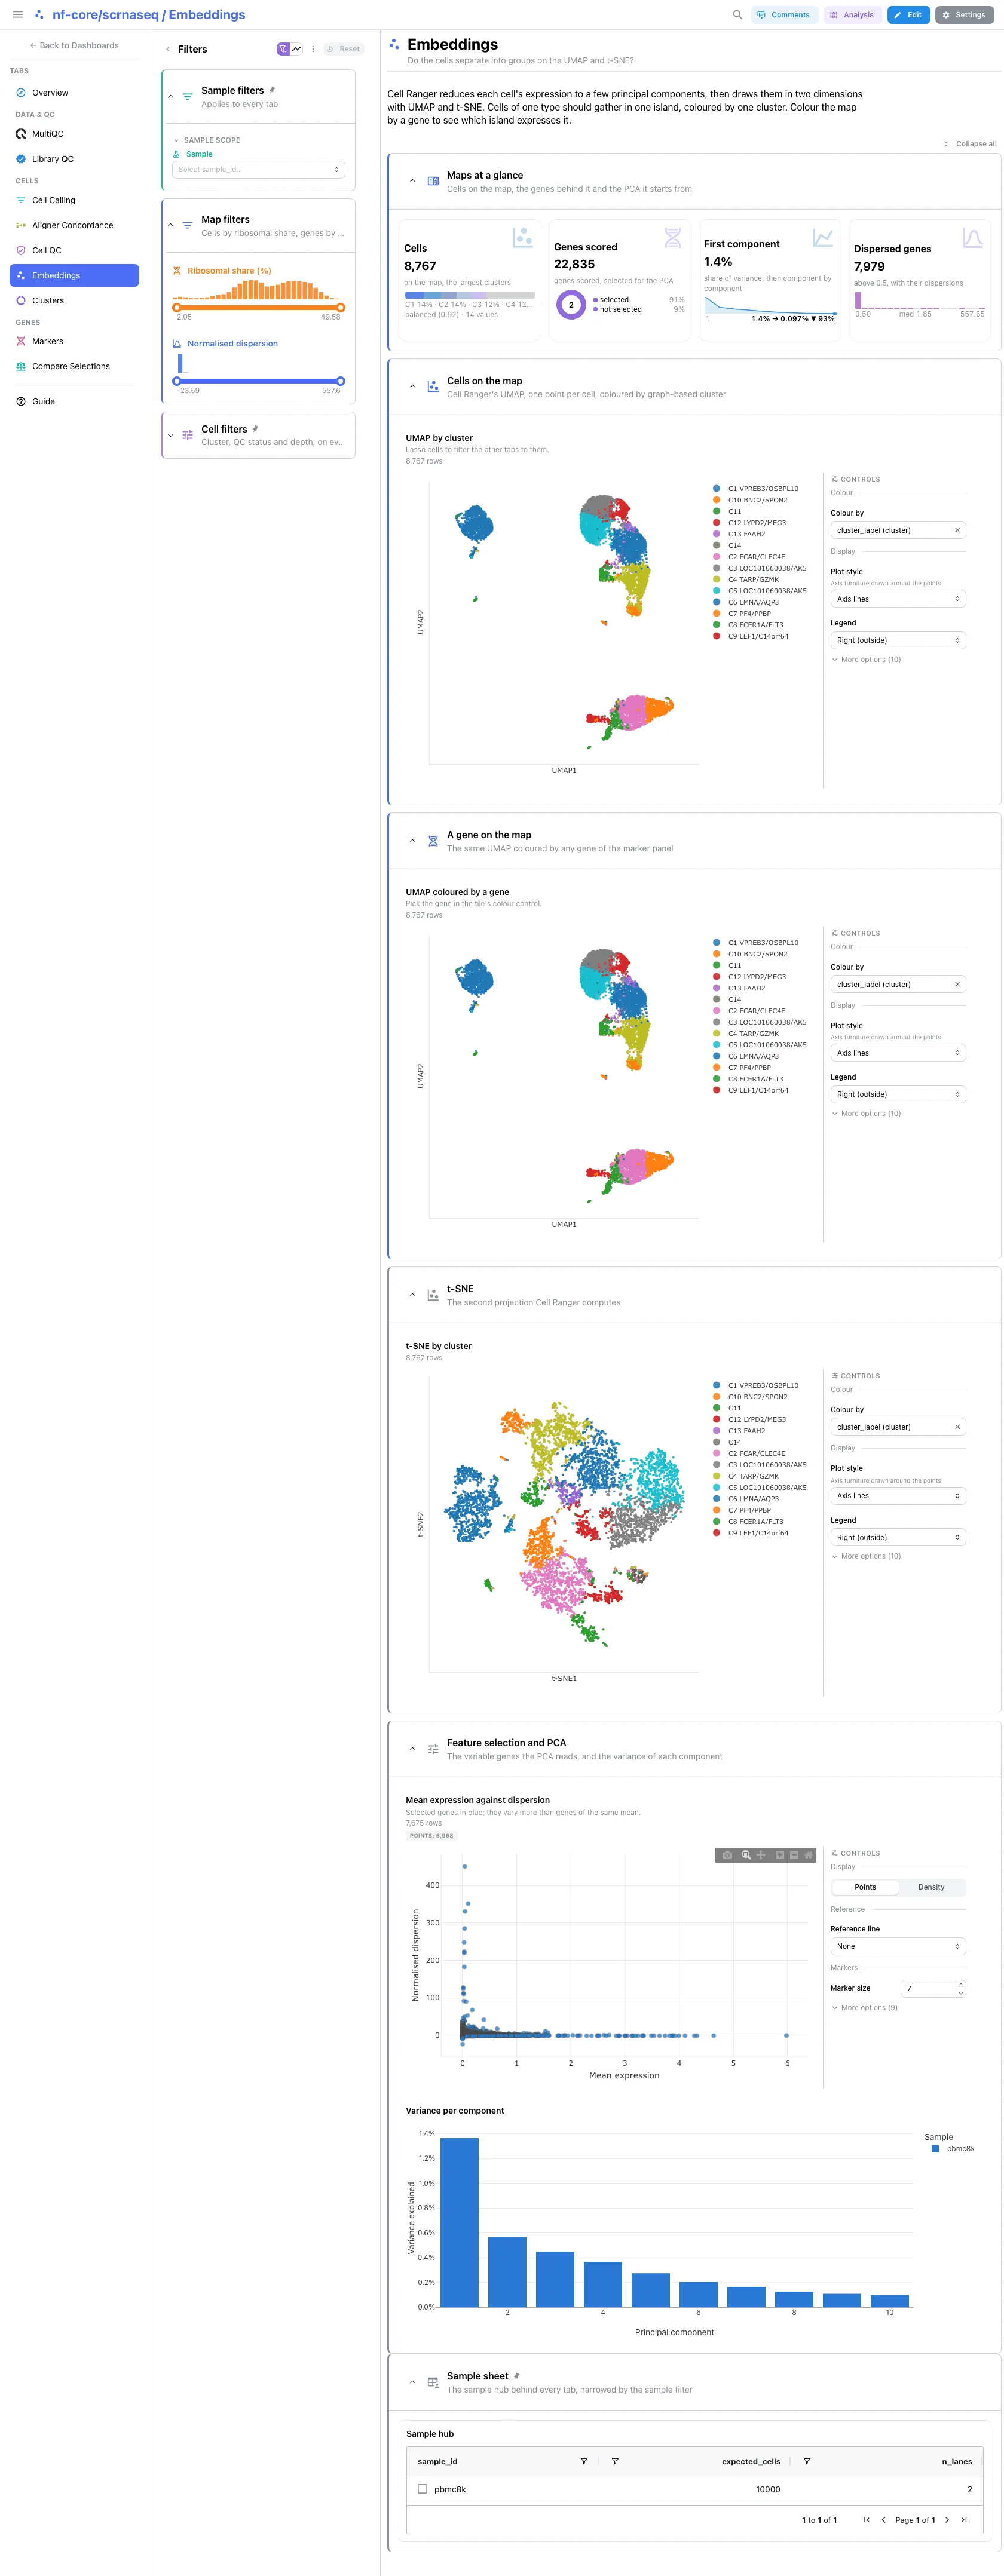
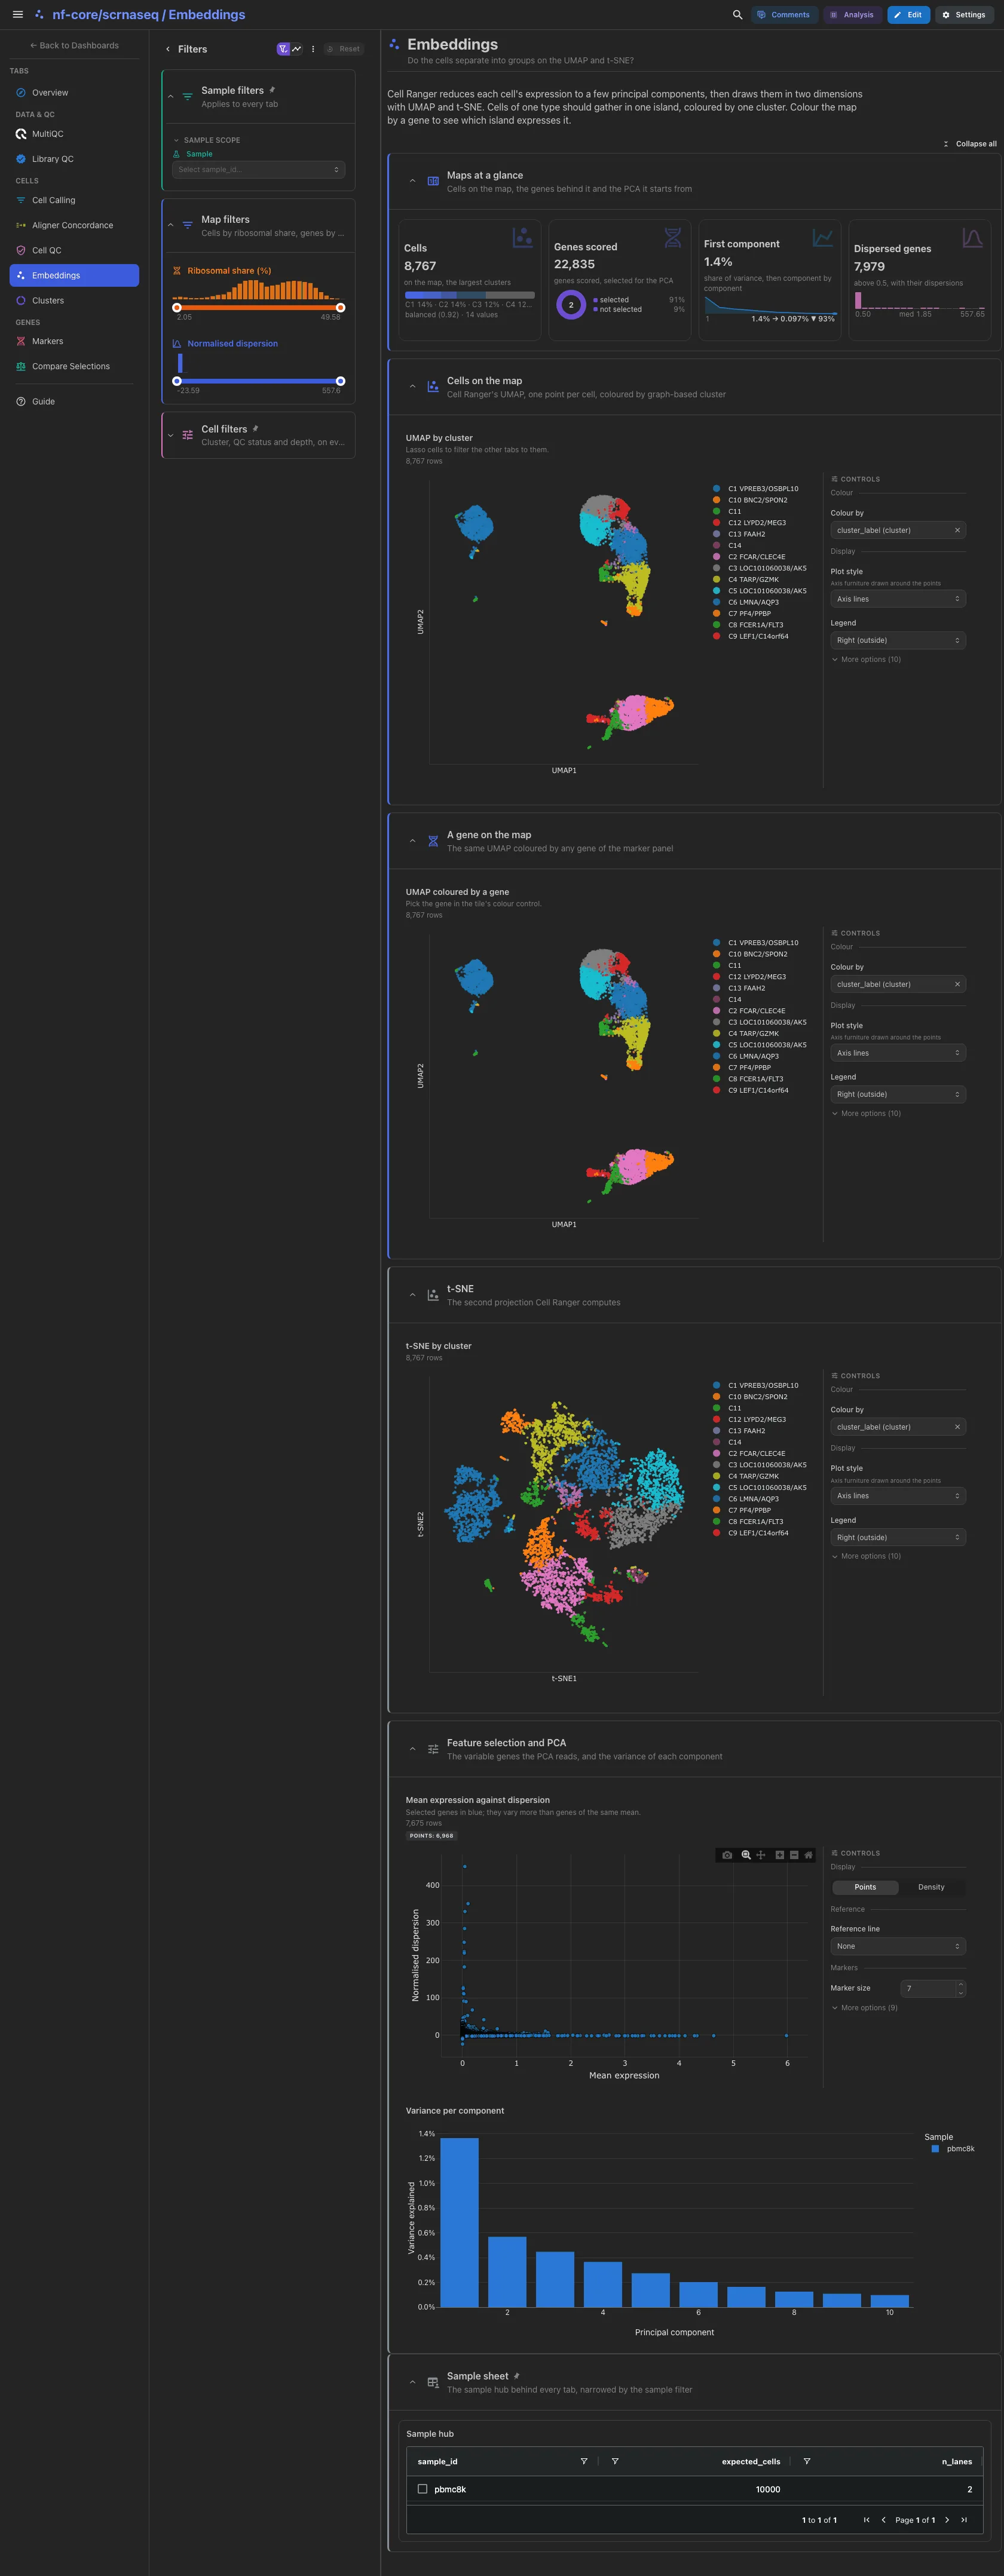
The cells on the map, the genes scored for dispersion as a ring of those the PCA used, the first component's share of the variance and the genes whose normalised dispersion passes 0.5. Then the UMAP by cluster, where a lasso filters the other tabs, and the same UMAP bound to the per-cell expression table: every panel gene is a column of its colour menu. The t-SNE, mean expression against dispersion and the variance per component are collapsed. Cell Ranger selects every gene with a finite dispersion, so the selection is not a variable-gene call.
Filters and components
Filters · a Ribosomal share (%) range on cellranger_cell_qc and a
Normalised dispersion range on cellranger_hvg_dispersion, plus the cell
filters.
| Section | What it holds |
|---|---|
| Maps at a glance | 4 cards |
| Cells on the map | 1 advanced visualization |
| A gene on the map | 1 advanced visualization |
| t-SNE (collapsed) | 1 advanced visualization |
| Feature selection and PCA (collapsed) | 1 advanced visualization + Variance per component |
Cells · Which clusters are large and clean, and which are cycling?
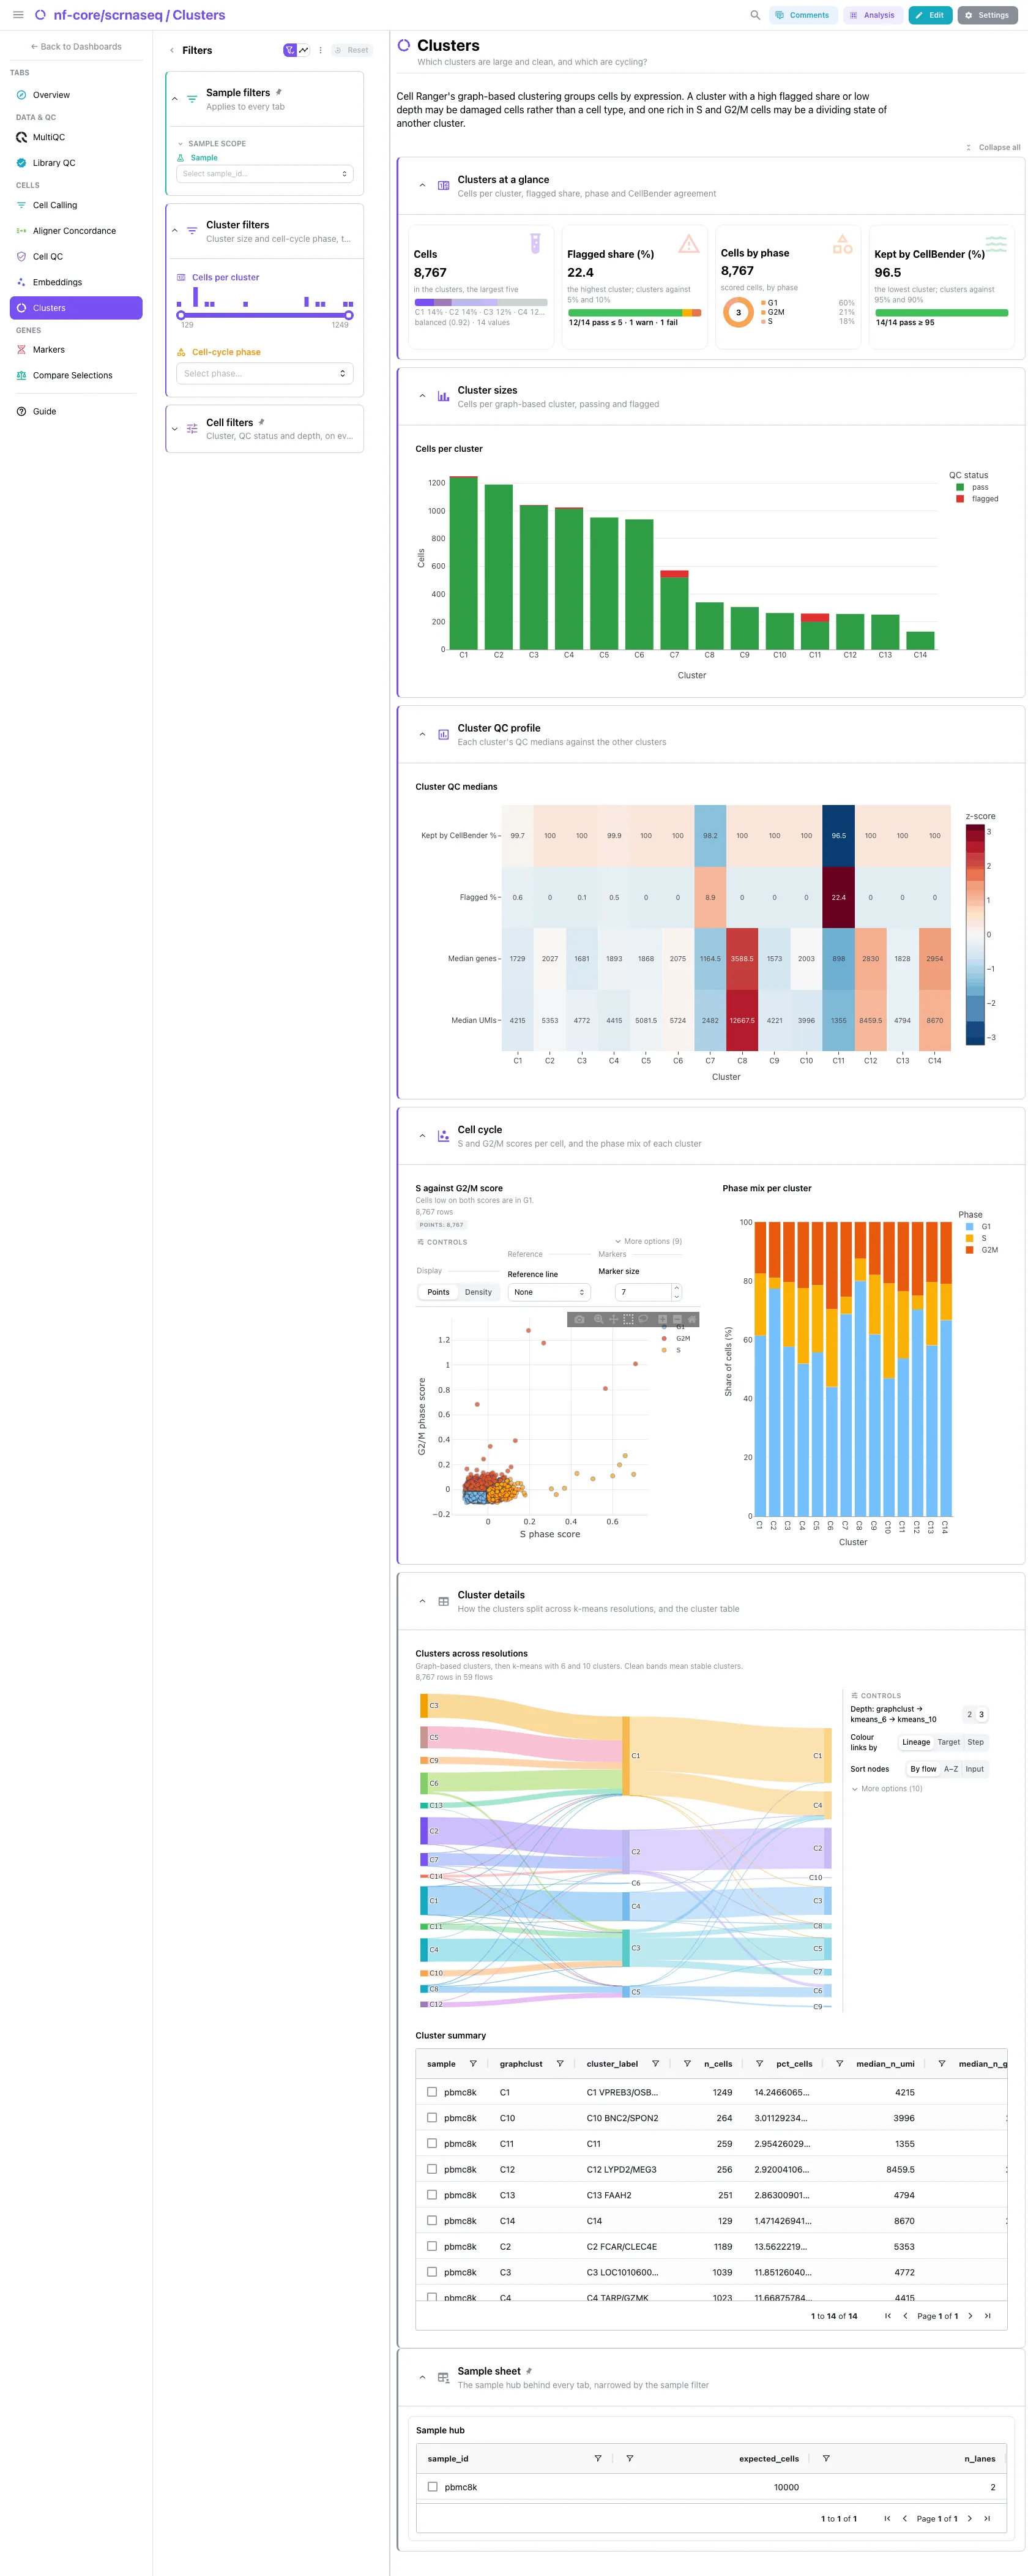
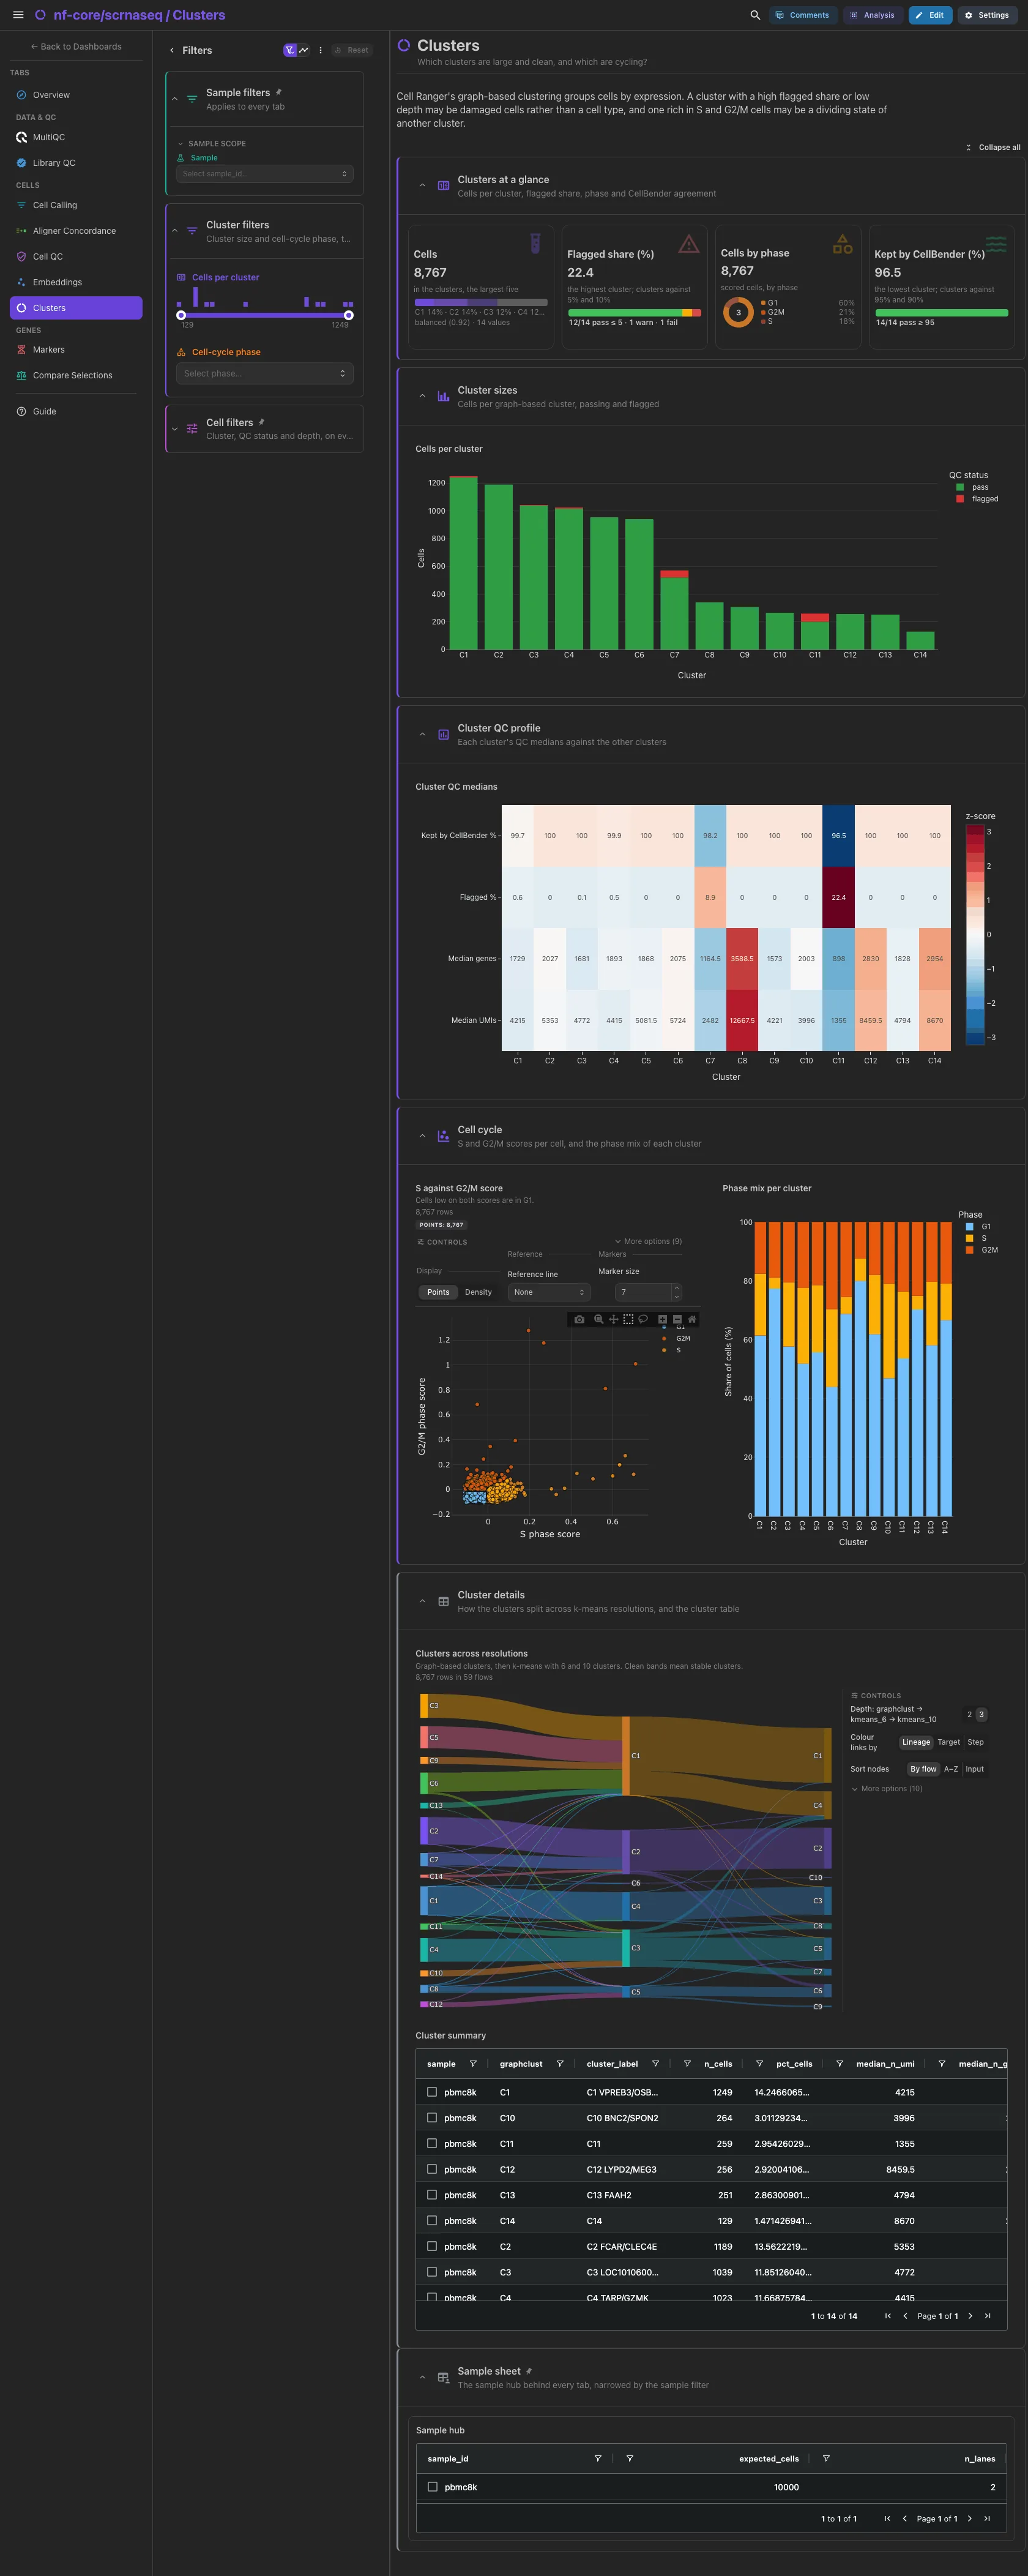
The cells in the clusters, the flagged share of the highest cluster against 5% and 10%, the cells by cell-cycle phase and the share of the lowest cluster's cells CellBender also calls, against 95% and 90%. Then the cells per cluster with the flagged ones on top, the QC medians of each cluster coloured by z-score, and S against G2/M score per cell beside the phase mix of each cluster. A cluster with a high flagged share or low depth may be damaged cells, not a cell type. The stability Sankey across resolutions and the cluster table are collapsed.
Filters and components
Filters · a Cells per cluster range on cellranger_cluster_summary
and Cell-cycle phase on cellranger_cell_cycle, plus the cell filters.
| Section | What it holds |
|---|---|
| Clusters at a glance | 4 cards |
| Cluster sizes | Cells per cluster |
| Cluster QC profile | Cluster QC medians |
| Cell cycle | 1 advanced visualization + Phase mix per cluster |
| Cluster details (collapsed) | 1 advanced visualization + Cluster summary |
Genes · Which genes mark each cluster?
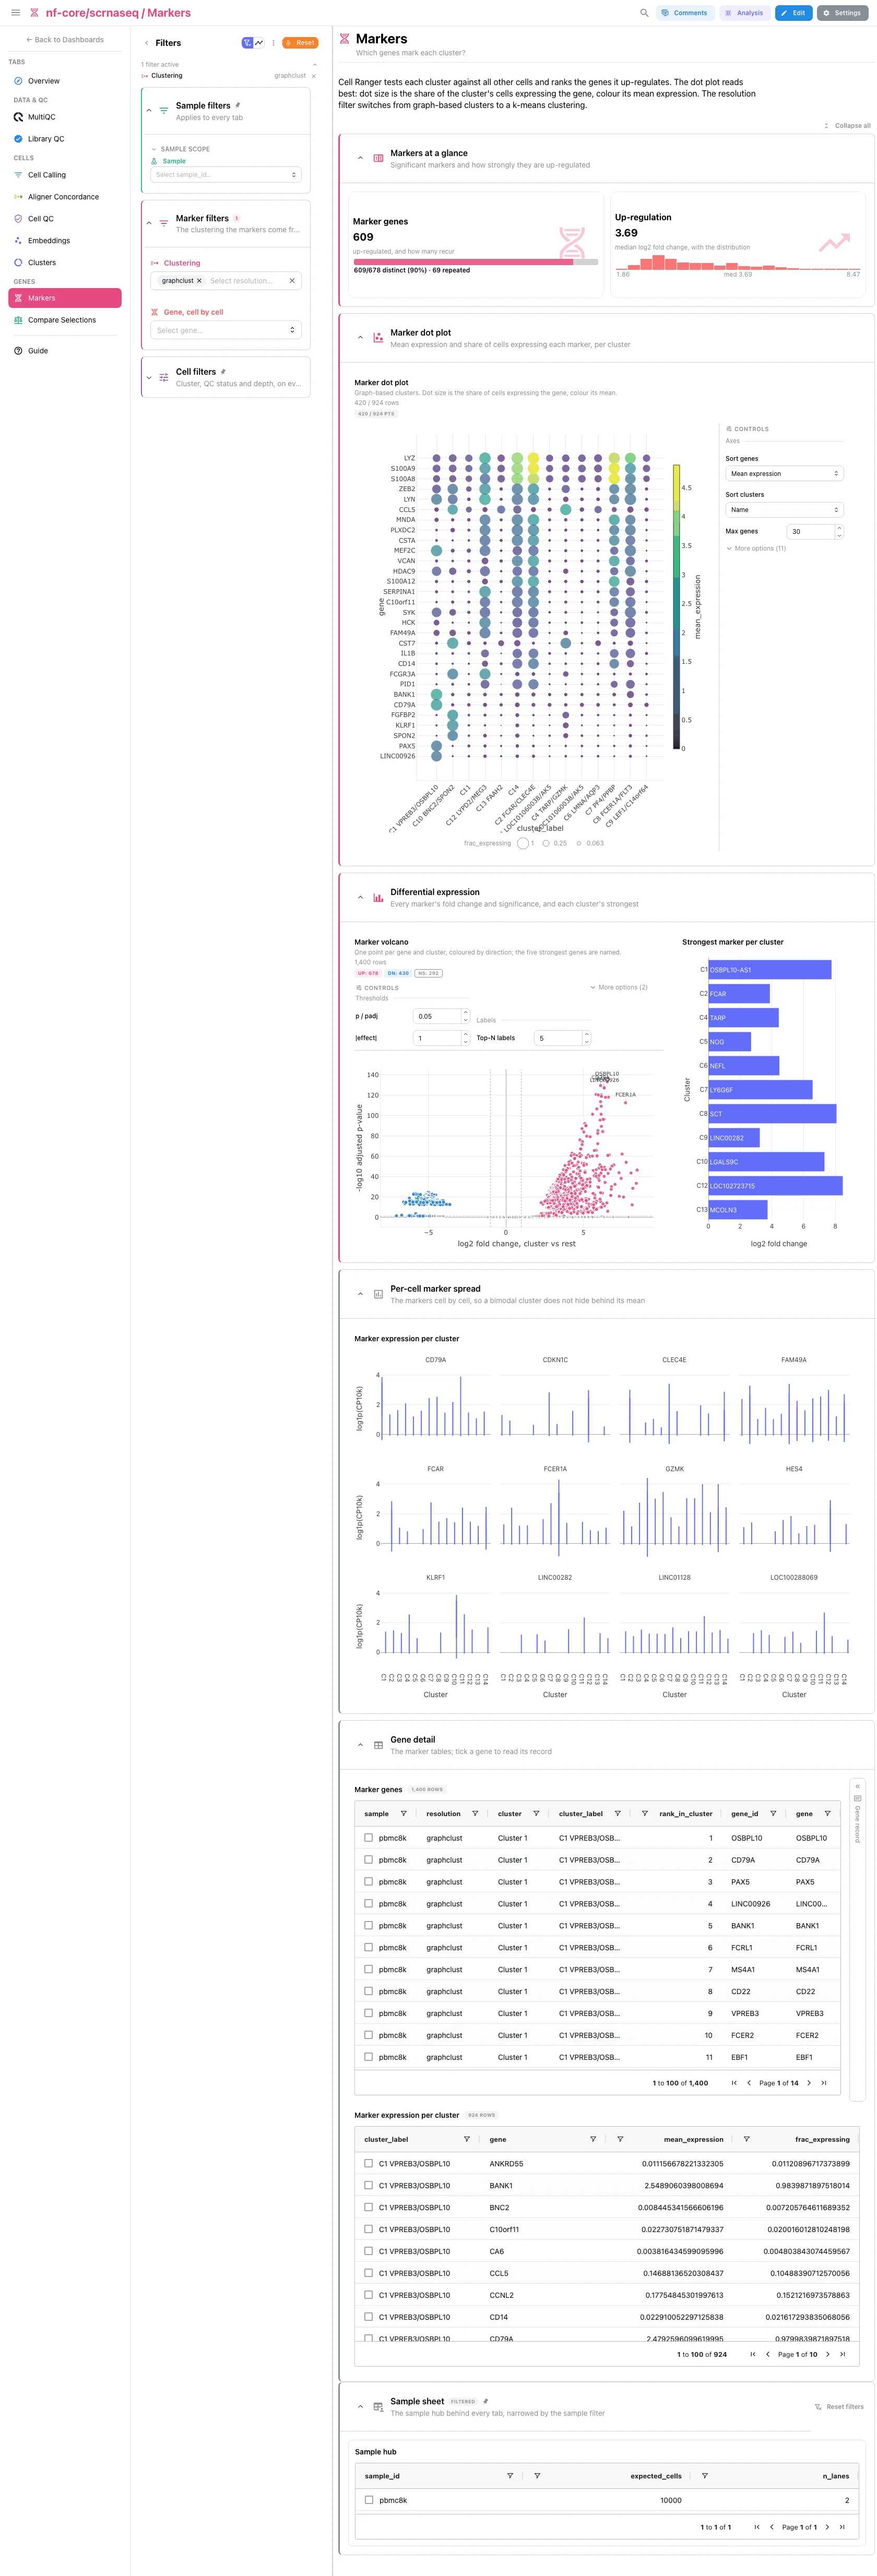
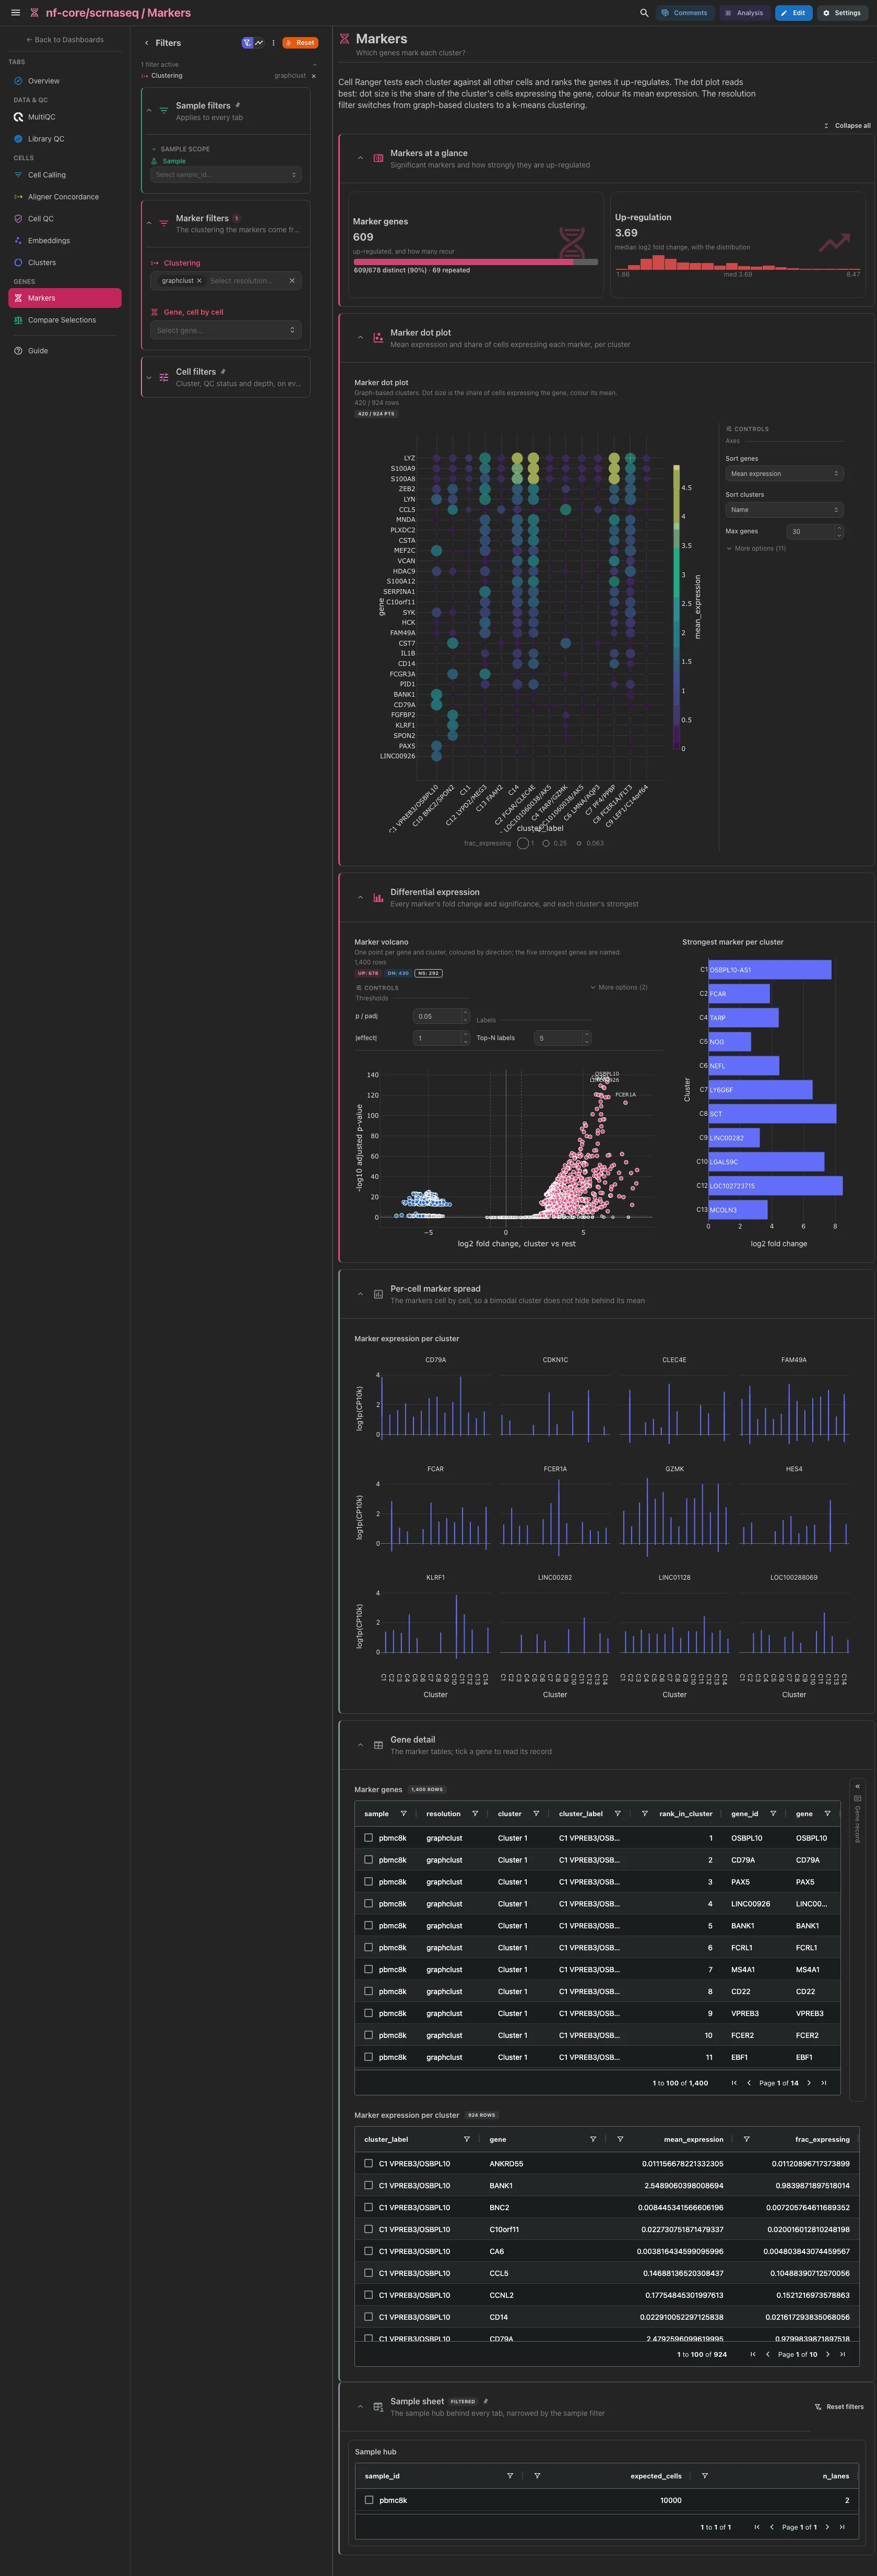
The marker genes up-regulated at adjusted p below 0.05, with how many recur across clusters, and their median log2 fold change. Then the dot plot (dot size the share of the cluster's cells expressing the gene, colour its mean), and the volcano beside the strongest marker of each cluster. The volcano has no QQ view: these are Cell Ranger's top-ranked markers per cluster, not a genome-wide test. The violins cell by cell, the marker table with a gene record beside it and the marker expression table are collapsed.
Filters and components
Filters · Clustering on cellranger_diffexp (opens on graphclust)
and Gene, cell by cell on cellranger_cell_expression_long, plus the cell
filters.
| Section | What it holds |
|---|---|
| Markers at a glance | 2 cards |
| Marker dot plot | 1 advanced visualization |
| Differential expression | 1 advanced visualization + Strongest marker per cluster |
| Per-cell marker spread (collapsed) | Marker expression per cluster |
| Gene detail (collapsed) | Marker genes + a gene record card, Marker expression per cluster |
Genes · Which genes separate two groups of cells you lasso?
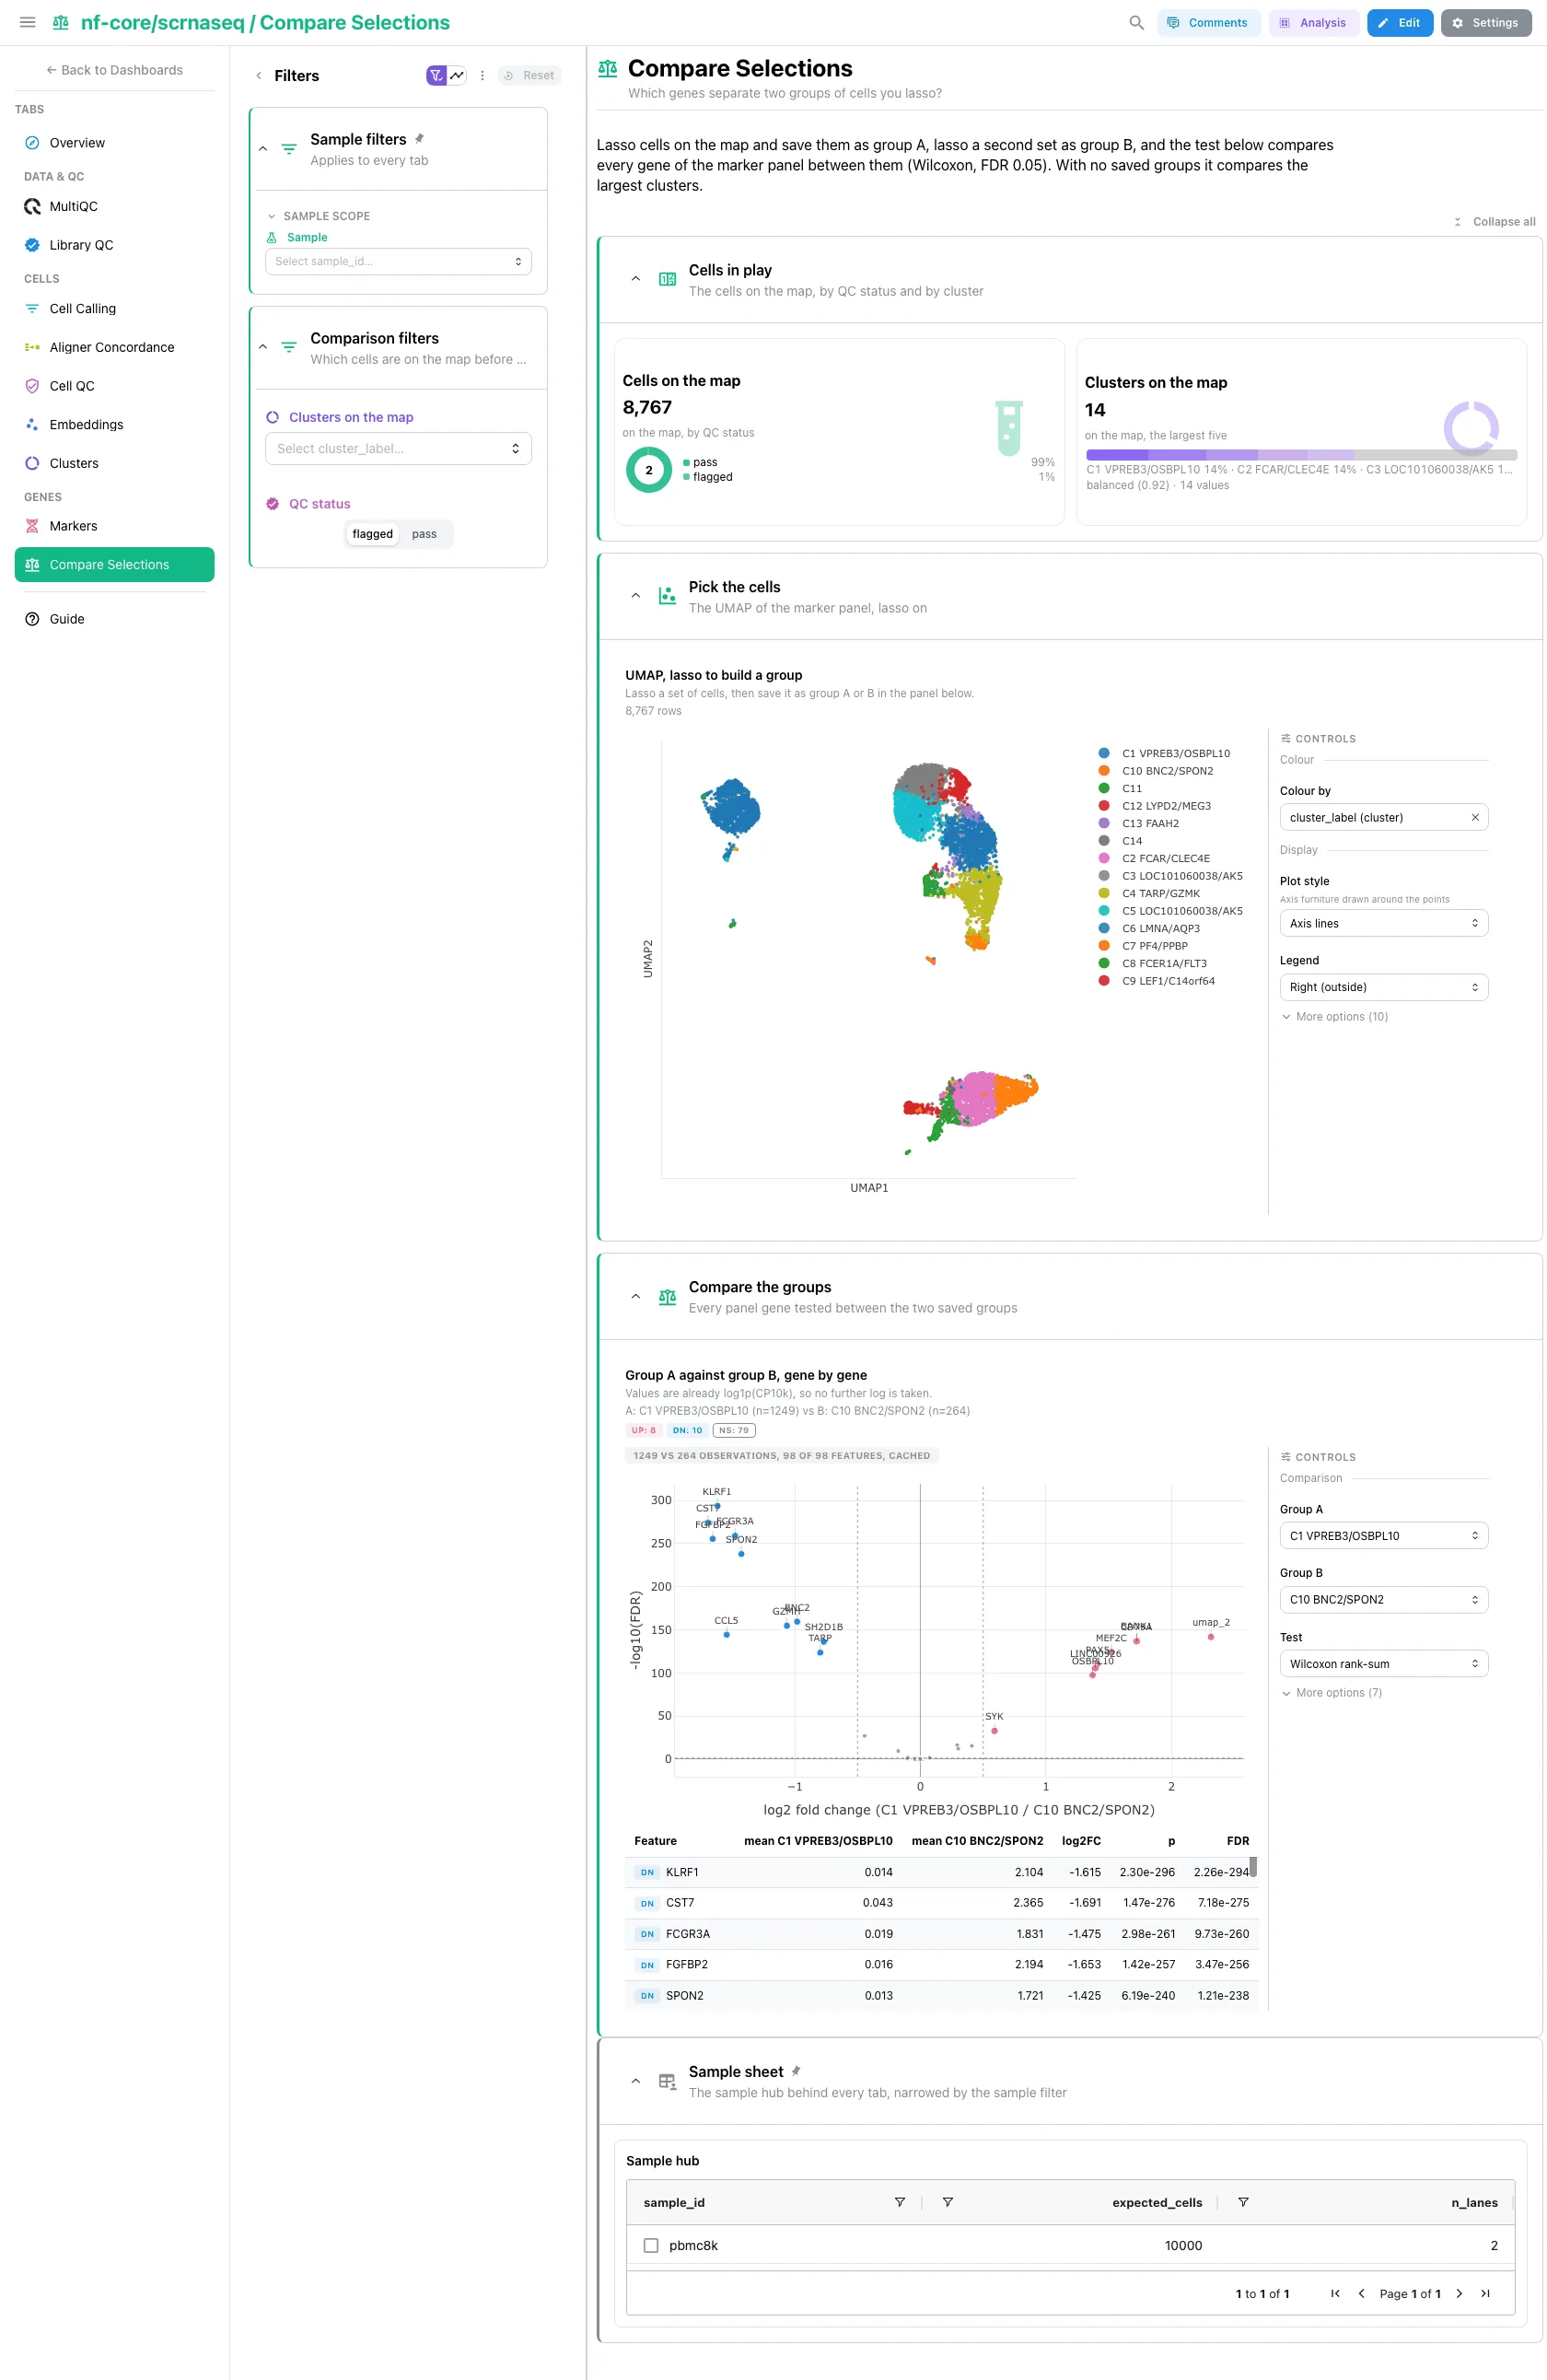
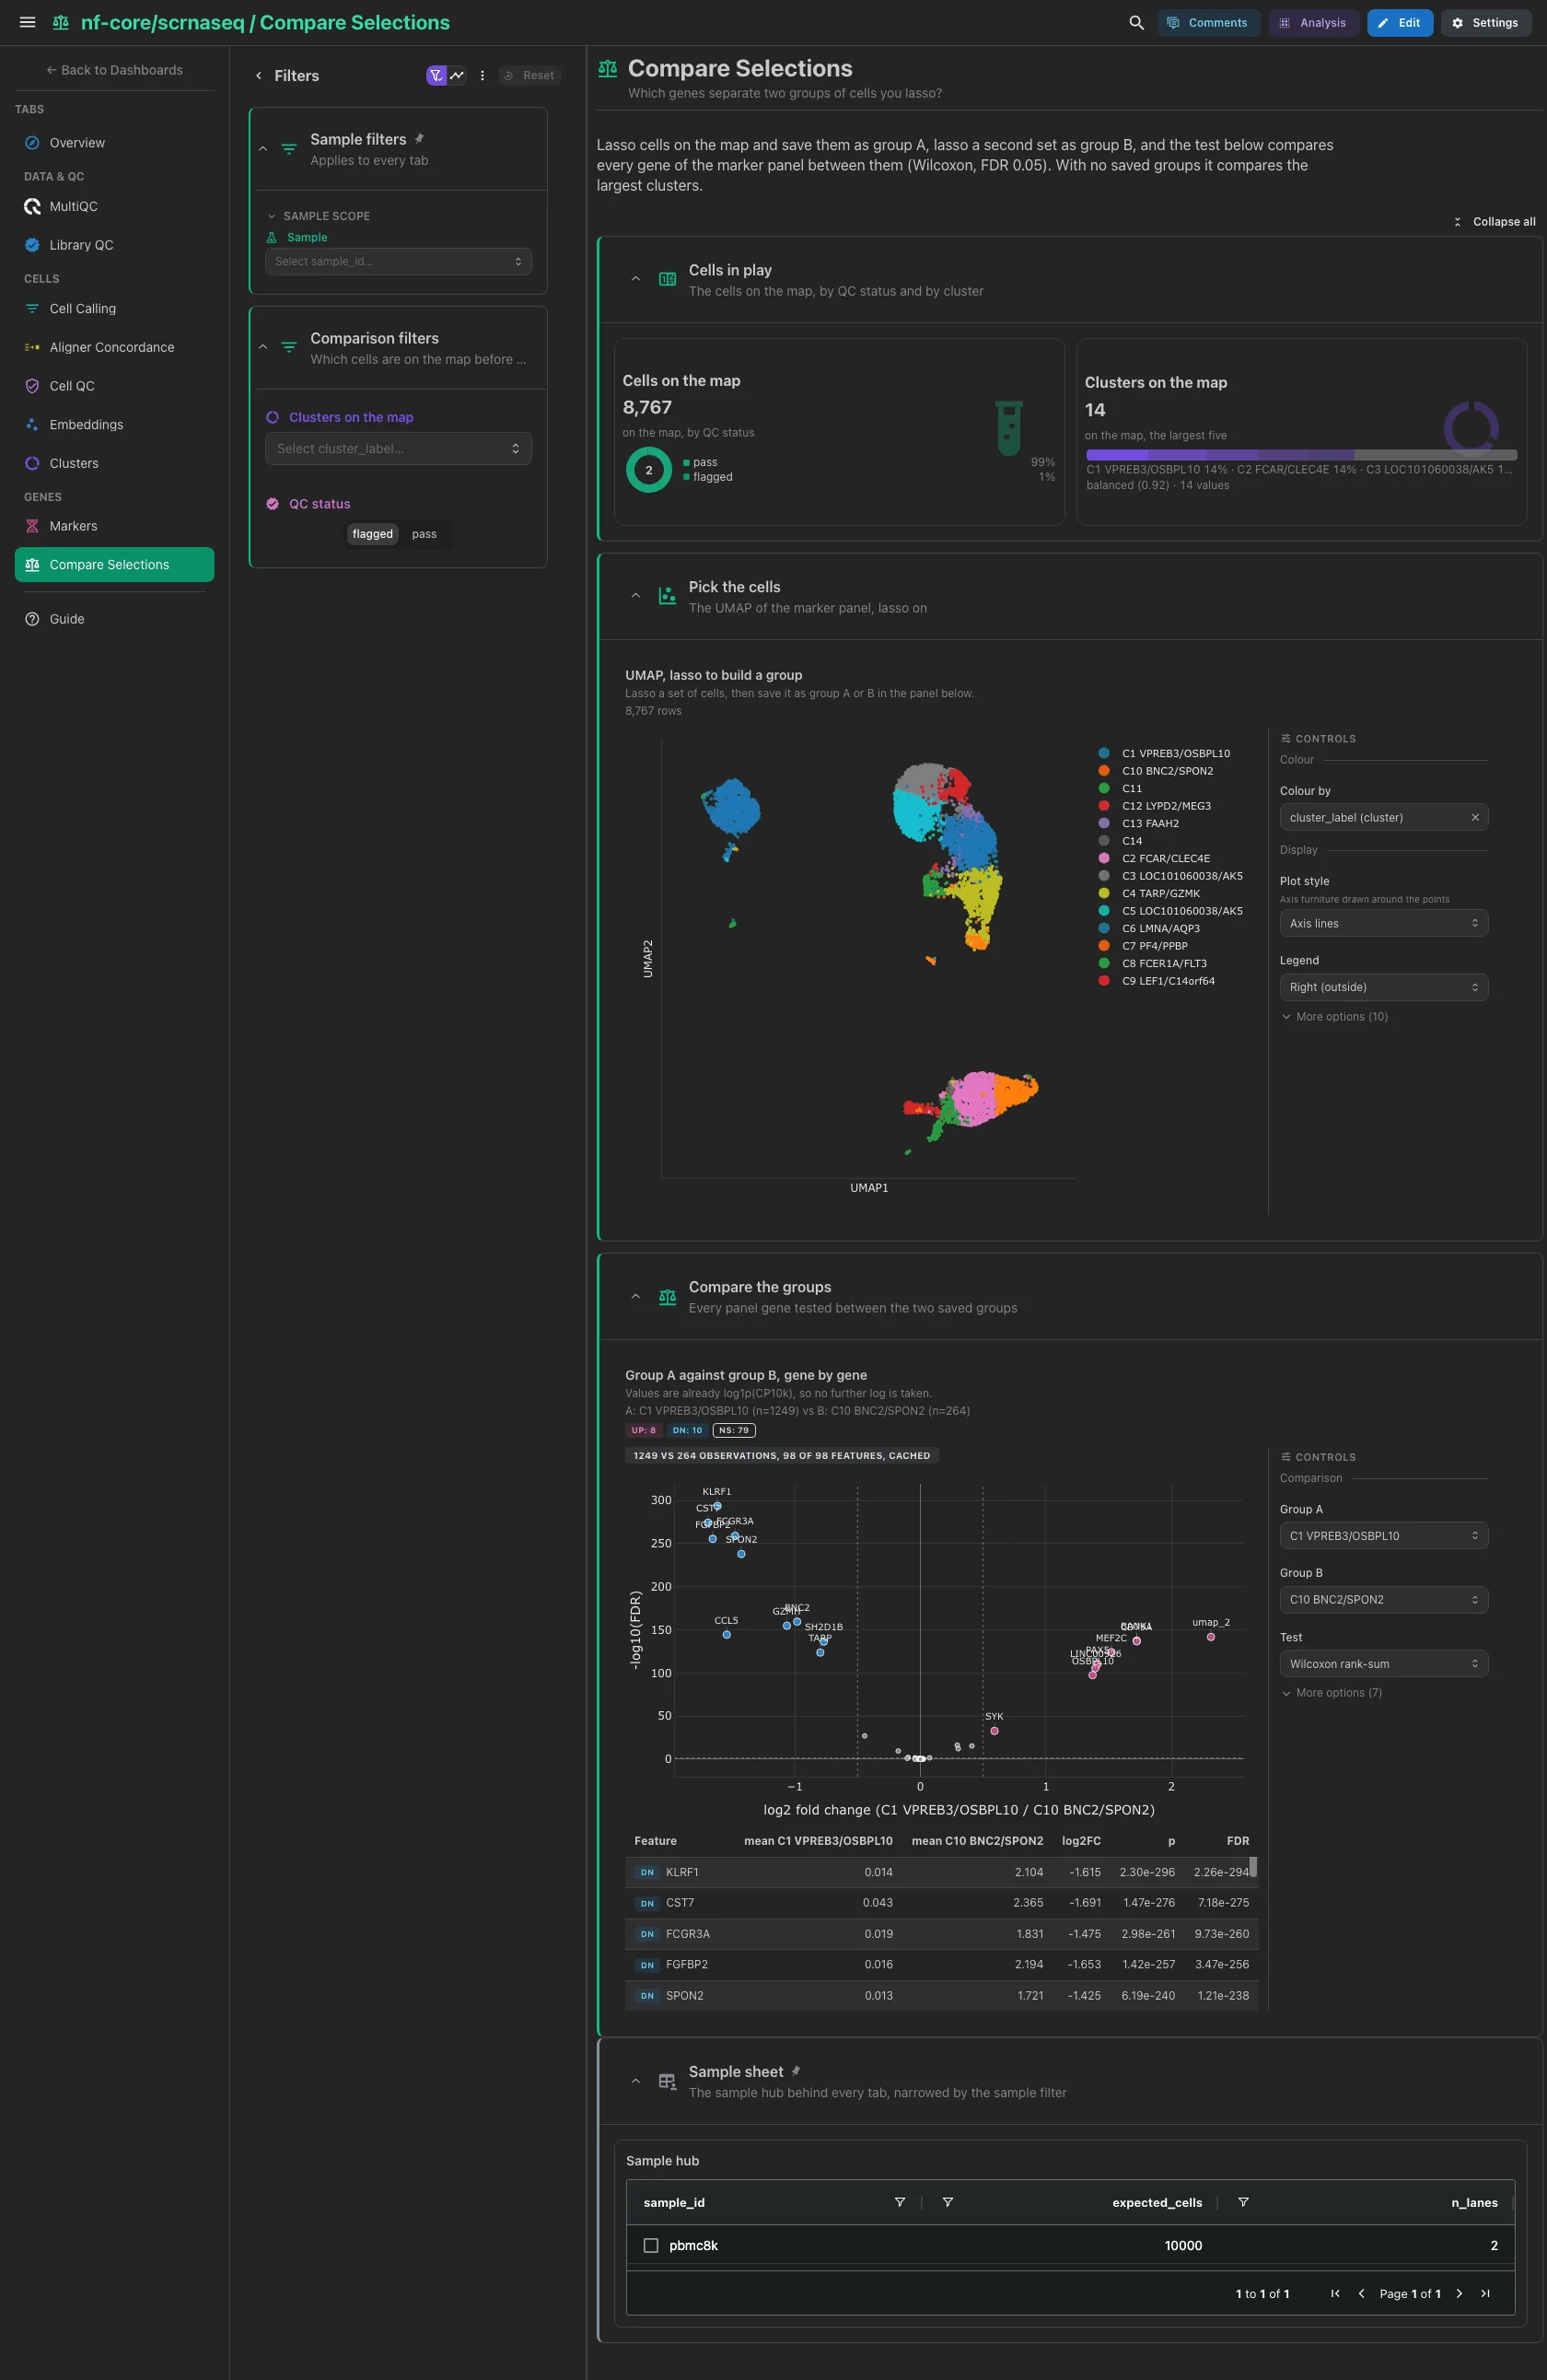
The cells on the map as a ring by QC status, and the clusters on it. Then the
UMAP with lasso on: save one set of cells as group A and a second as group B,
and every gene of the marker panel is tested between them (Wilcoxon rank-sum on
log1p(CP10k), FDR-corrected across genes). With no groups saved it compares the
two largest clusters. Narrow to pass cells first: two groups of very different
depth differ on almost every gene for the wrong reason.
Filters and components
Filters · Clusters on the map and a QC status switch on
cellranger_cell_expression.
| Section | What it holds |
|---|---|
| Cells in play | 2 cards |
| Pick the cells | 1 advanced visualization |
| Compare the groups | 1 advanced visualization |
Every scatter and embedding of cells selects on barcode (the UMI against genes
scatter, the UMAP and t-SNE, the phase scatter, the lasso UMAP; the UMAP coloured
by a gene does not), the route scatter on aligner, and the tables on their entity
column: sample_id in the sample sheet, sample in the metrics and funnel tables,
barcode for cells, cluster_label for clusters, gene for markers, aligner
for routes and barcode_core for the cell-call overlap. A pick narrows the other
tiles on the same collection or linked to it, and each record card follows the
table beside it.
Running the pipeline
Depictio reads the output of nf-core/scrnaseq, it does not run the pipeline. Run the pipeline first, on the Cell Ranger route:
nextflow run nf-core/scrnaseq -r 4.2.0 \
  --input samplesheet.csv \
  --fasta genome.fa --gtf genes.gtf \
  --aligner cellranger --protocol 10XV3 \
  --outdir results -profile docker
Then copy the samplesheet next to the results and point Depictio at them:
mkdir -p results/input && cp samplesheet.csv results/input/
depictio ingest results/ --template nf-core/scrnaseq/latest
To fill the Aligner Concordance tab, run the pipeline once more per extra
--aligner route and gather the route directories under one results root. See
nf-co.re/scrnaseq/usage for full
pipeline documentation.
Required data structure
Point depictio ingest at the results root. Every scan is anchored on the tool
directory name (cellranger/, simpleaf/, kallisto/), so a single-route
output directory and a root holding several routes scan the same way.
<DATA_ROOT>/
├── input/samplesheet.csv                      # the hub: copy it in, anywhere under the root
├── [aligner_cellranger/]
│   ├── pipeline_info/{params,software_versions}*
│   ├── multiqc/multiqc_data/multiqc.parquet   # native, no reprocess
│   └── cellranger/
│       ├── count/<sample>/outs/
│       │   ├── metrics_summary.csv
│       │   ├── raw_feature_bc_matrix/{matrix.mtx.gz,barcodes.tsv.gz,features.tsv.gz}
│       │   ├── filtered_feature_bc_matrix/{matrix.mtx.gz,barcodes.tsv.gz,features.tsv.gz}
│       │   └── analysis/{clustering,umap,tsne,pca,diffexp}/*/*.csv
│       └── <sample>/cellbender_removebackground/*_{metrics,cell_barcodes}.csv   # optional
├── [aligner_simpleaf/]simpleaf/<sample>/      # optional: af_quant, af_map, qcatch, CellBender
└── [aligner_kallisto/]kallisto/<sample>.count/ # optional: run_info.json, inspect.json, barcodes
The BAM, BUS, .h5, .h5ad, .cloupe and .rds binaries are not read.
Validation runs
The template was validated against the AWS megatest of the 4.2.0 release,
results-3fc17b4f971a89e47c88337de71d0e777ffad8cc: the pbmc8k sample (10x v2
chemistry, GRCh38) on the Cell Ranger, simpleaf and kallisto routes, so the
Aligner Concordance tab is filled. The screenshots above come from that run.
megatest.yaml lists the tables-only subset the template needs; the samplesheet
the run names in params.json is fetched into input/ separately:
bash depictio/projects/nf-core/scrnaseq/4.2.0/download_test_data.sh /tmp/scrnaseq_test
depictio ingest /tmp/scrnaseq_test --template nf-core/scrnaseq/latest
Do not pass --project when ingesting: the dashboard is attached to the
project by name, so renaming it breaks a later depictio dashboard import.
Re-ingesting accumulates dashboards, so delete the project before repeating a run.
Additional resources
- nf-co.re/scrnaseq: official pipeline documentation
- nf-co.re/scrnaseq/4.2.0/results: AWS test results
- Template System Reference: YAML format, variables, conditionals
- Recipes: how to read, test, and write recipes
Authorship
 weber8thomas
Reviewing a template on your own data, or taking over a role here, is a contribution in itself: the contributing guide says what each one involves.