Web UI
Paper and Classic (v1.17.0+)
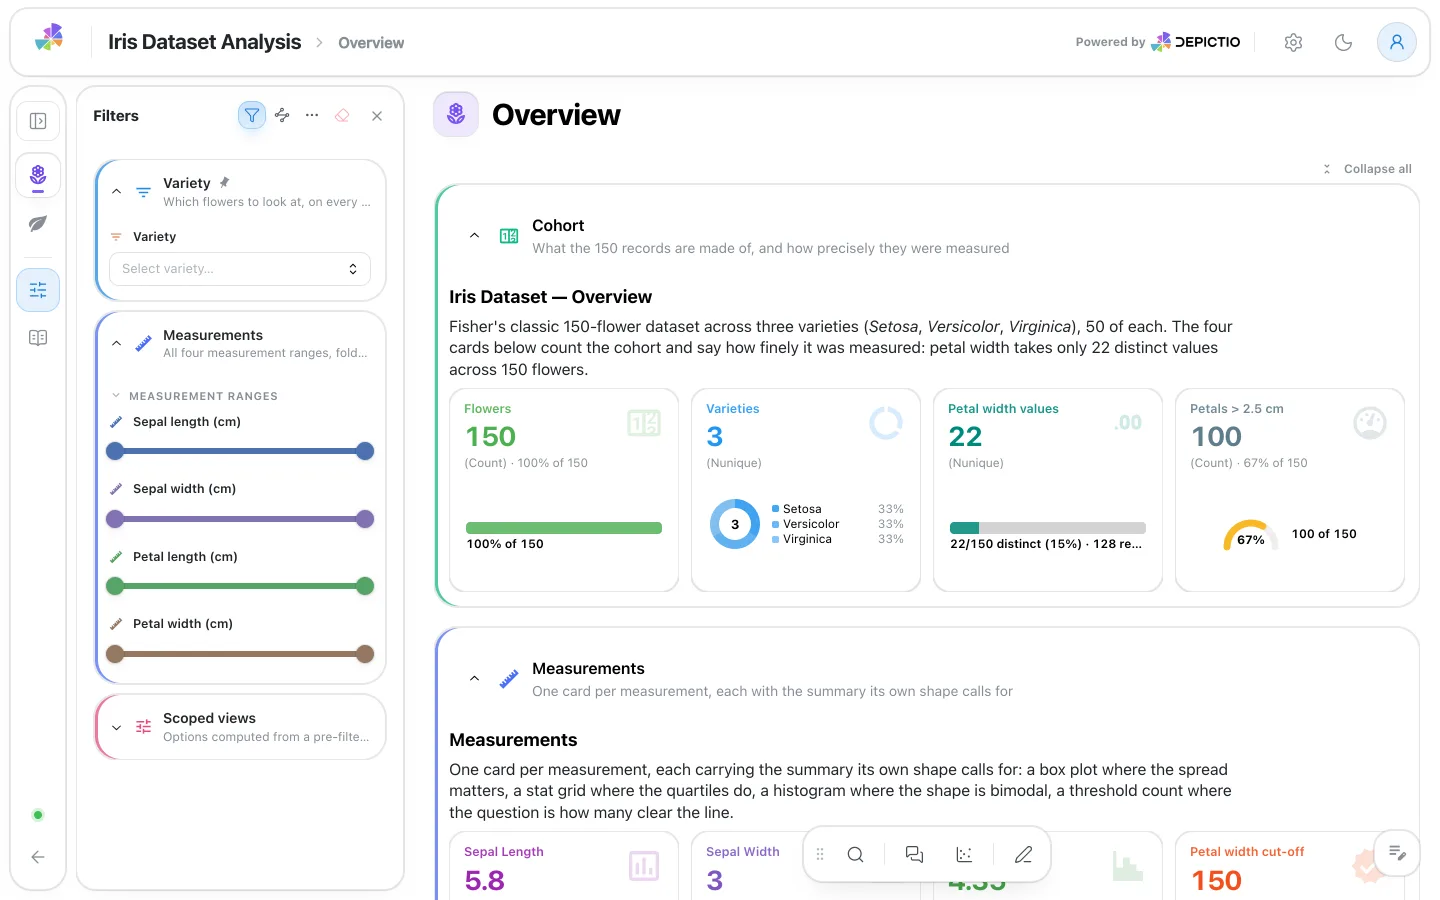
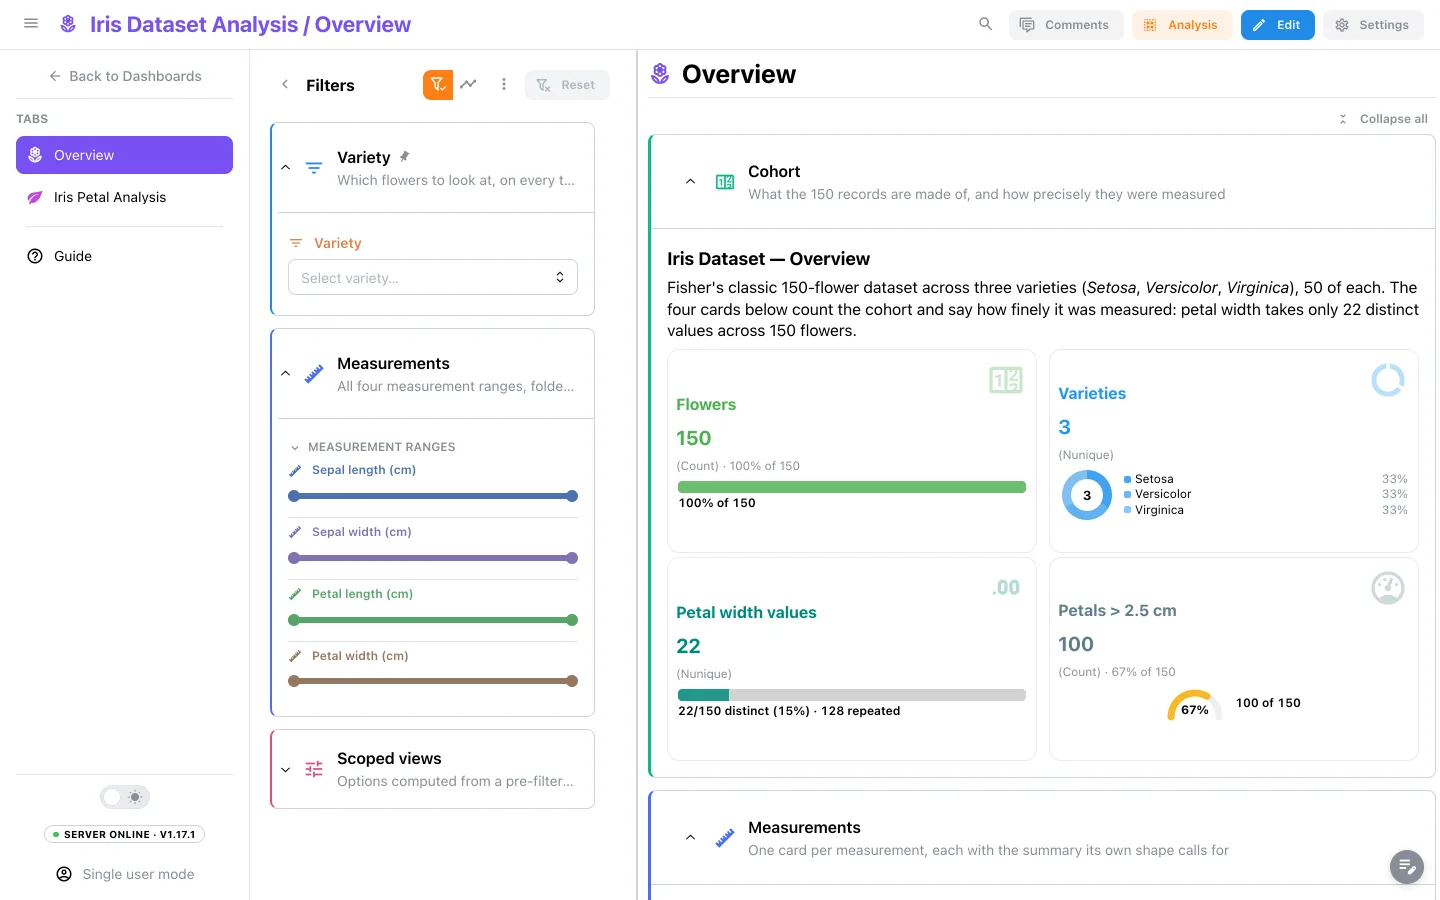
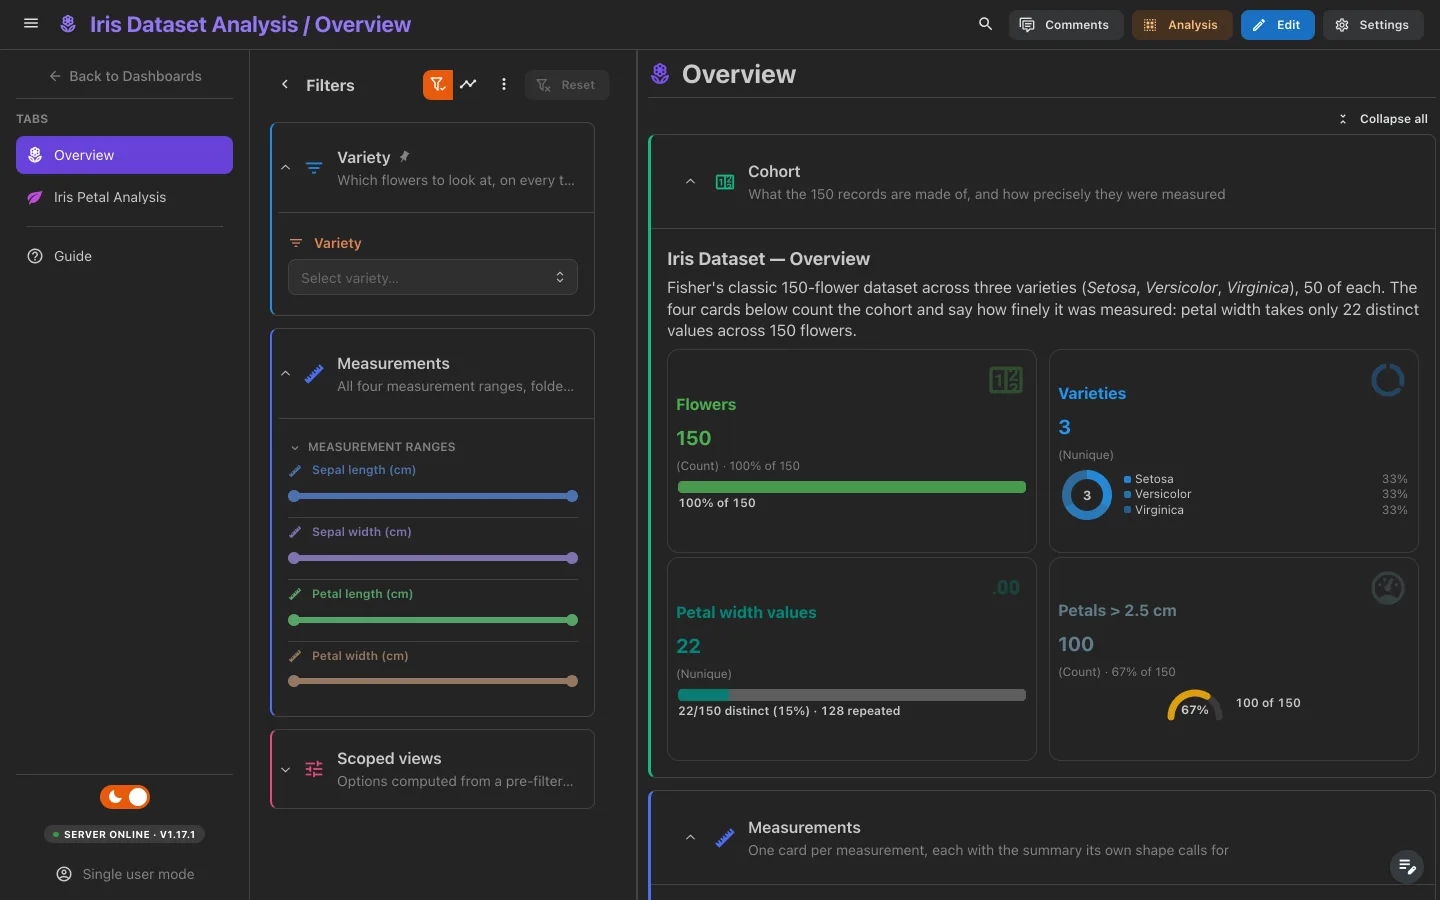
Depictio comes in two looks, with the same pages, panels and settings:
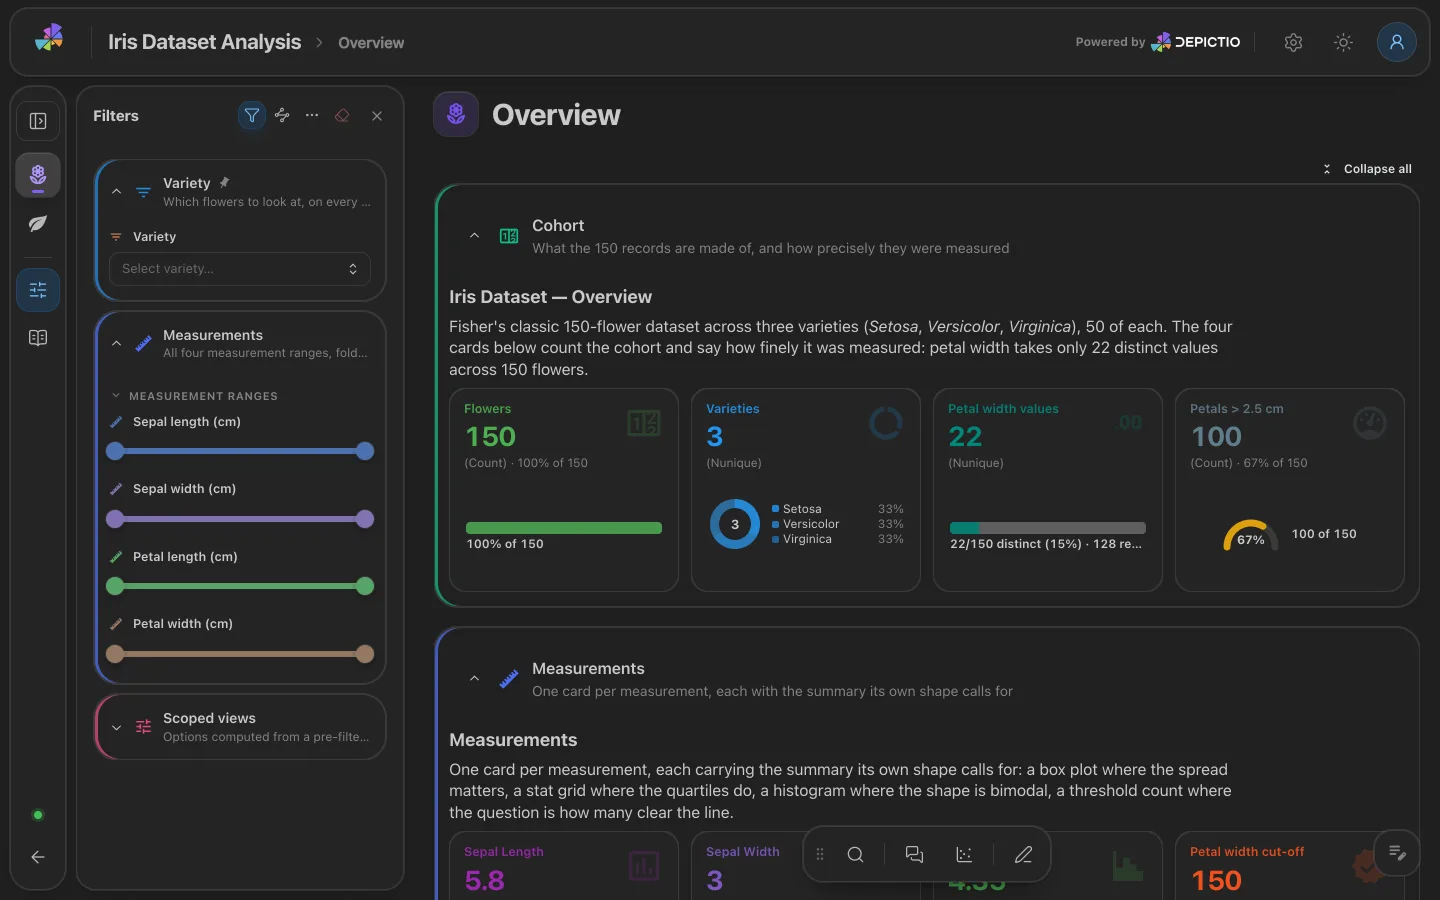
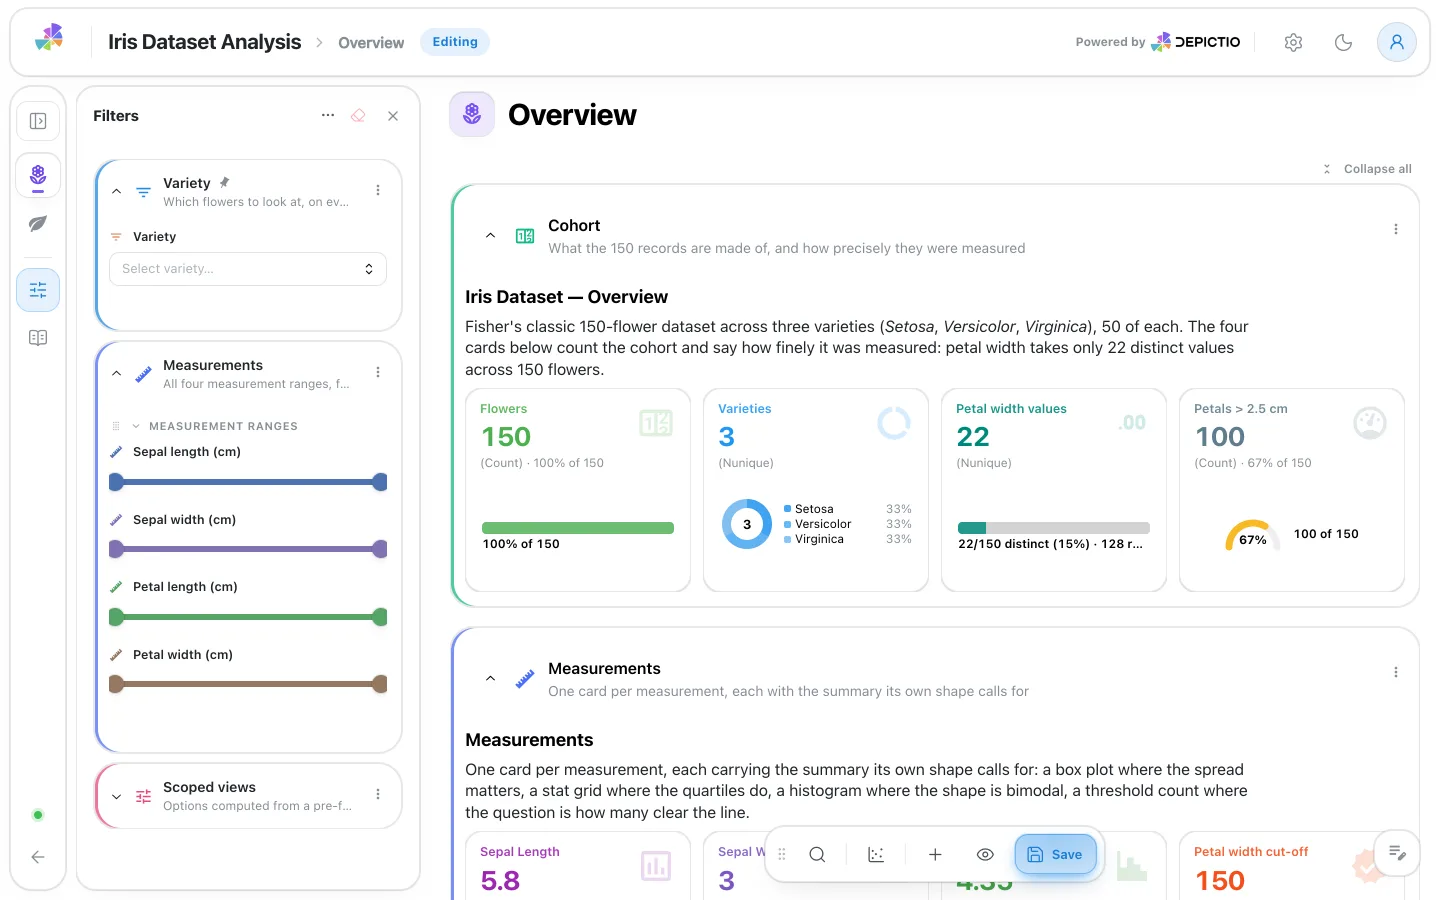
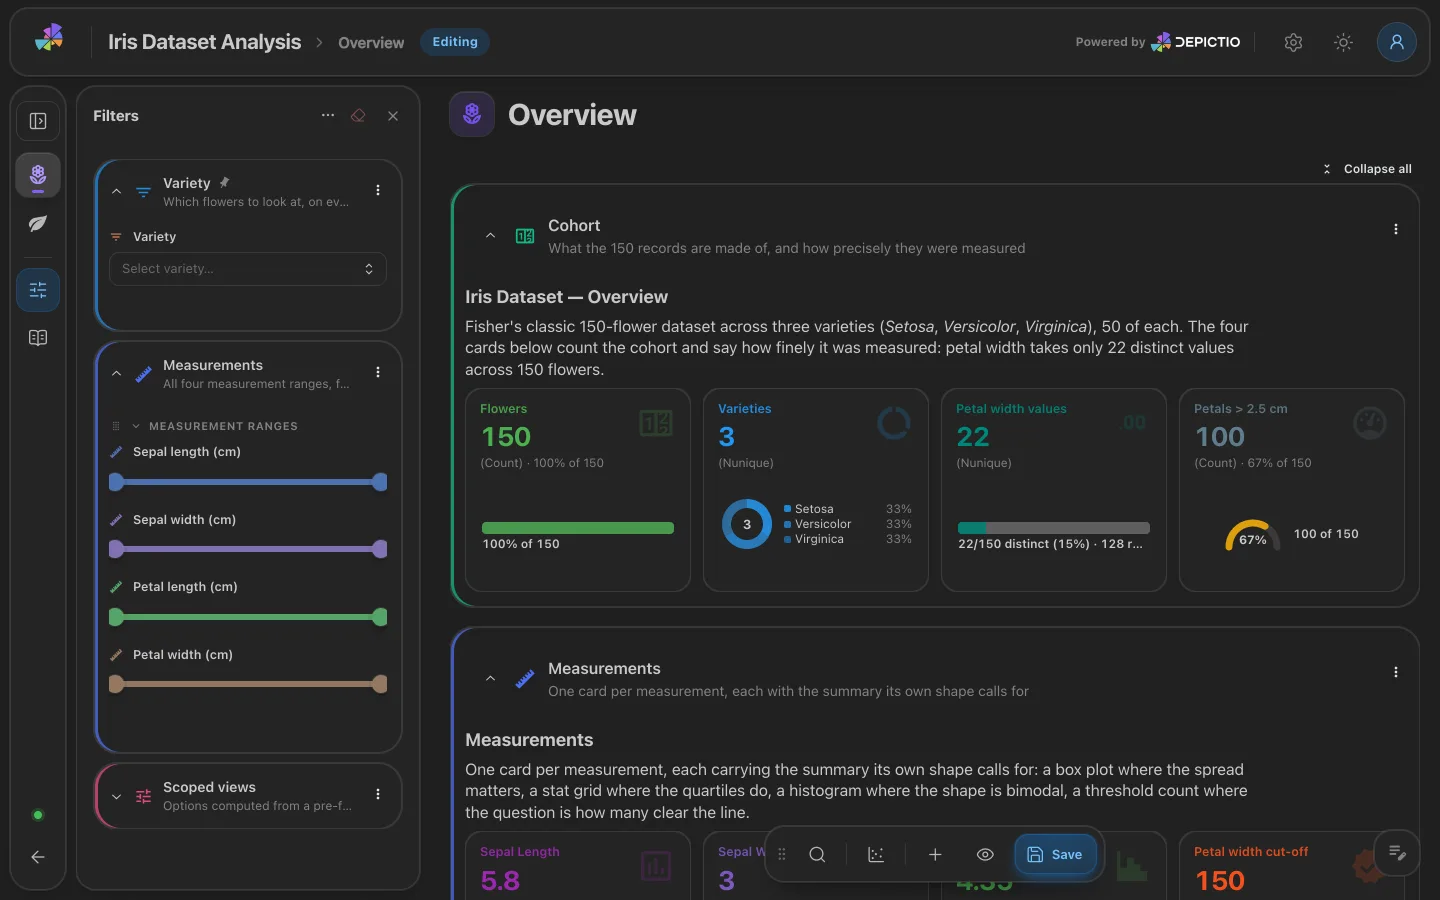
- Paper, the default since v1.17.0: every page on paper panels, a top bar with the page or dashboard title, and a sidebar. On a dashboard, the tab sidebar folds to an icon rail, by itself while the filter panel is open, and a floating dock holds Search, Analysis, Comments and Edit / Save / Exit as icon keys. Drag it by its grip, or use the arrow keys, to the bottom, left, right or top of the page; the browser keeps the place.
- Classic, the layout of earlier versions: a header bar of buttons and a tab sidebar.
A page takes the first of:
?chrome=glass(Paper) or?chrome=base(Classic) in its URL, kept for the rest of the browser session, for support and testing;- your own pick, in Account settings → Preferences → Look, kept in this browser;
- the default an administrator sets in Administration → Branding → Default look;
- Paper.
Screenshots in these docs show one look or the other; where a control sits in the header in Classic, Paper has it in the top bar or the dock.
Register and login
Registering an Account (Sign Up)
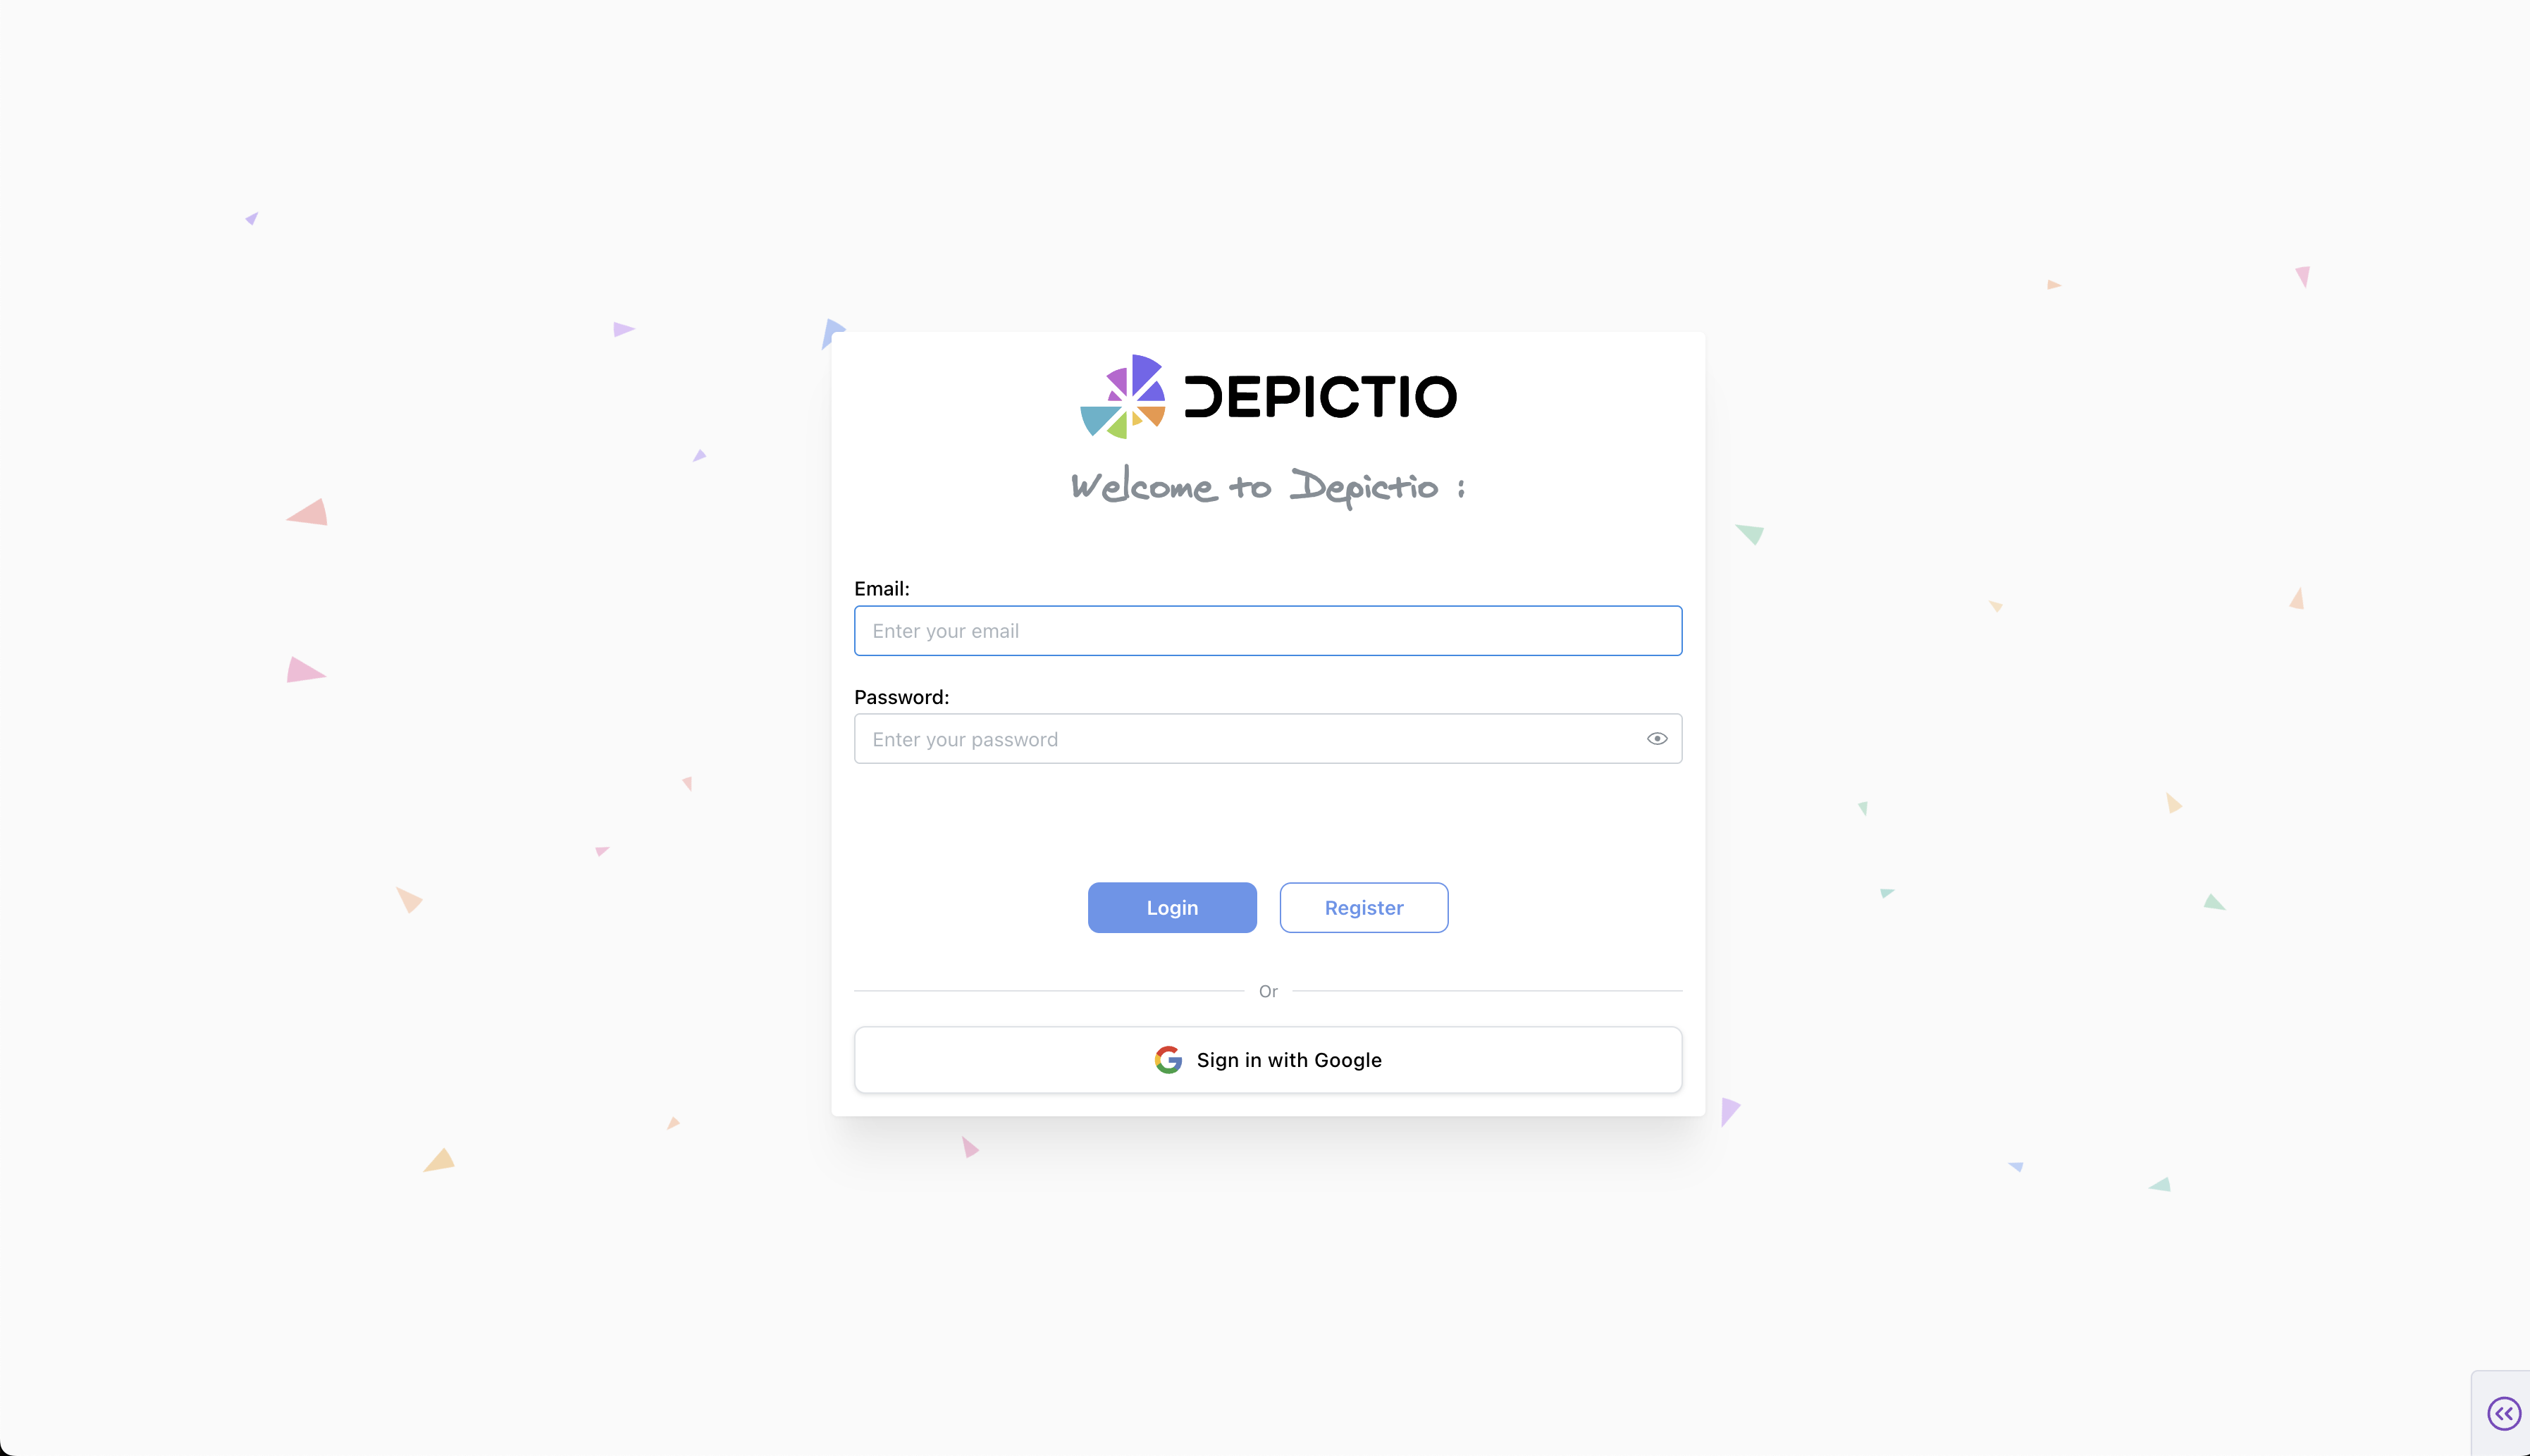
- Navigate to the Registration page by clicking the Register button on the login screen.
-
Enter your email address in the "Email" field.
-
Create a password and enter it in the "Password" field. You can click the eye icon to view the password as you type and Confirm your password by re-entering it in the "Confirm Password" field.
-
Click the Register button to submit your registration details.
-
After successful registration, you can return to the login page by clicking the Back to Login button.
Logging In (Sign In)
- Open the Depictio Login page.
- Enter your email address in the "Email" field.
- Enter your password in the "Password" field.
- If you want to see the password as you type it, click the eye icon next to the password field.
- Once both fields are filled in, click the Login button.
- You will be redirected to the Depictio landing page (currently
/dashboards).
Google OAuth Login
If you have configured Google OAuth for your Depictio instance (see Configuration), you can log in using your Google account. If the account does not exist, it will be created automatically.
Landing page / Dashboards section (/dashboards)
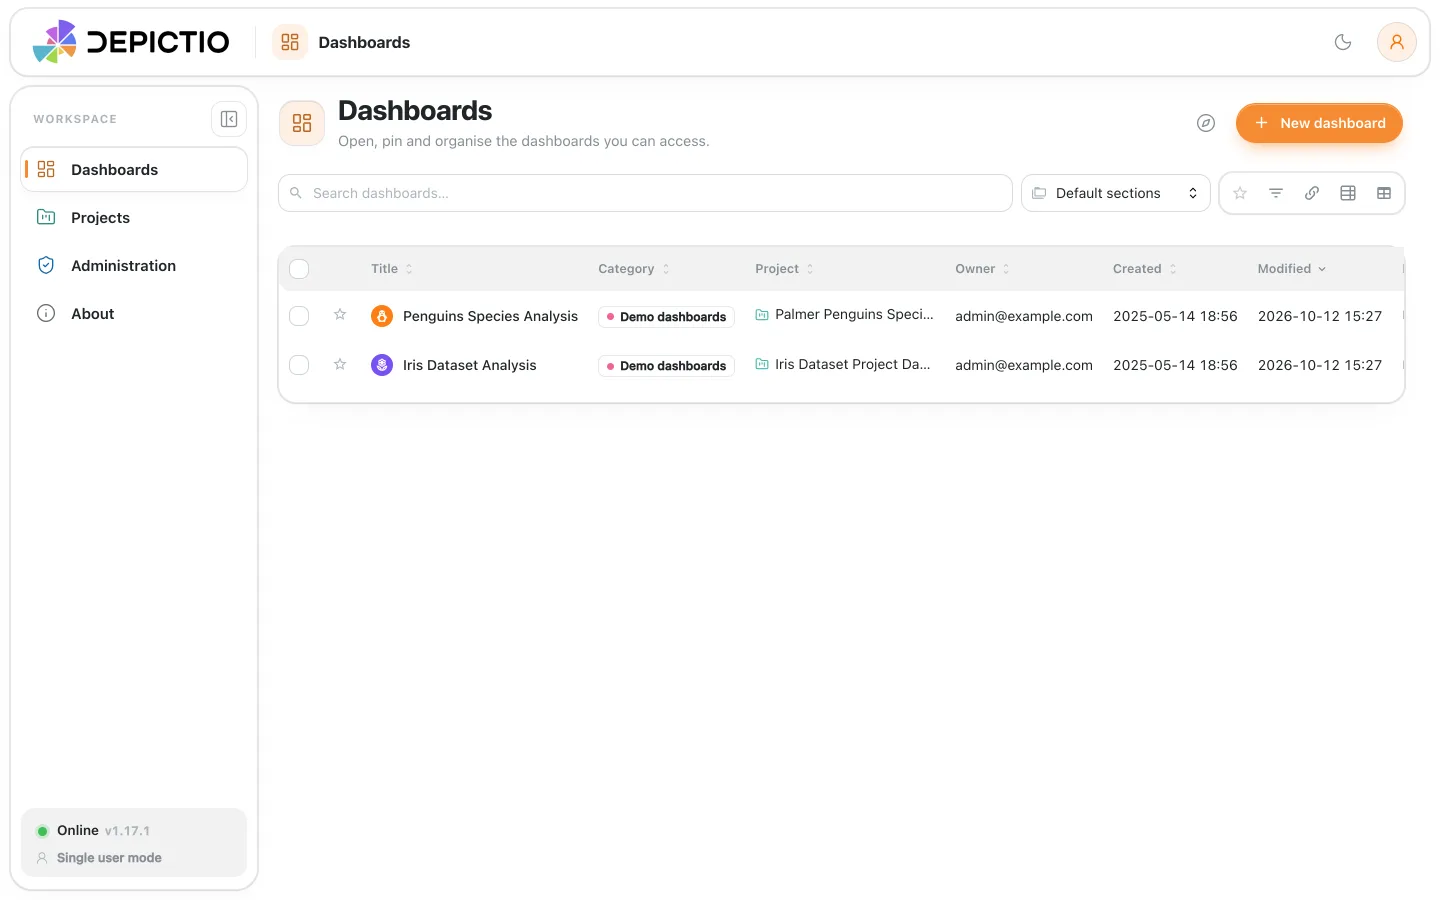
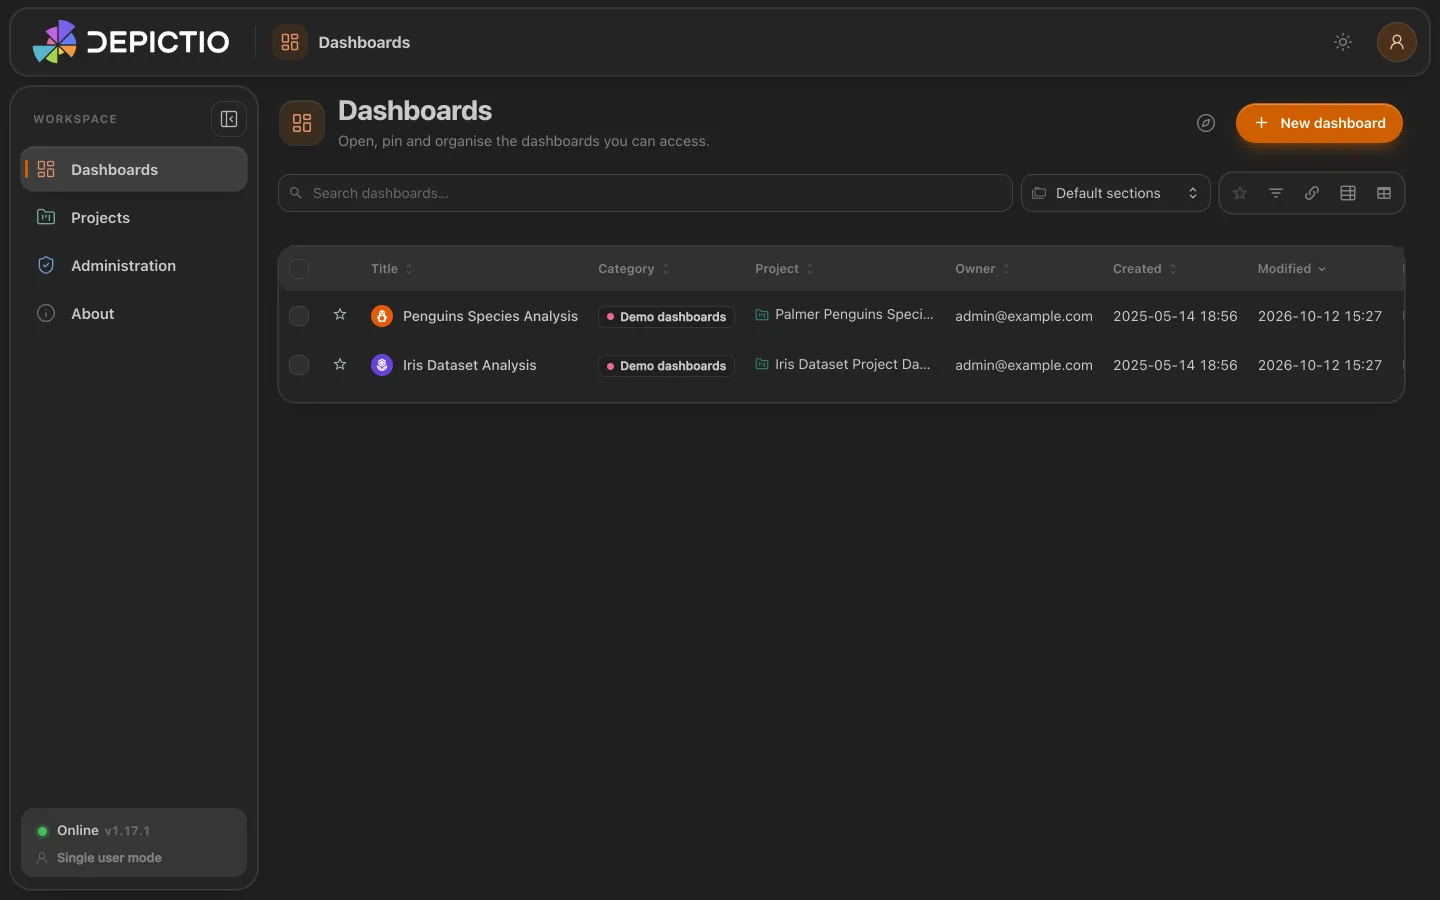
The listing opens on the Table view (v1.12.0+), one row per dashboard. In the Thumbnails view each dashboard is shown as a card. Cards display the dashboard's screenshot thumbnail once one has been captured, and fall back to the dashboard's logo (when set) before the generic placeholder.
The table view has a Last viewed column (v1.11.0+), sorted newest first, with dashboards you never opened last. It is kept per browser.
The Table display menu (v1.17.0+) sets the row height, Comfortable or Compact, and which columns show, with Show all and Reset. The Projects listing has the same menu.
Thumbnails or table (v1.11.2+)
The view switcher in the toolbar picks between Thumbnails, the card grid, and Table, with sortable columns and bulk selection. The Tiles view of earlier versions is gone, and a browser that had it opens on Thumbnails.
In Thumbnails, the Card display menu beside the switcher sets:
- Cards per row: 5 by default since v1.12.0, or 2 to 6, or Auto. Auto never makes more columns than a section has cards, so a section with a single dashboard draws it across the whole width.
- Badges: which of Project, Template, Owner, Visibility, Last modified and Tabs a card shows. Hovering a badge gives its long form.
Reset to defaults restores both, so five cards per row. They are layout preferences, kept in the browser and left out of shared links. A browser that opened the listing before v1.12.0 stored Auto, the former default, and keeps it until you pick another value or reset. Resting the pointer on a thumbnail opens a larger, sharper preview.
Someone who never picked a view gets the one the deployment sets with
DEPICTIO_VIEWER_DASHBOARDS_DEFAULT_VIEW:
Table since v1.12.0, Thumbnails before. Set it to thumbnails to open the grid
again. A view picked in the browser, or named by a shared link such as
/dashboards?view=thumbnails, wins over it.
Sidebar Navigation
The left sidebar provides easy access to various sections of the application. This includes:
- Dashboards: View and manage your dashboards.
- Projects: Manage your projects and data collections.
- Administration (sysadmin users only): Access administrative features (only available to users with admin privileges).
- About: Information about the application and its repository.
The button at the top of the sidebar folds it to icons. The top bar holds the theme toggle and your avatar, which opens Account settings (v1.17.0+). The compass in the header of the Dashboards and Projects pages starts the guided tour.
Server information (v1.17.0+)
The server status at the foot of the sidebar, Online with the server version, opens the server information: version, API, mode, and links to the documentation, GitHub, the releases and the issue tracker. On a dashboard it sits at the foot of the tab rail, and in Classic it is the version badge.
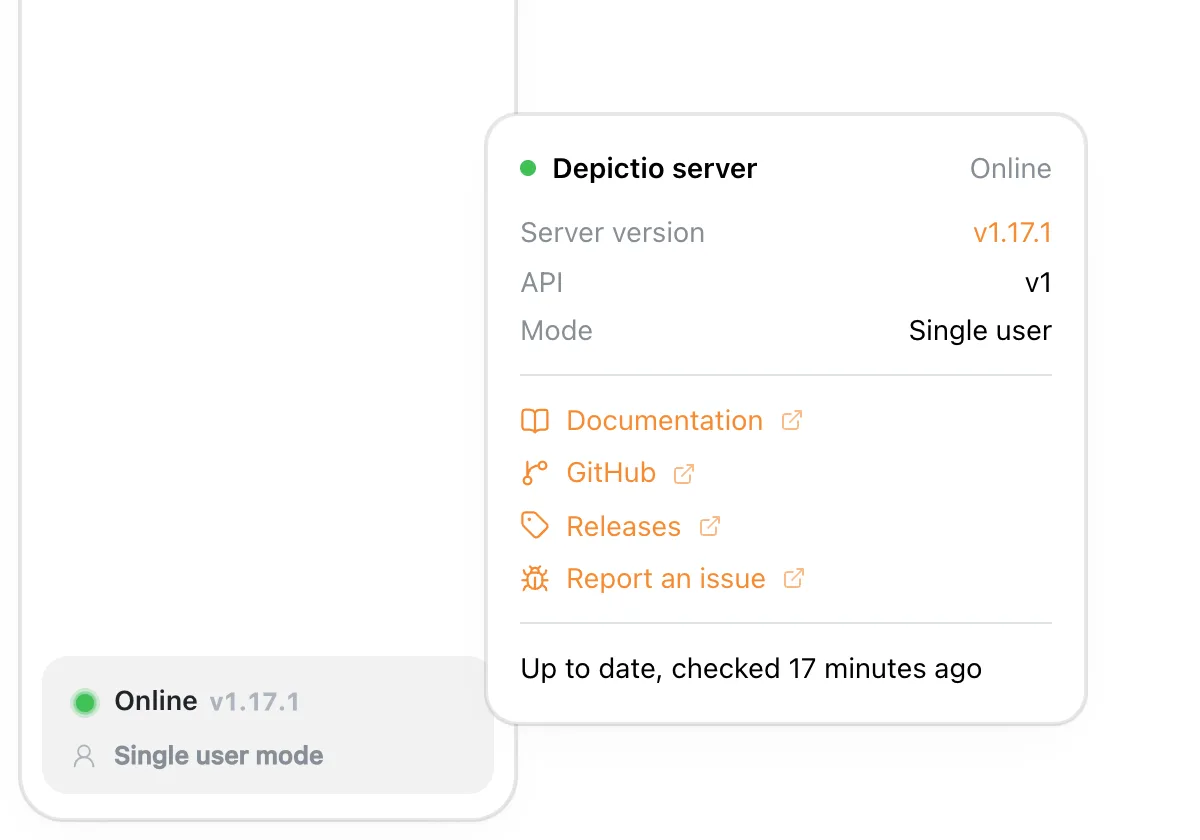
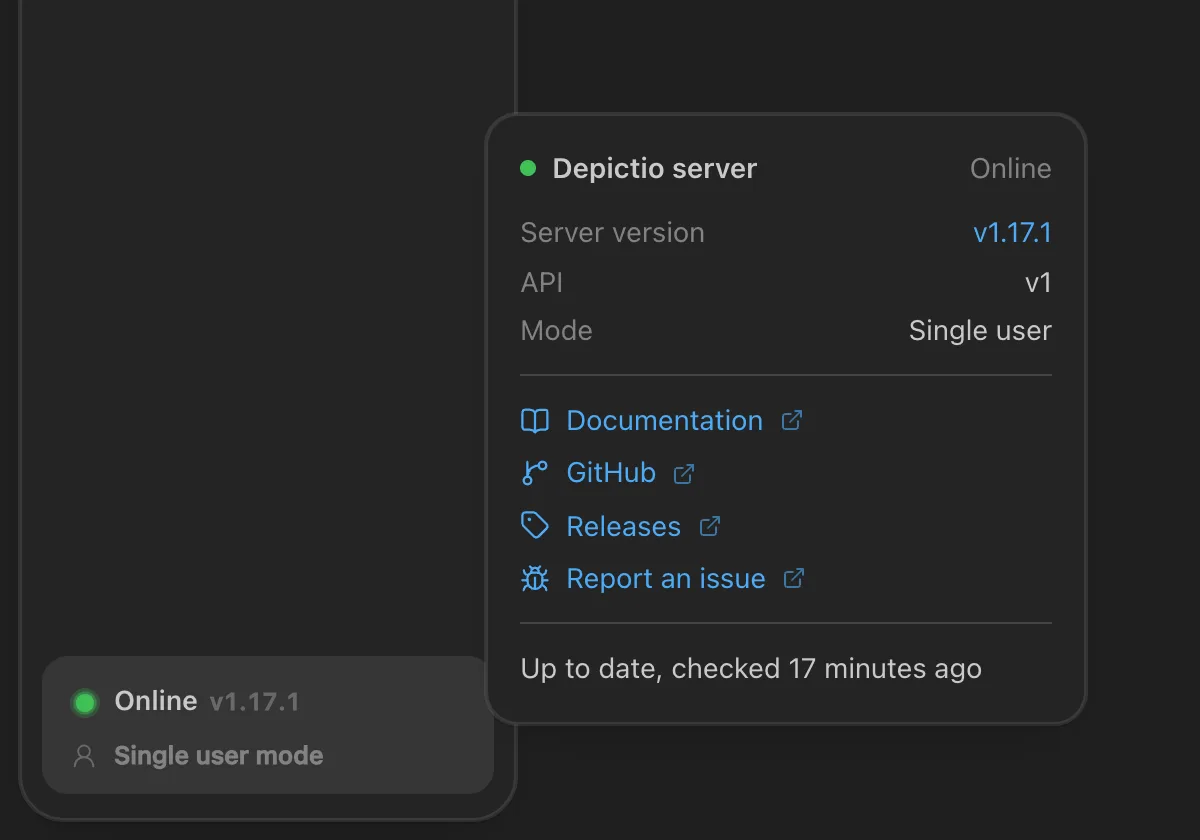
For administrators, its last line says whether a newer Depictio release is out. When one is, a dot marks the status and a card in the popover names the release; OK hides it until the next one. See Release check.
Creating a New Dashboard
- On the landing page, click the orange "+ New Dashboard" button located in the top right corner.
- A pop-up window will appear with a field labeled "Dashboard Title".
- Enter a name for your new dashboard.
- Your dashboard will be created with the title you provided and added to the section.
- Click the blue "Create Dashboard" button to create the dashboard.
- The new dashboard will appear in the section with informations including name, owner and status (public/private).
Functionalities
Viewing a Dashboard
- Once a dashboard is created, it will appear under the section.
- Click the "View" button next to the dashboard name to open and explore its content.
Deleting a Dashboard
- To delete a dashboard, locate the dashboard in the section.
- Click the red "Delete" button next to the dashboard name.
- A confirmation pop-up will appear, asking "Are you sure you want to delete this dashboard?".
- Click "Delete" to permanently remove the dashboard, or "Cancel" to keep it.
Editing dashboard name
- To edit the name of a dashboard, locate the dashboard in the section.
- Click the "Edit name" button next to the dashboard name.
- A pop-up window will appear with a field labeled "New name".
- Enter a new name for your dashboard.
- Click the blue "Save" button to save the new name.
Duplicating a dashboard
- To duplicate a dashboard, locate the dashboard in the section.
- Click the "Duplicate" button next to the dashboard name.
- The dashboard will be duplicated and added to the section with the suffix "(copy)".
Note
Share a filtered listing (v1.10.1+)
The filters of /dashboards and /projects are kept in the URL. Set them, then
press the link button in the toolbar to copy a link to that view:
| Link | Shows |
|---|---|
/dashboards?template=nf-core/rnaseq |
Dashboards built from nf-core/rnaseq, any version |
/projects?template=nf-core/rnaseq,nf-core/viralrecon |
Projects built from either pipeline |
Whoever opens it sees a Shared view banner, with Show everything to clear the filters. The link grants no access: it only narrows what they could already open.
Projects section (/projects)
Complete Projects Documentation
For comprehensive information about Projects in Depictio, see the dedicated Projects Guide.
The Projects Guide covers:
- Project Types - Basic vs Advanced projects
- Creating Projects - Step-by-step instructions
- Configuration - YAML setup and examples
- Data Collections - File organization and processing
- Permissions - Access control and collaboration
- Best Practices - Optimization and troubleshooting
Quick Links:
- Projects Guide - Complete project management
- YAML Examples - Configuration patterns
- Configuration Reference - Full parameter reference
Quick Overview
- The left sidebar includes a "Projects" section where users can manage their projects
- Click on "Projects" to navigate and view them
- Projects organize your data and provide structure for dashboards
- You can access workflows and data collections recursively within each project
- Each entity allows you to view configuration details and preview data
Creating a project from a run folder or a manifest (v1.16.0+)
+ New Project offers four tabs: Create New, Import, From Manifest and From a run folder. The last two build a project from data the server reads, with no CLI involved, in three steps: Source, Preview (a dry run, nothing is created) and Create.
- From a run folder: point at the results folder of one pipeline run, in a
bucket or, on a
depictio localserver, on this computer. Depictio recognises the pipeline, picks the template and shows what each data collection finds there; the data is ingested in the background. See From a run folder. - From Manifest: paste the URL of a data manifest and pick a template that reads one. See From a manifest.
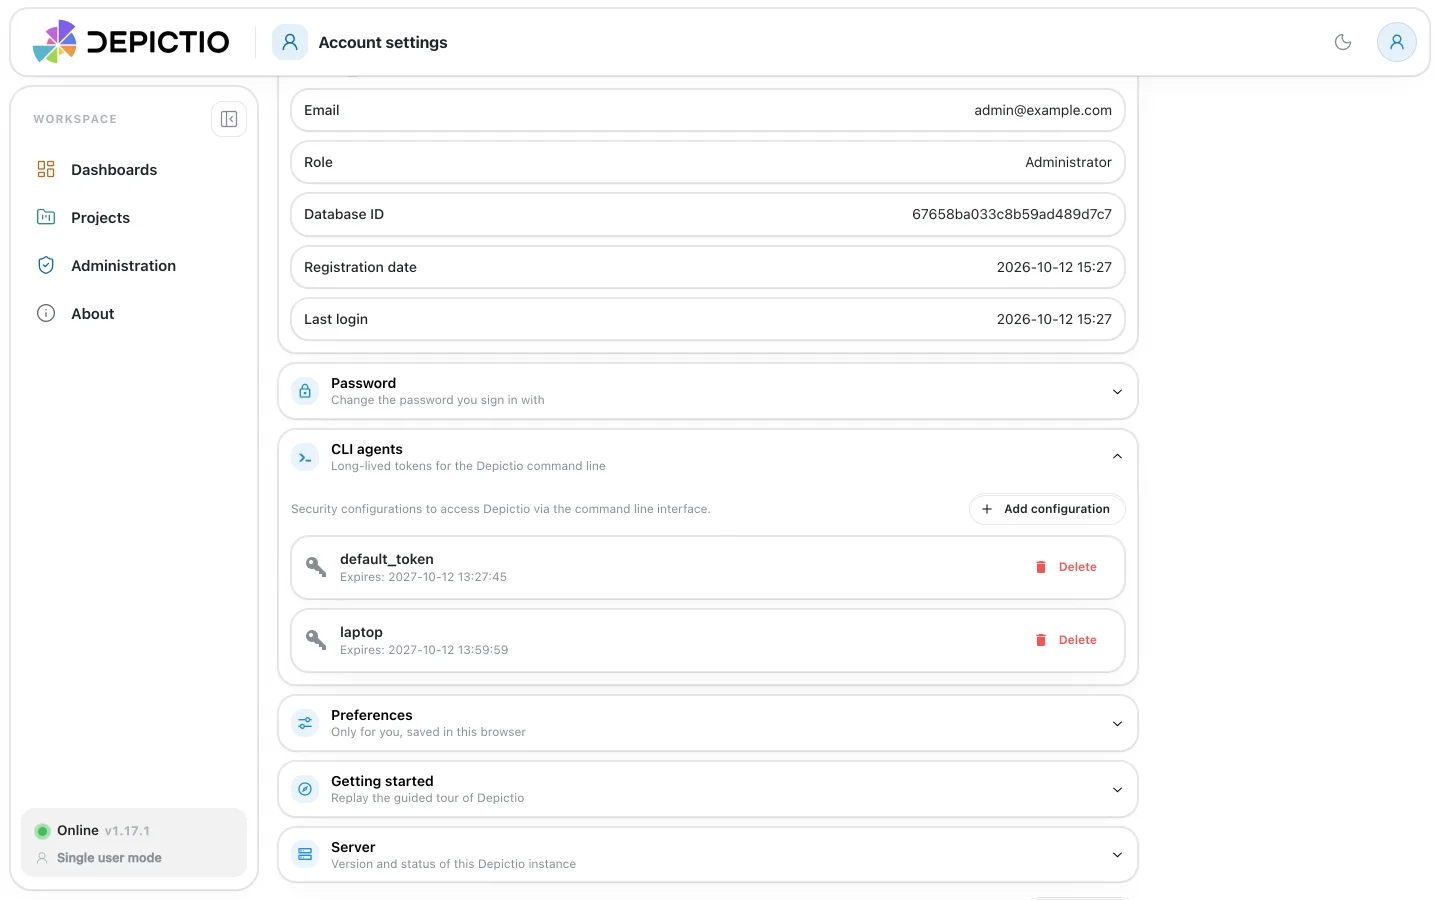
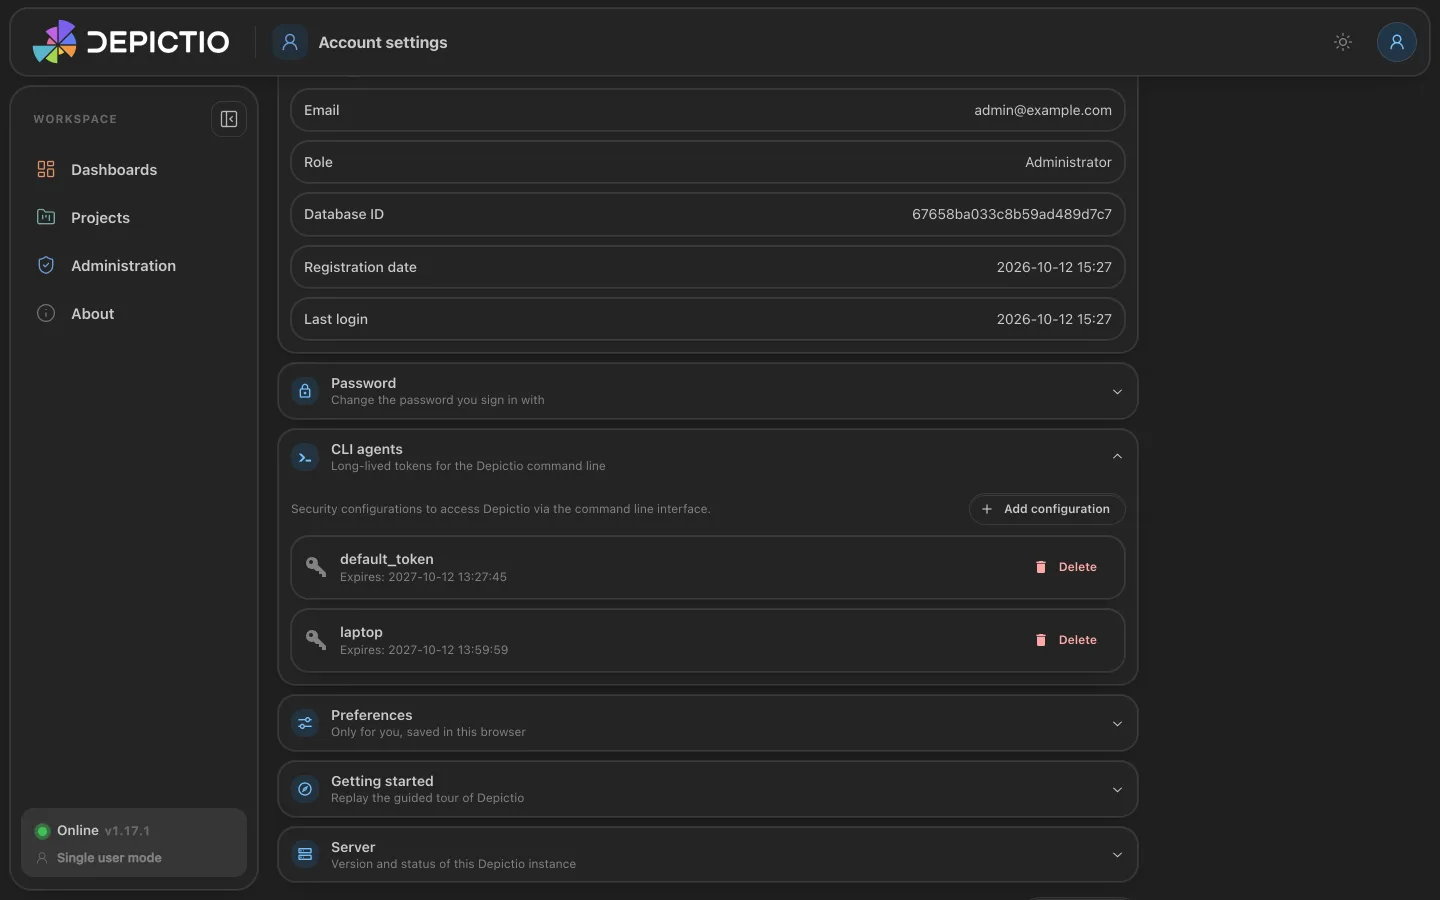
Account settings (/profile) (v1.17.0+)
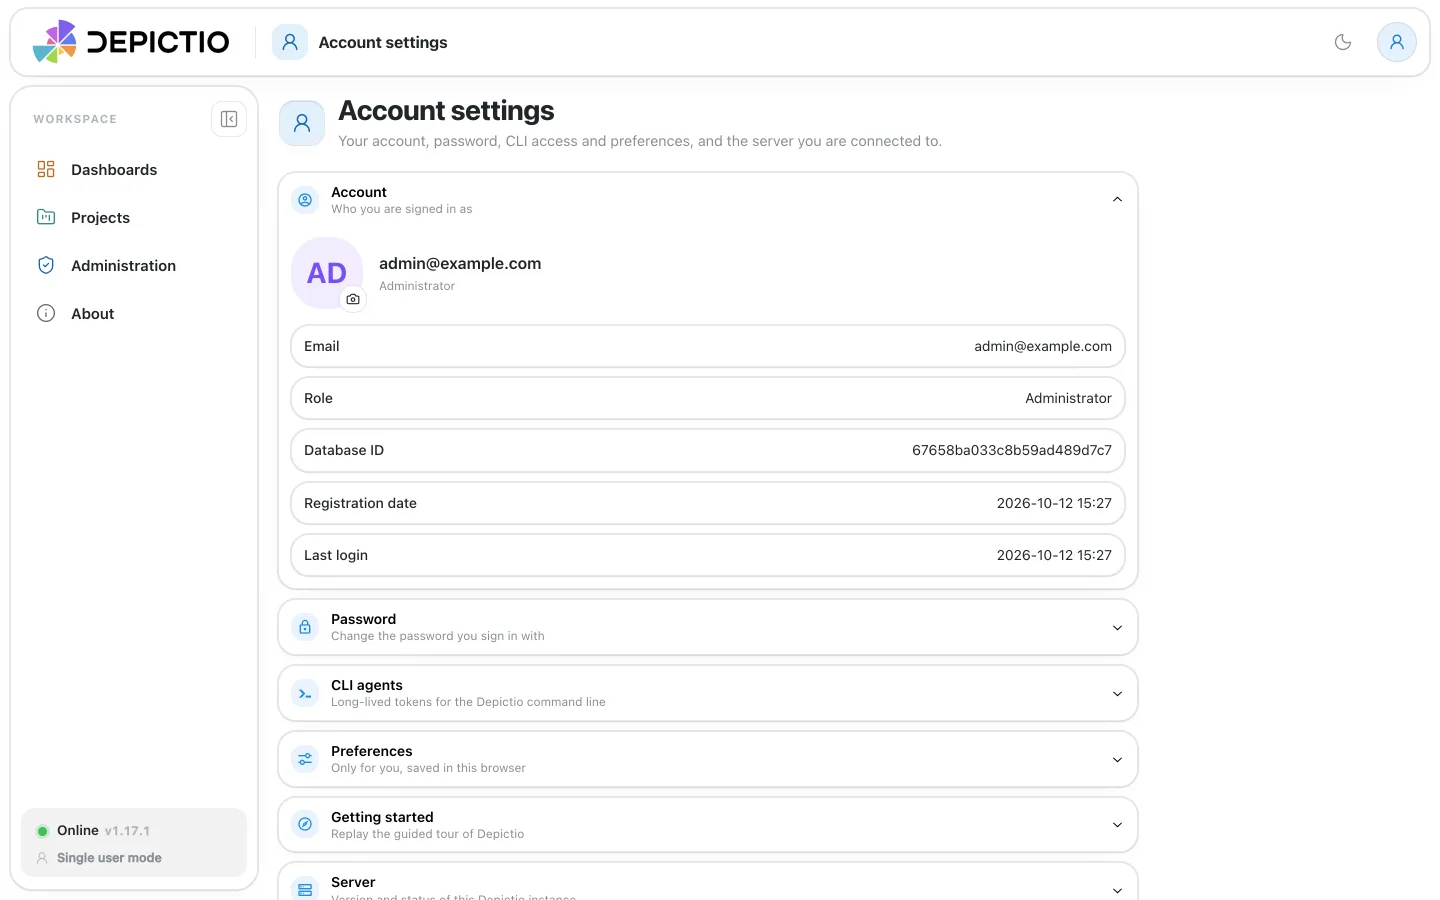
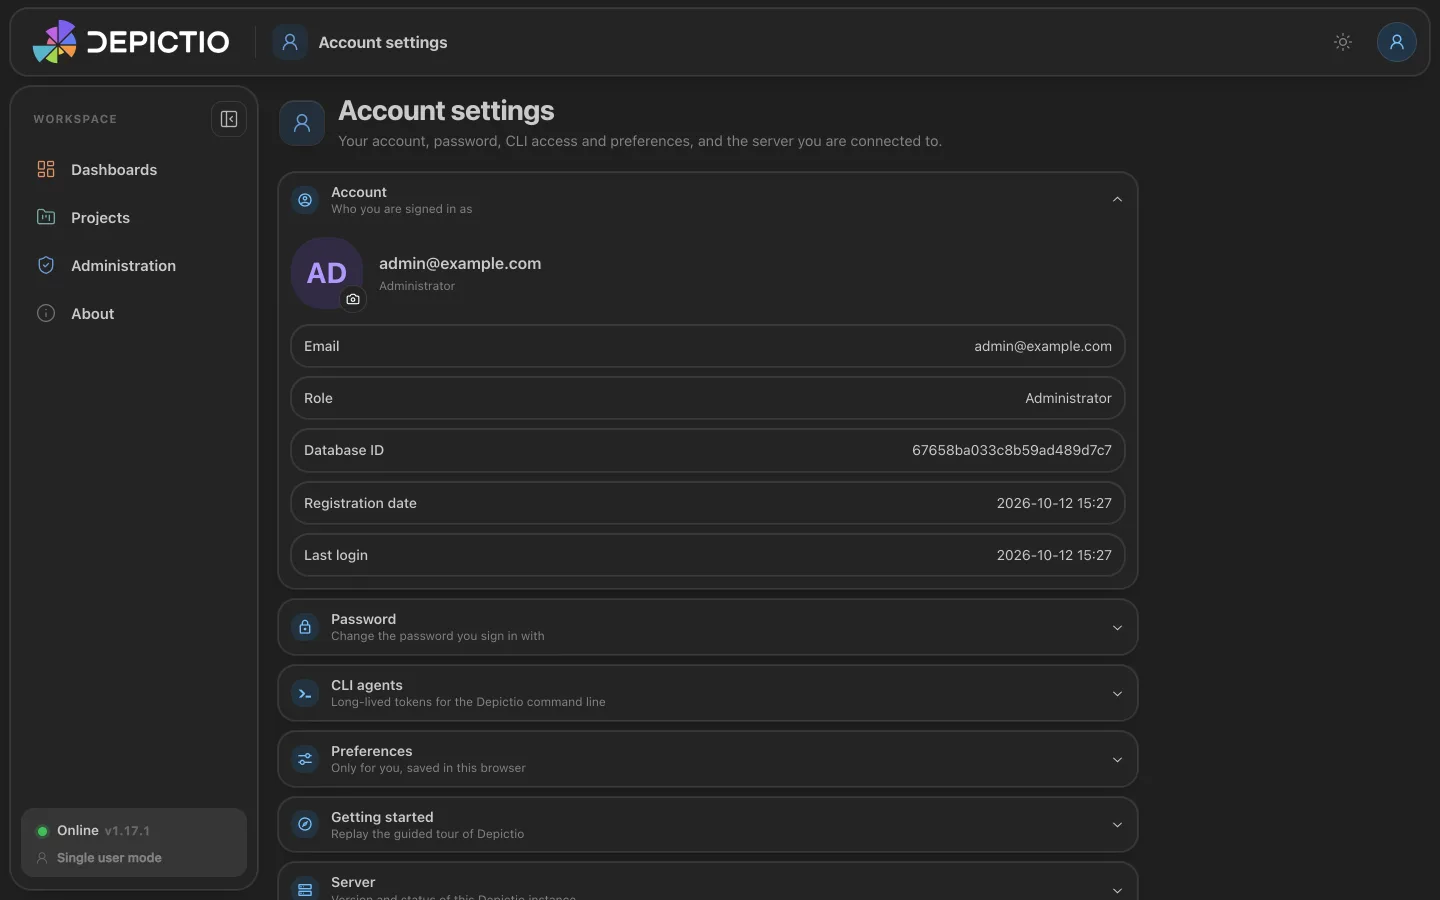
Your avatar in the top bar opens Account settings, one page of sections that open and close:
- Account: your email, role and dates. Click the avatar to upload a profile picture; the server stores it as a 256-pixel WebP and includes it in backups. Signing in with Google sets your Google picture until you upload one.
- Password: change the password you sign in with.
- CLI agents: the long-lived tokens of the
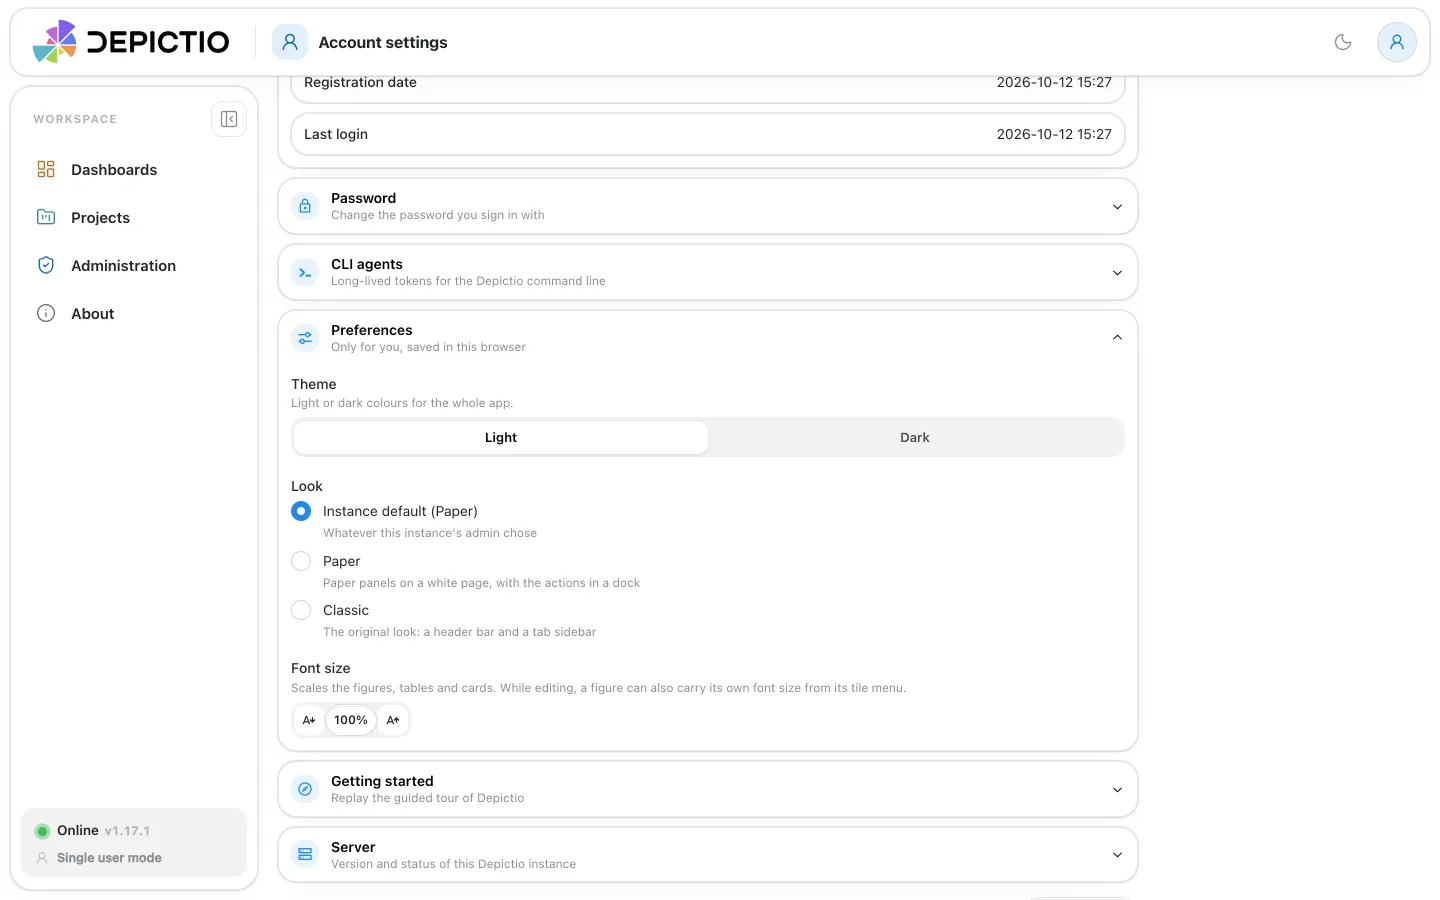
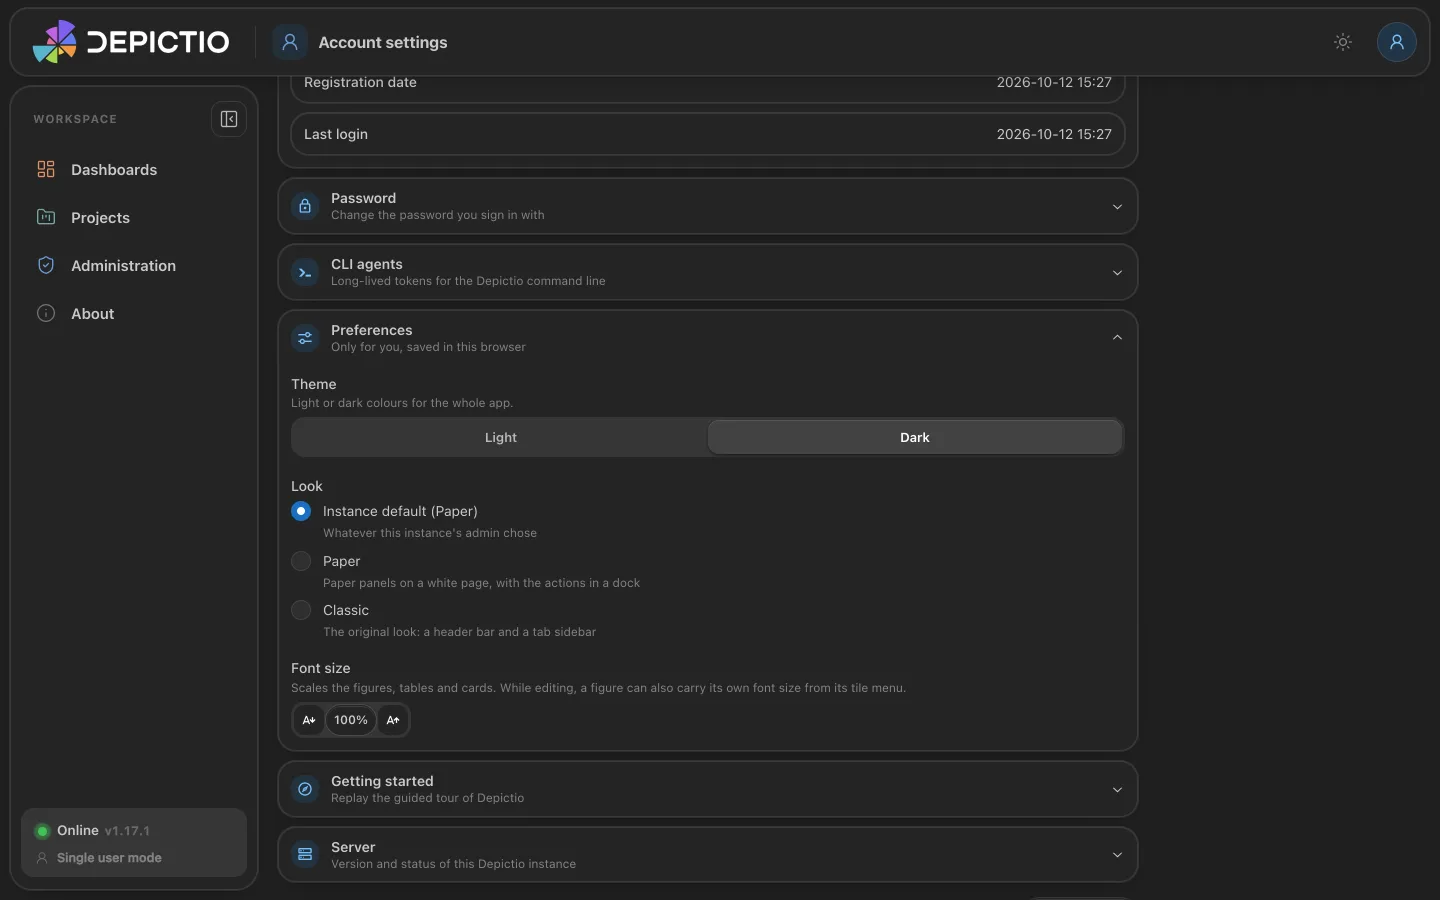
depictiocommand line, see Create a CLI configuration. The former/cli-agentspage leads here. - Preferences, kept in this browser: Theme, light or dark; Look, Paper, Classic or the instance default; Font size of figures, tables and cards.
- Getting started: replay the guided tour of the app or of the builder.
- Server: the server information.
Sign out is at the foot of the page.
About section (/about)
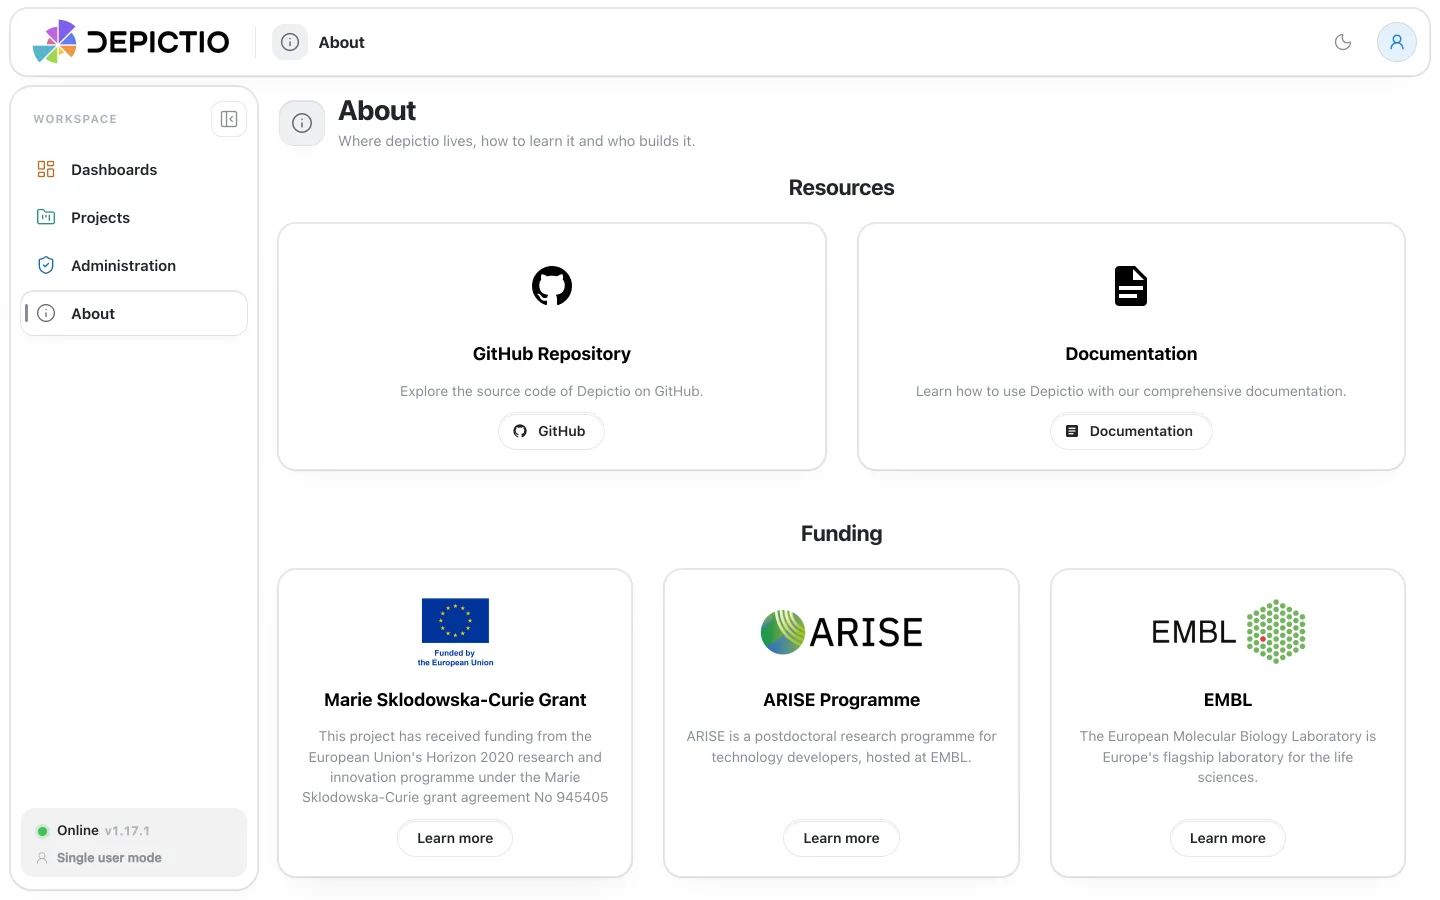
The About section provides information about the GitHub repository and the documentation.
Admin section (/admin)
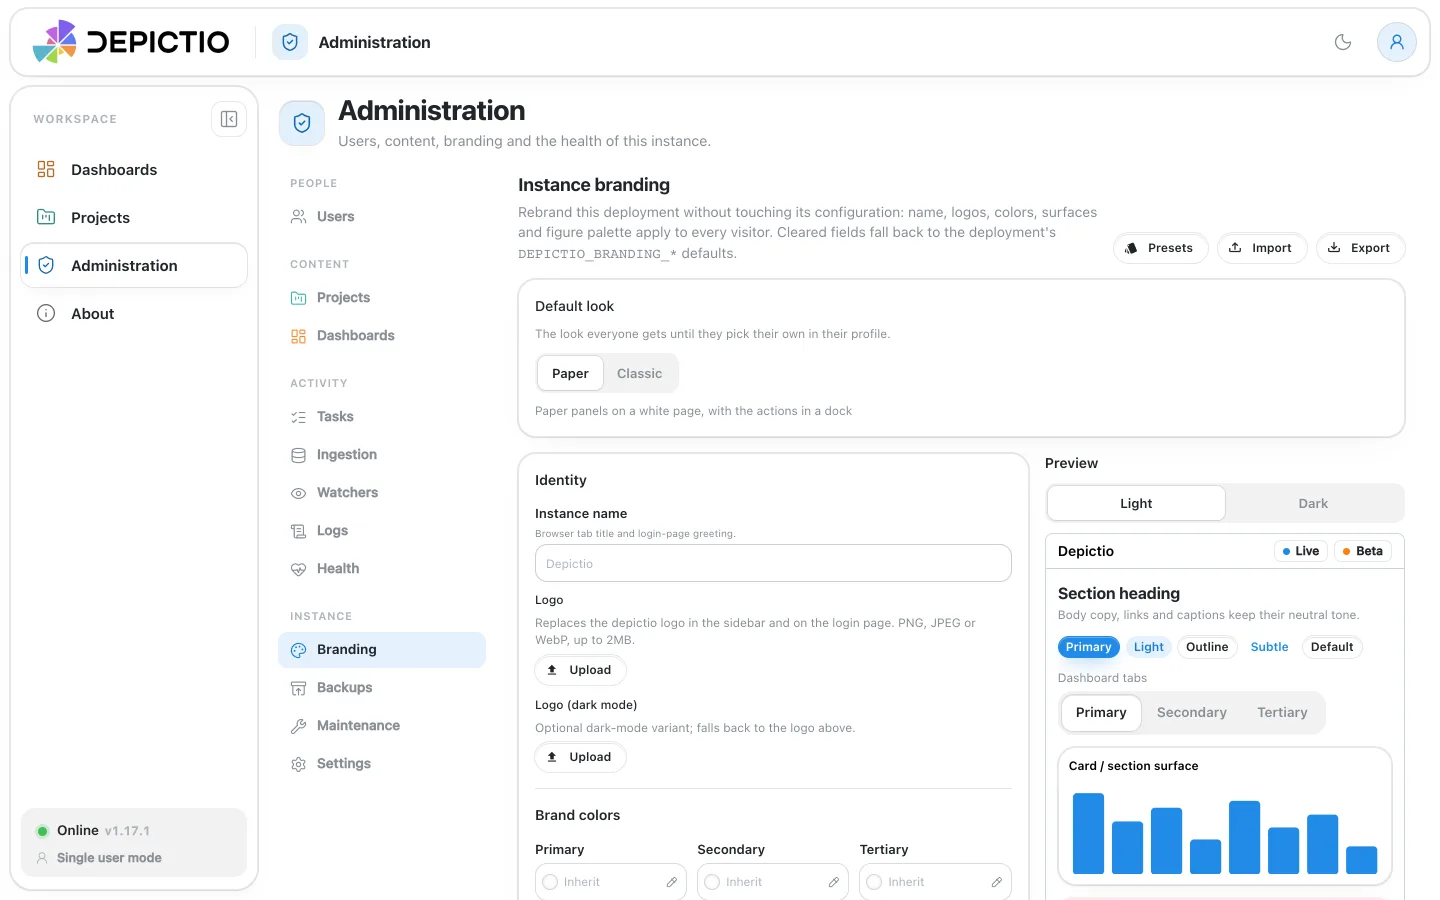
The Admin section is only accessible to users with admin privileges. Since v1.17.0 its pages are listed down the side, in four groups:
| Group | Pages |
|---|---|
| People | Users: every account, its role (standard or system admin), and deletion |
| Content | Projects and Dashboards: every one of them, whoever owns it. Admins can delete any |
| Activity | Tasks, Ingestion, Watchers, Logs and Health, see Monitoring |
| Instance | Branding, Backups, Maintenance and Settings |
Release check (v1.17.0+)
Administration → Settings → Version check tells administrators when a newer Depictio
release is published. The server asks the GitHub Releases API of depictio/depictio
every 6 hours, with a plain request that sends nothing about the instance, and the
server information shows the result to administrators only.
Check now asks at once.
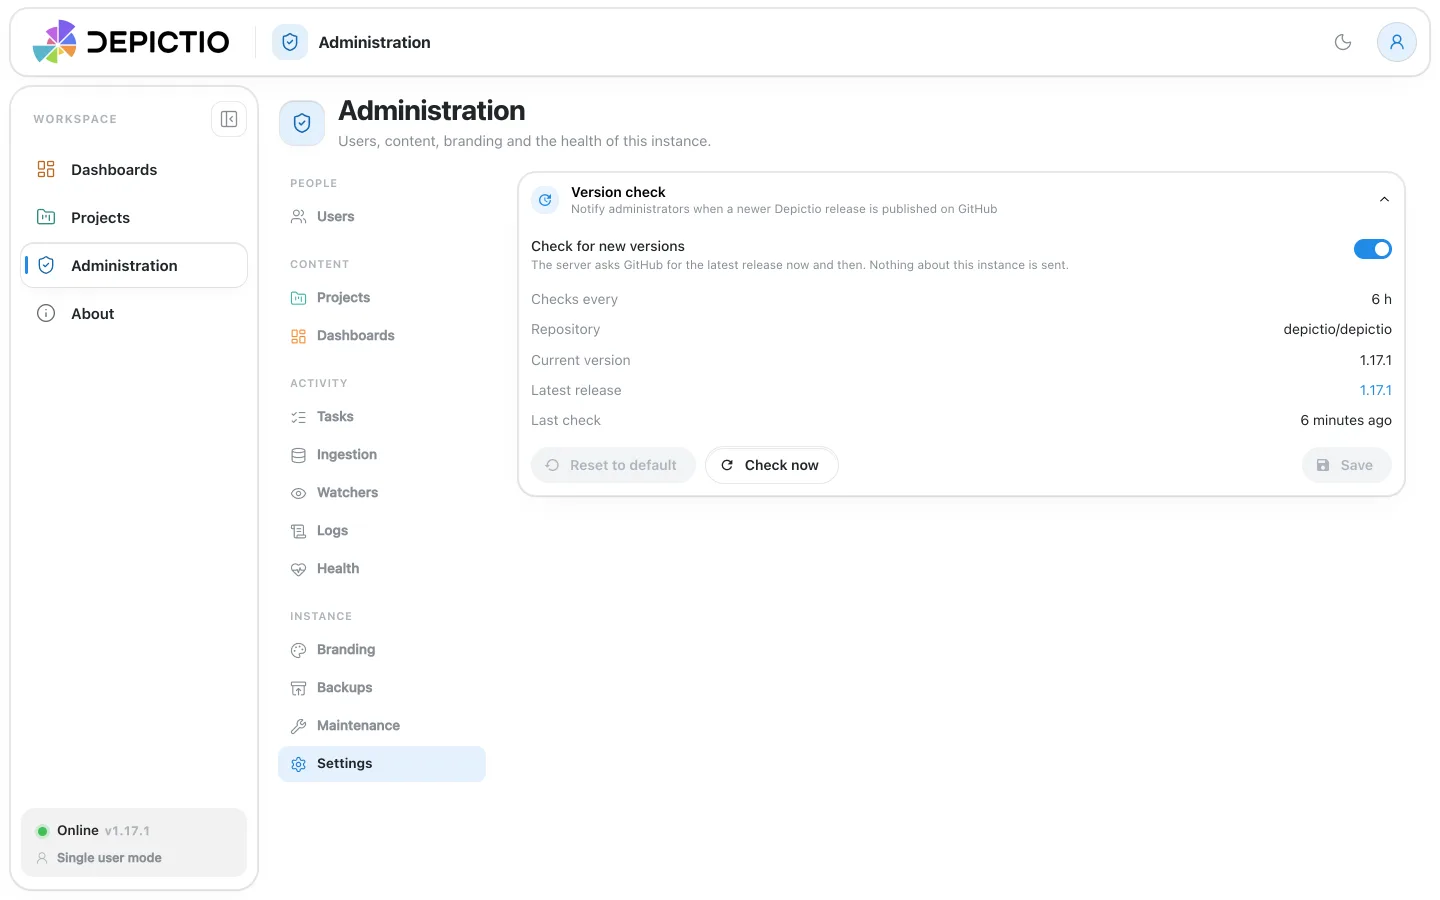
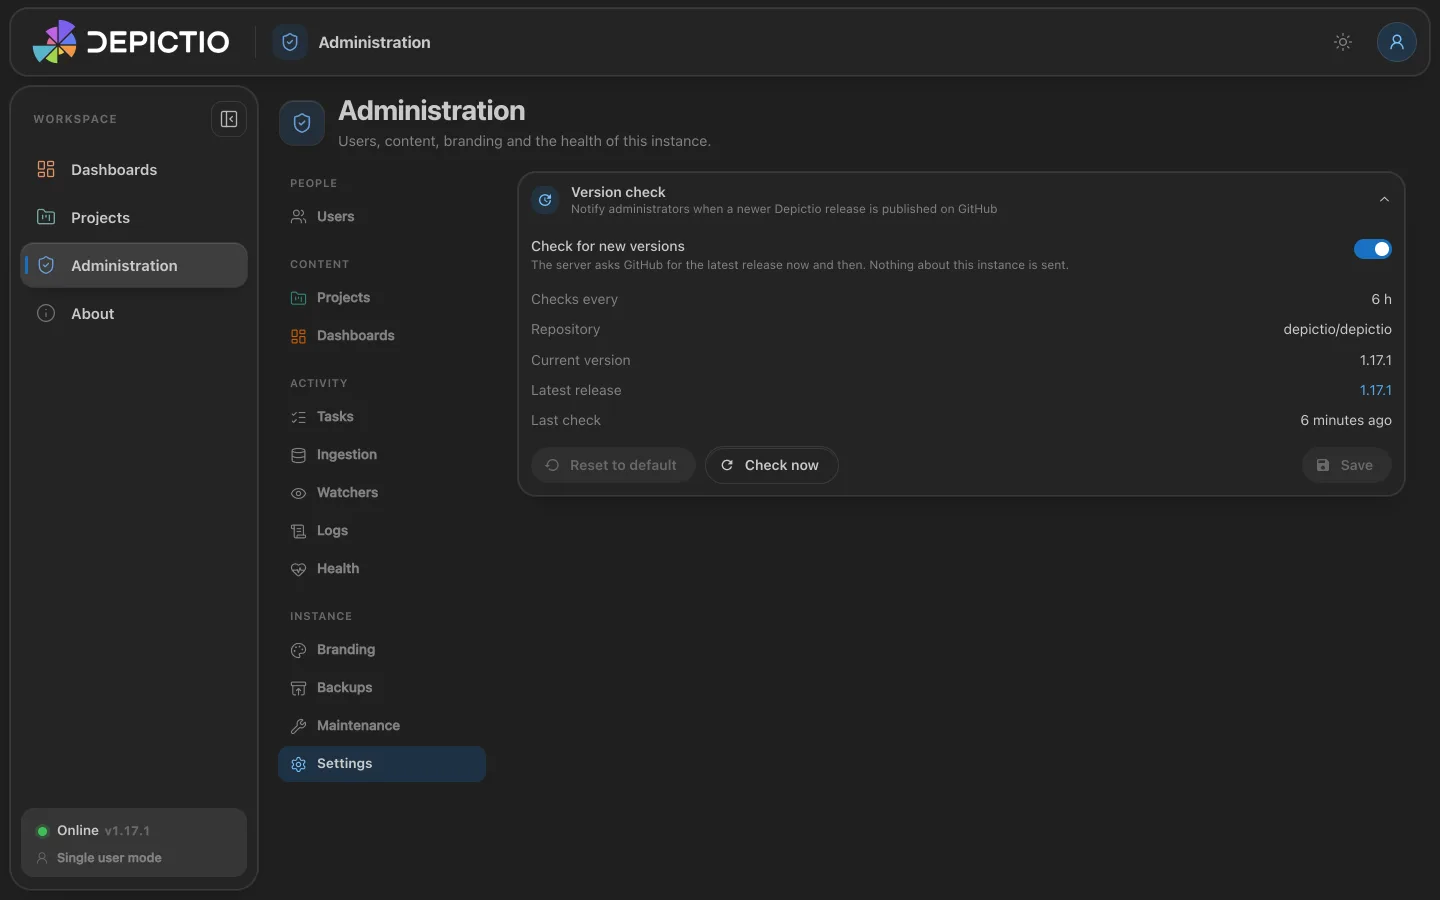
The check is on by default and the switch turns it off for the instance. Setting
DEPICTIO_VERSION_CHECK_ENABLED to
true or false decides instead and locks the switch, for instances that must make no
outbound call.
Page reference
Depictio's main pages and their URLs:
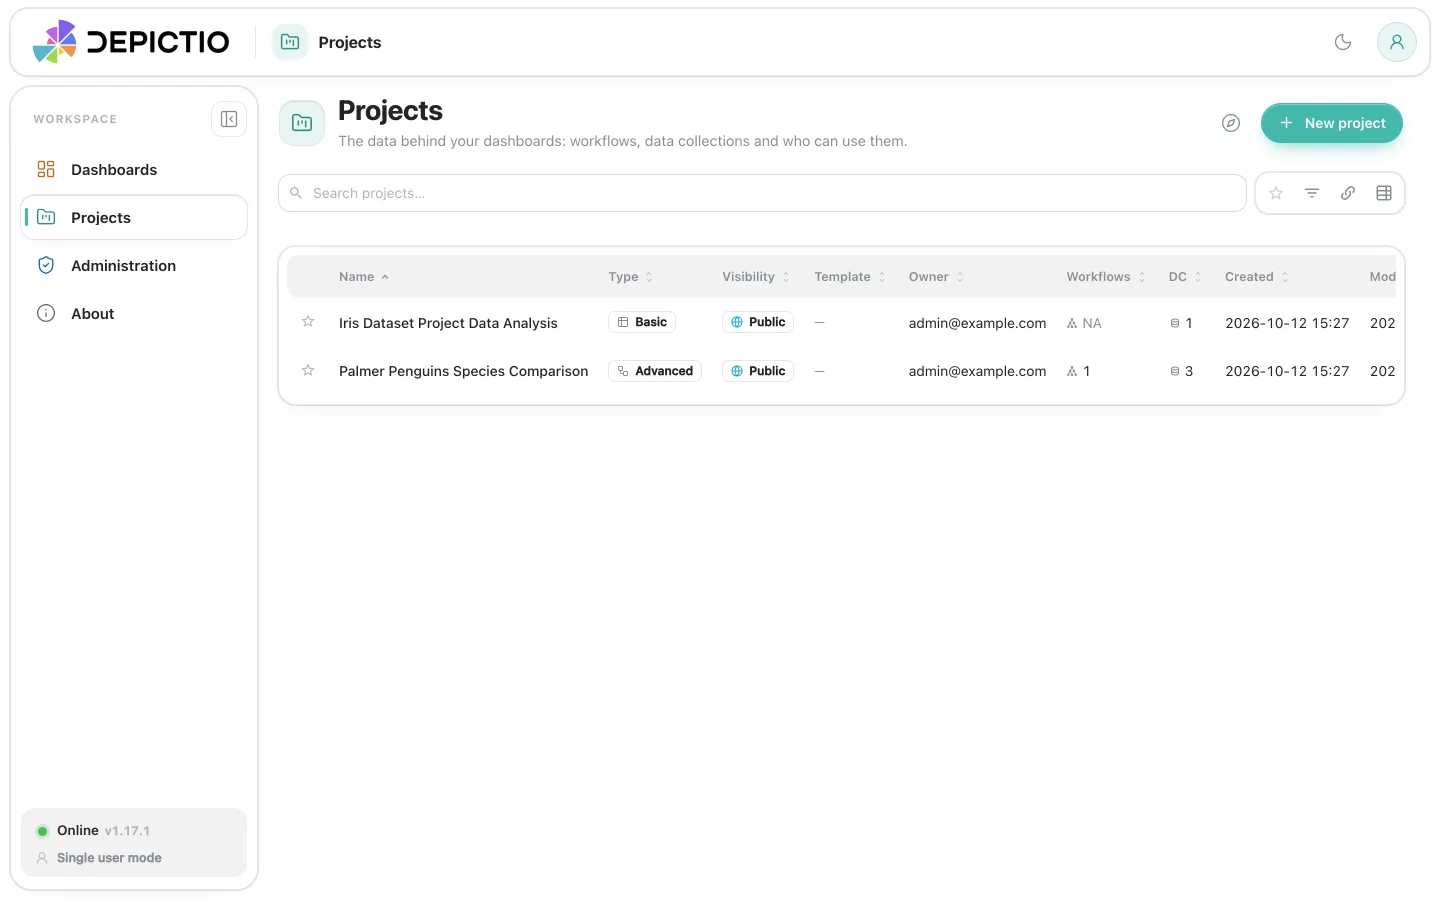
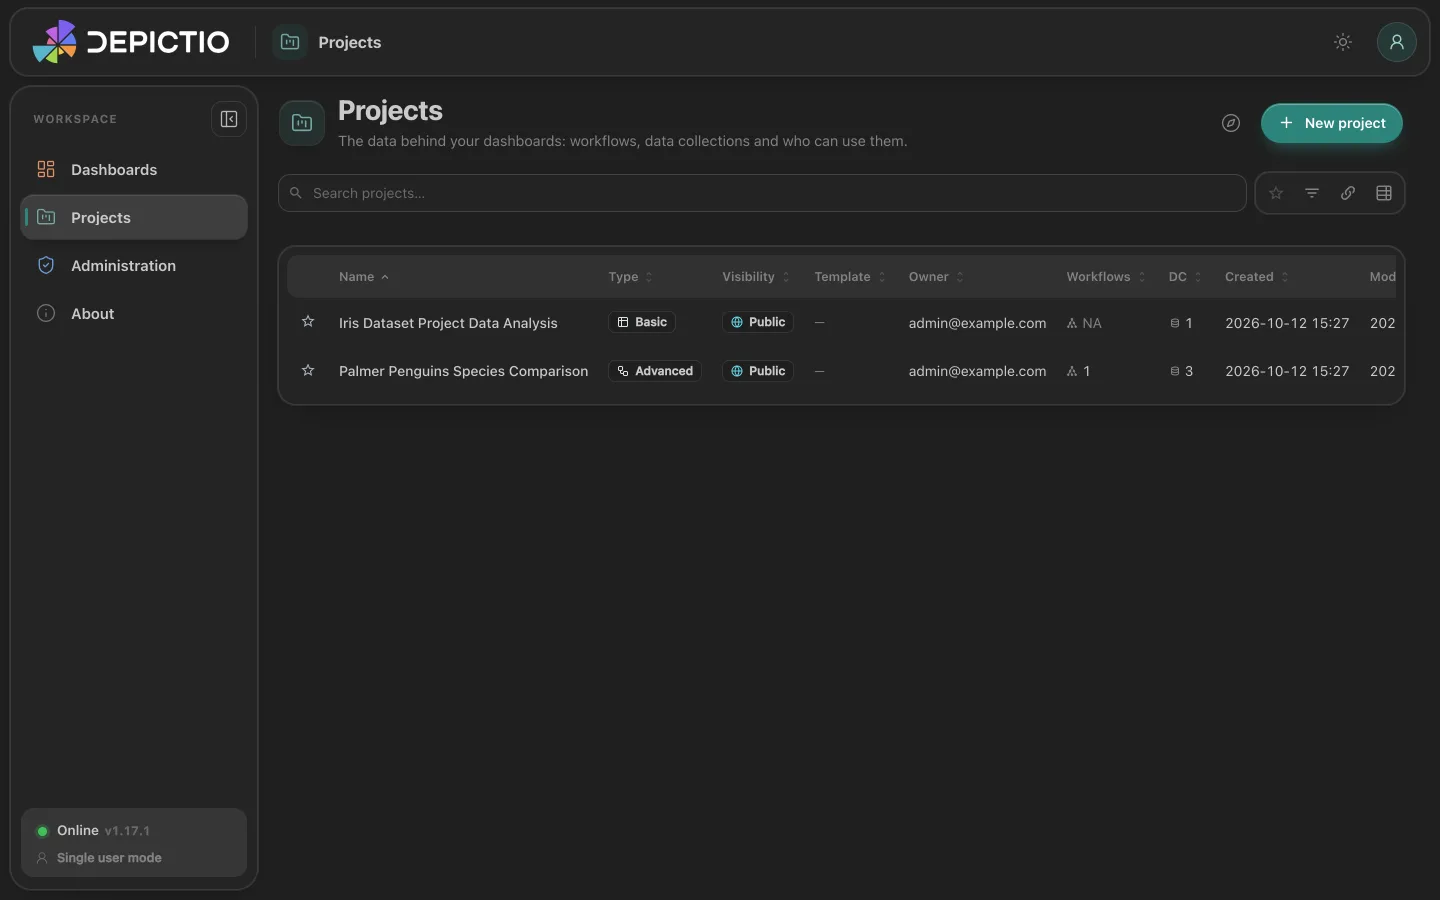
Projects list (/projects)
Project detail (/projects/{id})
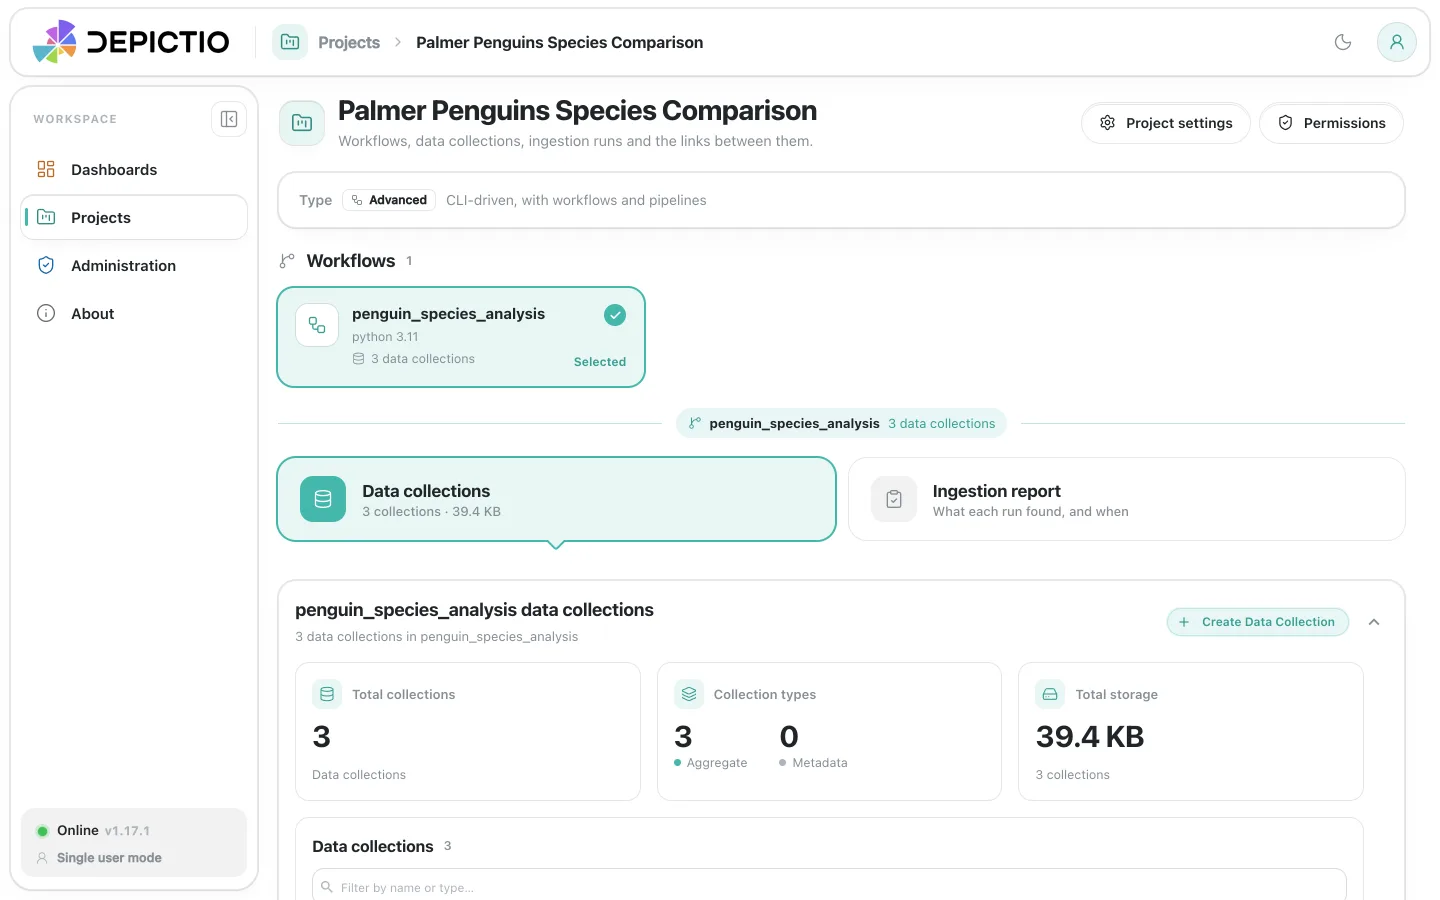
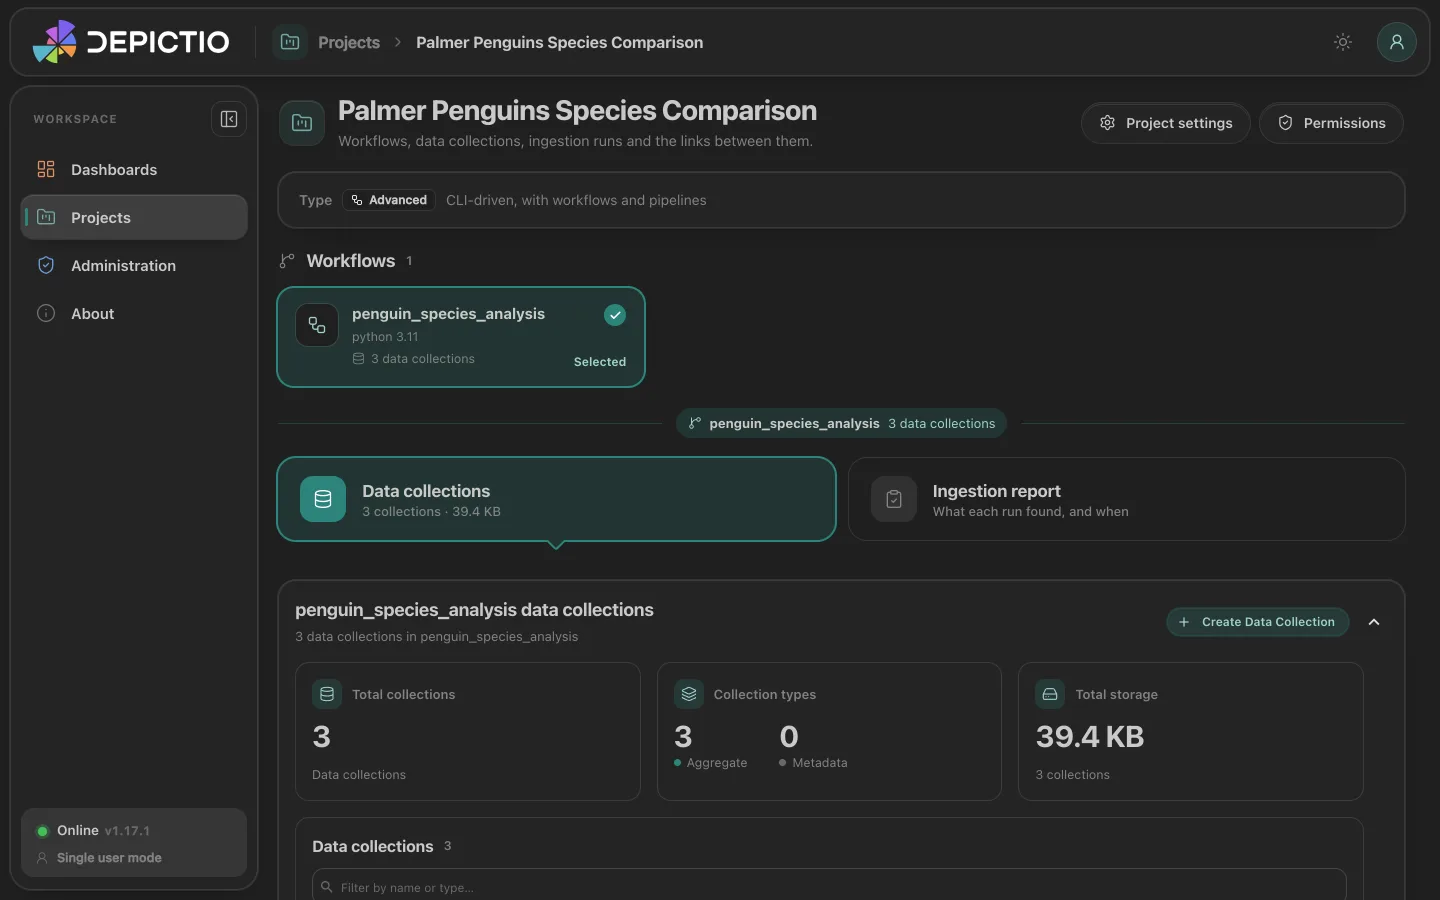
A single project's data. Since v1.17.0 the page starts with the project's type and its workflows, as cards to pick one from, then a switch between two views:
- Data collections — the project's workflows, a sortable, filterable table of its data collections, its cross-DC links, and the details of the selected collection. For a composed project, a Files the catalog did not recognise card lists the tables left out, with the command that adds each (v1.16.0+).
- Ingestion — the ingestion report, offered for every project since v1.6.0. For one created from a pipeline template it compares expected against ingested data collections; for any other it reads the collections the project declares today, and a Live project badge says so. Since v1.15.0 a History view lists the project's ingestion runs, and, where the server allows it, Run ingestion starts one from the browser.
Selecting a data collection shows its details, including its Delta version, and for a table a data preview and its Version history: see Dataset history.
You can reach this page directly by clicking the project badge shown on any dashboard card or in the dashboards table, or the project name in an open dashboard's Settings (v1.6.0+).
Data that is not on the server's own disk is handled in two places (v1.16.0+); the mechanisms are described on Remote data and manifests.
- Remote URL in Create Data Collection: the Table (CSV / TSV /
Parquet) tab offers Upload a file or Remote URL. With the latter,
paste an
https://ors3://address as the File URL (http://only when the server allows it); the name and format are filled in from its last segment. The server fetches the file, so it never travels through the browser, and a private bucket is read with the project's storage settings. MultiQC reports are uploaded only. - Project settings in the header, next to Permissions, opens three
sections; nothing is saved on close, each acts on its own button:
- Storage, for project owners and administrators: the endpoint, bucket, region and keys of a private bucket the project reads, with Test connection. See Project storage settings.
- Data refresh: re-read the collections that come from a manifest, a URL or a bucket, and rebuild their tables. See Refreshing the data.
- Export: package the project and its dashboards as a template bundle (zip). See Export a project as a template.
Data refresh and Export are for owners, editors and administrators; on a public instance, administrators only. The dialog opens on the section used last.
Dashboard viewer (/dashboard/{id})
Read-only dashboard with filters and component interactions.
Dashboard editor (/dashboard-edit/{id})
Design mode — add, configure, and arrange components.
CLI agents / tokens (/profile#cli-agents)
Generate and manage CLI configurations for the depictio CLI. Saved as ~/.depictio/CLI.yaml, a configuration is the server every CLI command uses by default. Since v1.17.0 they are a section of Account settings, and /cli-agents leads there.