

The hic template follows an nf-core/hic run from read pairs to chromatin architecture:
- Overview: the run in four key figures, live findings and four figures, each linked to the tab that explains it
- Data & QC: FastQC and HiC-Pro panels from the regenerated MultiQC report, and every read pair followed to the valid contacts
- Contacts: how contact probability falls off with distance, and the contact triangle with its domain, insulation and compartment tracks at one locus
- Architecture: TAD domain sizes and the A/B compartment split, genome-wide
The persistent Sample filters sit in the left panel, and a pick there reaches the
funnel, the matrix, every track and the P(s) curve through the project links.
The MultiQC report must be regenerated
hic 2.0.0 ships MultiQC 1.13, which writes no parquet, and Depictio reads
only multiqc.parquet (MultiQC 1.31 and later). Re-run MultiQC over the
run's own tool outputs before ingesting, or the MultiQC tab stays empty:
HiC-Pro's numbers are read twice, on purpose
The HiC-Pro panels stay on the MultiQC tab, because that is the report a
reader may already know. A MultiQC panel cannot be filtered or joined, so
hicpro/stats/<sample>/* is also read directly into a funnel row per sample
and a weighted row per read-pair fate, which is what the Valid pairs tab and
the Overview's key figures read.
Quick start
The results directory is the only required value. GENOME (default hg38) is the
UCSC name of the assembly the run was mapped to, which lays out the Contact
maps axis: pass the UCSC spelling (mm10, hg19), not an iGenomes key such
as GRCm38. The sample hub is the samplesheet the run validated,
samplesheet/samplesheet.valid.csv, collapsed to one row per sample.
depictio config nextflow --install     # once per machine
nextflow run nf-core/hic -r 2.0.0 -profile docker --outdir results
No depictio ingest, and no template named: the pipeline ingests its own
output directory when it finishes and resolves this template from its own
manifest. The MultiQC tab stays empty until the report is regenerated as
above. See Nextflow trigger.
Reference
The template reads the validated samplesheet, the regenerated MultiQC report,
HiC-Pro's statistics, the balanced cooler dump contacts and bins, the cooltools
compartment and insulation outputs, and hicexplorer's distance-decay curve. 51 of
its 53 tiles carry a use: catalog reference (hicpro/*, cooler/*,
cooltools/*, hicexplorer/*, multiqc/*), so a tile says where its panel
comes from.
Self-adapting layout
The dashboard adapts to whatever the run actually produced: components bound to pruned or unparsed data collections are hidden, tabs left with no real visualizations are dropped entirely, and the remaining components are re-packed so there are no empty rows.
Template variables
Variables you provide when running the template: DATA_ROOT is the results directory given to depictio ingest, the others are set with --var NAME=value:
| Variable | Required | Description |
|---|---|---|
DATA_ROOT |
✓ | Root directory containing hic output (compartments/, contact_maps/, distance_decay/, fastqc/, hicpro/stats/, tads/, pipeline_info/) plus the reprocessed multiqc/multiqc_data/multiqc.parquet. |
GENOME |
— | UCSC name of the assembly the run was mapped to (hg38, hg19, mm10, mm39, ...). Lays out the genomic axis of the Contact maps tracks; pass the UCSC spelling, not an iGenomes key such as GRCm38. |
Data collections
19 data collections — 19 required 0 optional · 10 direct 9 derived.
Origin tells you whether a collection is real pipeline data or a reshape of it: direct = a pipeline output (scanned, or a recipe that reads raw files); derived = a recipe that reshapes one or more direct collections into the layout a visualization needs (no new measurement). Reads shows what produces it: a recipe .py transform, whose name links to its source on GitHub, or a raw file scanned off disk. (A direct collection can still have a recipe — one that merely parses/cleans the raw file; derived means the recipe reshapes another collection.)
| Tag | Origin | Type | Reads | Status |
|---|---|---|---|---|
samples |
direct | Table | recipe nf-core/hic/samples.py |
required |
samplesheet |
direct | Table | file samplesheet.valid.csv$ |
required |
multiqc_data |
direct |  MultiQC MultiQC |
file (?:.*/)?multiqc(?:/[^/]+)?/multiqc_data/multiqc.parquet$ |
required |
hicpro_stats_raw |
direct | Table | file .*.(mmapstat|mpairstat|mRSstat|mergestat)$ |
required |
pair_stats |
derived | Table | recipe hicpro/pair_stats.py |
required |
pair_flow |
derived | Table | recipe hicpro/pair_flow.py |
required |
cooler_contacts_raw |
direct | Table | file .*_balanced.txt$ |
required |
cooler_bins_raw |
direct | Table | file cooler_bins_\d+.bed$ |
required |
contact_matrix |
derived | Table | recipe cooler/contact_matrix.py |
required |
distance_profile |
derived | Table | recipe cooltools/distance_profile.py |
required |
cooltools_eigenvector_raw |
direct | Table | file .*.cis.vecs.tsv$ |
required |
compartment_eigenvector |
derived | Table | recipe cooltools/eigenvector.py |
required |
cooltools_eigenvalues_raw |
direct | Table | file .*.cis.lam.txt$ |
required |
compartment_eigenvalues |
derived | Table | recipe cooltools/eigenvalues.py |
required |
cooltools_insulation_raw |
direct | Table | file .*_balanced_insulation.tsv$ |
required |
tad_insulation |
derived | Table | recipe cooltools/insulation.py |
required |
tad_domains |
derived | Table | recipe cooltools/domains.py |
required |
hicexplorer_distance_decay_raw |
direct | Table | file .*_distcount.txt$ |
required |
distance_decay |
derived | Table | recipe hicexplorer/distance_decay.py |
required |
Cross-DC links
13 links — selecting a value in the source collection filters the target. The join column is shown after the source.
| Source · column | Target | Filters | |
|---|---|---|---|
samples · sample_id |
→ | multiqc_data |
Filter the MultiQC panels by the samples picked in the left panel |
samples · sample_id |
→ | pair_stats |
Filter the valid-pair funnel by the samples picked in the left panel |
samples · sample_id |
→ | pair_flow |
Filter the read-pair fates by the samples picked in the left panel |
samples · sample_id |
→ | distance_profile |
Filter the contact-probability curve by the samples picked in the left panel |
samples · sample_id |
→ | tad_domains |
Filter the TAD domains by the samples picked in the left panel |
samples · sample_id |
→ | contact_matrix |
Filter the contact matrix by the samples picked in the left panel |
samples · sample_id |
→ | compartment_eigenvector |
Filter the compartment track by the samples picked in the left panel |
samples · sample_id |
→ | compartment_eigenvalues |
Filter the compartment eigenvalues by the samples picked in the left panel |
samples · sample_id |
→ | tad_insulation |
Filter the insulation track by the samples picked in the left panel |
samples · sample_id |
→ | distance_decay |
Filter the distance-decay curve by the samples picked in the left panel |
tad_domains · chrom |
→ | contact_matrix |
A region brushed or typed on the TAD domain track narrows the contact matrix |
tad_domains · chrom |
→ | tad_insulation |
A region brushed or typed on the TAD domain track narrows the insulation track |
tad_domains · chrom |
→ | compartment_eigenvector |
A region brushed or typed on the TAD domain track narrows the compartment track |
Recipes
Each recipe reshapes raw pipeline output into a tidy table. The name links to its source; Output lists the validated OUTPUT_SCHEMA columns.
| Recipe | Transforms | Output |
|---|---|---|
cooler/contact_matrix.py |
Binned intra-chromosomal contact matrix, from a cooler dump joined to its bins. | sample, resolution, chrom1, start1, end1, chrom2, start2, end2, count |
cooltools/distance_profile.py |
P(s): contact probability against genomic distance, per chromosome and pooled. | sample, resolution, chrom, distance, contact_probability, log10_slope, observed, n_possible |
cooltools/domains.py |
TAD intervals derived from the insulation track's boundary calls. | sample, resolution, window, chrom, start, end, size, size_kb, n_bins, valid_fraction, region, left_boundary_strength, right_boundary_strength |
cooltools/eigenvalues.py |
A/B compartment eigenvalues, one row per chromosome. | sample, resolution, chrom, eigval1, eigval2, eigval3 |
cooltools/eigenvector.py |
A/B compartment eigenvector track, one row per genomic bin. | sample, resolution, chrom, start, end, weight, E1, compartment, E2, E3 |
cooltools/insulation.py |
TAD insulation score and boundary calls, one row per genomic bin per window. | sample, resolution, chrom, start, end, region, is_bad_bin, window, log2_insulation_score, n_valid_pixels, boundary_strength, is_boundary |
hicexplorer/distance_decay.py |
Contact probability against genomic distance, one row per distance bin. | sample, resolution, chromosome, distance, contacts, number_bins, scale_factor |
hicpro/pair_flow.py |
Where a Hi-C library's read pairs end up, one weighted row per fate. | sample, mapping, filtering, contacts, pairs |
hicpro/pair_stats.py |
The HiC-Pro valid-pair funnel, one wide row per sample. | sample, total_pairs, unmapped_pairs, low_qual_pairs, singleton_pairs, reported_pairs, valid_pairs, dangling_end_pairs, religation_pairs, self_circle_pairs, dumped_pairs, valid_pairs_rmdup, cis_pairs, trans_pairs, cis_short_range, cis_long_range, total_reads, mapped_r1, mapped_r2, trimmed_r1, trimmed_r2, mapping_rate_r1, mapping_rate_r2, low_qual_rate, valid_pair_rate, duplicate_rate, cis_ratio, trans_ratio, long_range_ratio |
nf-core/hic/samples.py |
One row per Hi-C sample, from the samplesheet the pipeline validated. | sample_id, n_libraries, single_end |
Dashboard tabs
One dashboard: the Overview, then six child tabs in three groups, read as a funnel from the read pairs to the domains and compartments of the genome. Each tab below carries the same icon and colour the dashboard gives it, so the page and the app read alike.
| Group | Tabs |
|---|---|
| Data & QC | MultiQC, Valid pairs |
| Contacts | Distance decay, Contact maps |
| Architecture | Domains, Compartments |
Each child tab opens with a short intro and a strip of four cards, then at most three open sections; tables follow, collapsed. The template has no group column: the sample hub carries the sample id and the FASTQ pairs merged into it, and every collection carries a sample column. The persistent Sample filters (the sample) sit in the left panel and narrow every tab through the project links. The Sample sheet is pinned, collapsed, to the bottom of every child tab.
Chromatin conformation, from read pairs to domains and compartments.
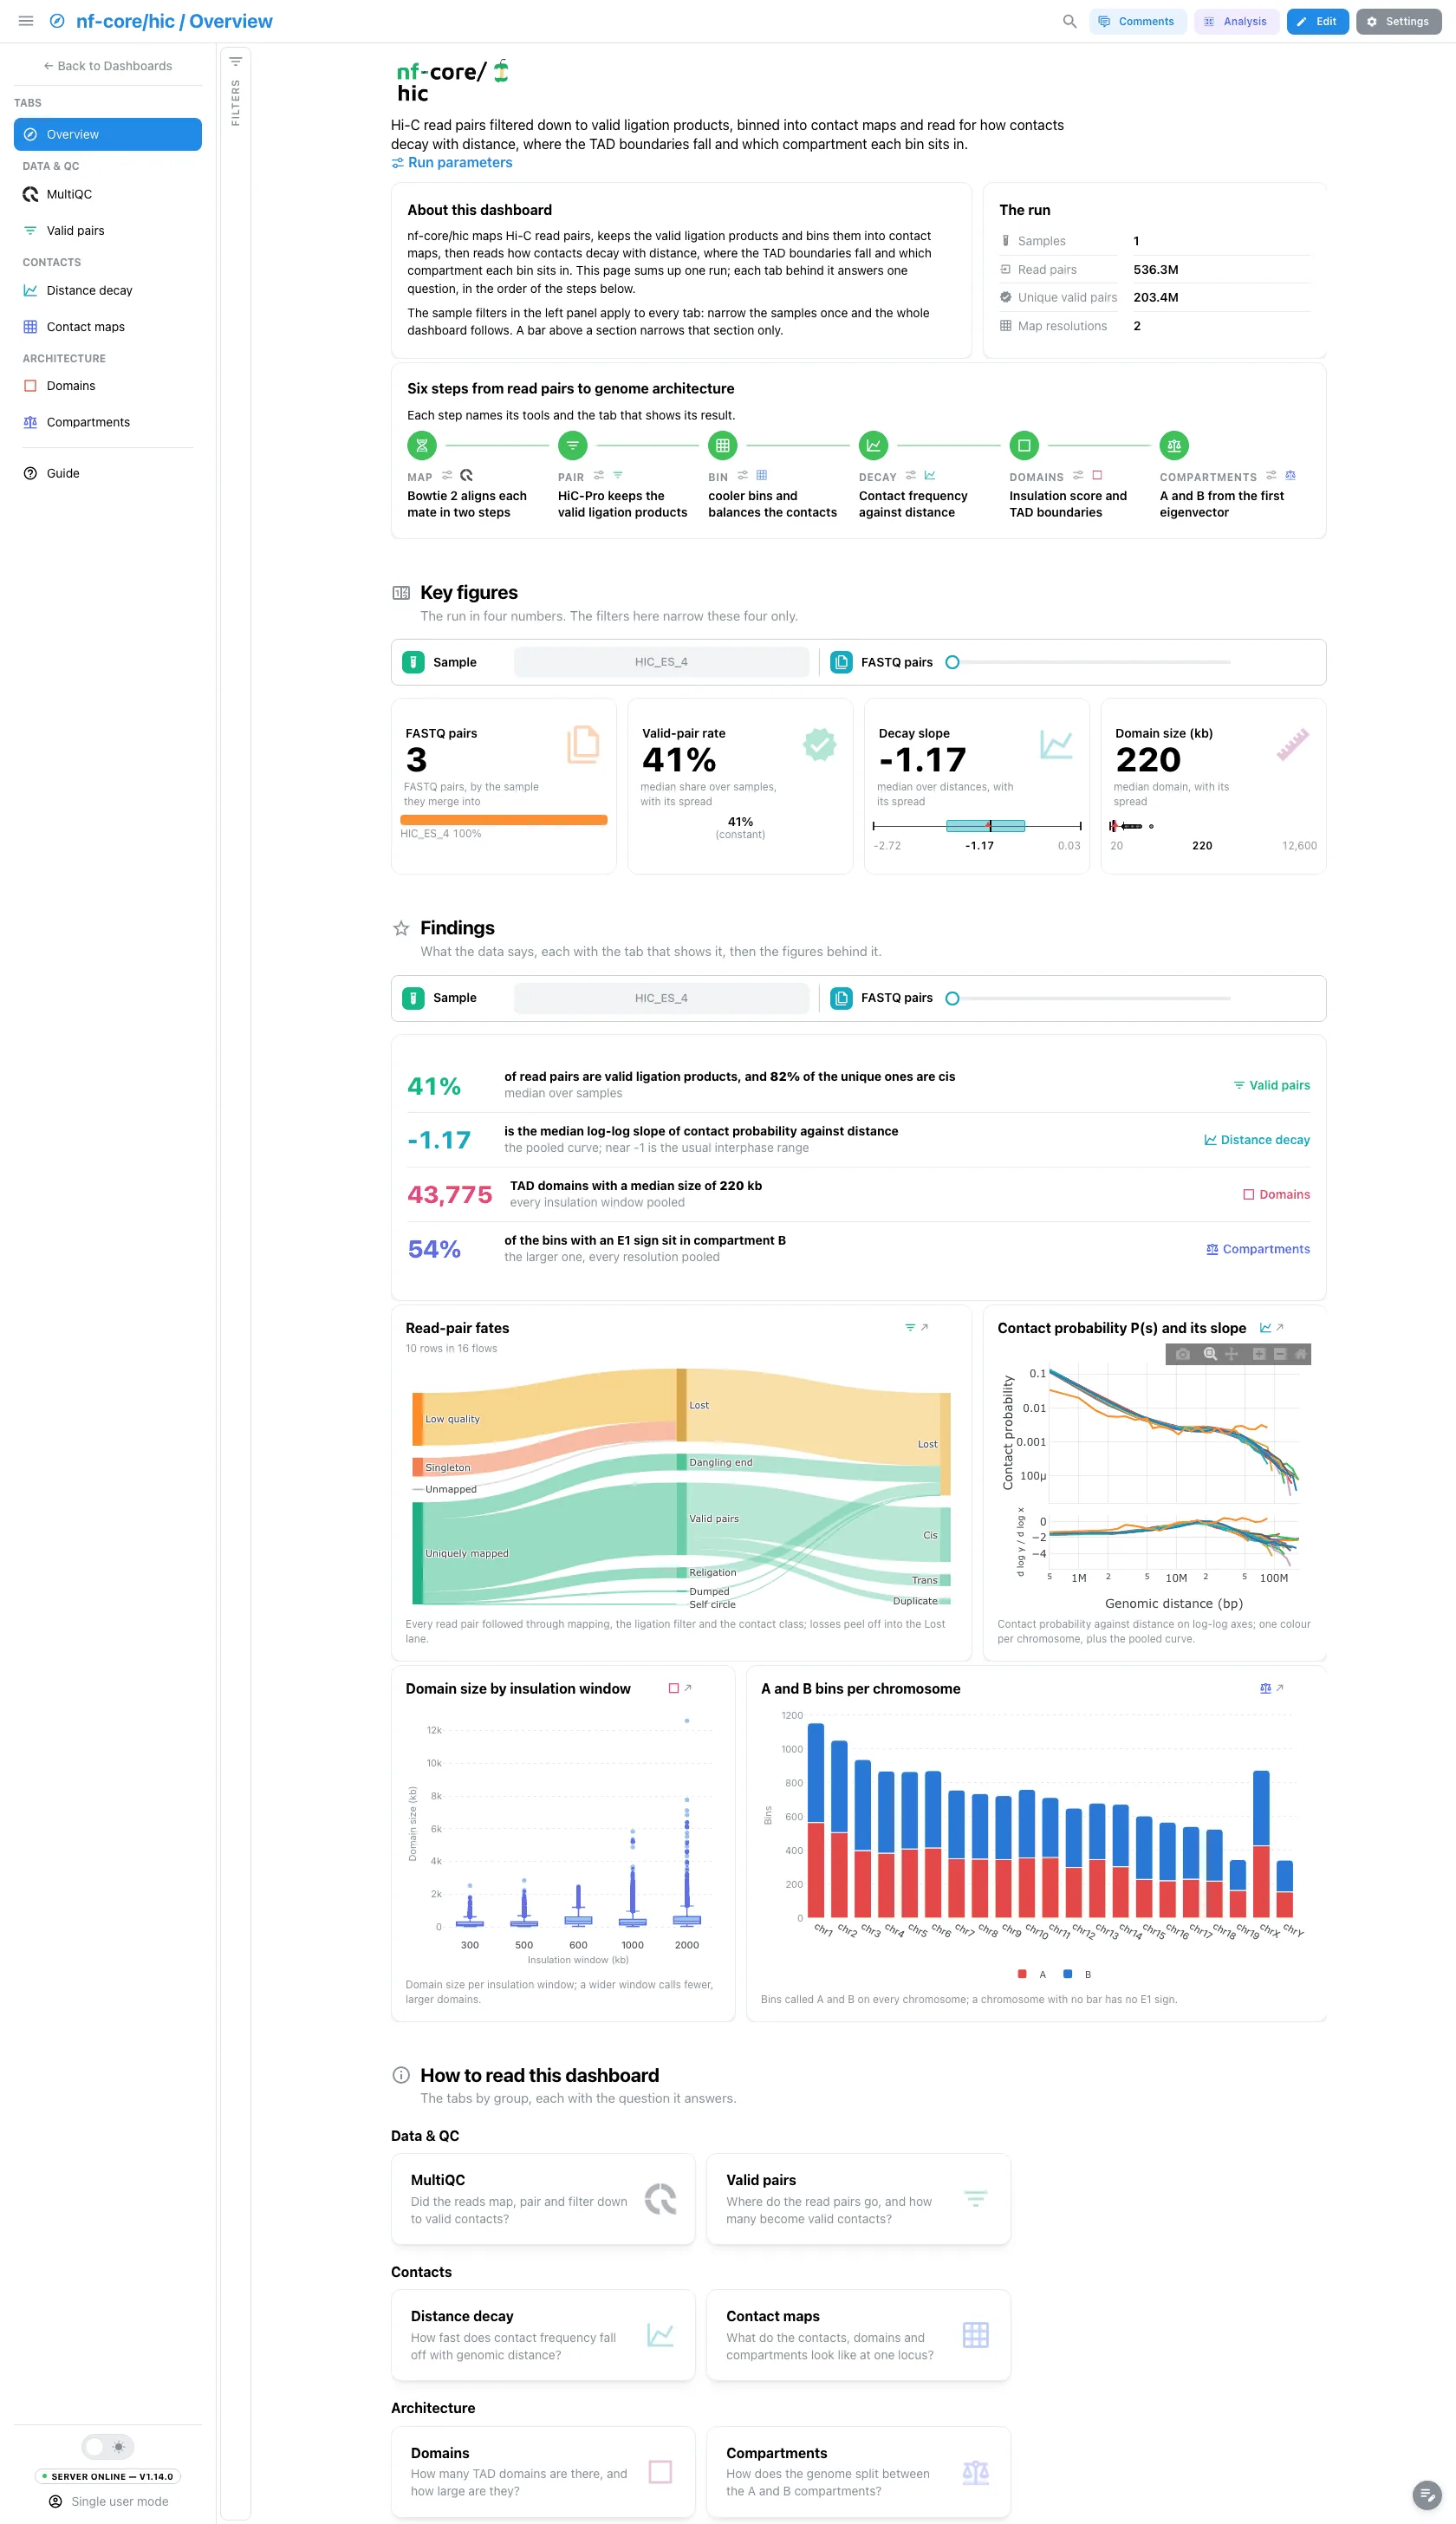
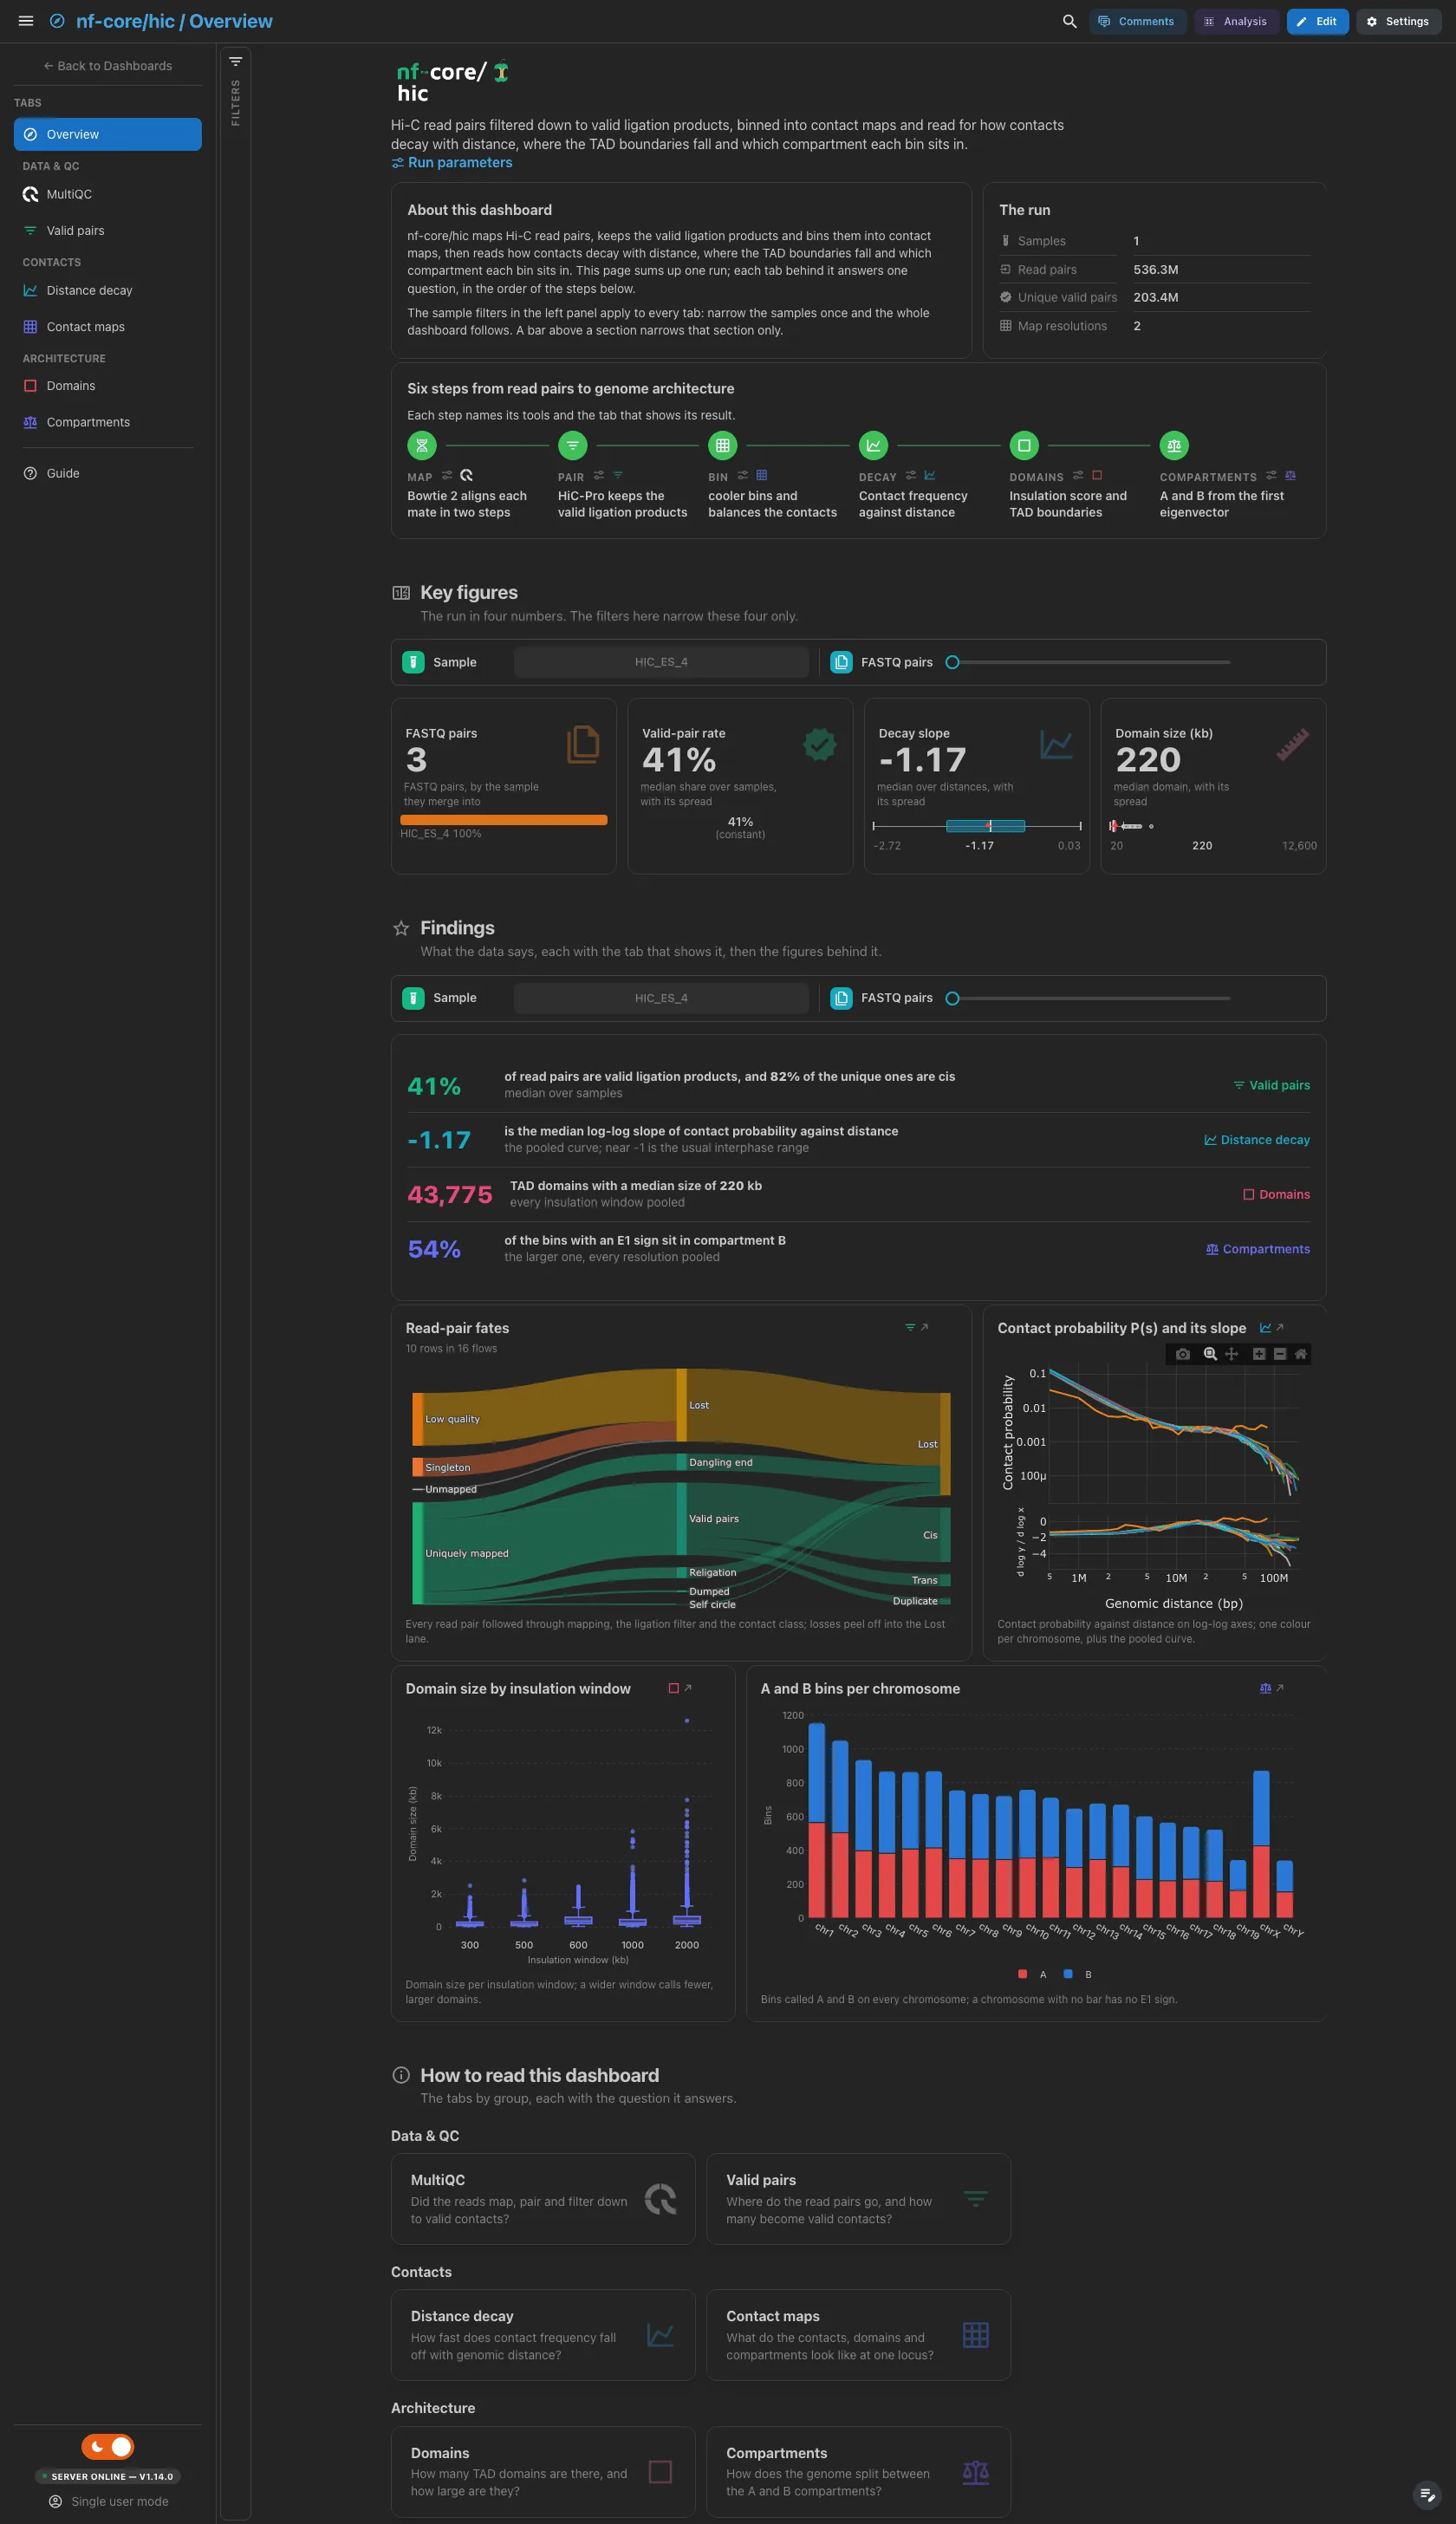
A short hero links the run's provenance: hic 2.0.0 writes no params.json, so
the dialog holds the software versions. About this dashboard says how the two
filter levels work, The run lists facts read from the data (samples, read
pairs, unique valid pairs, map resolutions), and Pipeline walks the six steps
from mapping to compartments, each linked to the versions of its process and
its tab. The findings are live values: they follow the filters. Contact maps
has no figure here, because it is a browser on one region, not a summary.
Filters and components
Filters · the left panel starts collapsed. Key figures and Findings each have their own filter bar (the sample and a FASTQ-pairs range): each narrows its own section only.
| Section | What it holds |
|---|---|
| Top | Hero, About this dashboard, The run, Pipeline |
| Key figures | 4 headline cards: FASTQ pairs, valid-pair rate, decay slope, domain size |
| Findings | Live result rows, then 4 figures: the read-pair flow, the contact probability curve, the domain size per insulation window and the A and B bins per chromosome |
| How to read this dashboard | The tabs by group, each with its question |
Data & QC · Did the reads map, pair and filter down to valid contacts?
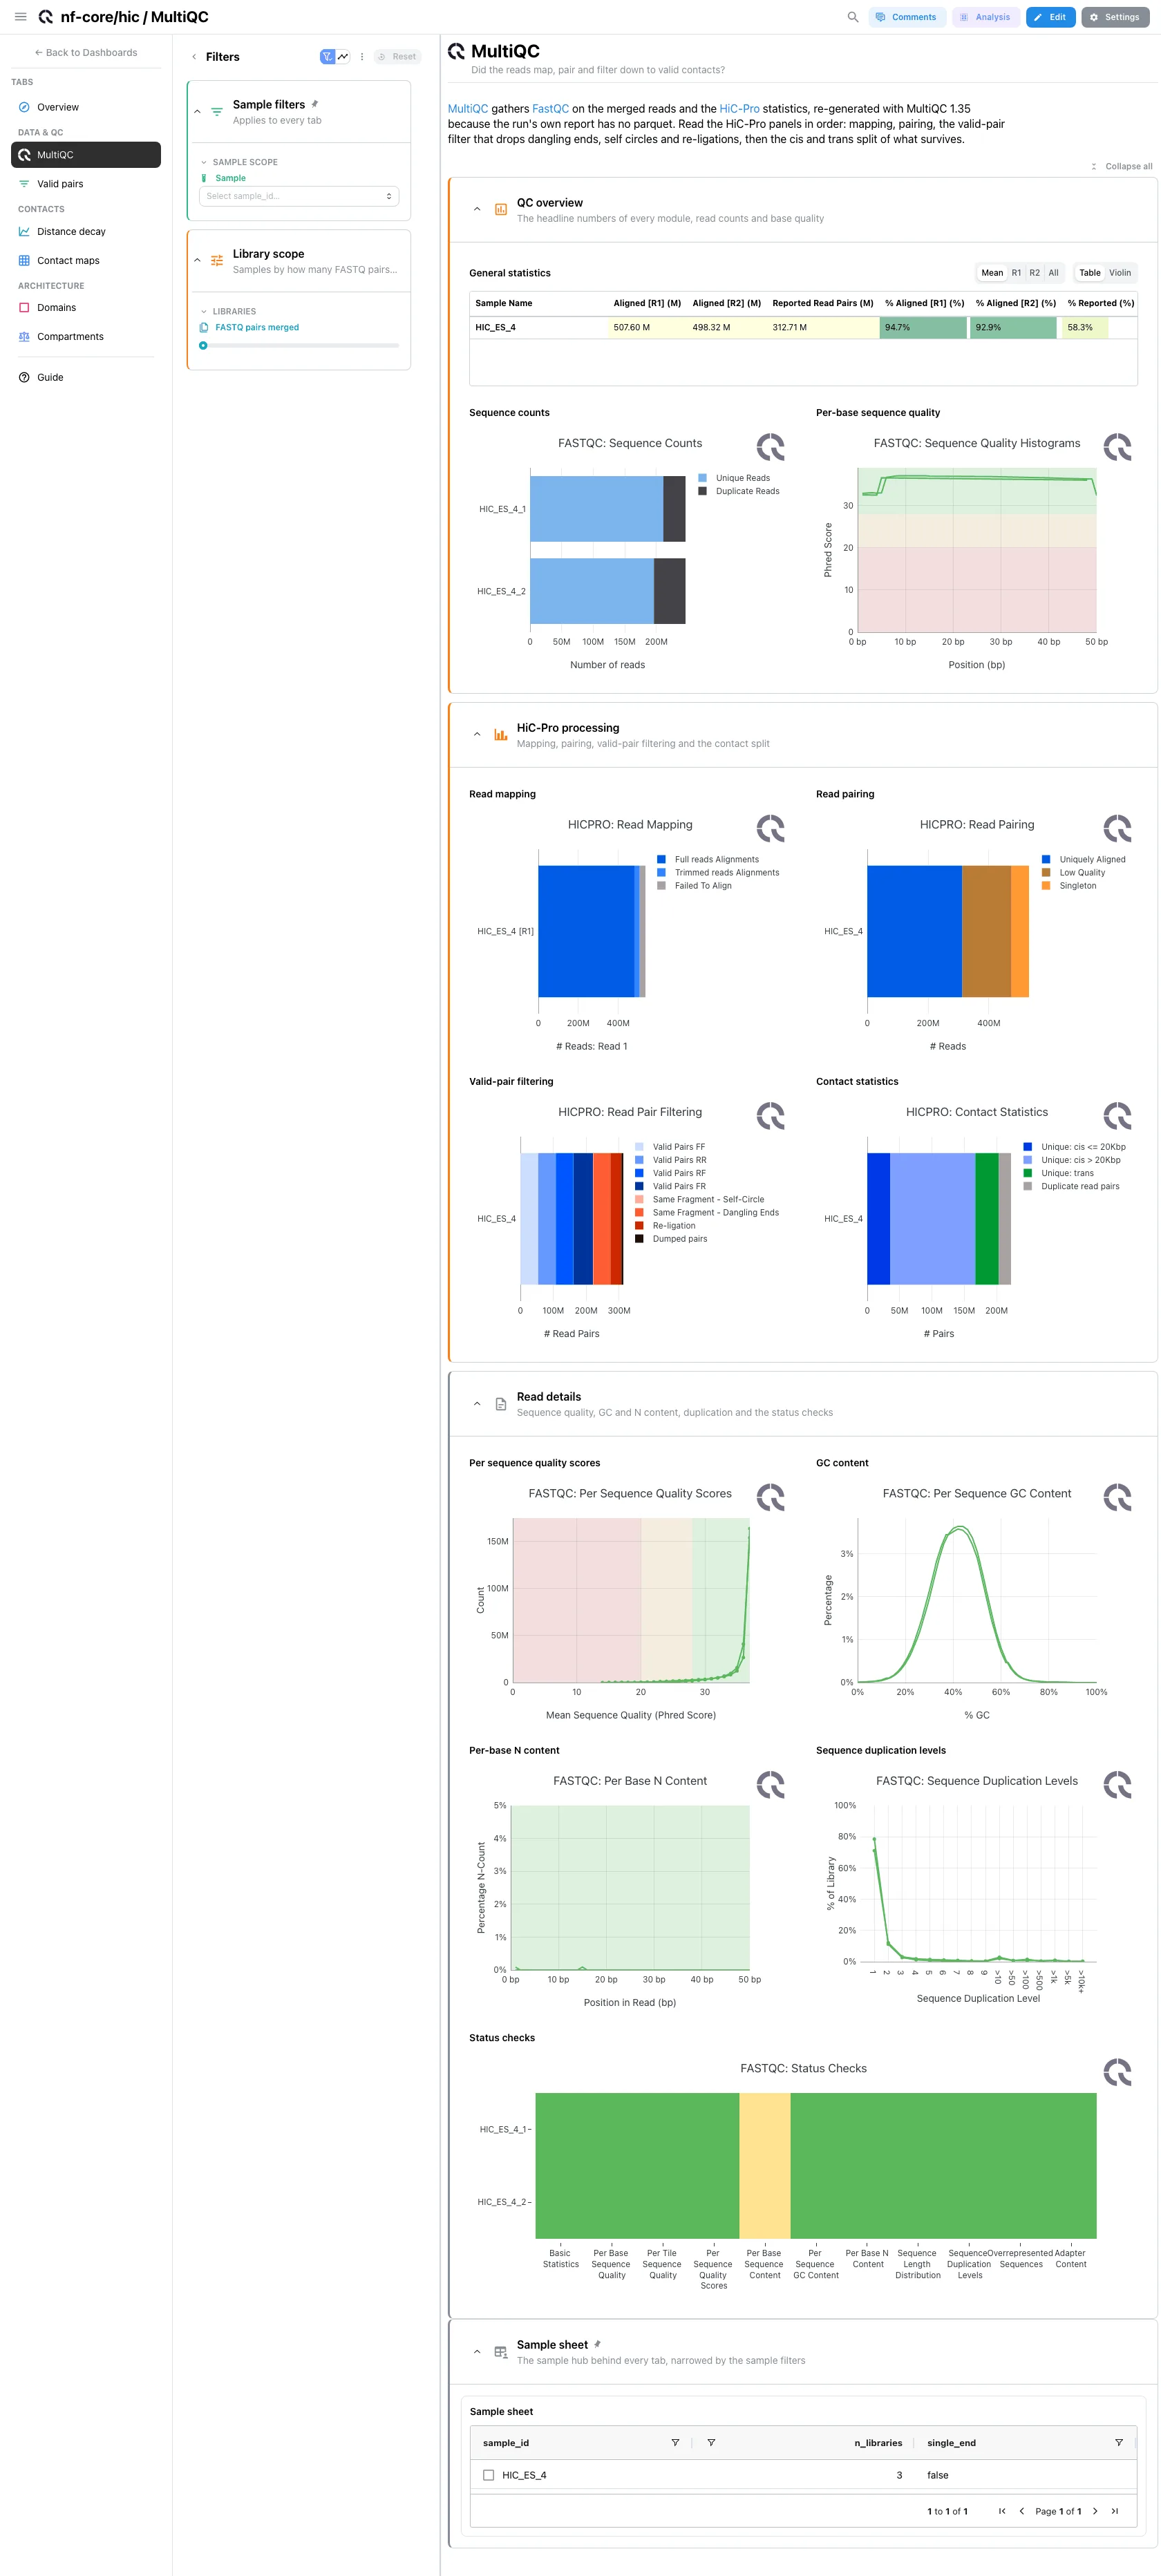
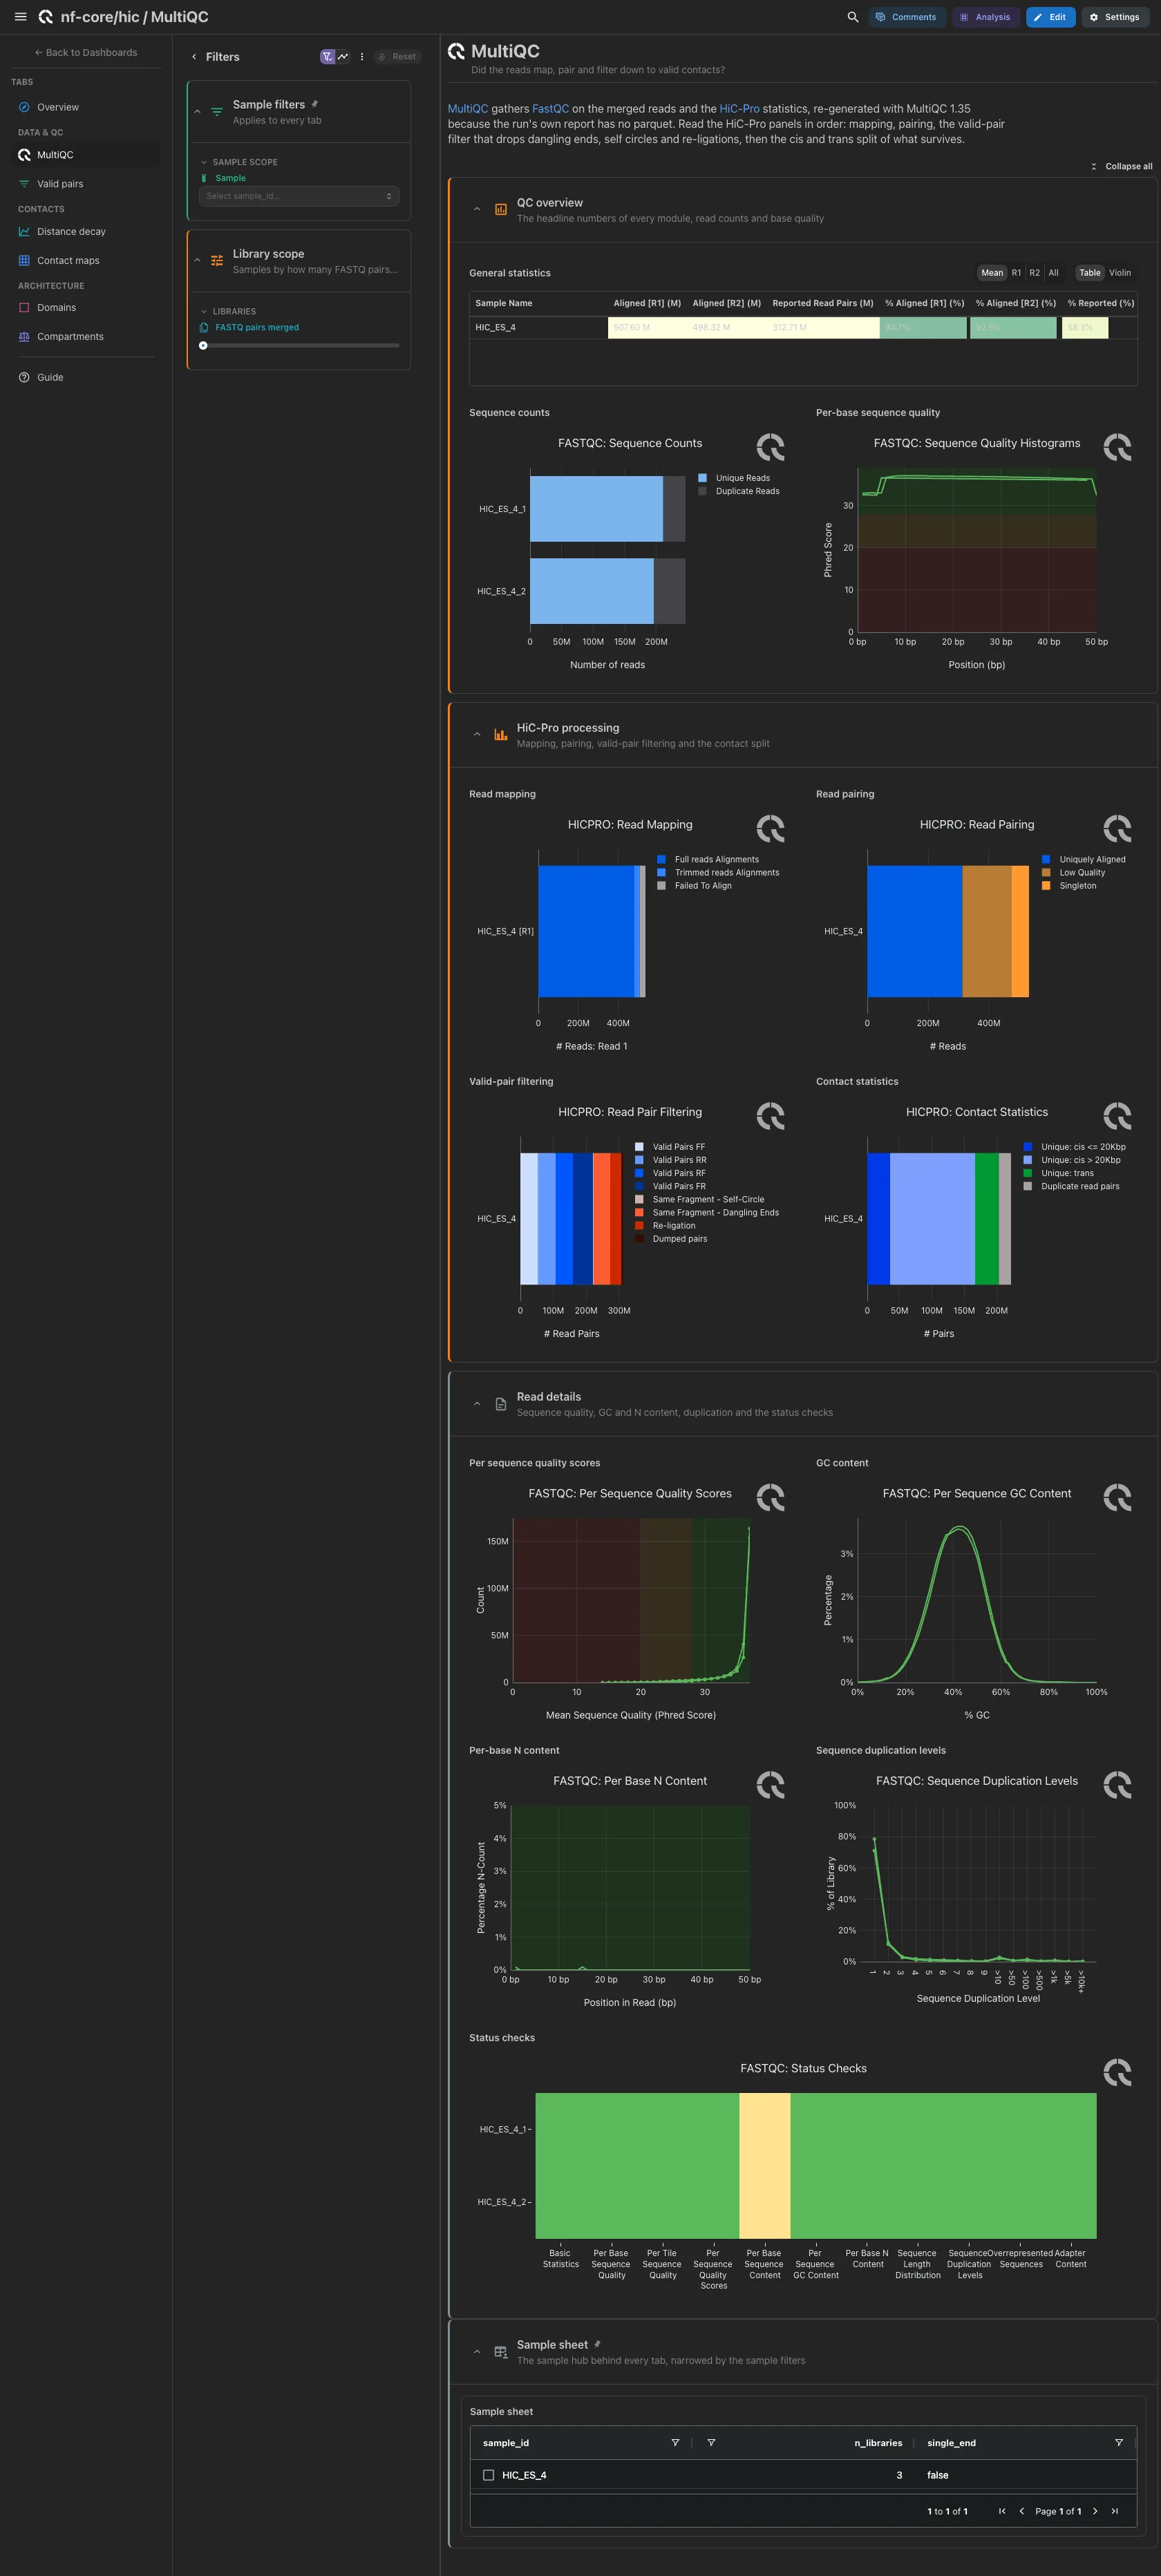
MultiQC panels only, from the regenerated report. Open: general statistics, FastQC sequence counts and per-base quality, then HiC-Pro's read mapping, read pairing, valid-pair filtering (dangling ends, self circles and re-ligations dropped) and contact statistics. The other FastQC panels are collapsed. There is no trimming module: HiC-Pro's mapping step trims.
Filters and components
Filters · a FASTQ pairs merged range on the sample hub, which links
into the report.
| Section | What it holds |
|---|---|
| QC overview | 3 MultiQC panels |
| HiC-Pro processing | 4 MultiQC panels |
| Read details (collapsed) | 5 MultiQC panels |
Data & QC · Where do the read pairs go, and how many become valid contacts?
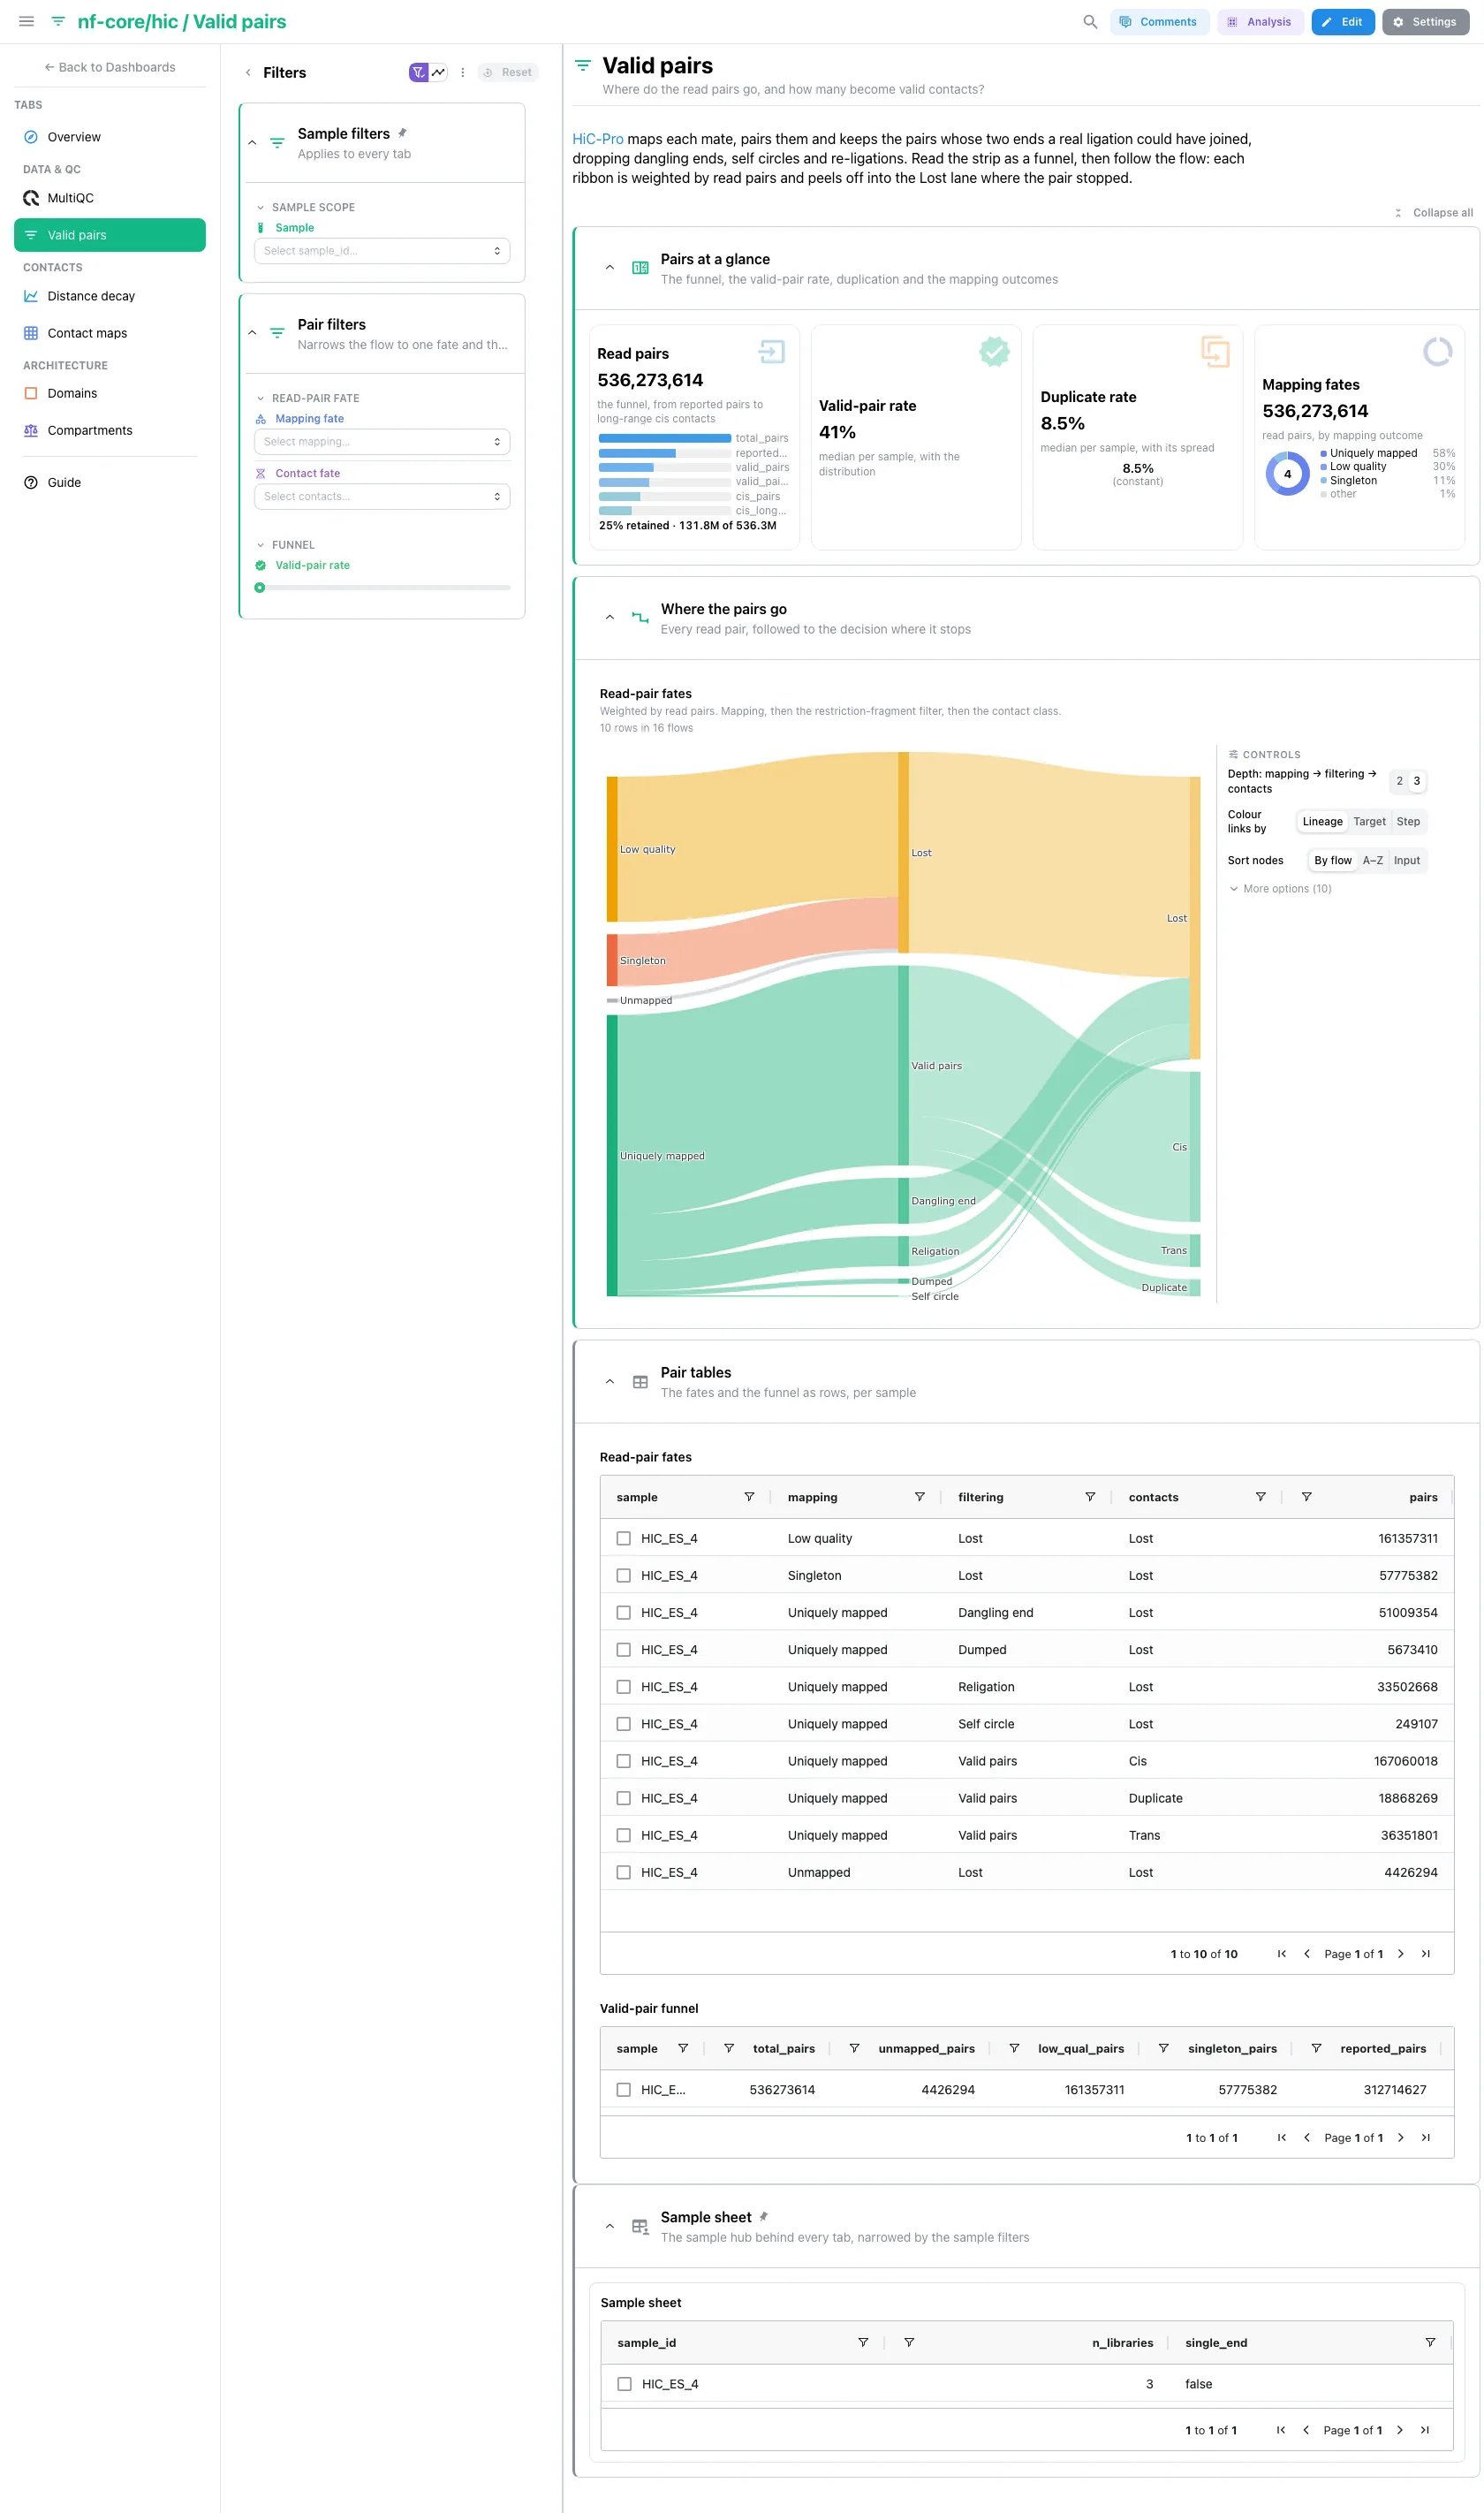
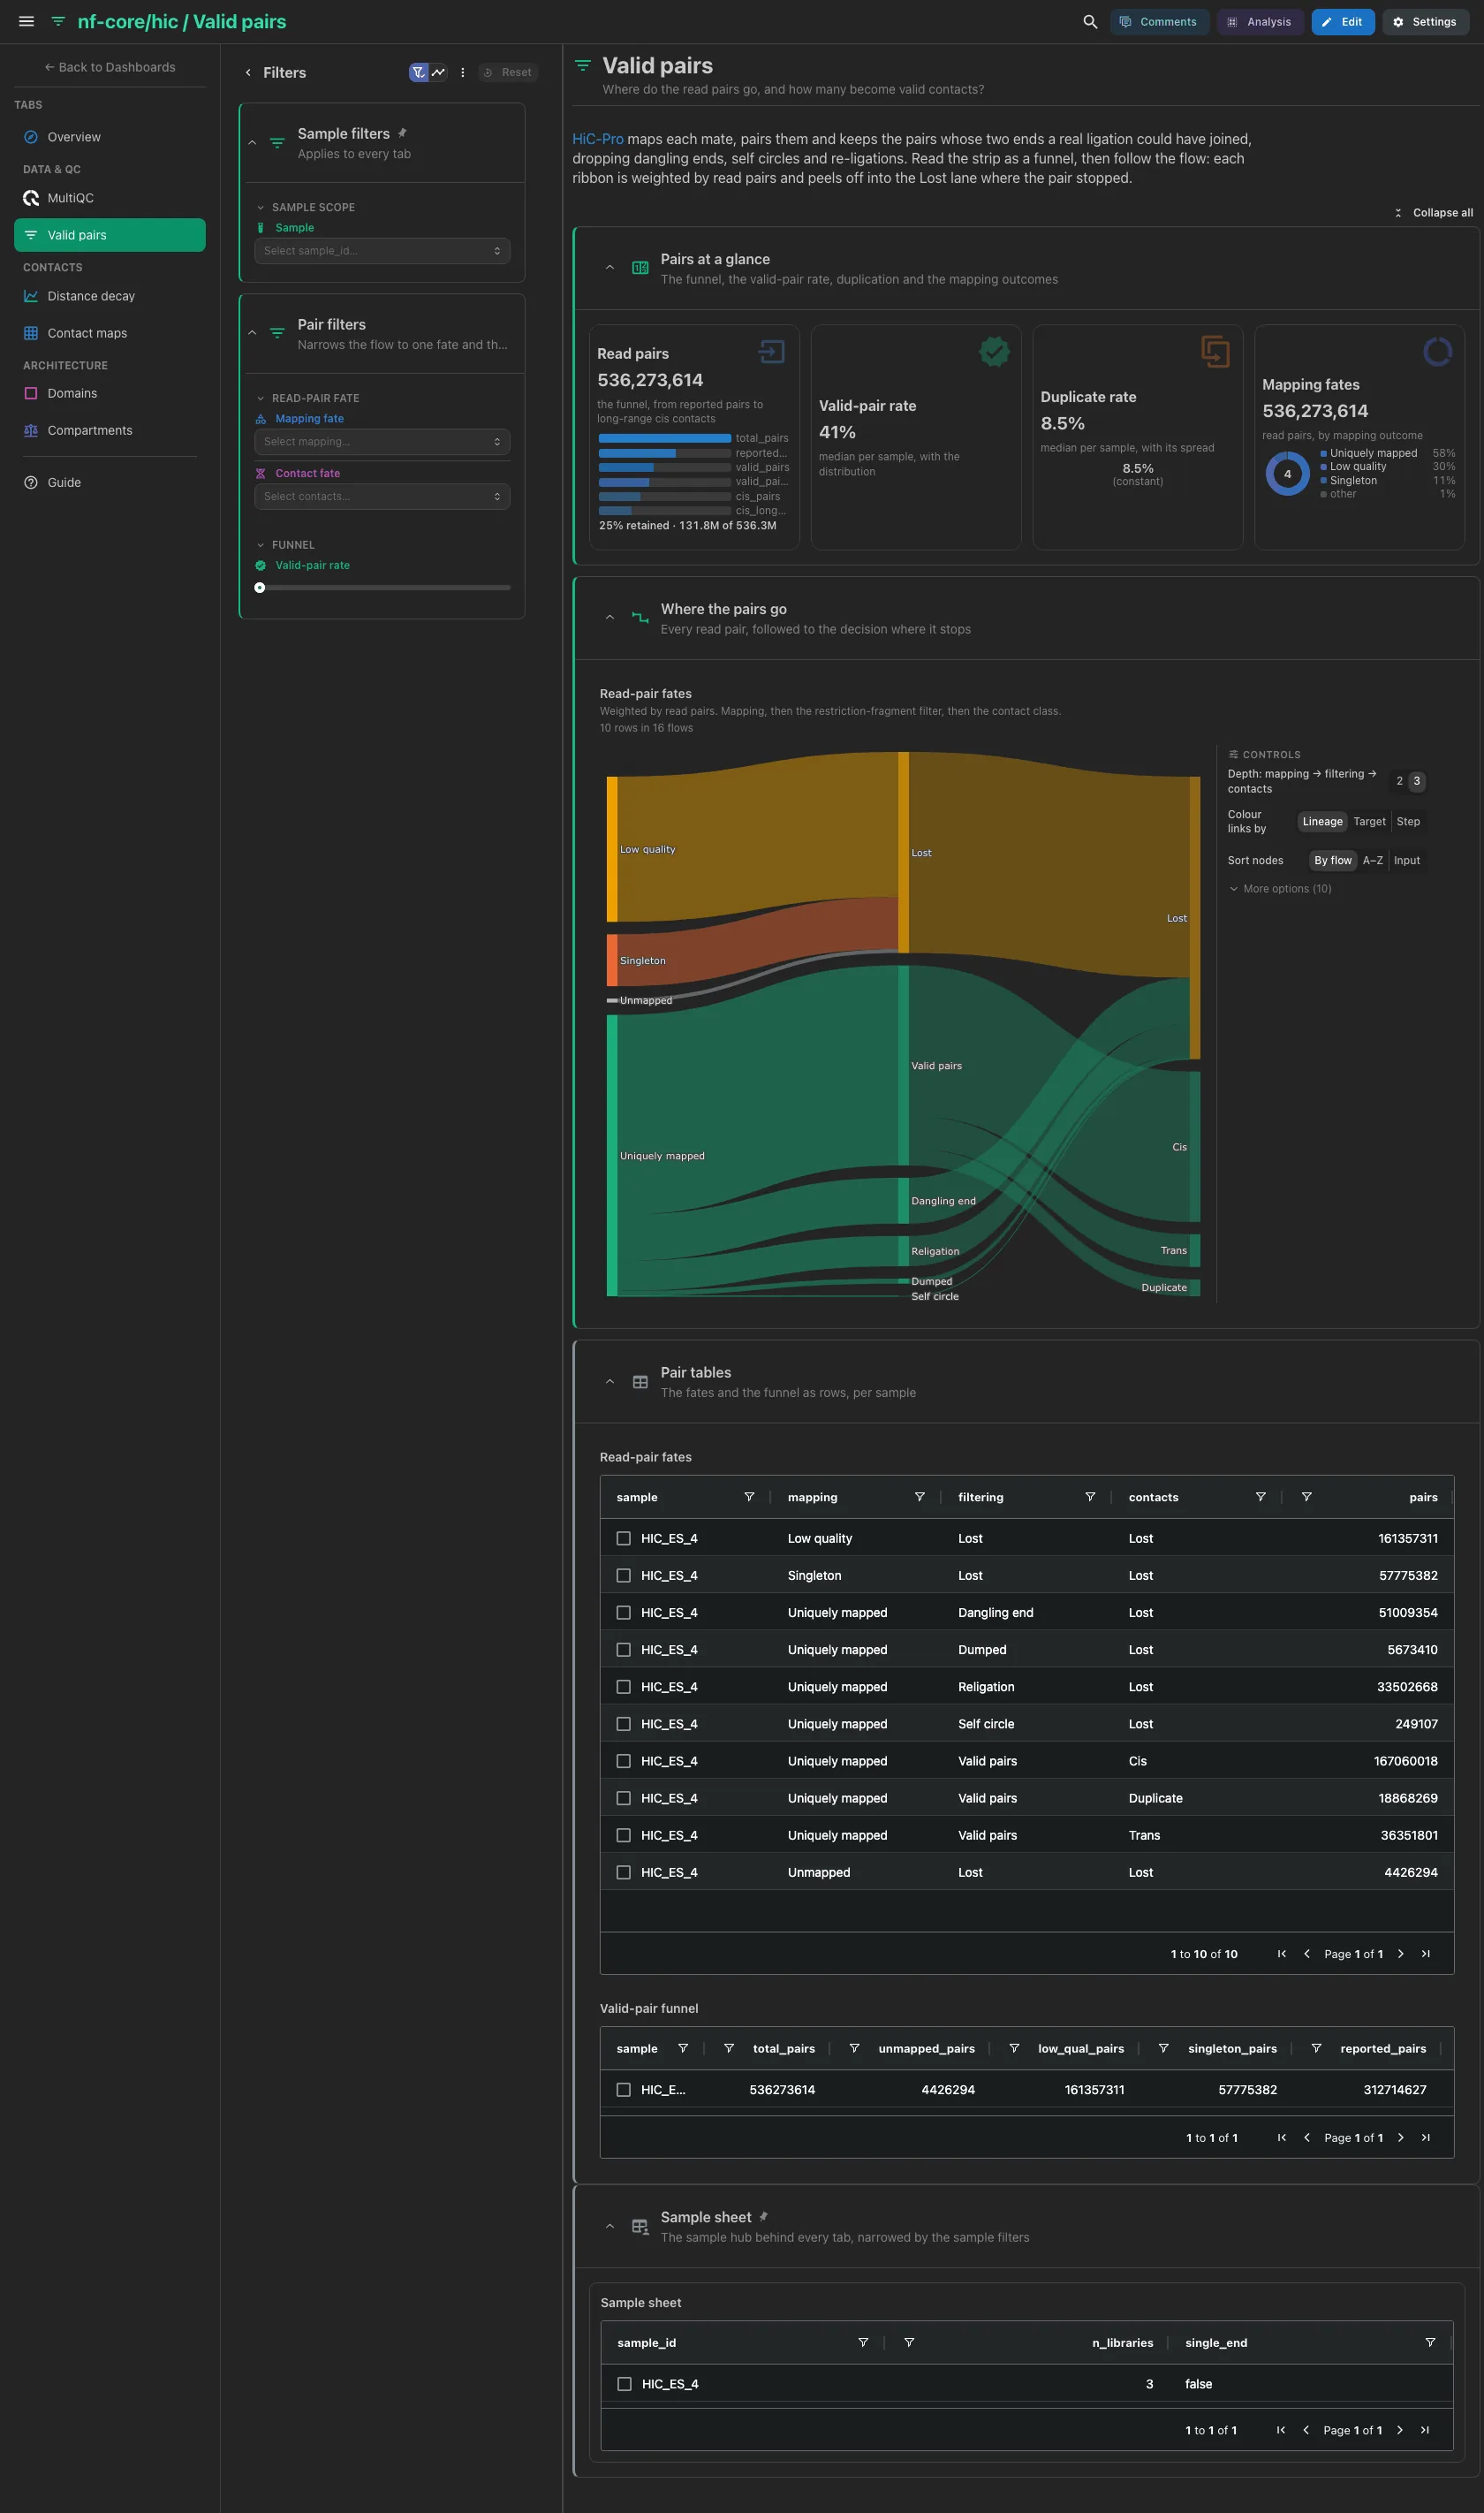
HiC-Pro's statistics as numbers: the read pairs processed, the median
valid-pair rate, the median duplicate rate and the read pairs by mapping
outcome. Then the read-pair flow, HiC-Pro's three decisions weighted by read
pairs: does the pair map uniquely at both ends, could a real ligation have
joined its fragments, and is the contact cis or trans. Each loss peels off into
a Lost lane at the step it stopped at. The read-pair fates and the funnel per
sample are collapsed.
Filters and components
Filters · Mapping fate and Contact fate on pair_flow, and a
Valid-pair rate range on pair_stats.
| Section | What it holds |
|---|---|
| Pairs at a glance | 4 cards |
| Where the pairs go | 1 advanced visualization |
| Pair tables (collapsed) | Read-pair fates, Valid-pair funnel |
Contacts · How fast does contact frequency fall off with genomic distance?
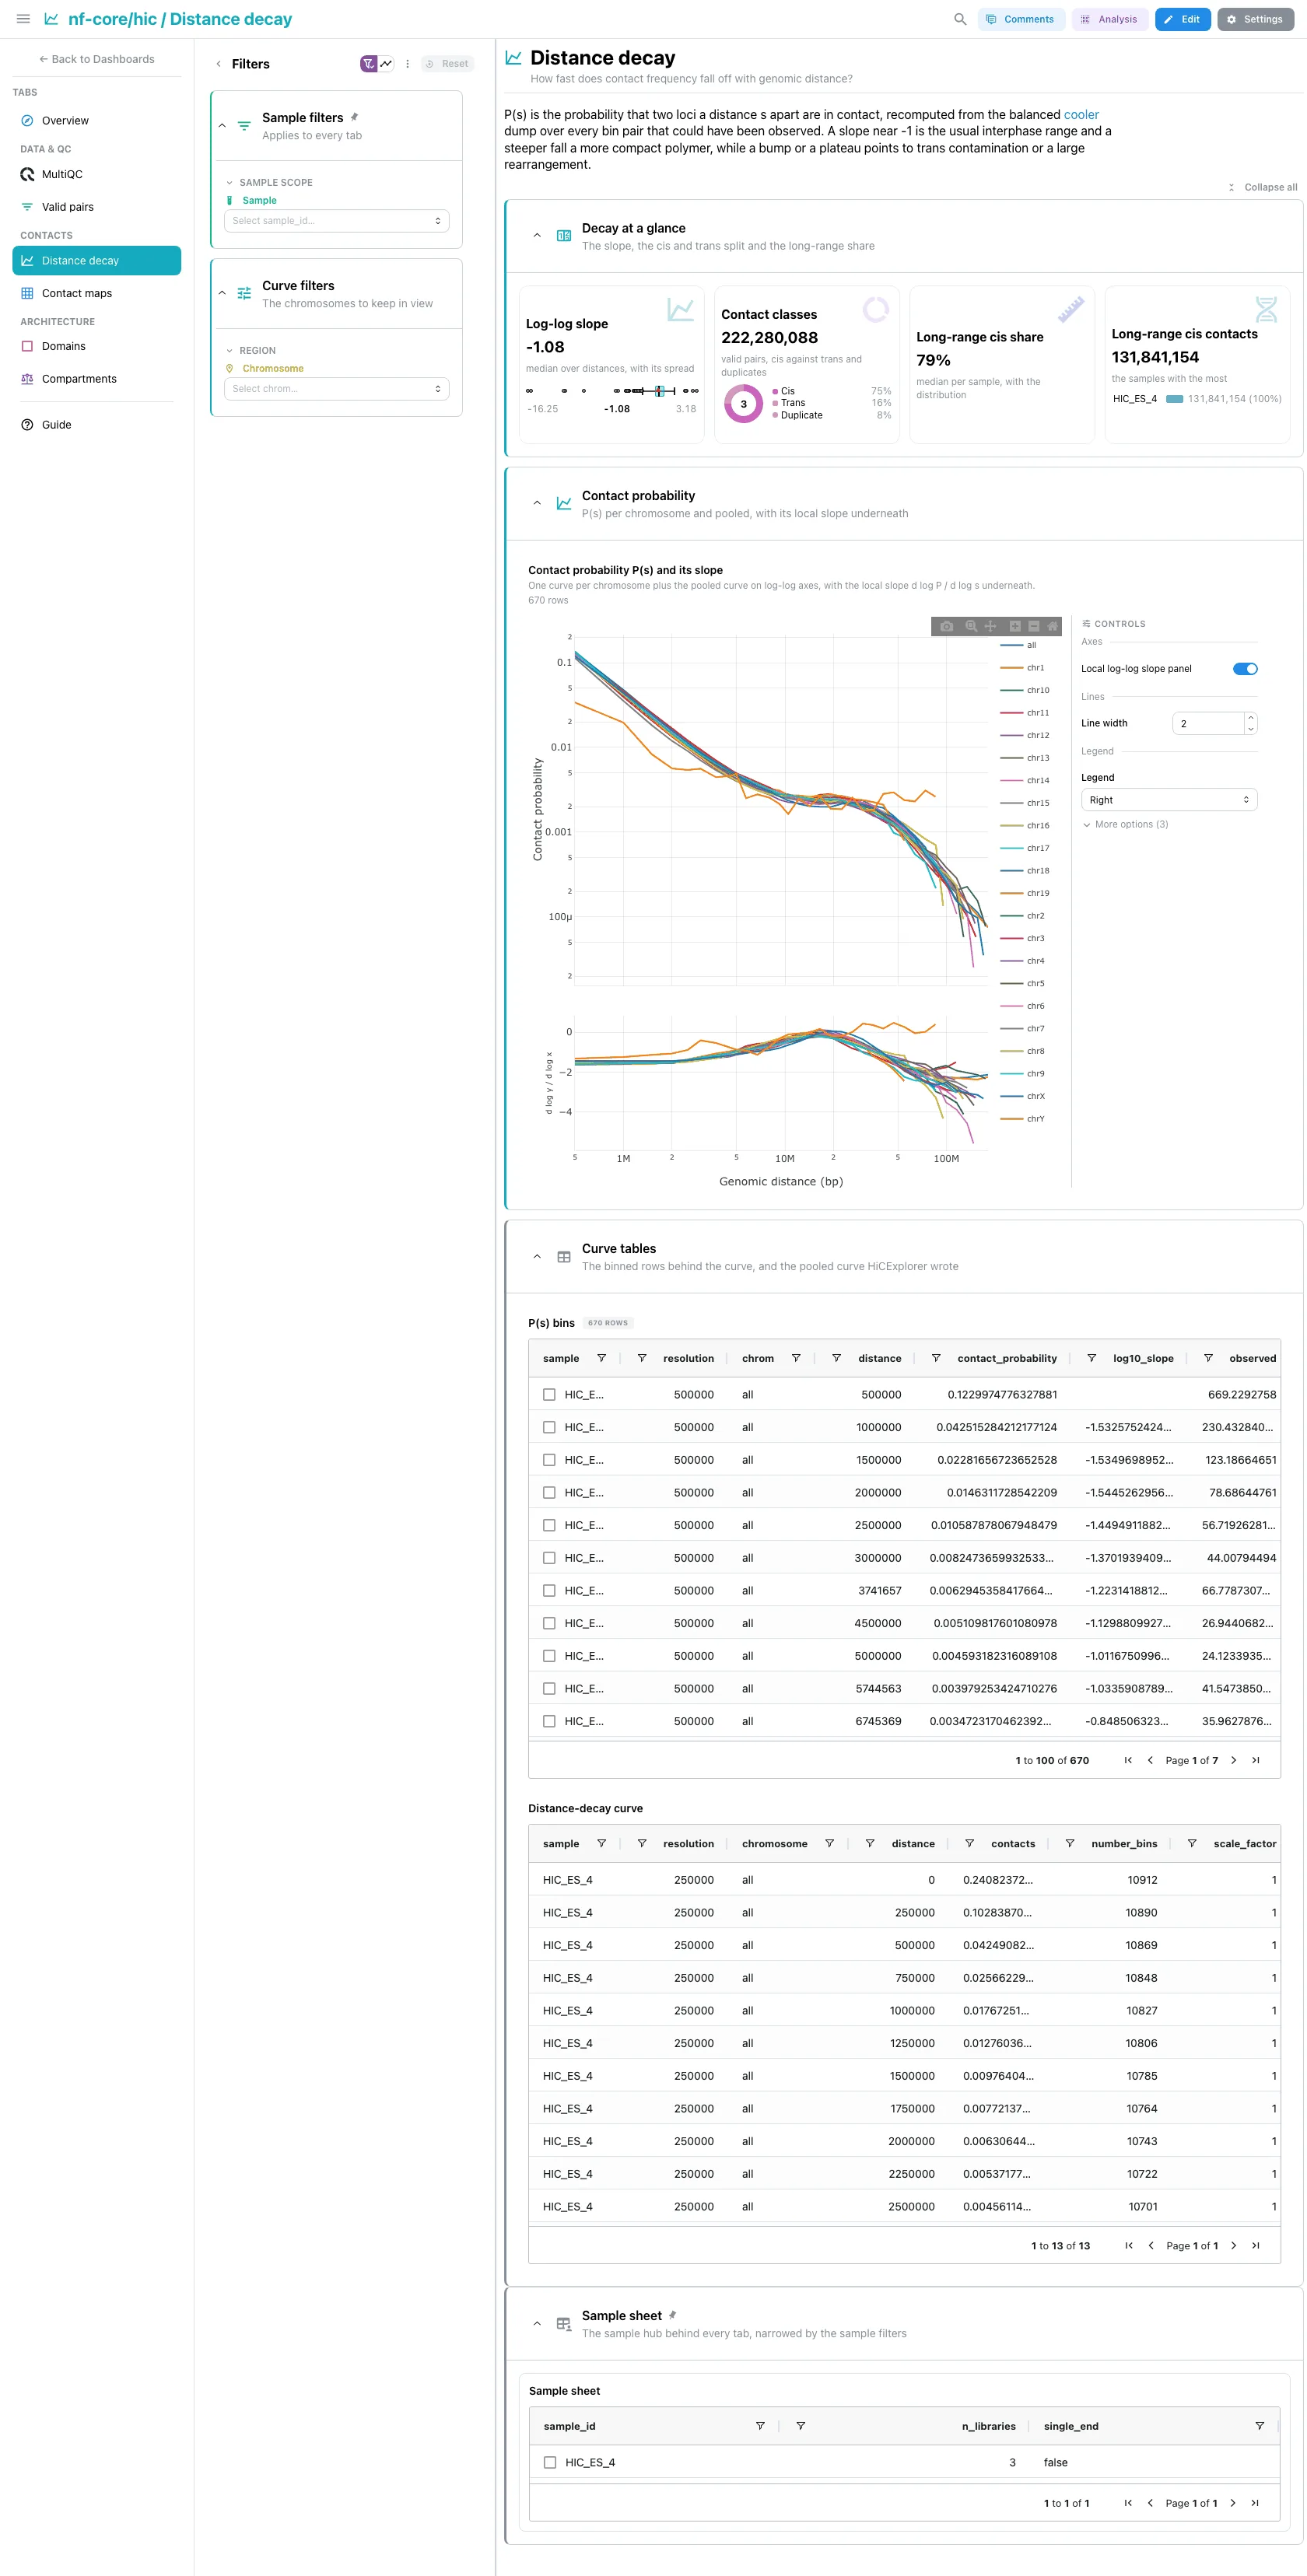
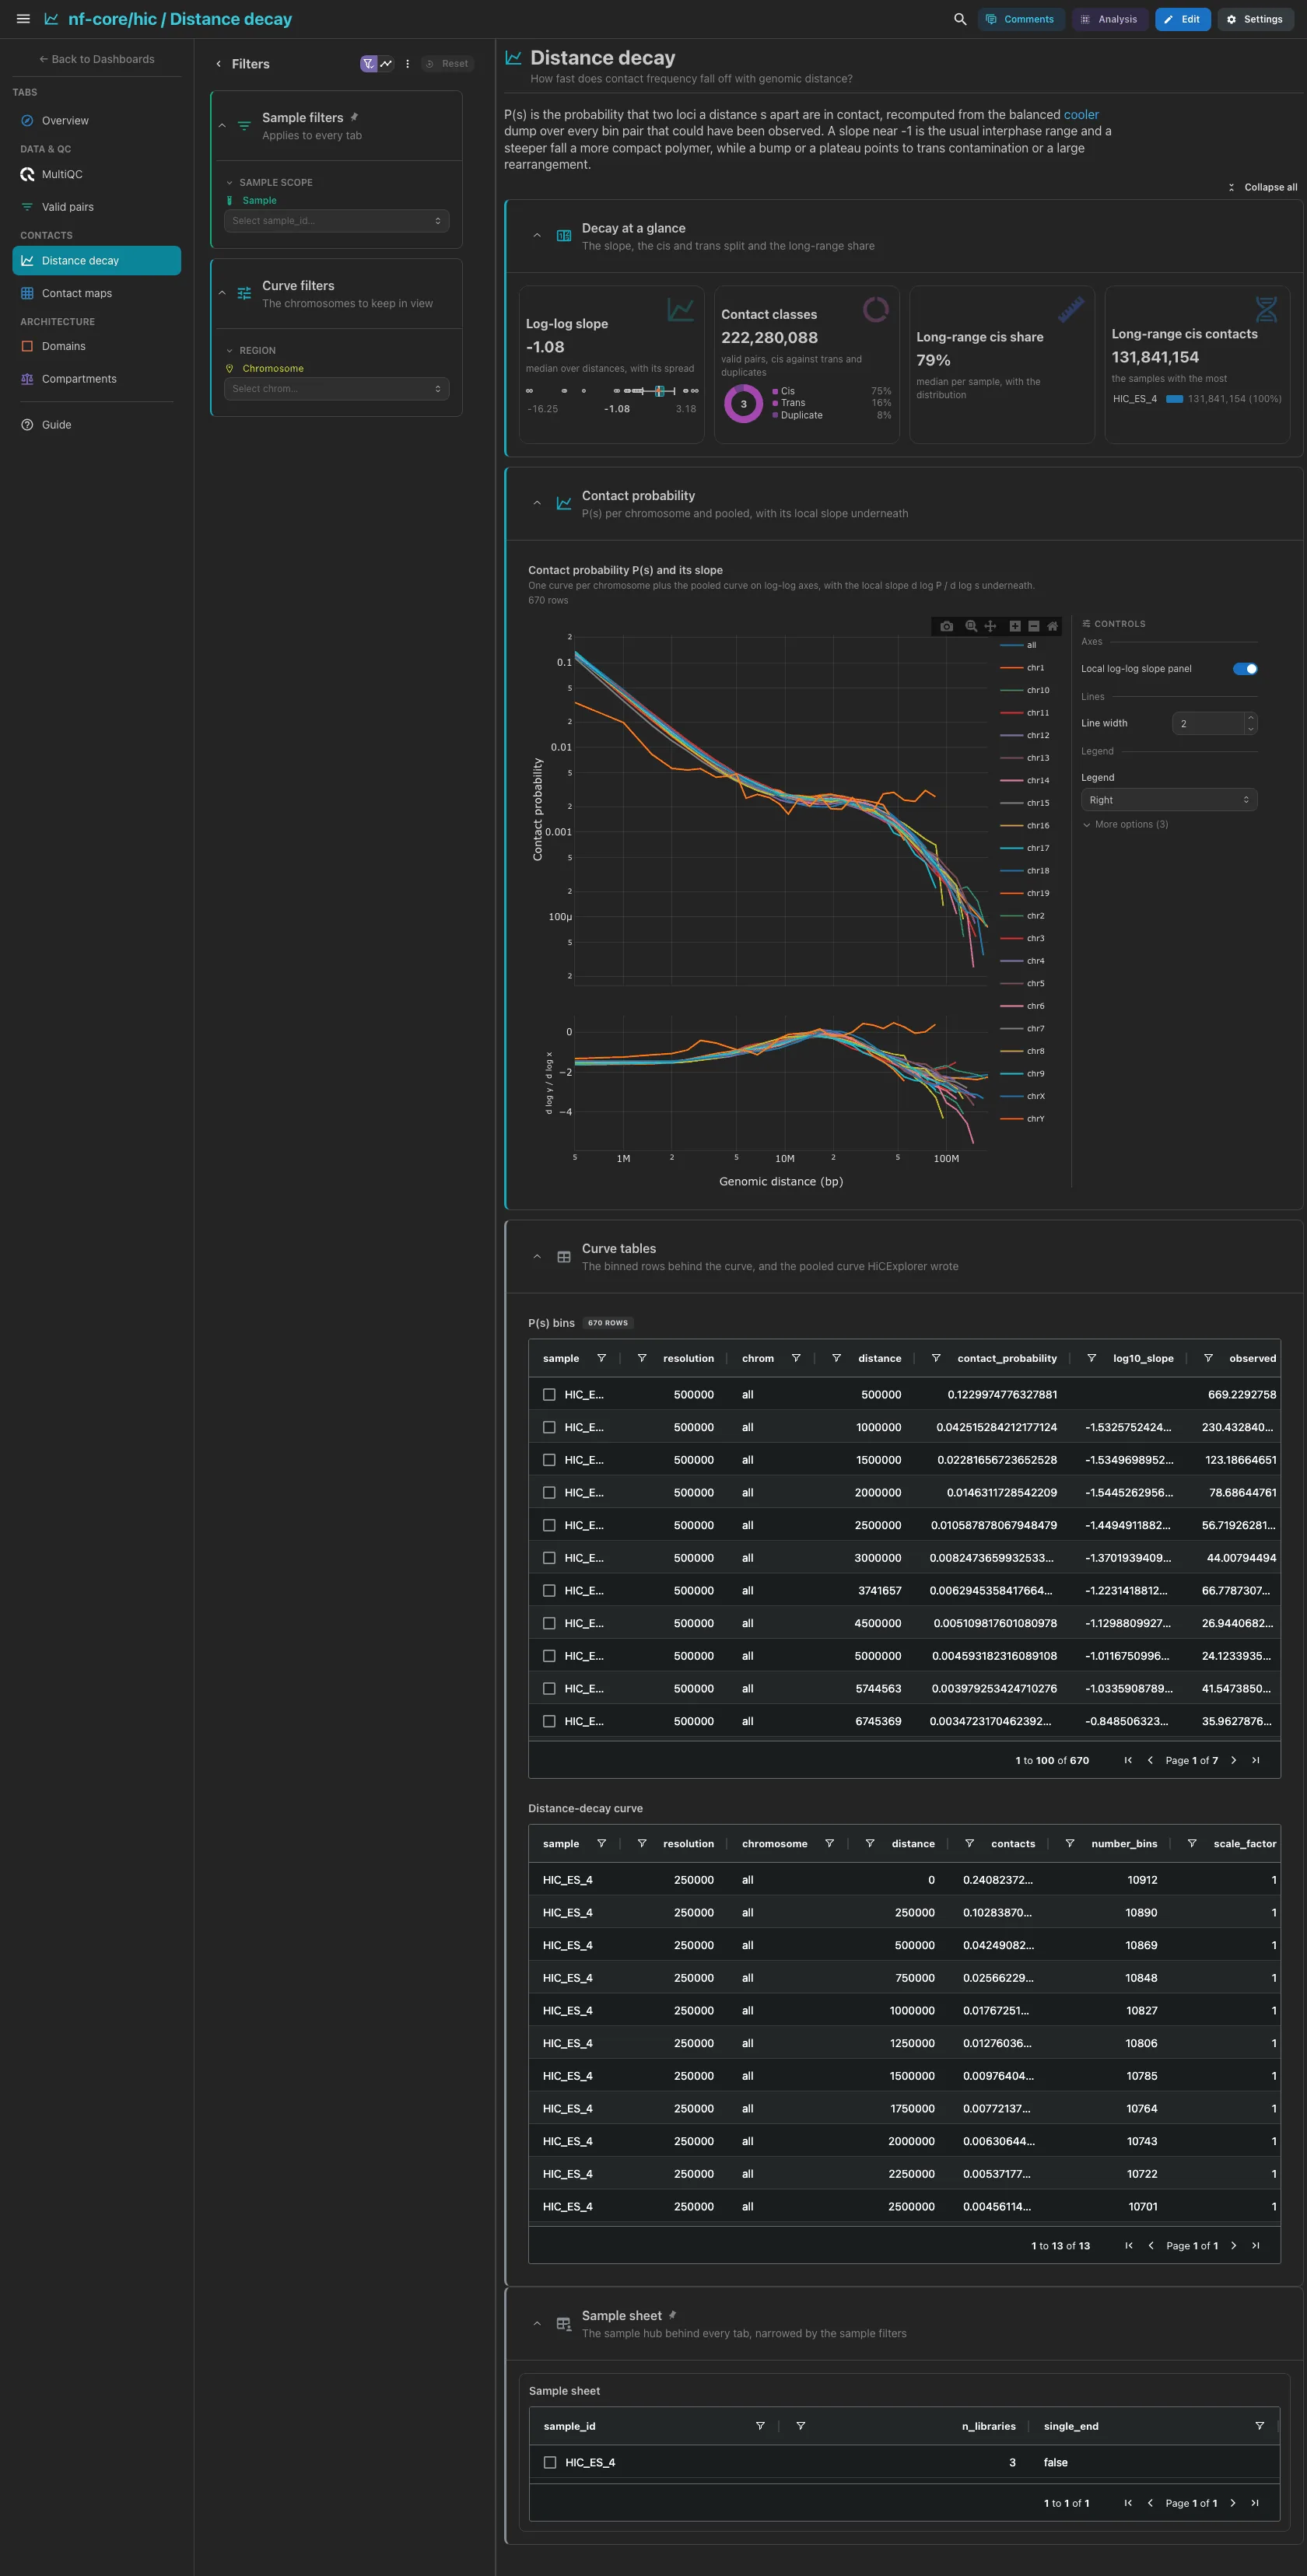
The median log-log slope, the valid pairs split into cis, trans and
duplicates, the median long-range share of cis contacts and the long-range cis
contacts. Then P(s), the probability that two loci a distance s apart touch,
one curve per chromosome plus the pooled curve, with its local slope in a panel
underneath. It is recomputed from the balanced contact dump, because
nf-core/hic never runs cooltools expected-cis, and its denominator counts
every bin pair that could have been observed, which keeps the tail from
flattening. A slope near -1 is the usual interphase range; a bump or a plateau
points to trans contamination or a rearrangement.
Filters and components
Filters · Chromosome on distance_profile. Picking a curve narrows
the P(s) table to that chromosome.
| Section | What it holds |
|---|---|
| Decay at a glance | 4 cards |
| Contact probability | 1 advanced visualization |
| Curve tables (collapsed) | P(s) bins, Distance-decay curve |
Contacts · What do the contacts, domains and compartments look like at one locus?
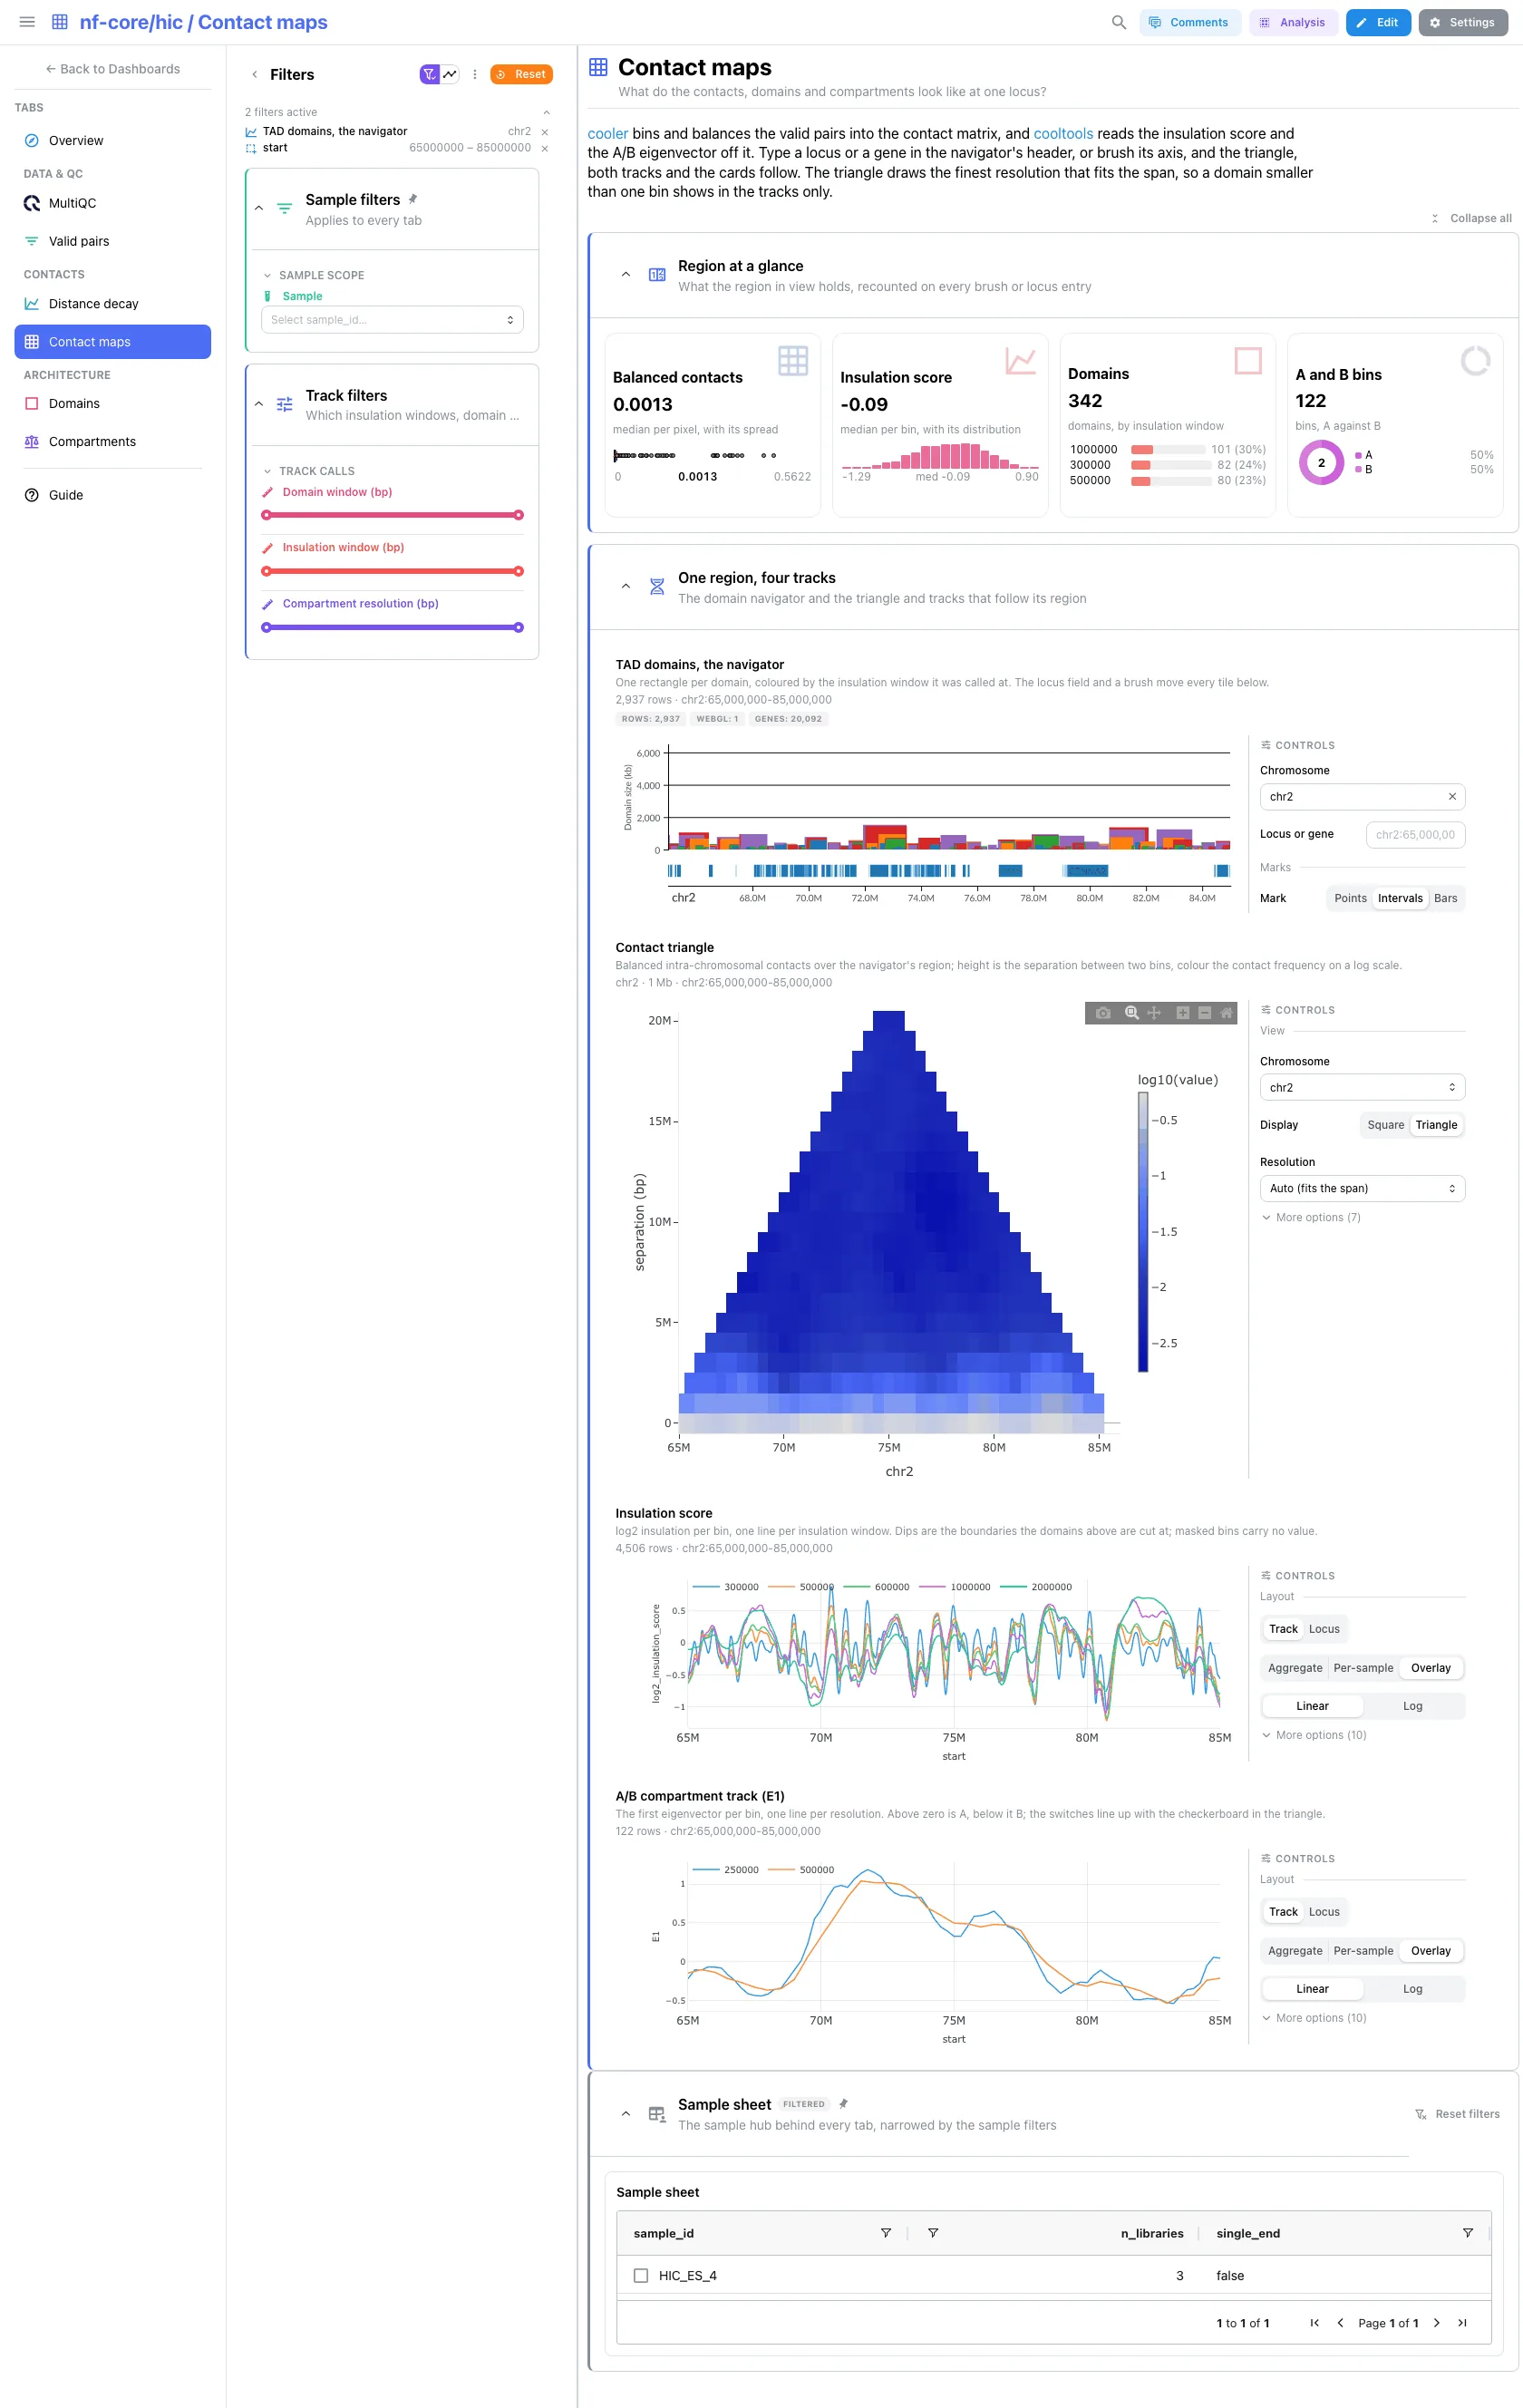
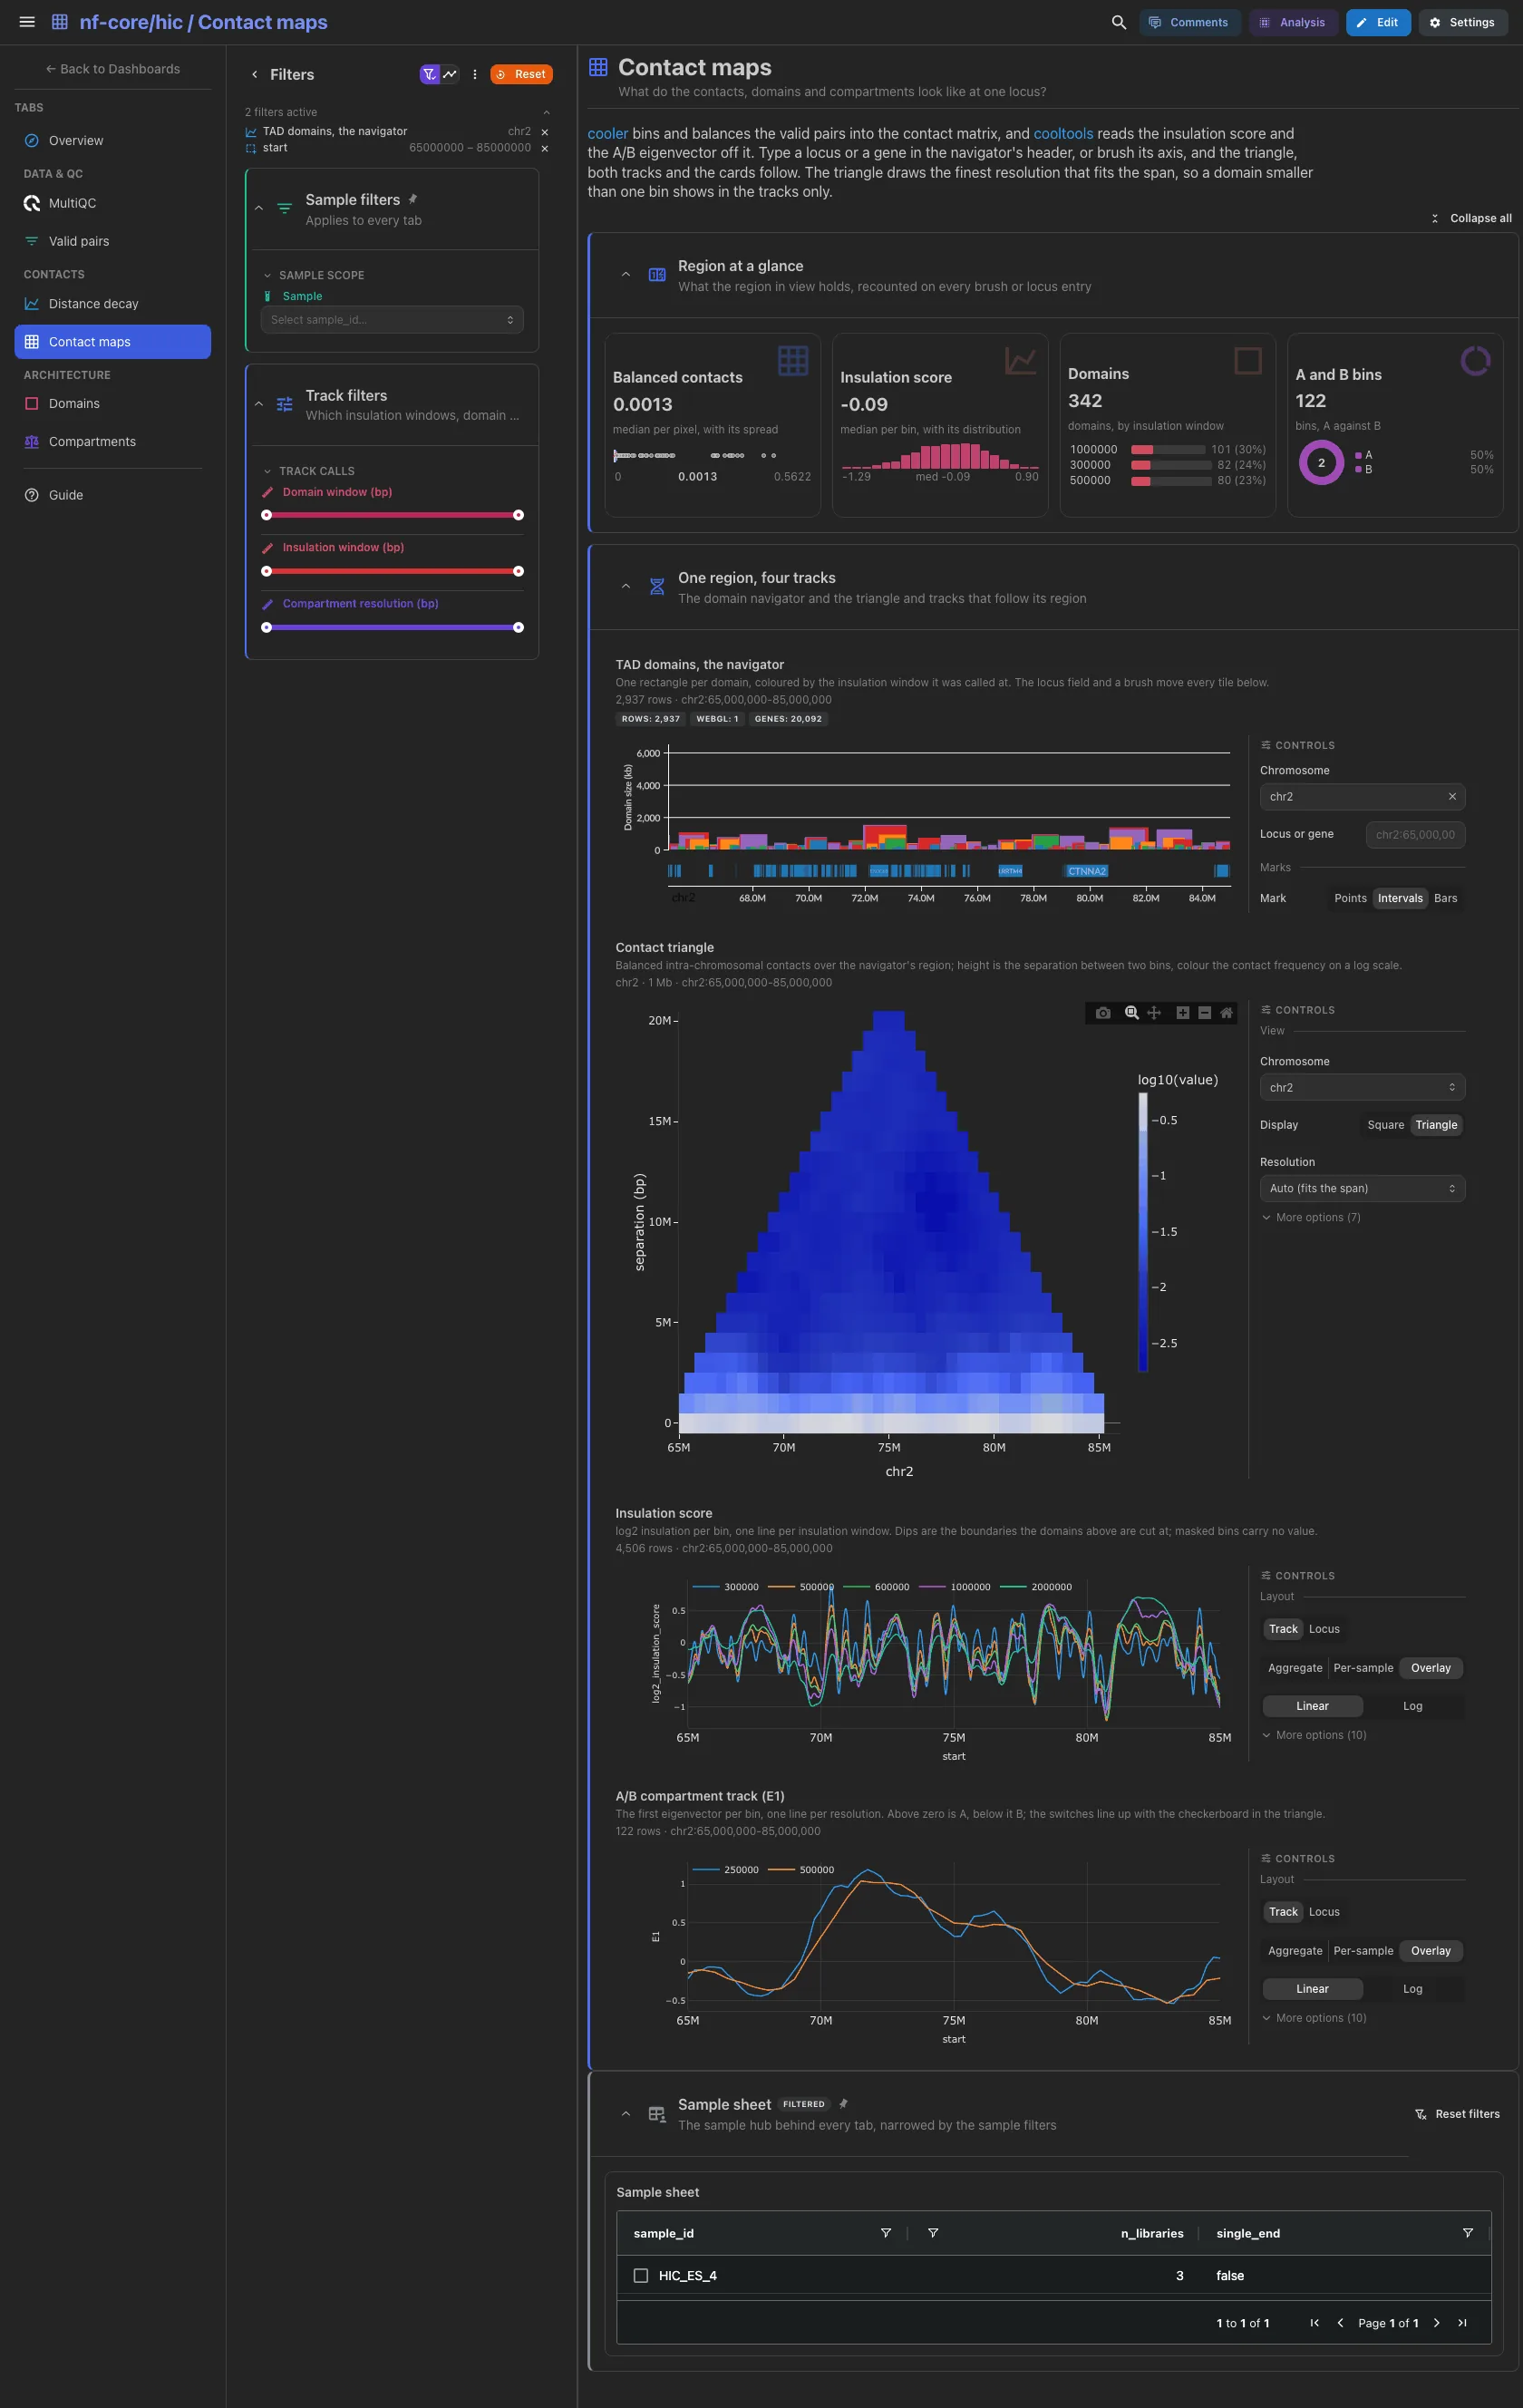
The locus tab stacks four collections on one {GENOME} axis. The TAD domain
track is the navigator: a typed locus or a brush on its axis emits a region
that region links carry to the contact triangle, the insulation score and the
phased E1 compartment track below it. The triangle reads the finest dumped
resolution that fits the span, so zooming re-bins it. The four cards (median
balanced contact, insulation score, domains, A and B bins) are recounted on the
region in view.
Filters and components
Filters · Domain window (bp), Insulation window (bp) and
Compartment resolution (bp) choose which calls the tracks draw. There is
no chromosome filter: the locus field is the tab's chromosome.
| Section | What it holds |
|---|---|
| Region at a glance | 4 cards |
| One region, four tracks | 4 advanced visualizations: the TAD domain navigator, the contact triangle, the insulation score and the E1 track |
Architecture · How many TAD domains are there, and how large are they?
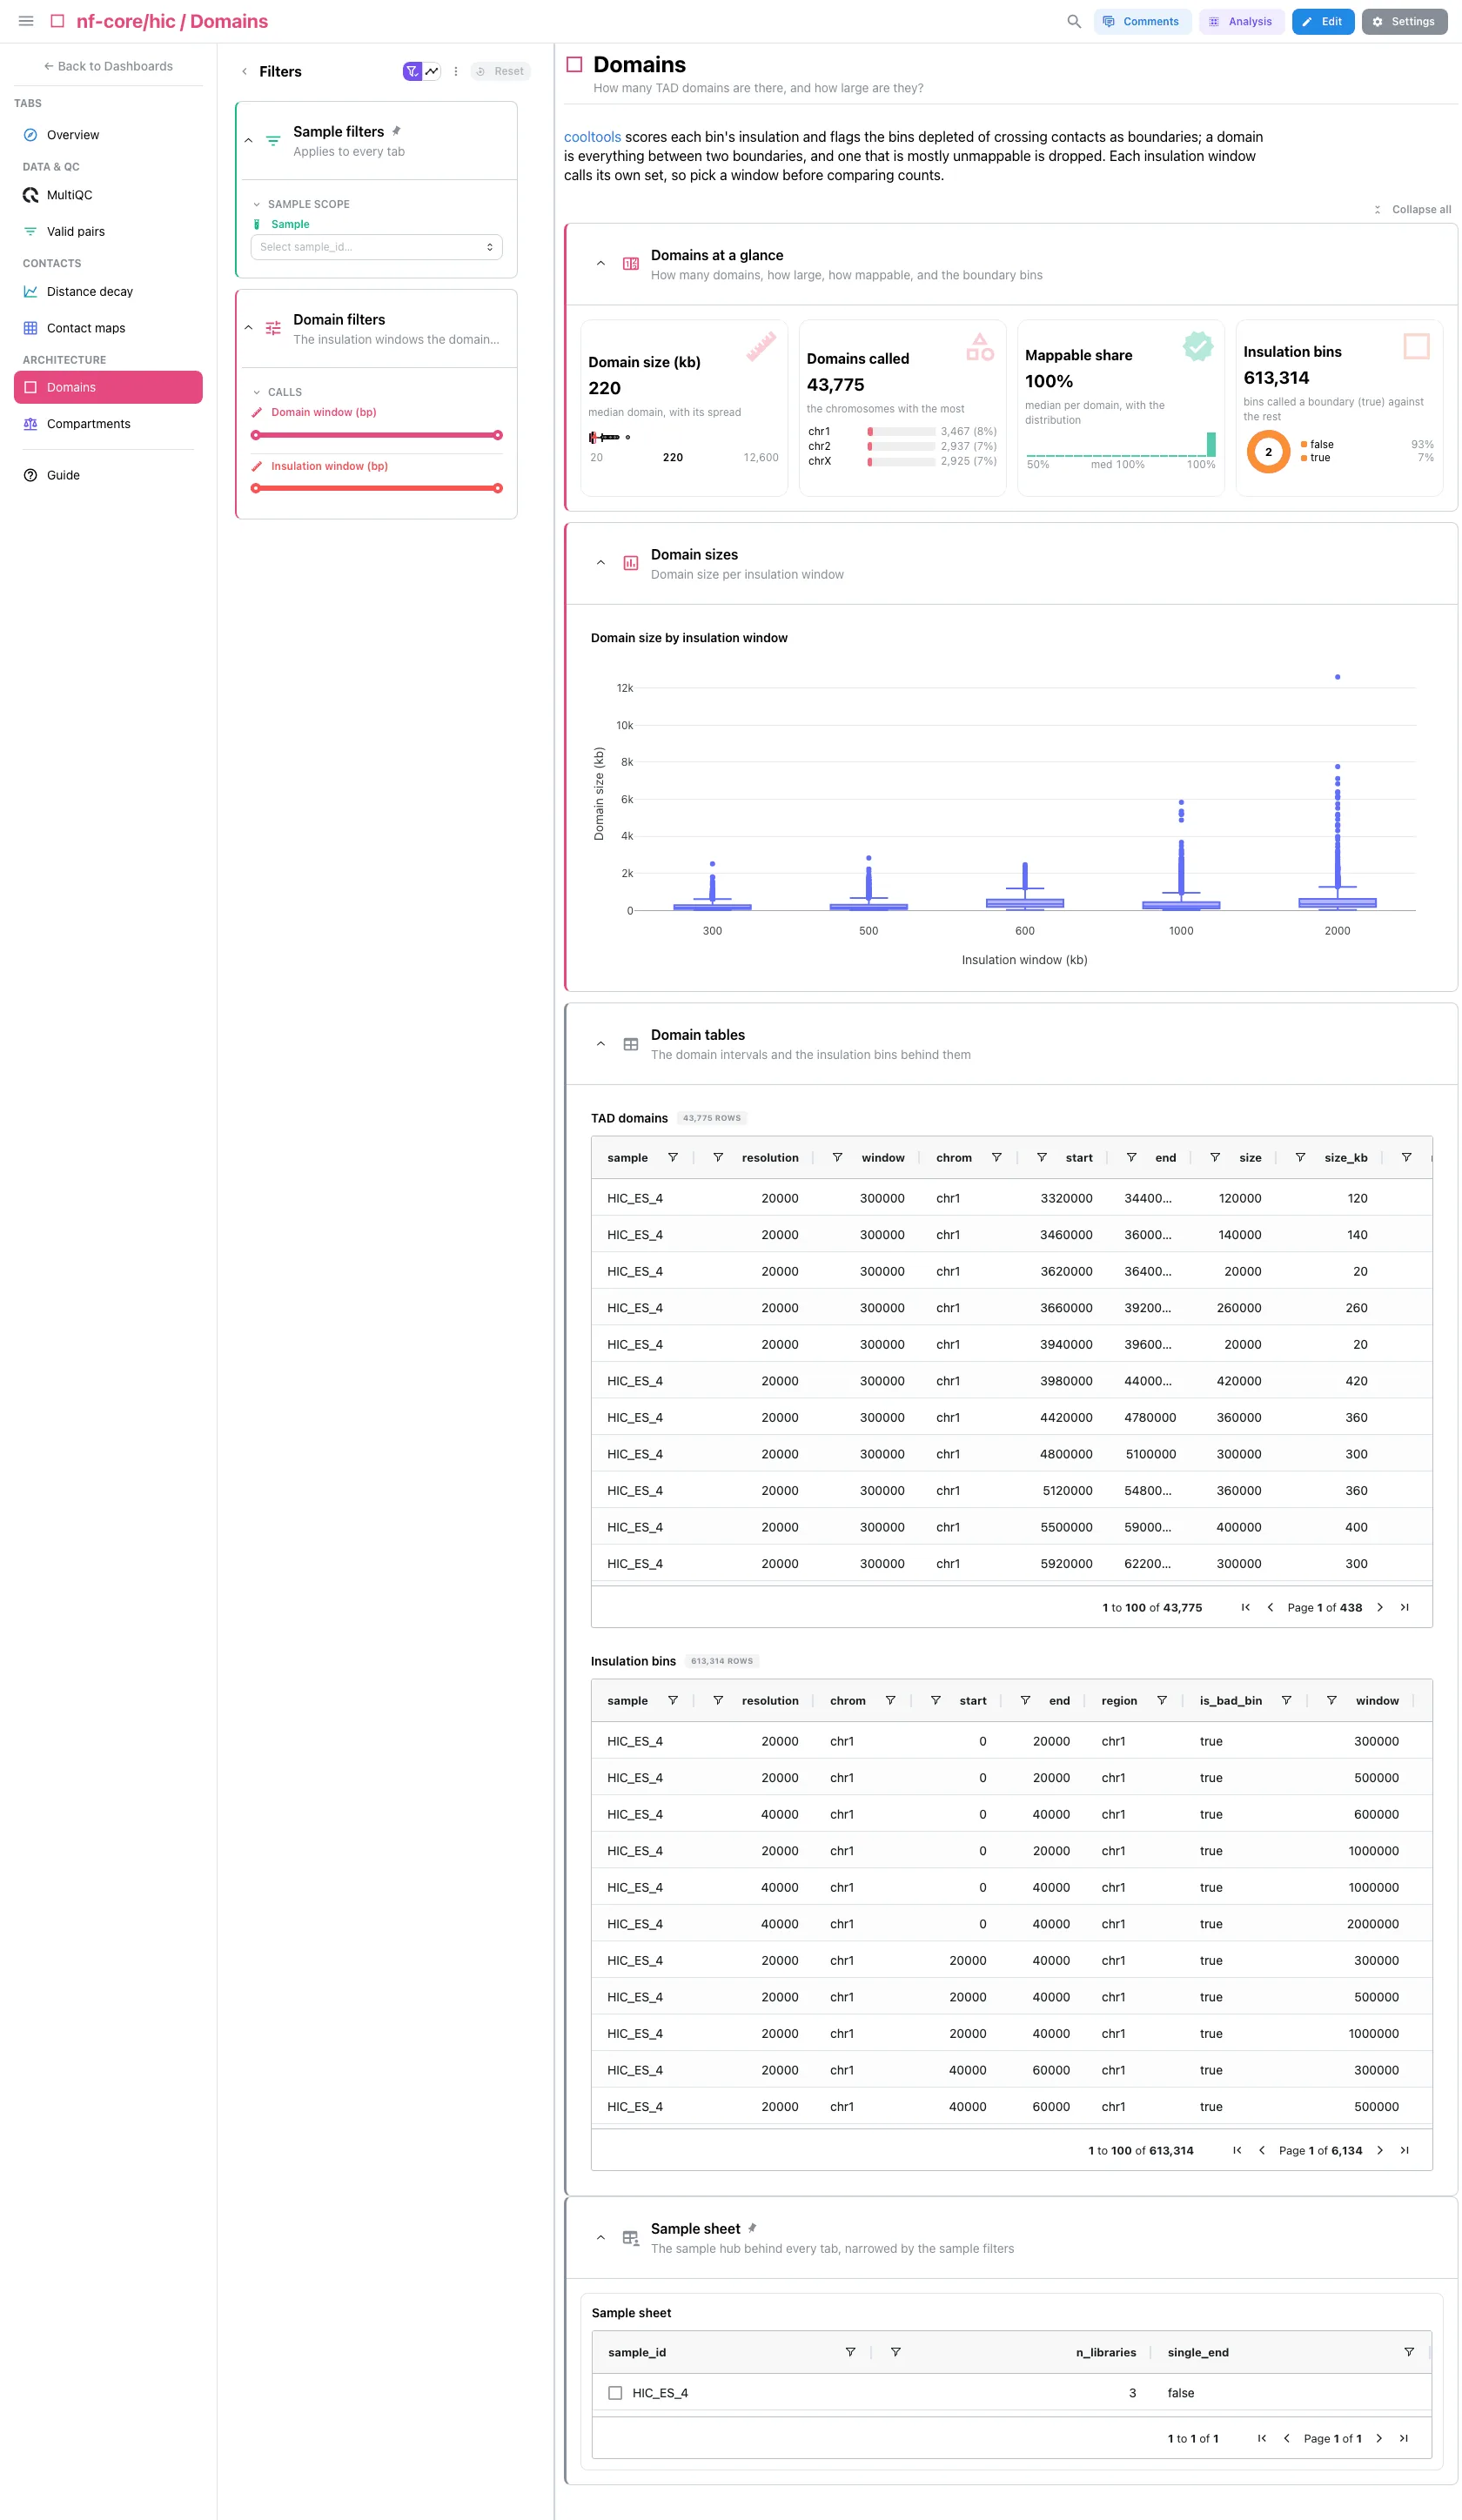
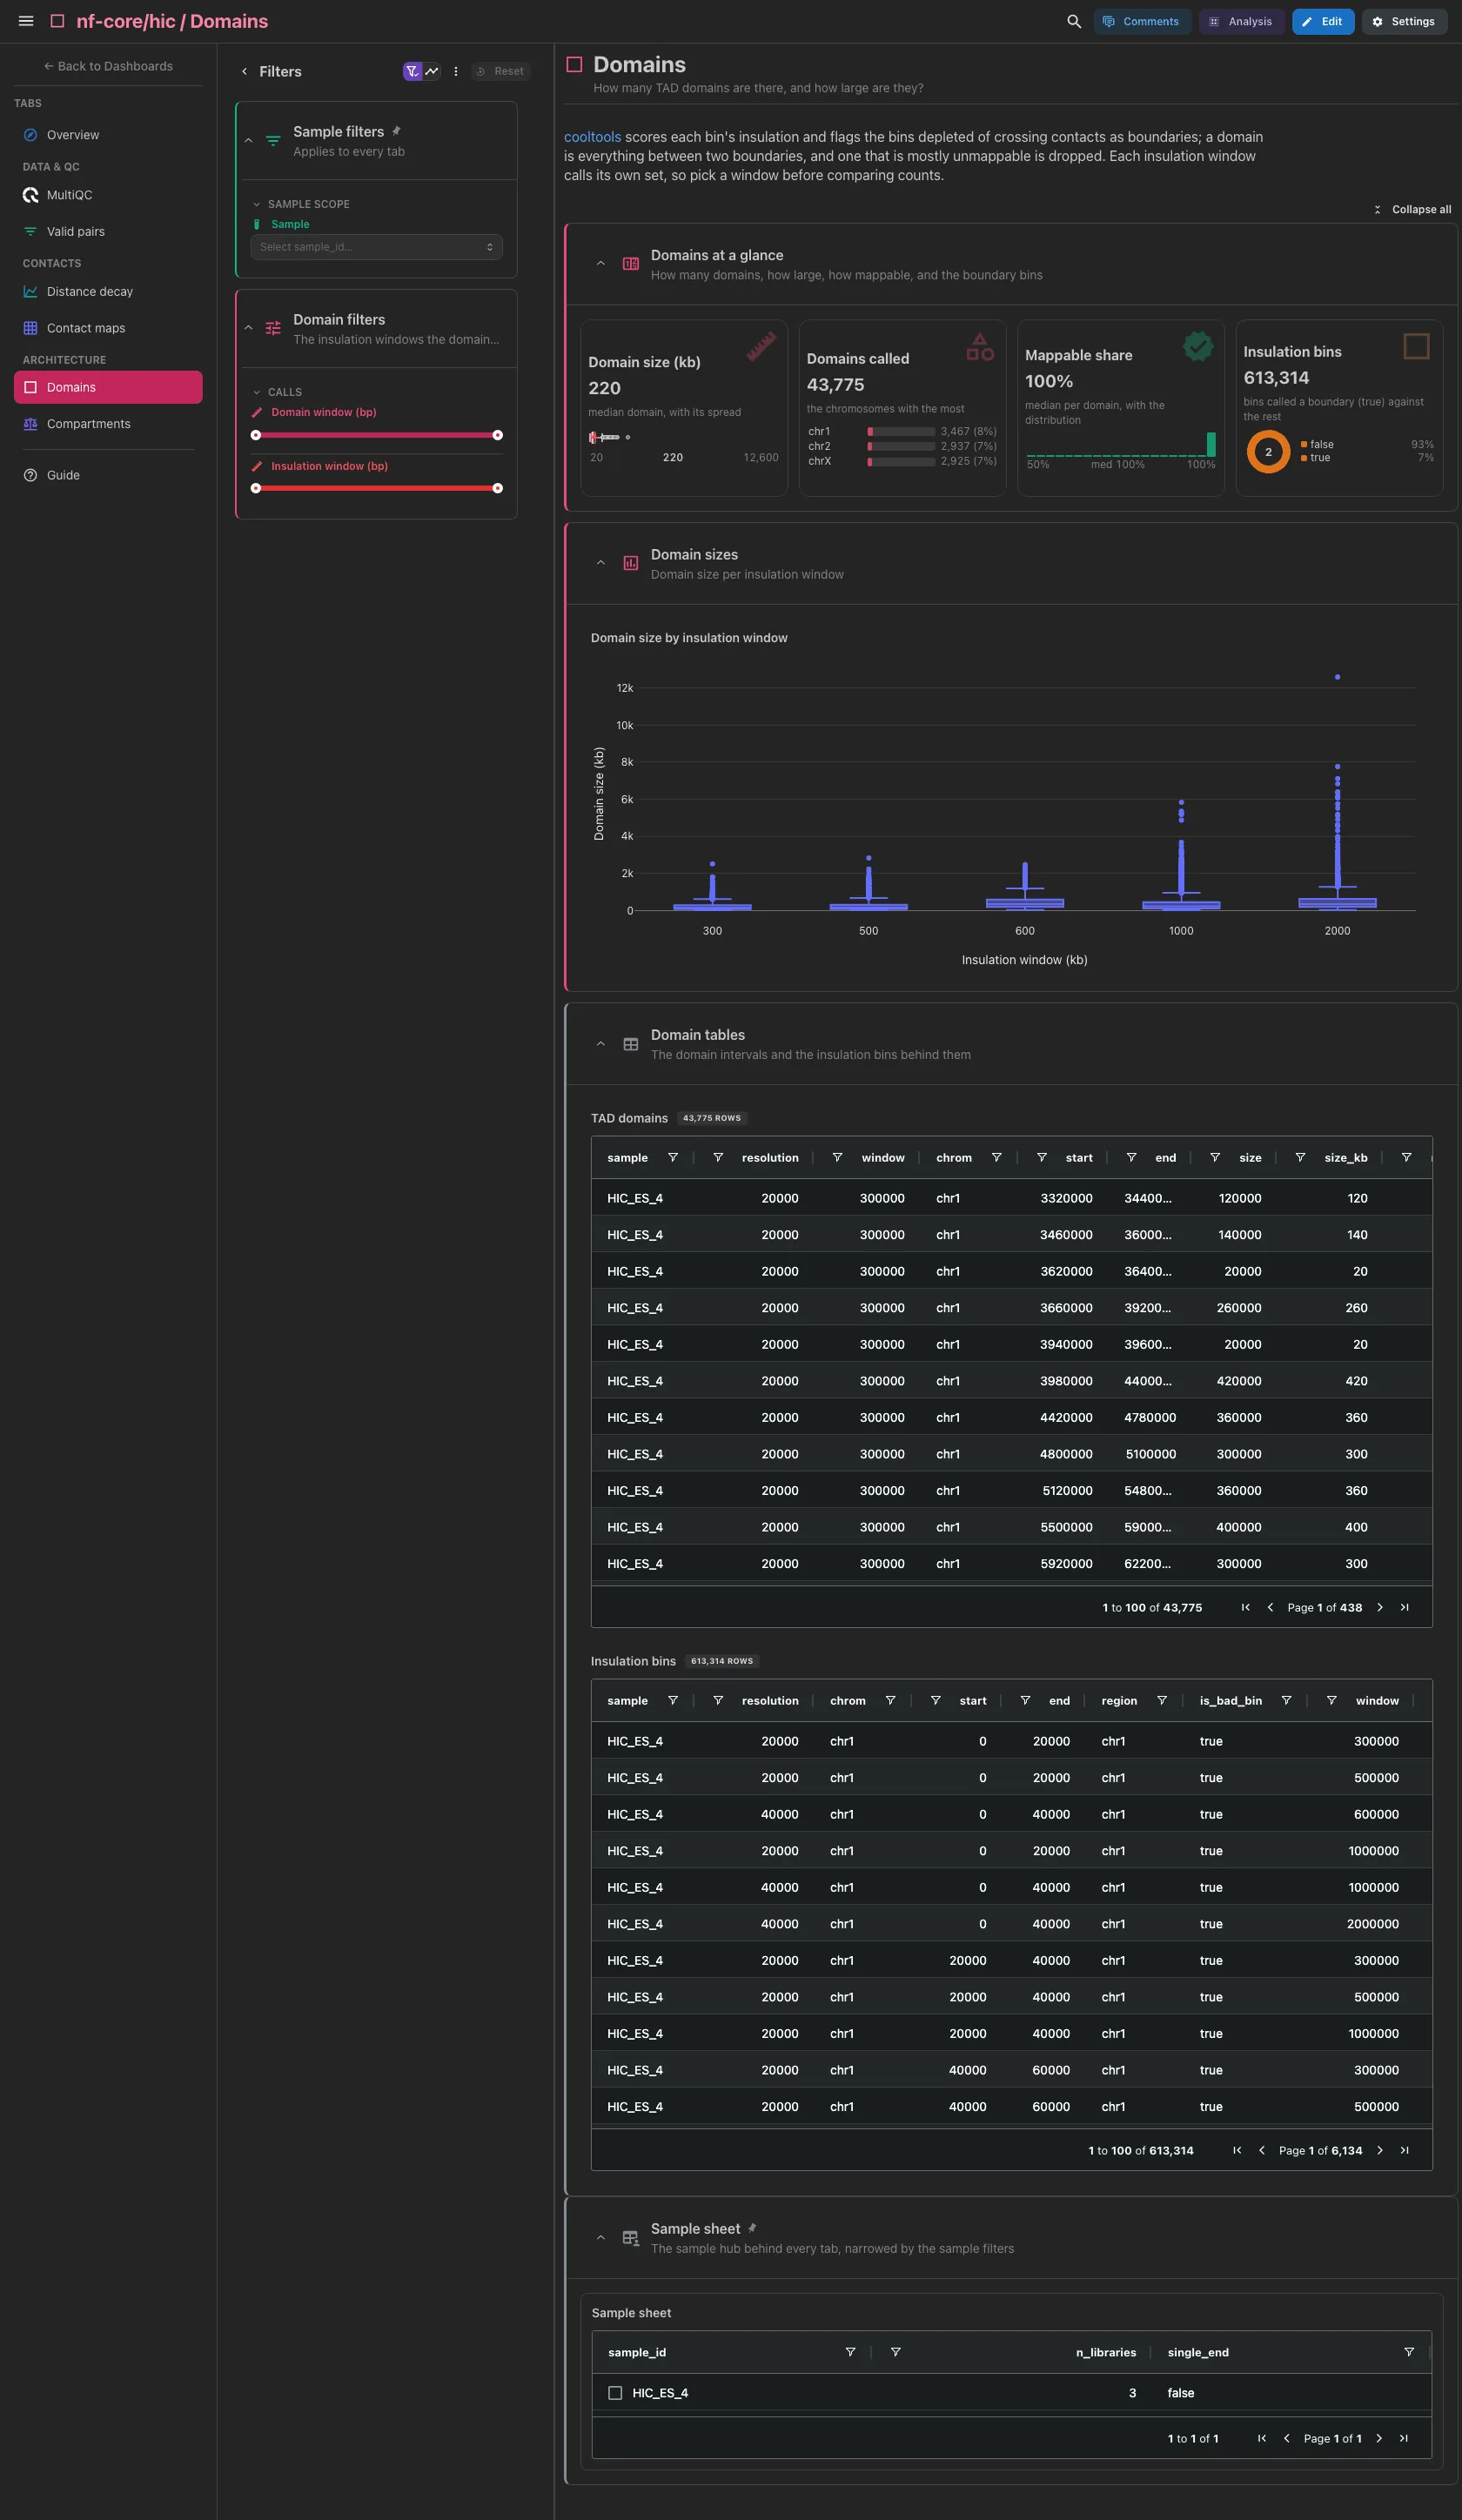
Genome-wide, no tracks. The median domain size, the domains called, the median mappable share of a domain and the insulation bins split into boundaries and the rest. Then the domain size per insulation window, one box per window. cooltools calls boundaries, not domains, and nf-core/hic 2.x emits no interval list, so the domains are derived from runs of boundary bins, and a domain that is mostly unmappable is dropped. Each window calls its own set: pick one before comparing counts.
Filters and components
Filters · Domain window (bp) on tad_domains and Insulation window
(bp) on tad_insulation.
| Section | What it holds |
|---|---|
| Domains at a glance | 4 cards |
| Domain sizes | Domain size by insulation window |
| Domain tables (collapsed) | TAD domains, Insulation bins |
Architecture · How does the genome split between the A and B compartments?
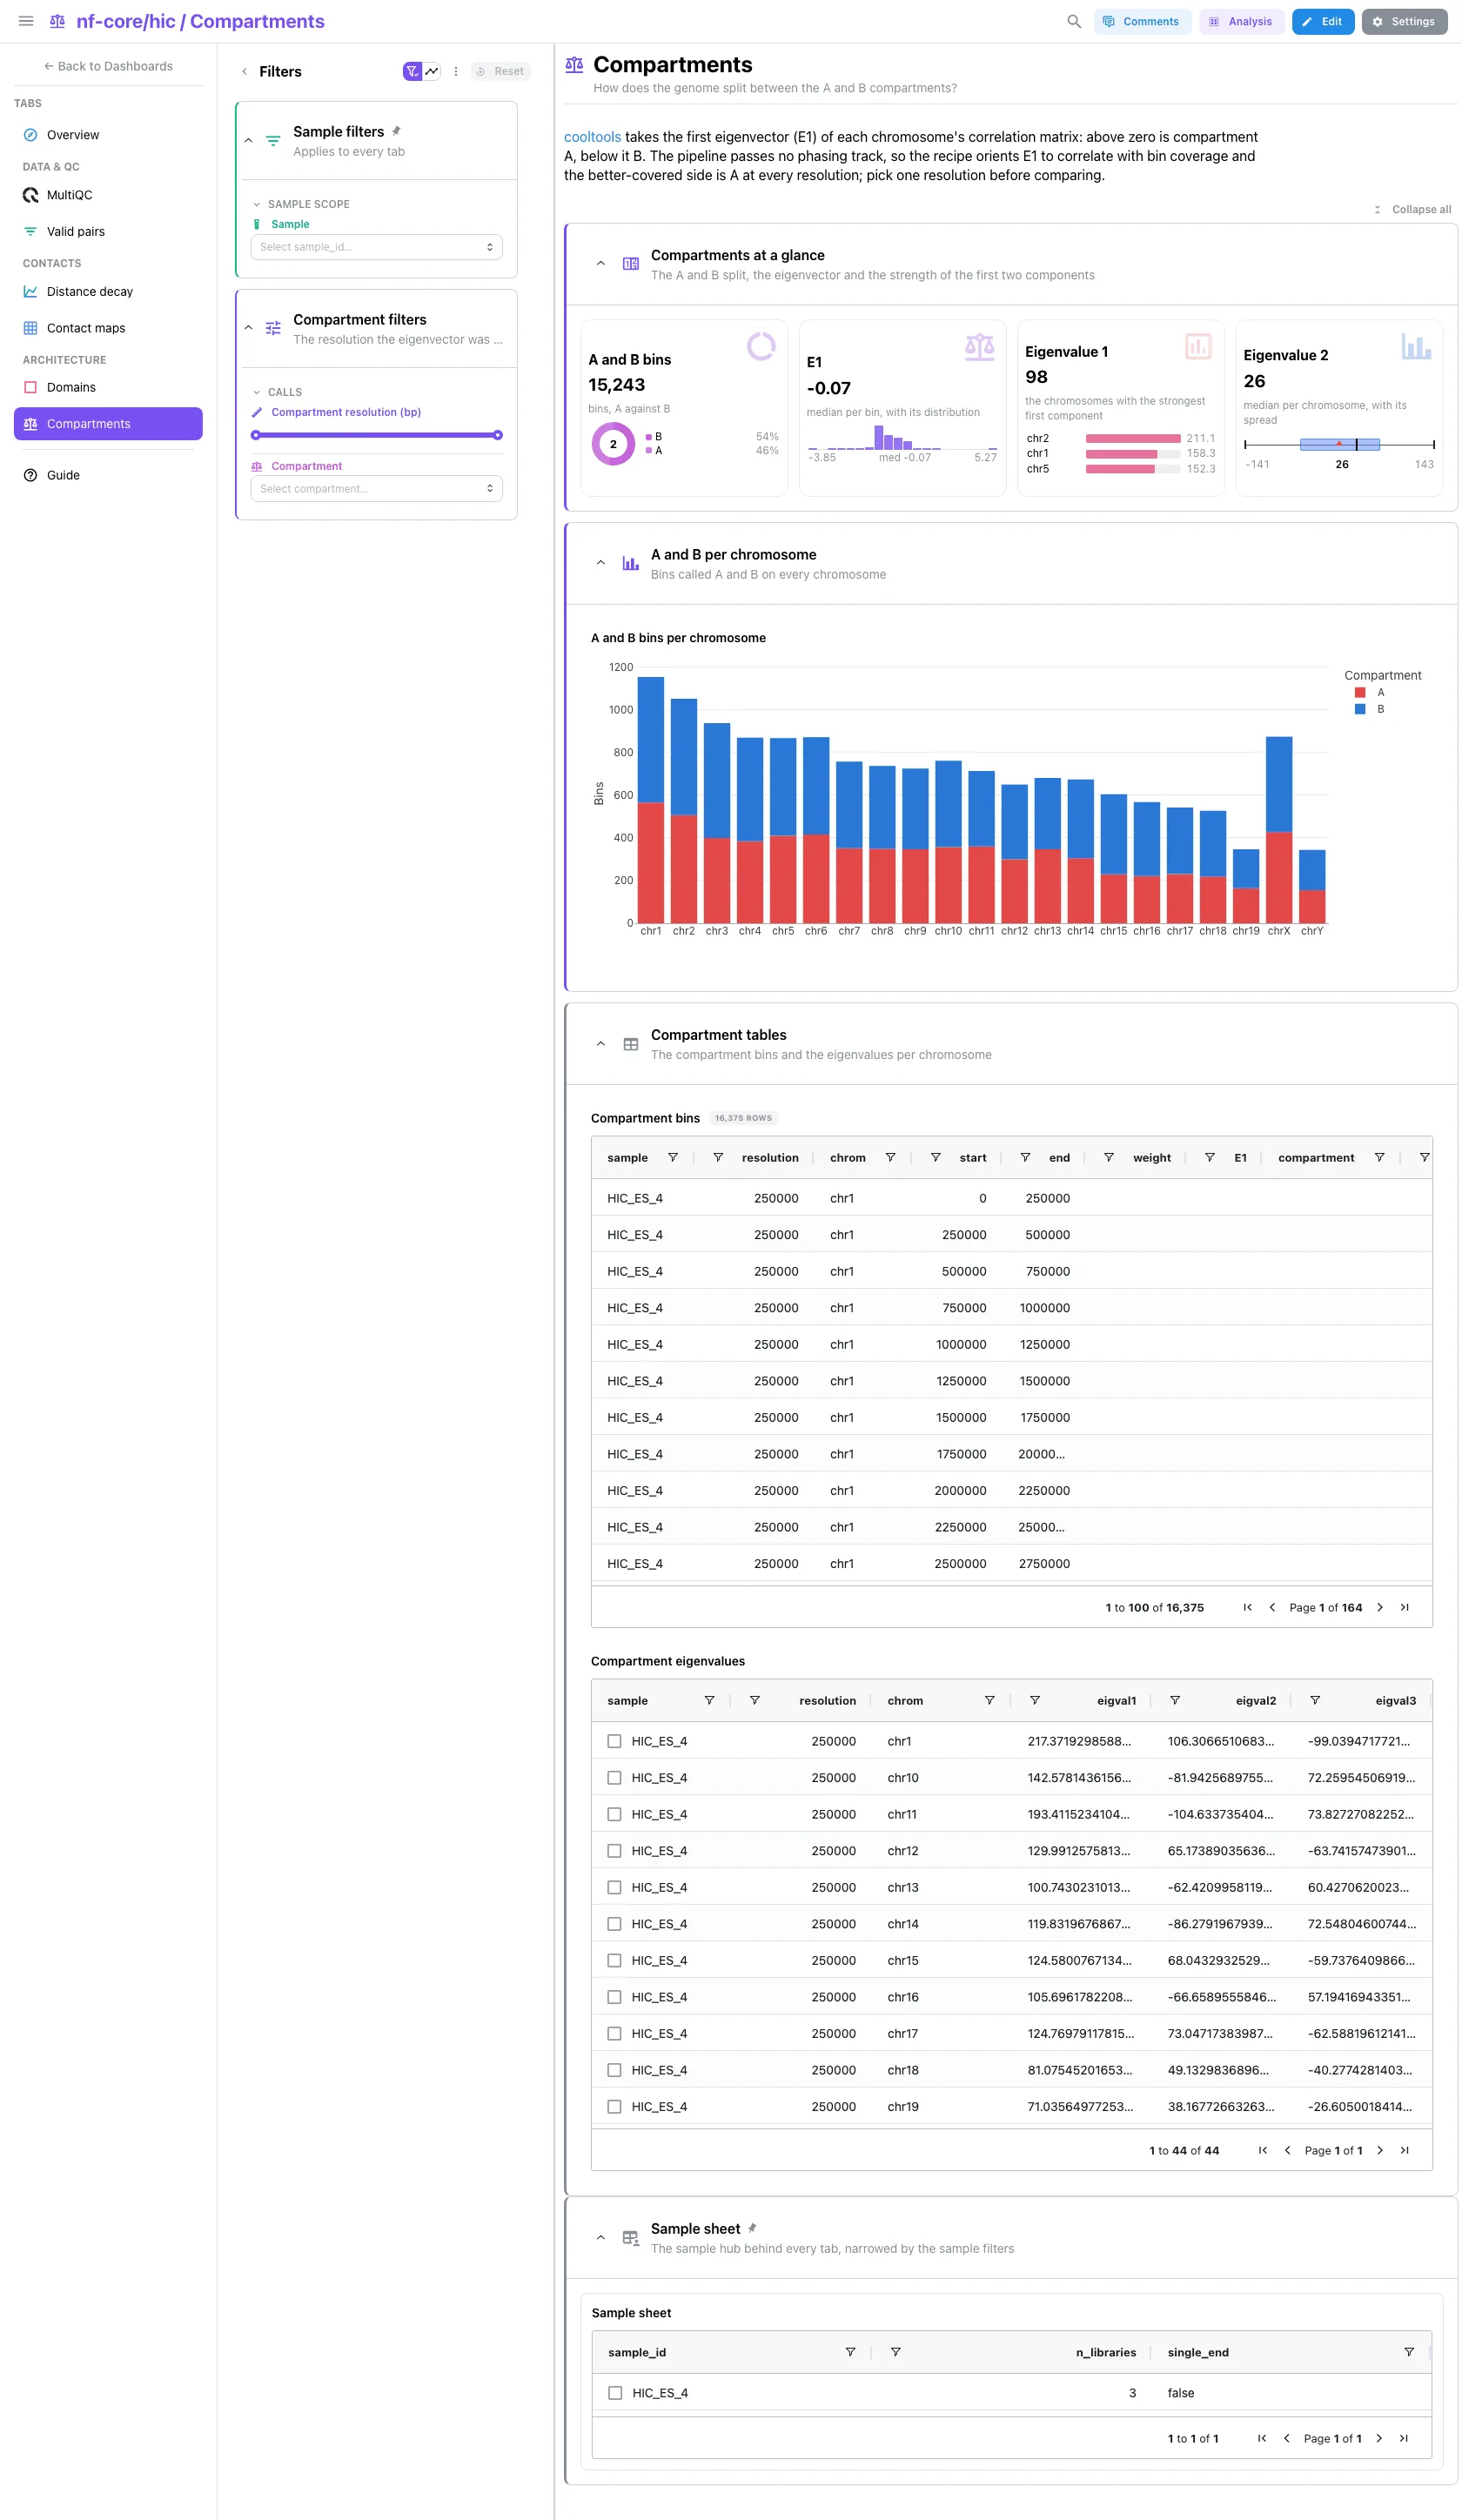
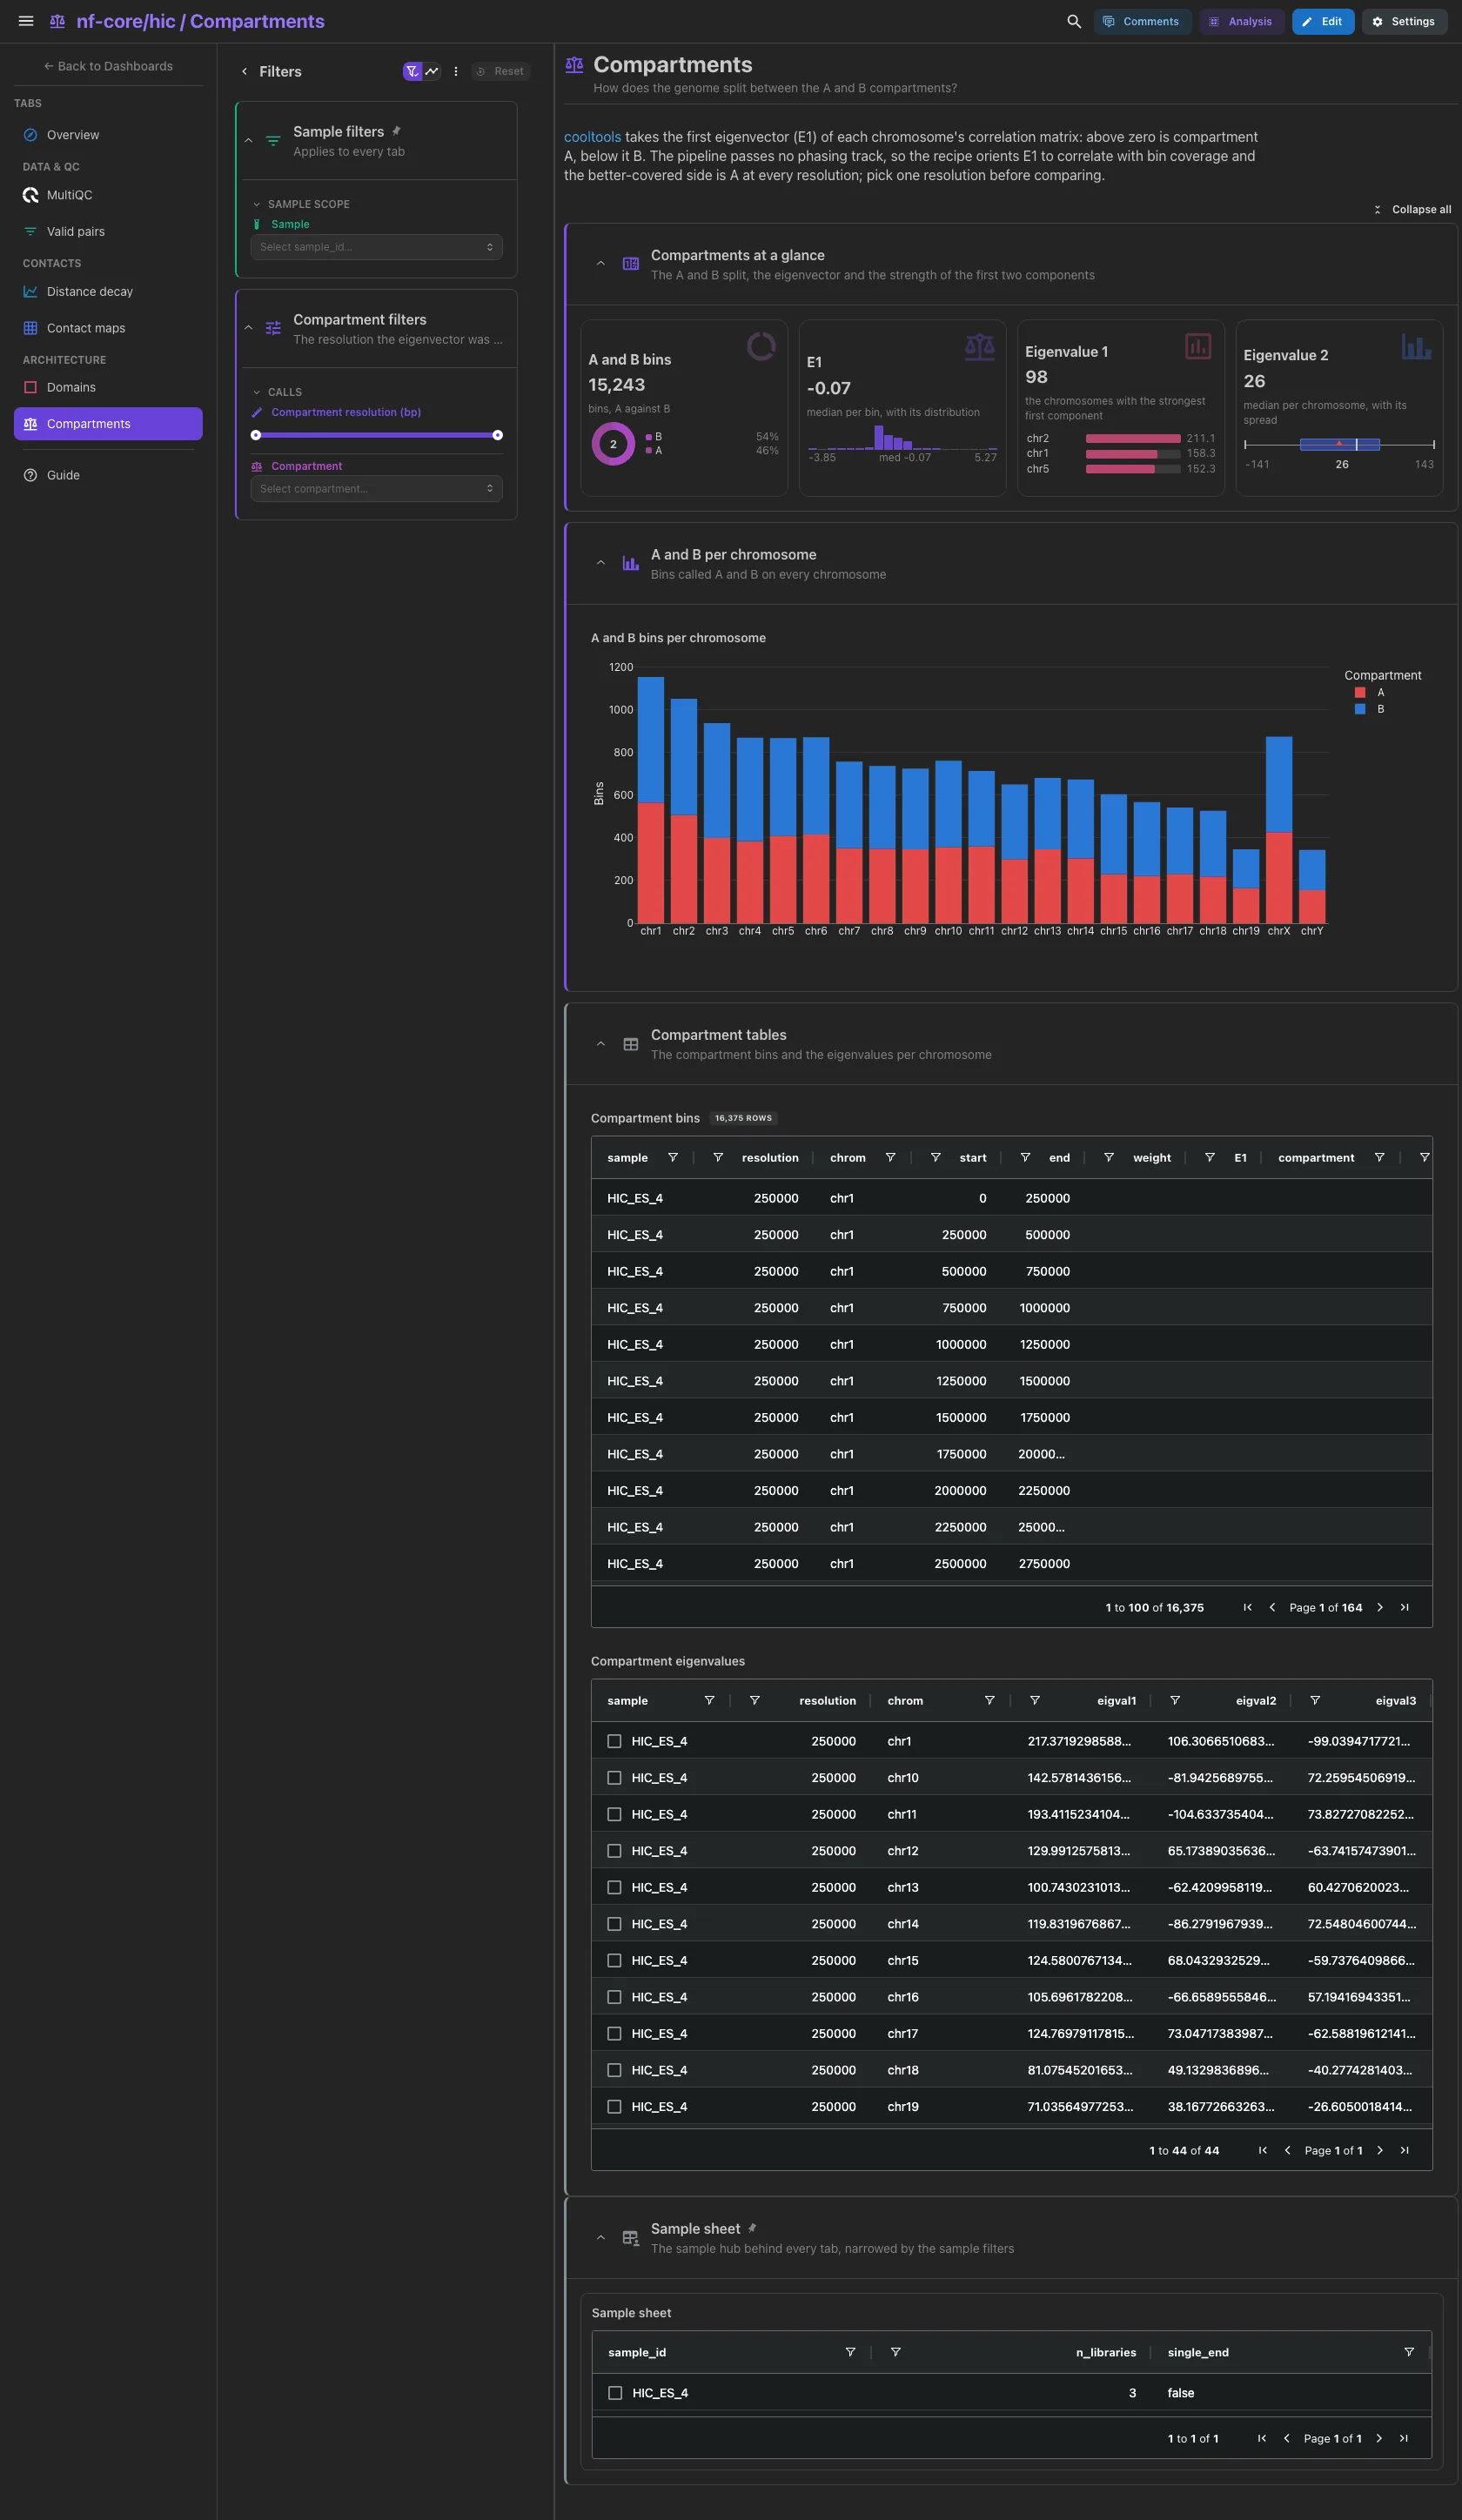
Genome-wide, no tracks. The bins with an E1 sign split into A and B, the median E1 (two humps when compartments are strong) and the first and second eigenvalues. Then the A and B bins per chromosome. nf-core/hic passes no phasing track, so E1 is oriented per chromosome and resolution to correlate with bin coverage: the better-covered side is A, and the call does not flip between resolutions. Pick one resolution before comparing.
Filters and components
Filters · Compartment resolution (bp) and Compartment on
compartment_eigenvector.
| Section | What it holds |
|---|---|
| Compartments at a glance | 4 cards |
| A and B per chromosome | A and B bins per chromosome |
| Compartment tables (collapsed) | Compartment bins, Compartment eigenvalues |
Tables select rows and the P(s) curve selects a chromosome: the sample sheet on
sample_id; the pair fates, the funnel, the P(s) bins and the eigenvalue tables
on sample; the P(s) curve on chrom. A pick narrows the other tiles of its
collection and follows the project links to the collections they reach. The
domain, insulation and compartment tables do not select: their rows are bins and
domains with no identifier column.
Running the pipeline
Depictio reads the output of nf-core/hic, it does not run the pipeline.
Run the pipeline first, without --skip_compartments or --skip_tads:
nextflow run nf-core/hic -r 2.0.0 \
  --input samplesheet.csv \
  --genome GRCm38 --digestion dpnii \
  -profile docker --outdir results
Then regenerate the MultiQC report and point Depictio at the results, passing the UCSC name of the same assembly:
python -m depictio.dev_scripts.multiqc_reprocess --src results/ --dest results/
depictio ingest results/ --template nf-core/hic/latest --var GENOME=mm10
See nf-co.re/hic/usage for full pipeline documentation.
Required data structure
Point depictio ingest at the directory holding the pipeline output. Depictio scans
recursively and matches on file name, so a run with a different --outdir
layout lands in the same collections.
<DATA_ROOT>/
├── samplesheet/samplesheet.valid.csv          # the hub: one row per FASTQ pair
├── pipeline_info/software_versions.yml
├── multiqc/multiqc_data/multiqc.parquet       # written by multiqc_reprocess
├── fastqc/*.zip                               # raw MultiQC inputs
├── hicpro/stats/<sample>/
│   └── *.{mmapstat,mpairstat,mRSstat,mergestat}
├── contact_maps/
│   ├── *_balanced.txt                         # cooler dump, one per resolution
│   └── cooler_bins_<resolution>.bed
├── compartments/
│   ├── *.cis.vecs.tsv                         # cooltools eigs-cis E1
│   └── *.cis.lam.txt                          # eigenvalues
├── tads/*_balanced_insulation.tsv             # cooltools insulation
└── distance_decay/*_distcount.txt             # hicPlotDistVsCounts
Validation runs
The template was validated on the nf-core AWS megatest of the 2.0.0 release,
s3://nf-core-awsmegatests/hic/results-b4d89cfacf97a5835fba804887cf0fc7e0449e8d/,
a single mouse ES cell sample merged from three FASTQ pairs, and the screenshots
above come from that run with GENOME=mm10. With one sample the sample filter
has one value, but nothing in the template assumes it: every collection carries a
sample column and the links are ready for a cohort.
DEST=/tmp/hic_test
bash depictio/projects/nf-core/hic/2.0.0/download_test_data.sh "$DEST"
python -m depictio.dev_scripts.multiqc_reprocess --src "$DEST" --dest "$DEST"
depictio ingest "$DEST" --template nf-core/hic/latest --var GENOME=mm10
Do not pass --project when ingesting: the dashboard is attached to the
project by name, so renaming it breaks a later depictio dashboard import.
Re-ingesting accumulates dashboards, so delete the project before repeating a run.
Additional resources
- nf-co.re/hic: official pipeline documentation
- nf-co.re/hic/2.0.0/results: AWS test results
- Template System Reference: YAML format, variables, conditionals
- Recipes: how to read, test, and write recipes
Authorship
 weber8thomas
Reviewing a template on your own data, or taking over a role here, is a contribution in itself: the contributing guide says what each one involves.