

The viralrecon template follows a standard nf-core/viralrecon amplicon run from reads to variant calls and lineage, one tab or tab group per step:
- Overview: the run in four key figures, live findings and four figures, each linked to the tab that explains it
- Data & QC: the MultiQC report, per-sample alignment and consensus QC, and mosdepth coverage per window and per amplicon
- Variants: every call with its snpEff effect, its allele frequency and its read support (iVar on Illumina runs)
- Lineage & Clustering: Pangolin lineages and Nextclade clades with their QC verdicts, and the samples grouped by the mutations they share
Works beyond SARS-CoV-2
The pipeline supports any viral genome in nf-core's reference-genomes config. This template was validated on SARS-CoV-2 ARTIC amplicon data, but the recipes and dashboard carry over to other viruses with the same iVar variant calling and Pangolin and Nextclade typing layout. The dashboard texts name no virus, primer scheme or reference.
Quick start
The results directory is the only thing you have to pass. The template reads a
sequencing-runs layout, so point it at the parent of one or more
run_* directories, each holding one viralrecon --outdir. Every run found
there is aggregated into the same collections.
depictio config nextflow --install     # once per machine
nextflow run nf-core/viralrecon -r 3.0.0 -profile docker \
  --outdir runs/run_1 --depictio_data_root runs
No depictio ingest, and no template named: the pipeline ingests its own
output, and the template is picked from the pipeline's own name and version.
Write the run into a run_* directory and point --depictio_data_root at
its parent. See Nextflow trigger.
| Variable | Required | What it does |
|---|---|---|
DATA_ROOT |
yes | Parent of the run_* directories holding the viralrecon output (multiqc/, variants/). |
IS_NANOPORE |
no | Set automatically when the run's params.json records platform: nanopore. Repoints the coverage and typing collections at the artic_minion/ layout and drops the Illumina-only collections. |
Override the auto-derived value
IS_NANOPORE is read from pipeline_info/params*.json and logged at
resolution time. Pass --var IS_NANOPORE=true to force the nanopore route,
for example when a DATA_ROOT aggregates runs whose parameters were not
kept. See the routes in the Reference.
Aggregated data collections
The viralrecon DCs use metatype: "Aggregated". They are built
by recipes that fan multiple per-sample files into a single delta
table via glob_pattern. See Recipes
for the underlying mechanism.
Reference
Recipe DCs fan per-sample files into one delta table via glob_pattern. The
IS_NANOPORE route repoints the coverage and typing DCs at the artic_minion/
layout and drops variants_long and the views built on the variant calls, since an
ARTIC run writes no variants_long_table.csv. summary_metrics stays, read from the
ARTIC summary CSV with its share of reads mapped left empty.
Direct vs derived data collections
The template exposes two kinds of data collection, and the Origin column of the reference table below flags each one explicitly, so you can tell real measurements from views at a glance:
| Origin | What it is | Examples |
|---|---|---|
| direct | A real pipeline output, scanned straight off disk or lightly cleaned by a recipe that reads the raw files. This is the data. | variants_long, pangolin_lineages, nextclade_results, mosdepth_amplicon_coverage |
| derived | A reshape of one or more direct collections into the exact column layout an advanced visualization needs: a view, not new measurement (its recipe reads another collection via dc_ref). |
oncoplot_canonical, complex_heatmap_canonical, coverage_track_canonical, sankey_canonical, upset_canonical, variant_feature_matrix_canonical |
Each derived collection names its source recipe in the reference table's Reads column.
Self-adapting layout
The dashboard adapts to whatever the run actually produced: components bound to pruned or unparsed data collections are hidden, tabs left with no real visualizations are dropped, and the rest are re-packed with no empty rows. One template therefore covers both the Illumina and nanopore/ARTIC routes without edits.
Template variables
Variables you provide when running the template: DATA_ROOT is the results directory given to depictio ingest, the others are set with --var NAME=value:
| Variable | Required | Description |
|---|---|---|
DATA_ROOT |
✓ | Root directory containing viralrecon pipeline output (multiqc/, variants/) |
Auto-detected (set from the run's metadata / params.json; the route flags drive Conditional routes below): IS_NANOPORE
Data collections
14 data collections — 2 required 12 optional · 8 direct 6 derived.
Origin tells you whether a collection is real pipeline data or a reshape of it: direct = a pipeline output (scanned, or a recipe that reads raw files); derived = a recipe that reshapes one or more direct collections into the layout a visualization needs (no new measurement). Reads shows what produces it: a recipe .py transform, whose name links to its source on GitHub, or a raw file scanned off disk. (A direct collection can still have a recipe — one that merely parses/cleans the raw file; derived means the recipe reshapes another collection.)
| Tag | Origin | Type | Reads | Status |
|---|---|---|---|---|
multiqc_data |
direct |  MultiQC MultiQC |
file multiqc/multiqc_data/multiqc.parquet |
required |
summary_metrics |
direct | Table | recipe multiqc/summary_metrics.py |
required |
variants_long |
direct | Table | recipe ivar/variants_long.py |
optional |
pangolin_lineages |
direct | Table | recipe pangolin/pangolin_lineages.py |
optional |
nextclade_results |
direct | Table | recipe nextclade/nextclade_results.py |
optional |
mosdepth_amplicon_coverage |
direct | Table | file variants/bowtie2/mosdepth/amplicon/all_samples.mosdepth.coverage.tsv |
optional |
mosdepth_genome_coverage |
direct | Table | file variants/bowtie2/mosdepth/genome/all_samples.mosdepth.coverage.tsv |
optional |
mosdepth_amplicon_heatmap |
direct | Table | file variants/bowtie2/mosdepth/amplicon/all_samples.mosdepth.heatmap.tsv |
optional |
oncoplot_canonical |
derived | Table | recipe nf-core/viralrecon/oncoplot_canonical.py |
optional |
complex_heatmap_canonical |
derived | Table | recipe mosdepth/complex_heatmap_canonical.py |
optional |
coverage_track_canonical |
derived | Table | recipe mosdepth/coverage_track_canonical.py |
optional |
sankey_canonical |
derived | Table | recipe nf-core/viralrecon/sankey_canonical.py |
optional |
upset_canonical |
derived | Table | recipe nf-core/viralrecon/upset_canonical.py |
optional |
variant_feature_matrix_canonical |
derived | Table | recipe nf-core/viralrecon/variant_feature_matrix_canonical.py |
optional |
Conditional routes
Rows are data collections; columns are the variables you set or params.json flags auto-detected from the run. Each filled cell is the effect of setting that variable; an empty cell means that variable leaves the collection unchanged. (5 collections are unaffected by any variable — present on every run.)
+ included− removed⇄ repointed
| Data collection | IS_NANOPORE |
|---|---|
variants_long |
− |
pangolin_lineages |
⇄ |
nextclade_results |
⇄ |
mosdepth_amplicon_coverage |
⇄ |
mosdepth_genome_coverage |
⇄ |
mosdepth_amplicon_heatmap |
⇄ |
oncoplot_canonical |
− |
upset_canonical |
− |
variant_feature_matrix_canonical |
− |
Cross-DC links
12 links — selecting a value in the source collection filters the target. The join column is shown after the source.
| Source · column | Target | Filters | |
|---|---|---|---|
summary_metrics · sample |
→ | multiqc_data |
Filter MultiQC by sample selections from summary metrics |
summary_metrics · sample |
→ | variants_long |
Filter variants table by selected samples |
summary_metrics · sample |
→ | pangolin_lineages |
Filter Pangolin lineages by selected samples |
summary_metrics · sample |
→ | nextclade_results |
Filter Nextclade results by selected samples |
summary_metrics · sample |
→ | mosdepth_amplicon_coverage |
Filter amplicon coverage by selected samples |
summary_metrics · sample |
→ | mosdepth_genome_coverage |
Filter genome coverage by selected samples |
summary_metrics · sample |
→ | mosdepth_amplicon_heatmap |
Filter amplicon heatmap by selected samples |
summary_metrics · sample |
→ | complex_heatmap_canonical |
Filter the clustered amplicon heatmap by selected samples |
summary_metrics · sample |
→ | coverage_track_canonical |
Filter the genome coverage track by selected samples |
summary_metrics · sample |
→ | sankey_canonical |
Filter the classification funnel by selected samples |
summary_metrics · sample |
→ | oncoplot_canonical |
Filter the oncoplot by selected samples |
summary_metrics · sample |
→ | variant_feature_matrix_canonical |
Filter the variant feature matrix by selected samples |
Recipes
Each recipe reshapes raw pipeline output into a tidy table. The name links to its source; Output lists the validated OUTPUT_SCHEMA columns.
| Recipe | Transforms | Output |
|---|---|---|
ivar/variants_long.py |
Clean and normalize viralrecon variants_long_table.csv for dashboard consumption. | sample, CHROM, POS, REF, ALT, FILTER, DP, REF_DP, ALT_DP, AF, GENE, AA, EFFECT, FUNCLASS, mutation_label |
mosdepth/complex_heatmap_canonical.py |
Canonical-schema ComplexHeatmap DC for viralrecon amplicon coverage. | sample |
mosdepth/coverage_track_canonical.py |
Canonical-schema Coverage Track DC for viralrecon. | chromosome, position, value |
multiqc/summary_metrics.py |
Parse viralrecon summary_variants_metrics_mqc.csv into a clean per-sample metrics table. | sample, num_reads_mapped, pct_reads_mapped, coverage_median, pct_genome_covered_1x, pct_genome_covered_10x, num_variants_snp, num_variants_indel, num_variants_total, lineage |
nextclade/nextclade_results.py |
Extract and clean Nextclade clade assignment results from viralrecon output. | sample, clade, Nextclade_pango, totalSubstitutions, totalDeletions, totalInsertions, totalFrameShifts, totalMissing, totalNonACGTNs, alignmentScore, coverage, qc_overallScore, qc_overallStatus |
nf-core/viralrecon/oncoplot_canonical.py |
Canonical-schema Oncoplot DC for viralrecon variants. | sample_id, gene, mutation_type |
nf-core/viralrecon/sankey_canonical.py |
Canonical-schema Sankey DC for viralrecon lineage / clade typing. | sample, qc_status, lineage, clade |
nf-core/viralrecon/upset_canonical.py |
Canonical-schema UpSet DC for viralrecon variants. | mutation_label |
nf-core/viralrecon/variant_feature_matrix_canonical.py |
Canonical-schema sample × variant feature matrix for live PCA embedding. | sample_id |
pangolin/pangolin_lineages.py |
Extract and clean Pangolin lineage assignments from viralrecon output. | sample, lineage, conflict, ambiguity_score, scorpio_call, scorpio_support, pangolin_version, qc_status |
Dashboard tabs
One dashboard: the Overview, then five child tabs in two groups, read as a funnel from the reads to the lineage of each consensus genome. Each tab below carries the same icon and colour the dashboard gives it, so the page and the app read alike.
| Group | Tabs |
|---|---|
| Data & QC | MultiQC, Sample QC, Coverage & Depth |
| Genomes | Variants, Lineage & Clustering |
Each child tab opens with a short intro and a strip of four cards, then at most
three open sections; tables and details follow, collapsed. The run summary,
summary_metrics, is the source of every cross-DC link, so a filter on it reaches
every tab. The persistent Sample filters (lineage, then sample id) and QC
thresholds (genome at 10x, median depth, reads mapped, variants called) sit in the
left panel and narrow every tab. The Sample sheet, the run summary table, is
pinned, collapsed, to the bottom of every child tab.
Nanopore (ARTIC) runs
A nanopore run keeps the Overview's Key figures, the persistent filters and the
Sample sheet: the run summary is read from the ARTIC summary CSV, which has every
column but the share of reads mapped, left empty. Coverage, lineage and clade are
read from artic_minion/. The ARTIC route writes no variant long table, so the
Variants tab, the PCA and the UpSet drop, and so do the Overview's missense row
and its allele frequency figure.
Viral genomes, from reads to variants, consensus and lineage.
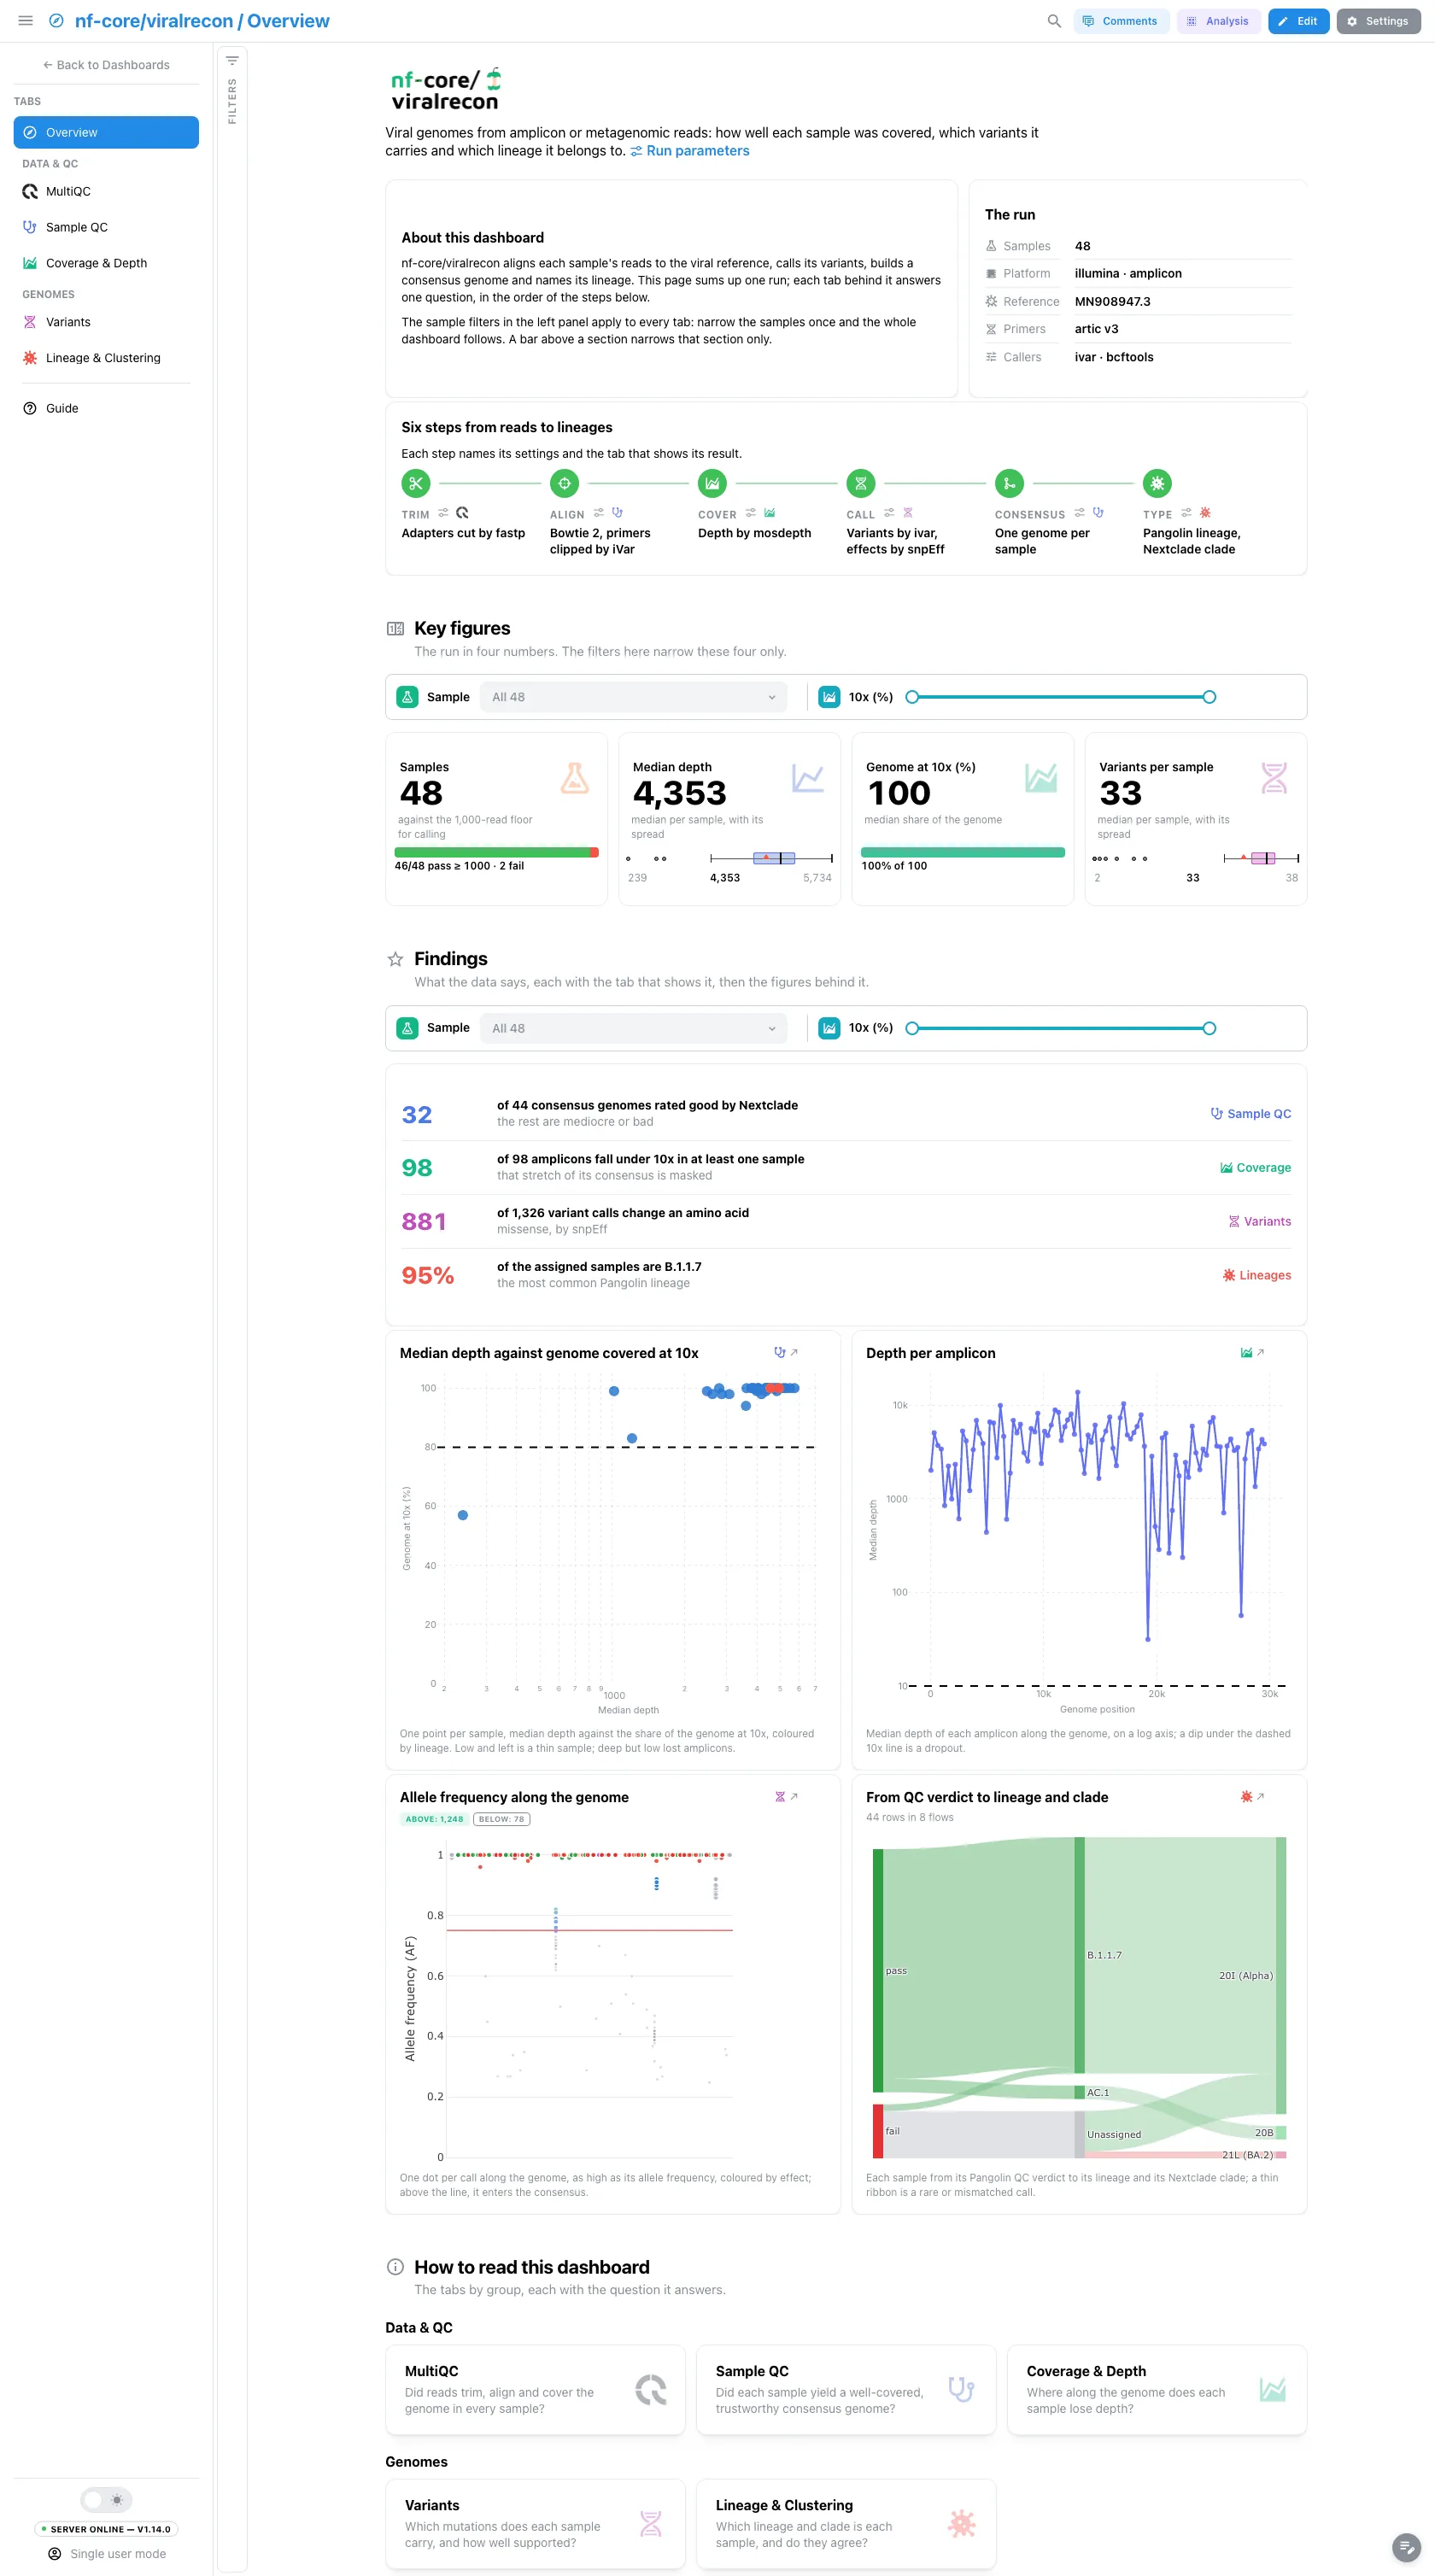
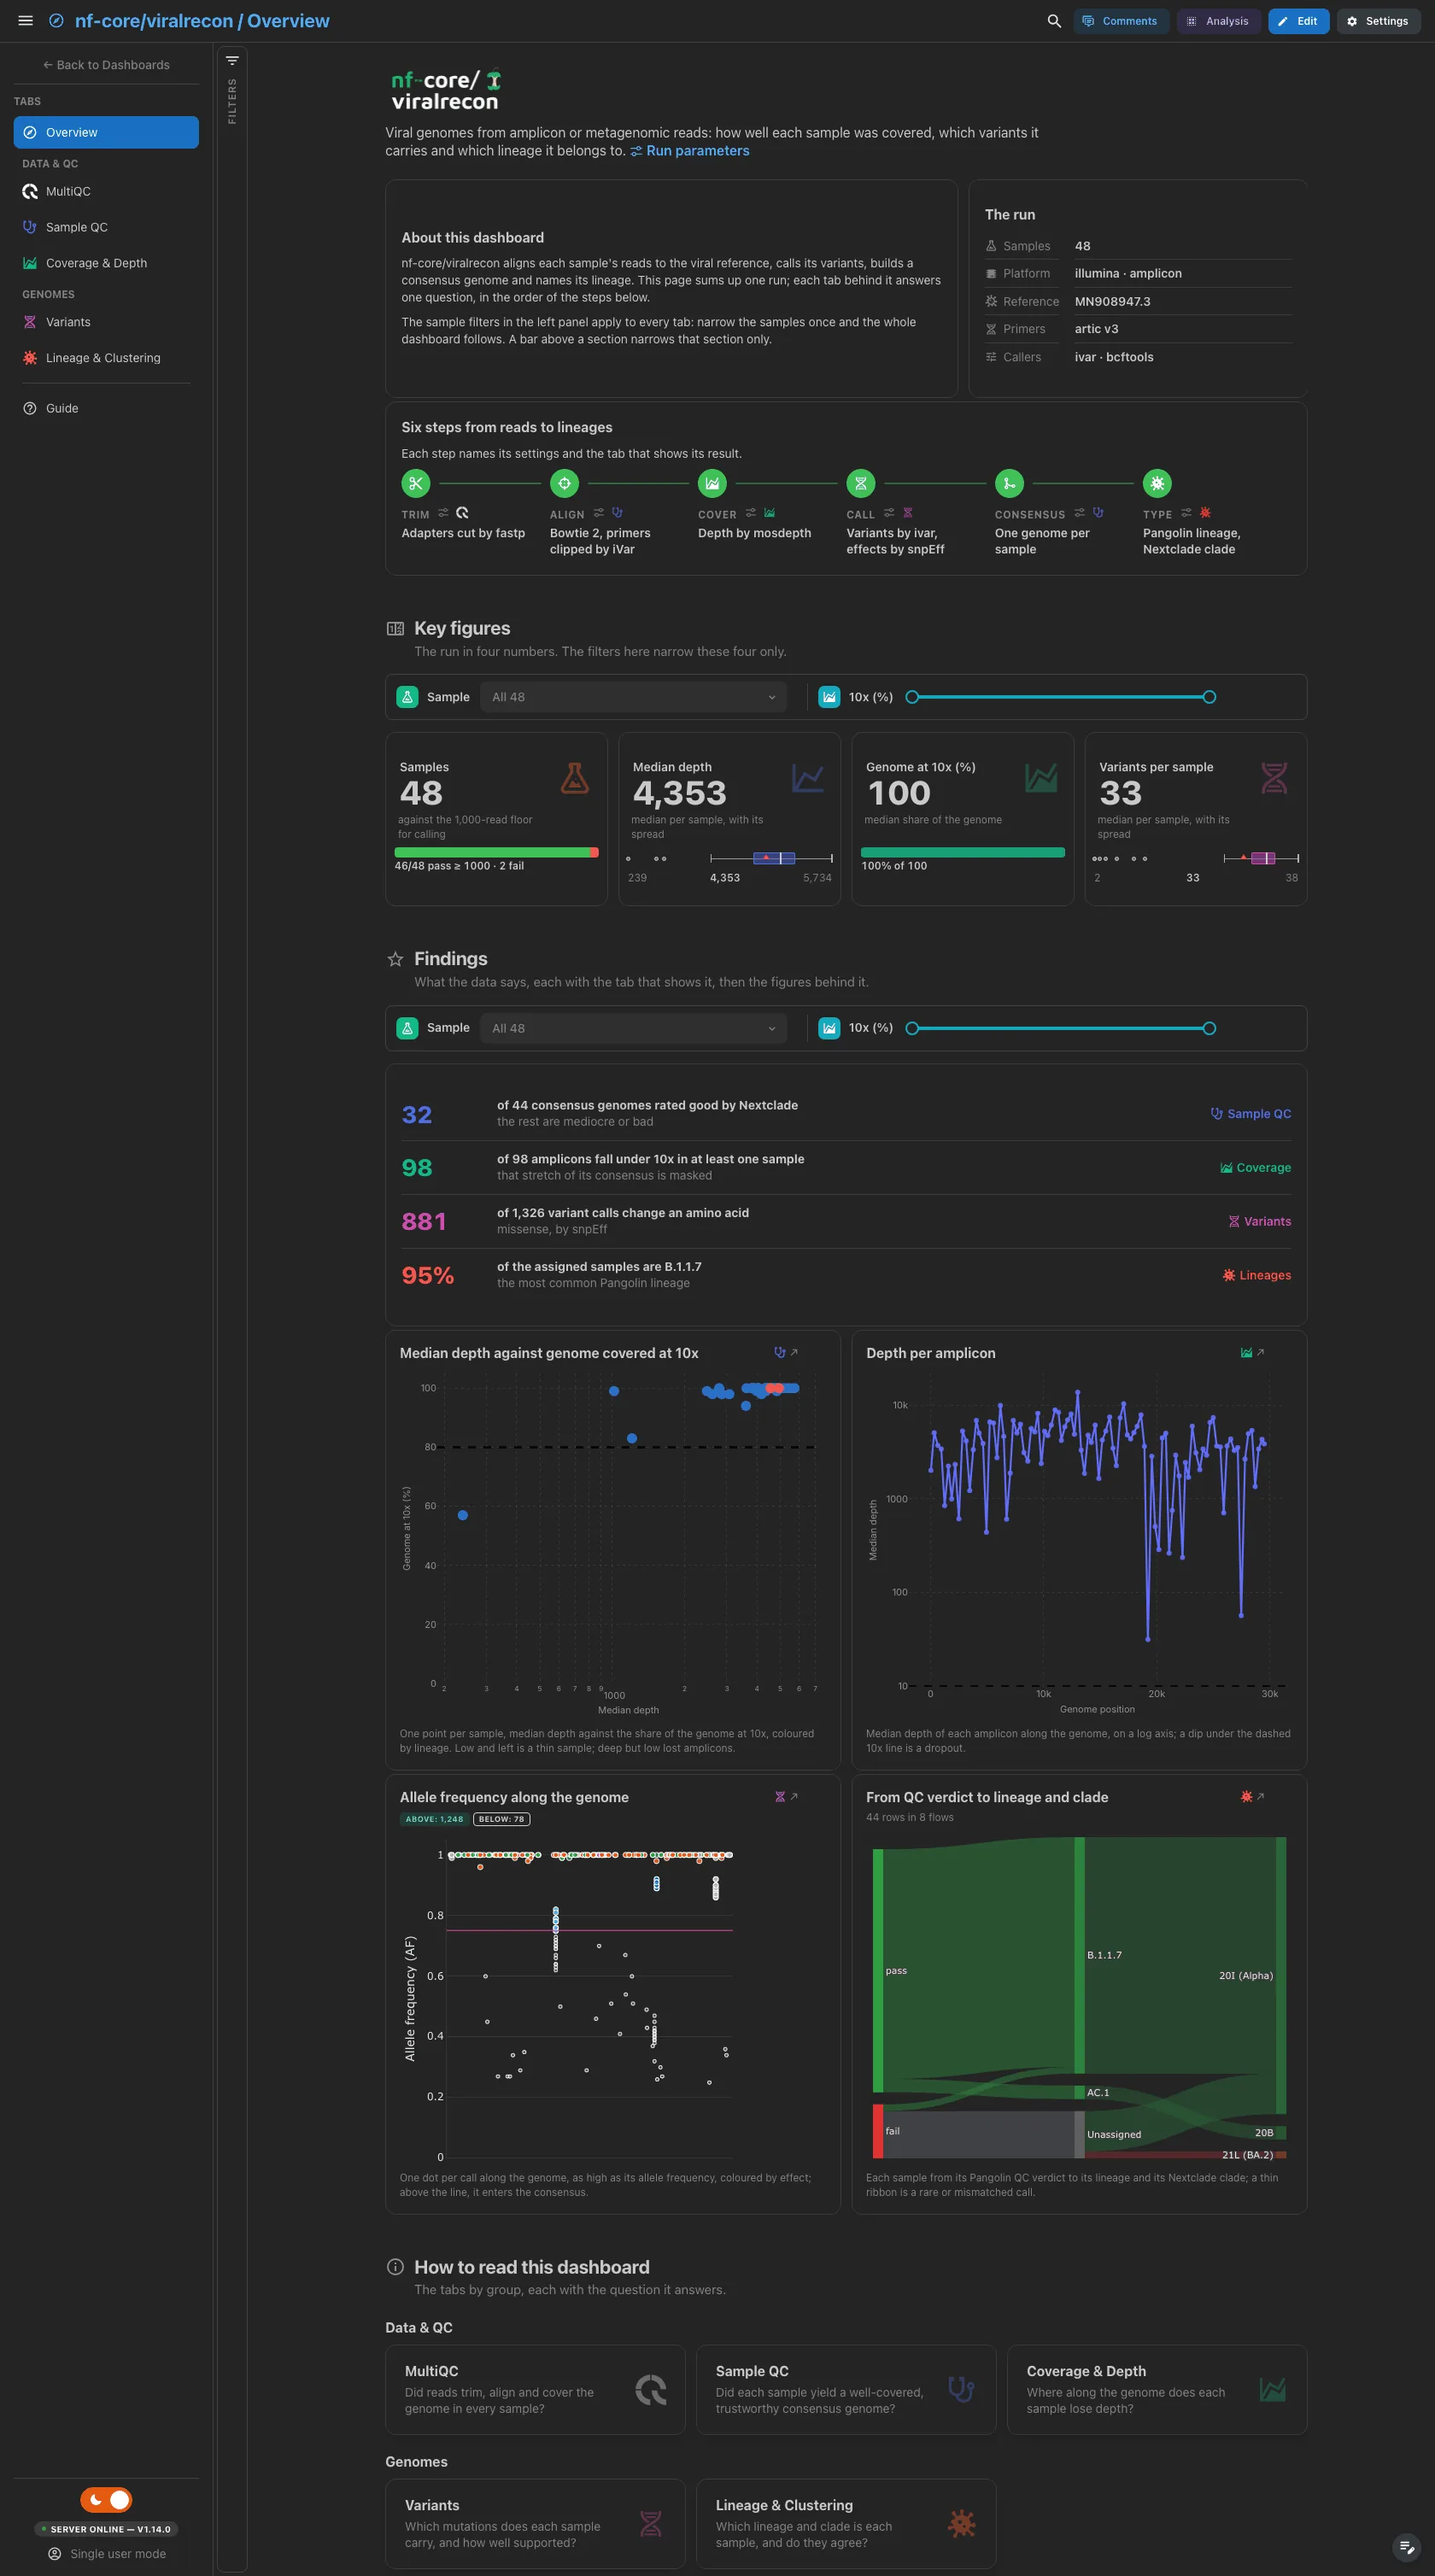
A short hero links the run parameters. About this dashboard says how to move through the tabs, The run lists the samples, platform and protocol, reference, primer scheme and callers, and Pipeline walks the six steps from trimming to typing, each linked to its parameters and its tab. The findings are live values: they follow the filters, and a route that lacks their data drops them.
Filters and components
Filters · the left panel starts collapsed. Key figures and Findings each have a filter bar (sample id and a genome-at-10x range) that narrows that section only.
| Section | What it holds |
|---|---|
| Top | Hero, About this dashboard, The run, Pipeline |
| Key figures | 4 headline cards on the run summary: samples, median depth, genome at 10x, variants per sample |
| Findings | Live result rows, then 4 figures: depth against genome at 10x, depth per amplicon, allele frequency along the genome, and the flow from QC verdict to lineage and clade |
| How to read this dashboard | The tabs by group, each with its question |
Data & QC · Did reads trim, align and cover the genome in every sample?
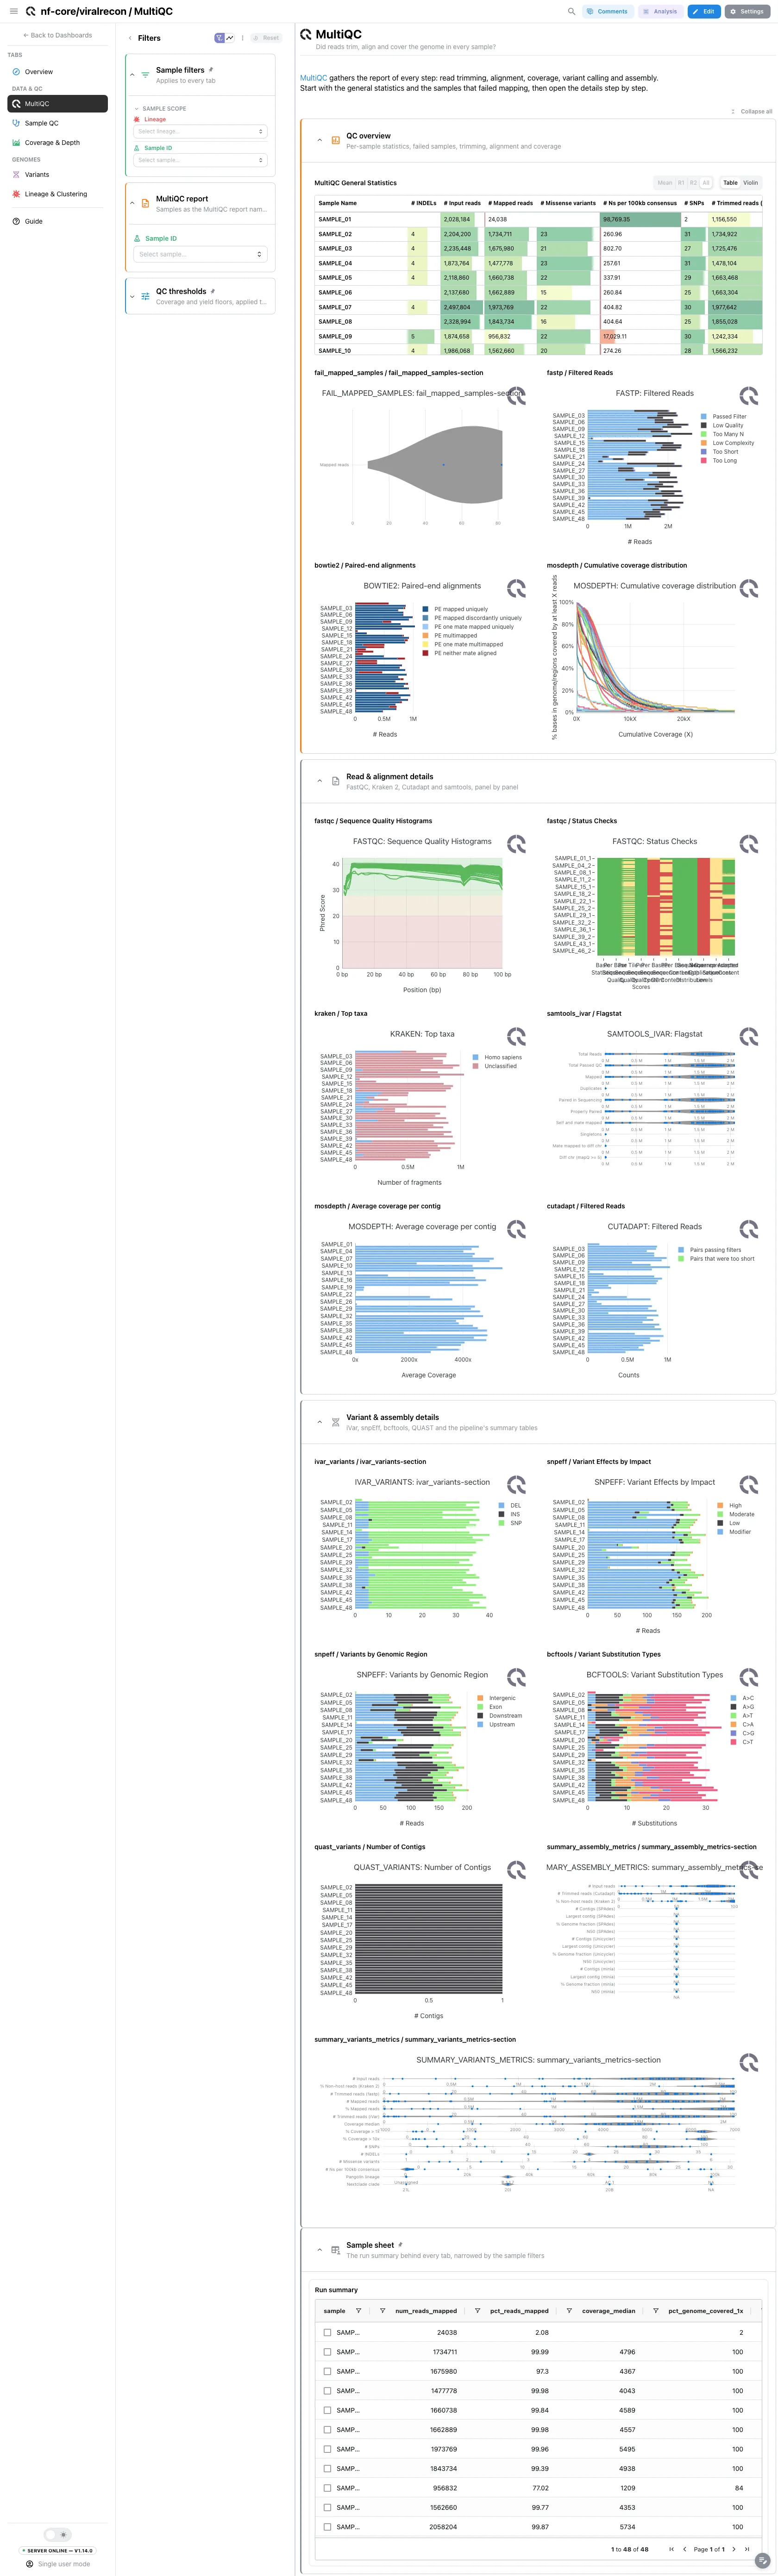
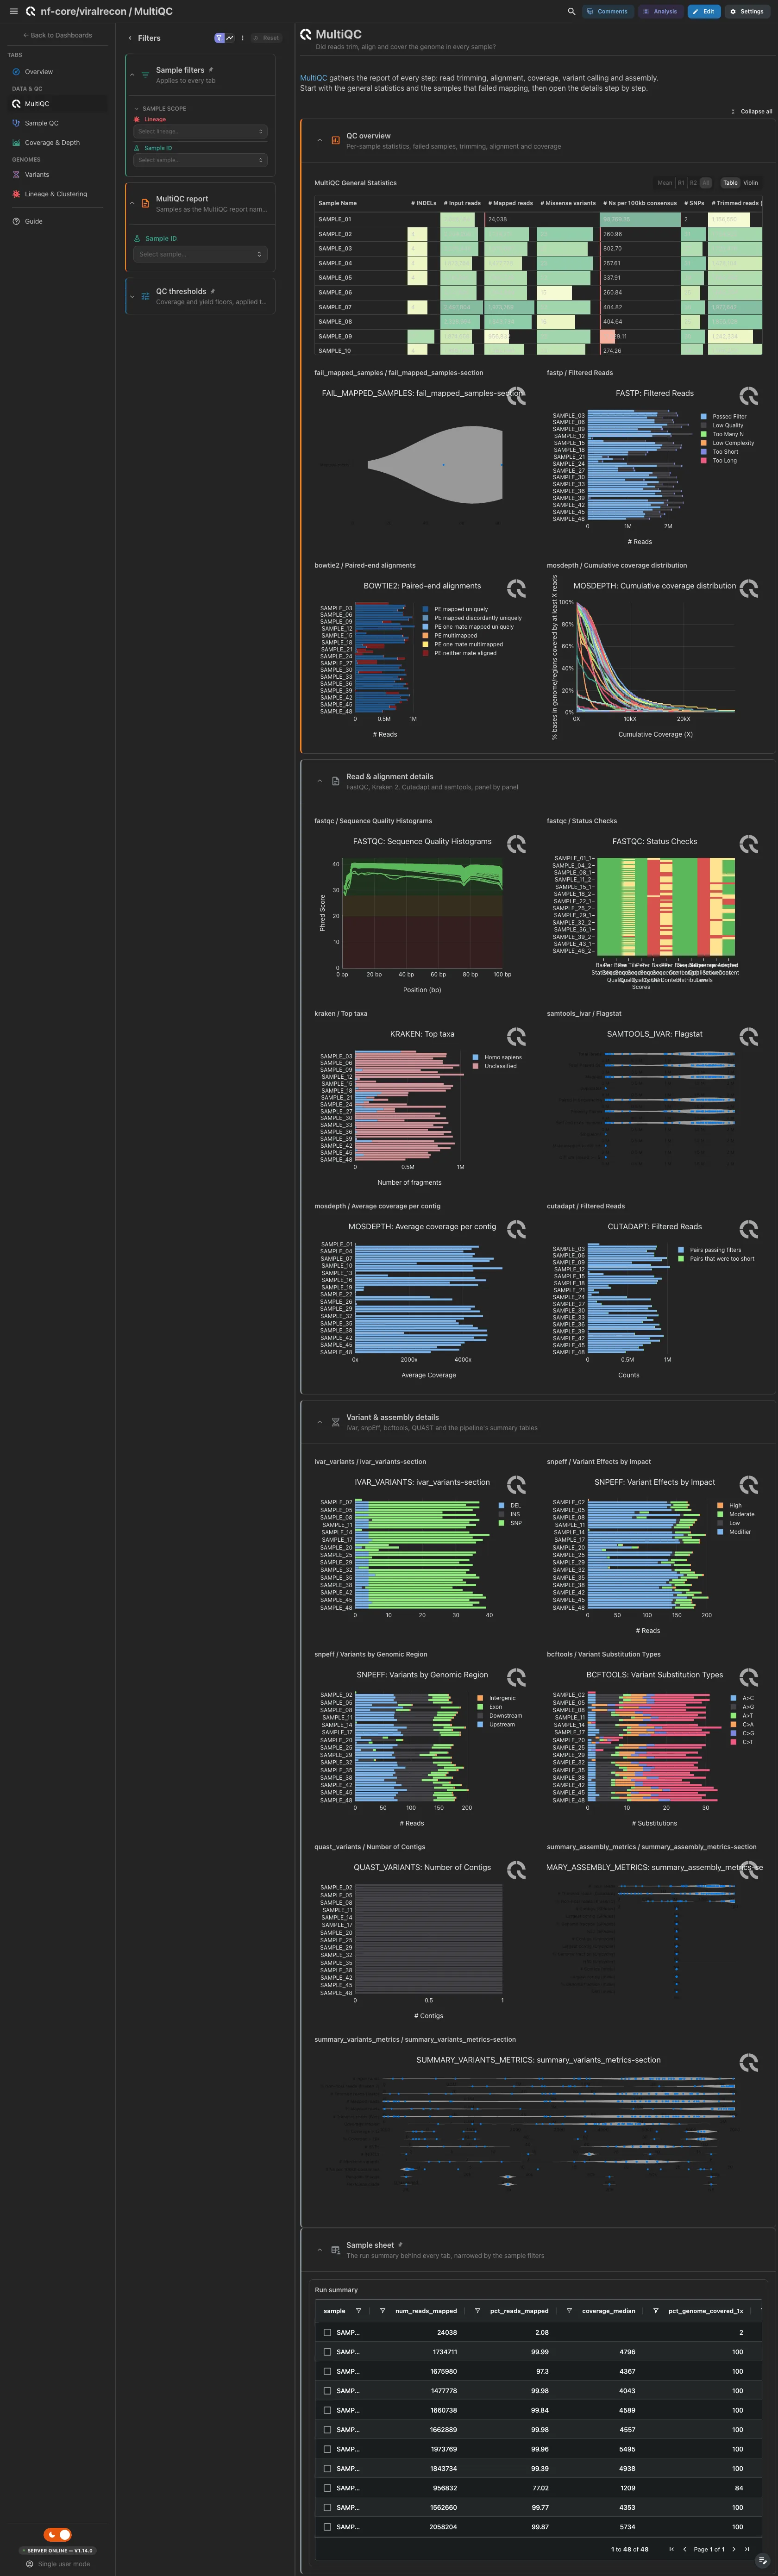
MultiQC panels only: general statistics, the samples that failed mapping, fastp filtered reads, Bowtie 2 alignments and the mosdepth cumulative coverage open. The read and alignment panels and the variant and assembly panels follow, collapsed. Its sample filter reads the MultiQC report.
Filters and components
Filters · Sample ID, read from the MultiQC report.
| Section | What it holds |
|---|---|
| QC overview | 5 MultiQC panels |
| Read & alignment details (collapsed) | 6 MultiQC panels |
| Variant & assembly details (collapsed) | 7 MultiQC panels |
Data & QC · Did each sample yield a well-covered, trustworthy consensus genome?
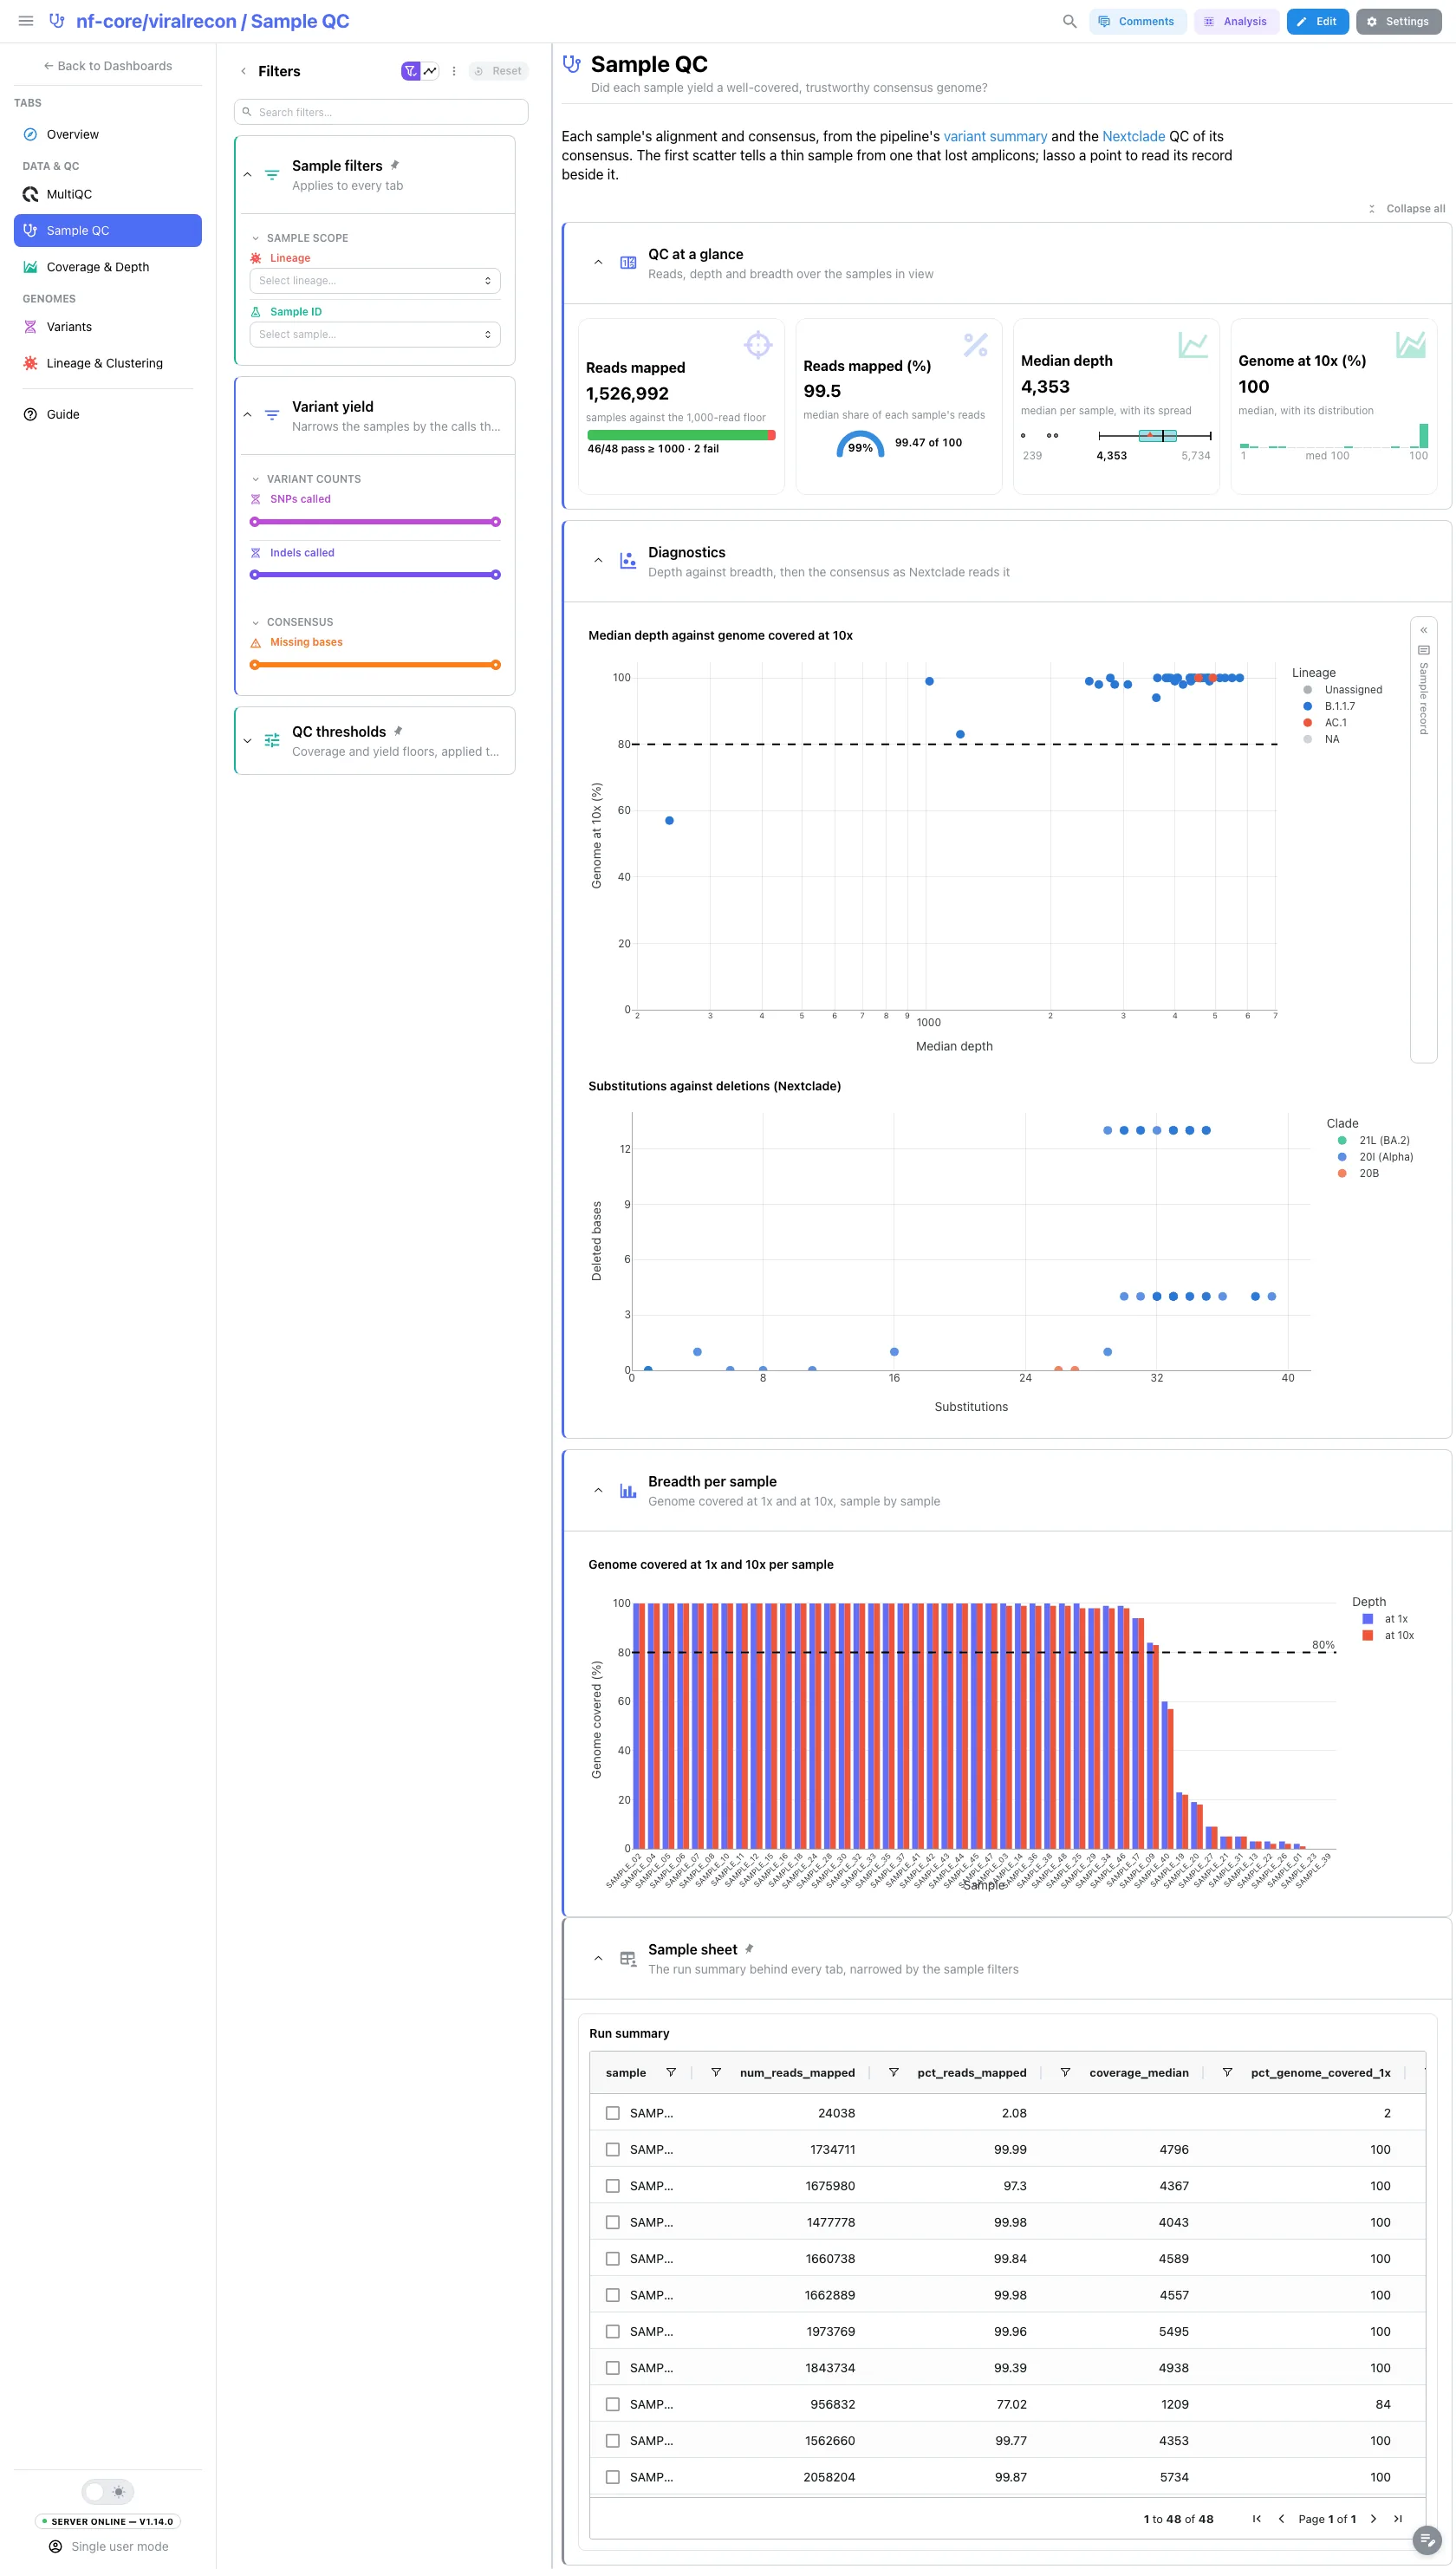
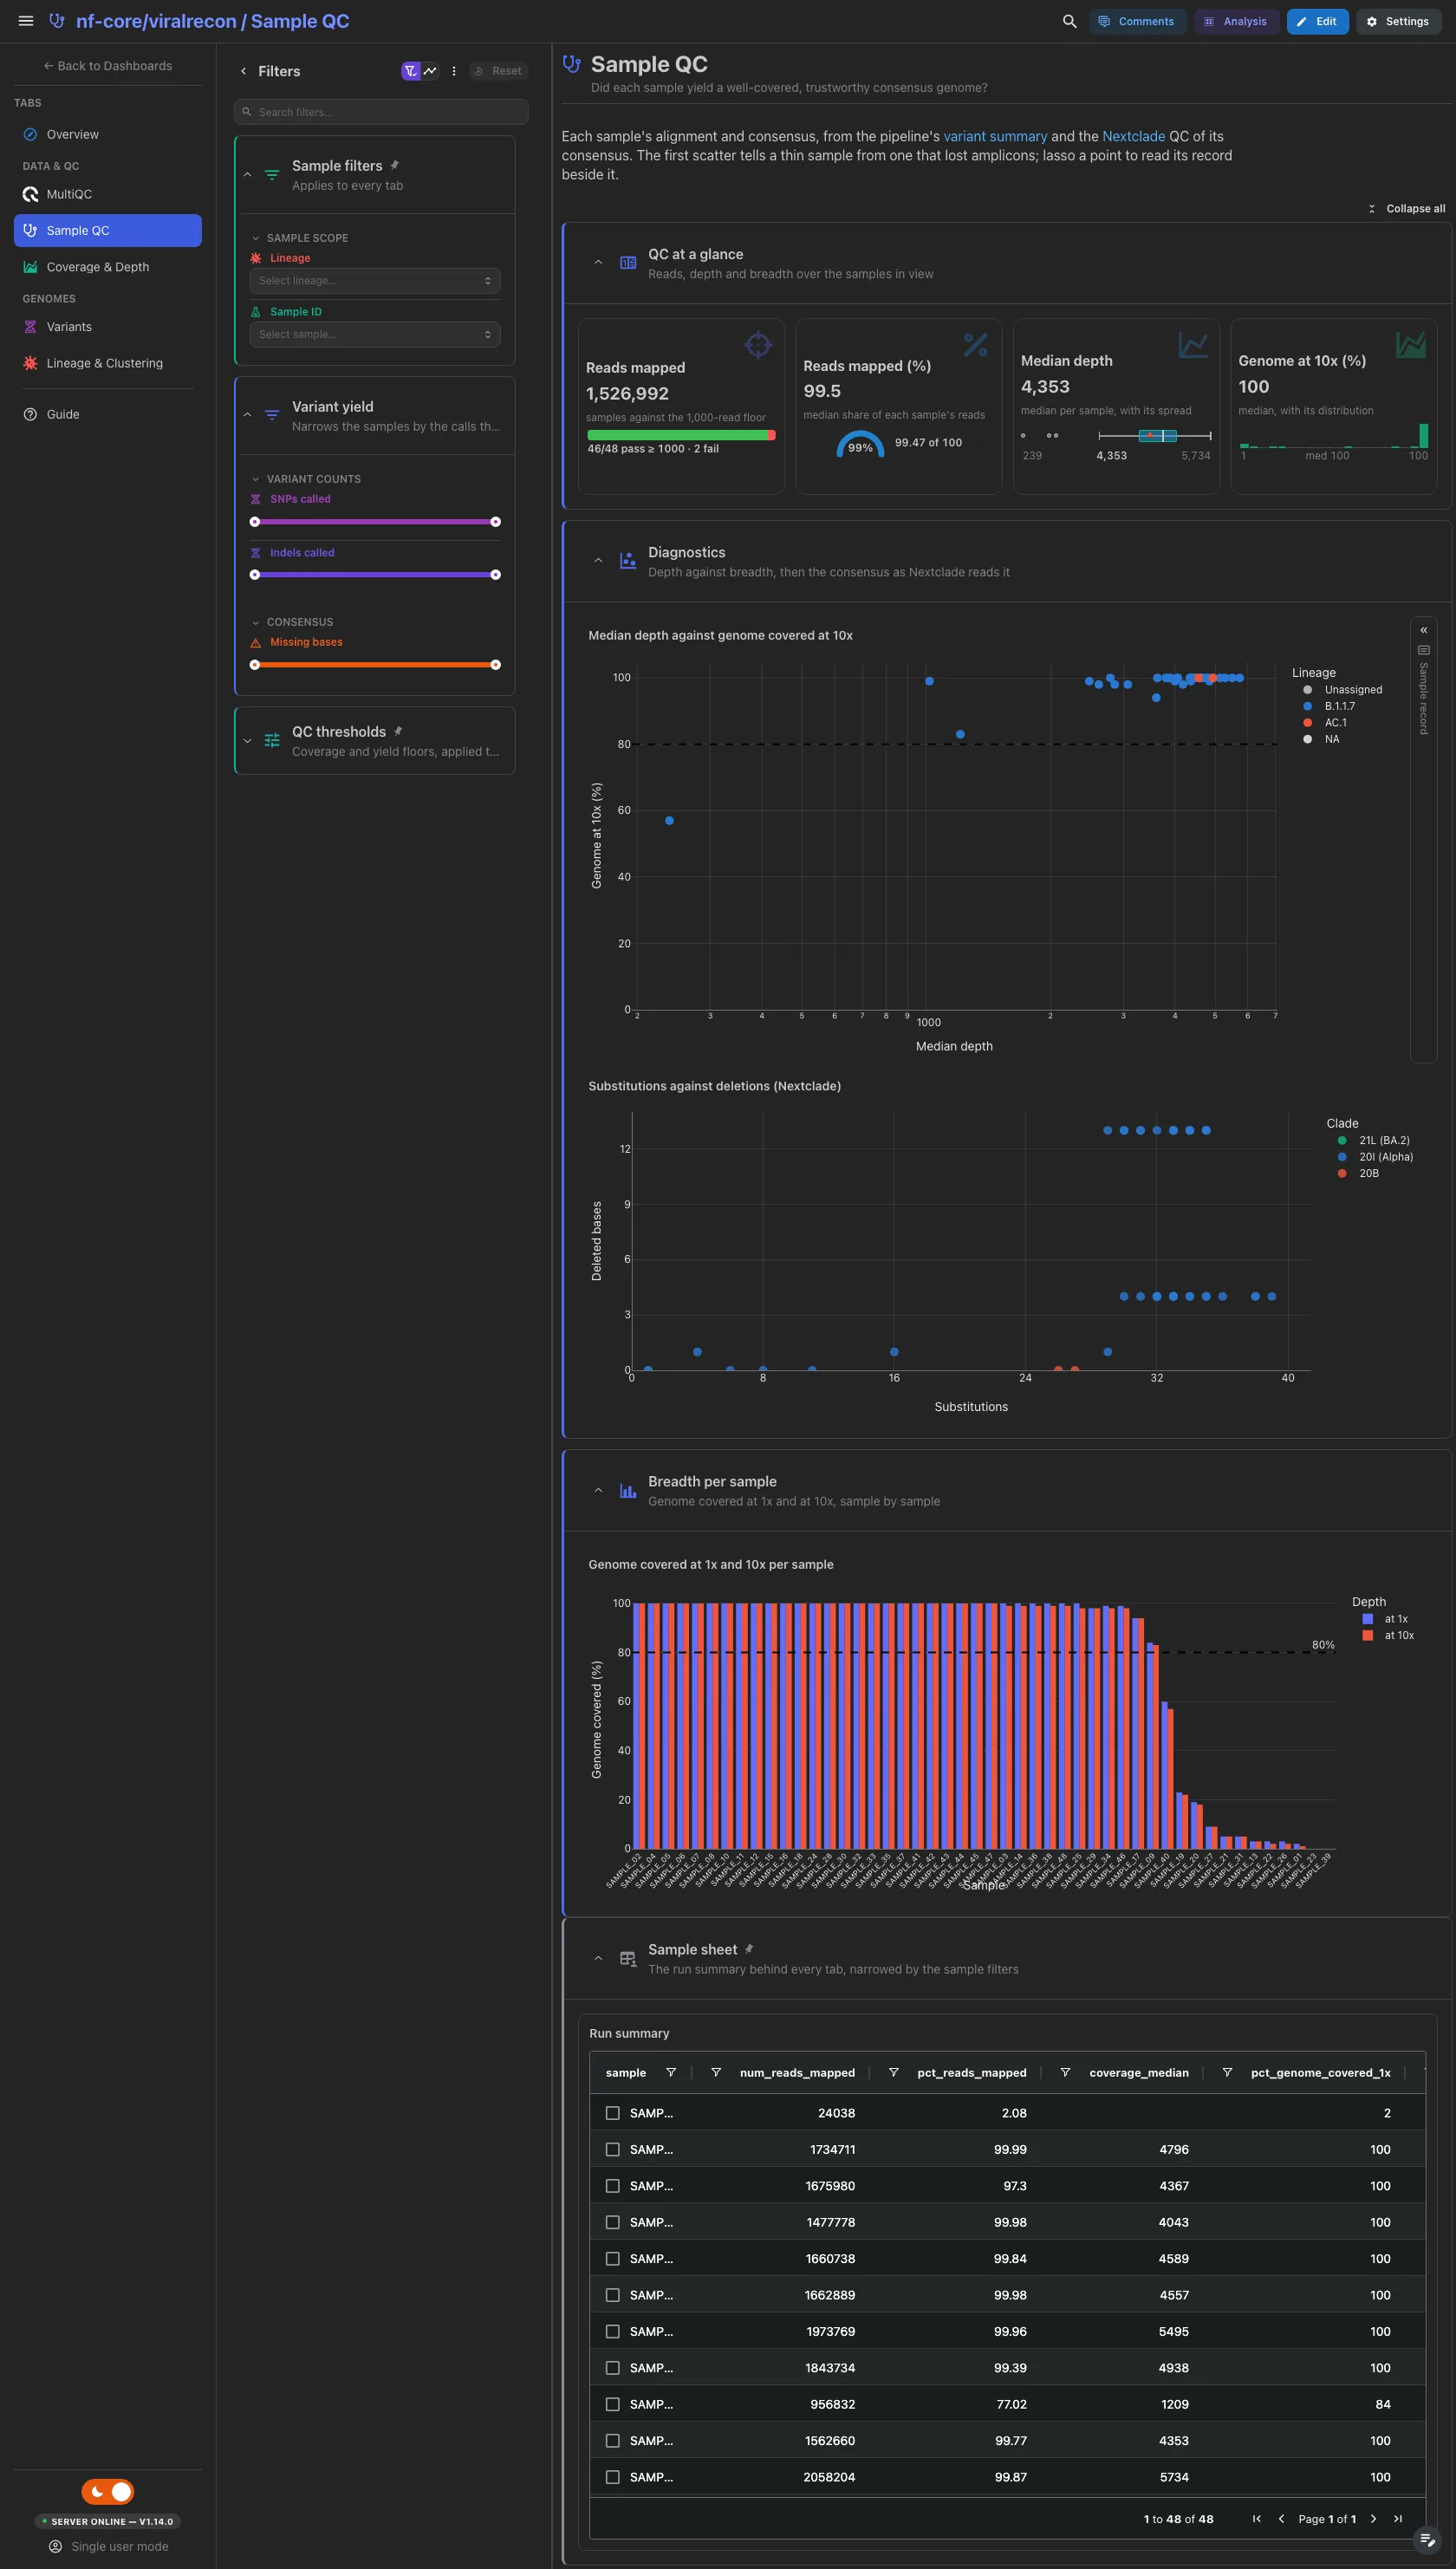
The median Reads mapped against the 1,000-read floor, the share of reads mapped, the Median depth and the Genome at 10x. Then median depth against genome covered at 10x, one point per sample, beside a record card for the sample you pick, the Nextclade substitutions against deletions per consensus genome, and the genome covered at 1x and 10x per sample.
Filters and components
Filters · SNPs and indels called on summary_metrics, and missing bases
on nextclade_results, all as ranges, plus the sample filters.
| Section | What it holds |
|---|---|
| QC at a glance | 4 cards |
| Diagnostics | Median depth against genome covered at 10x + a sample record card, Substitutions against deletions (Nextclade) |
| Breadth per sample | Genome covered at 1x and 10x per sample |
Data & QC · Where along the genome does each sample lose depth?
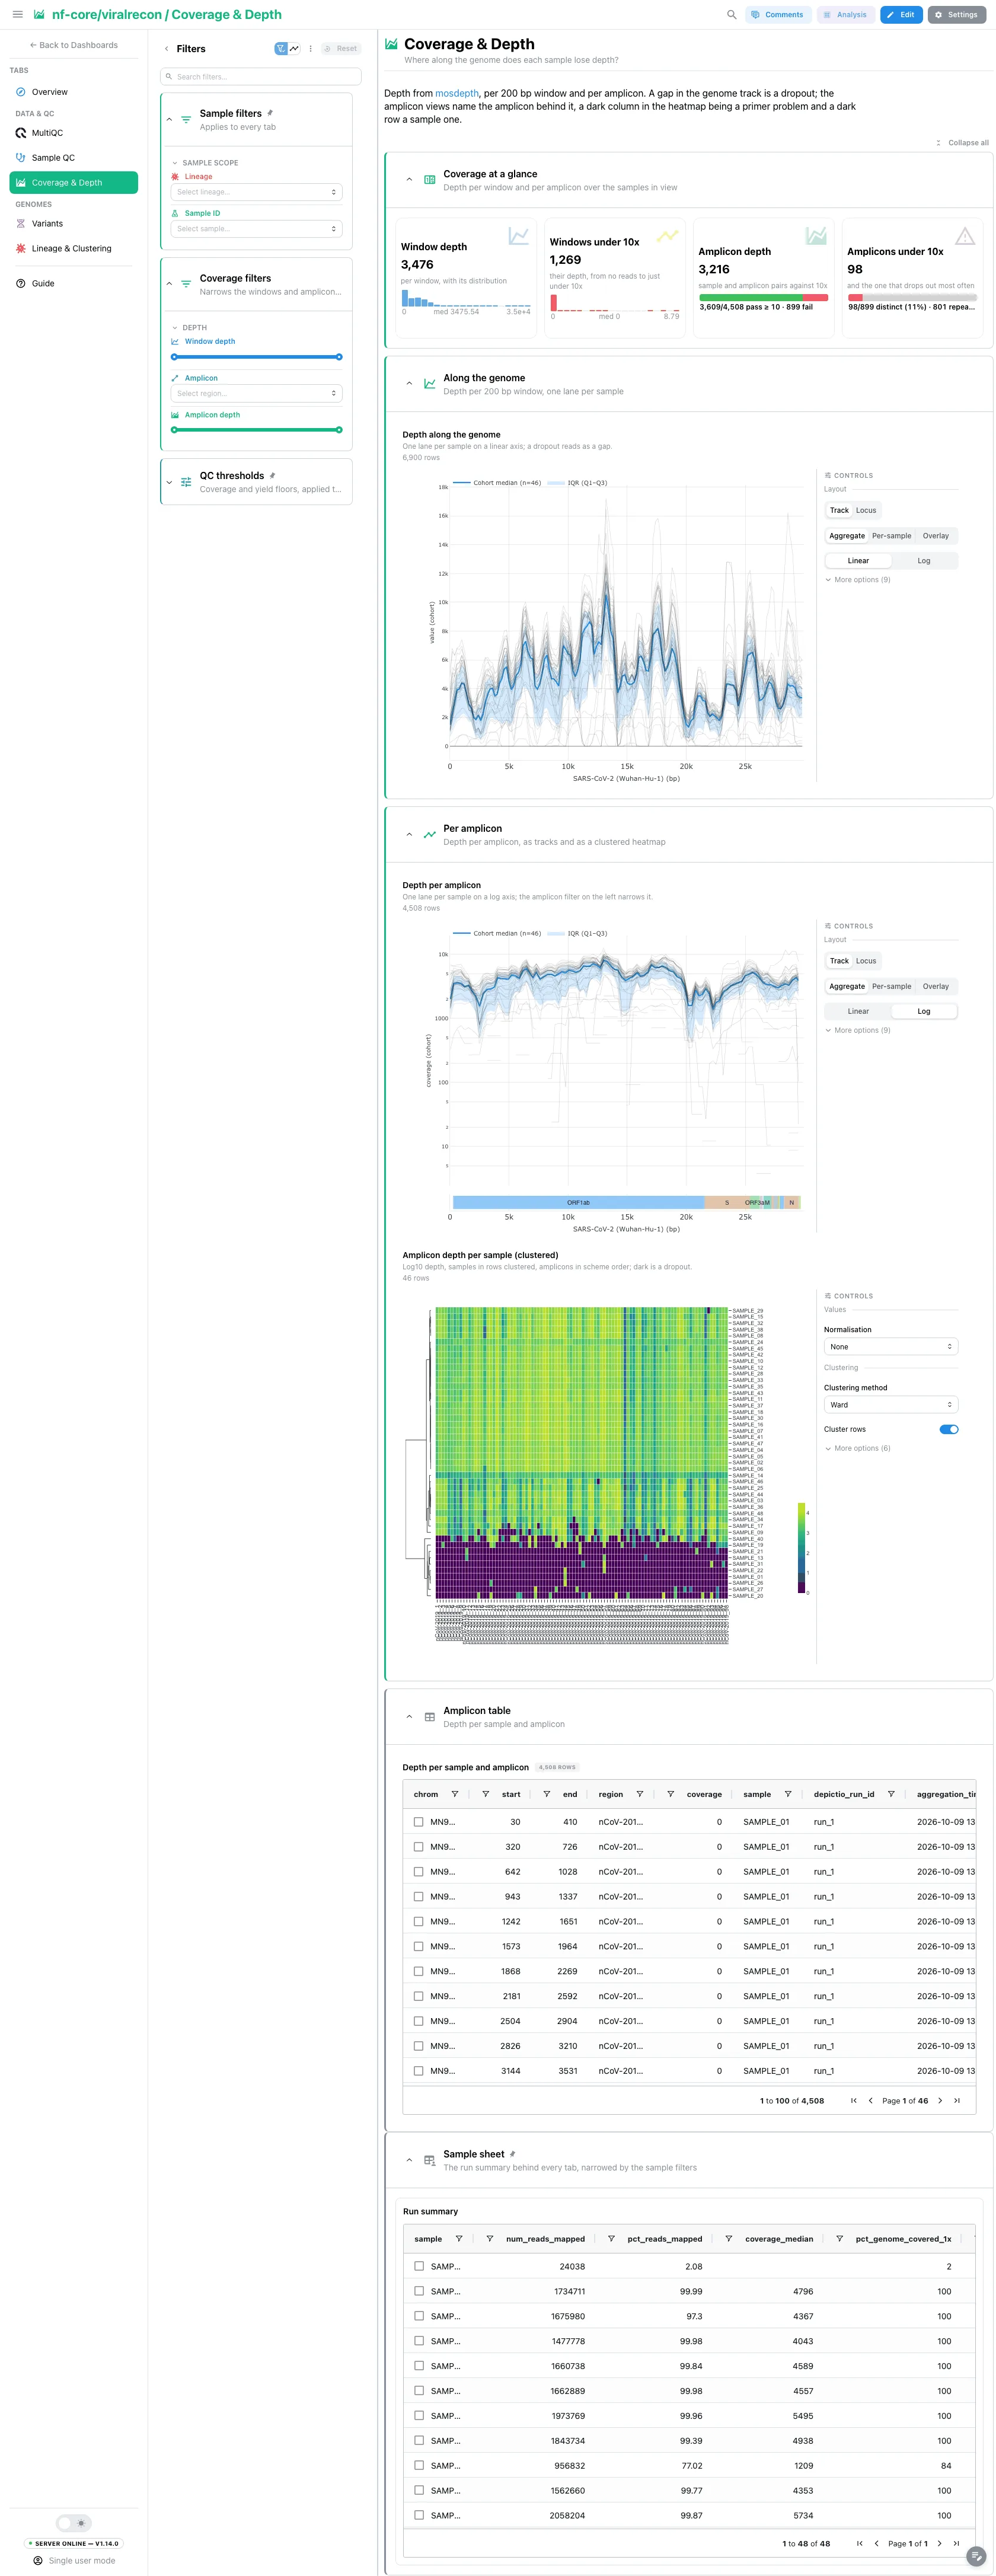
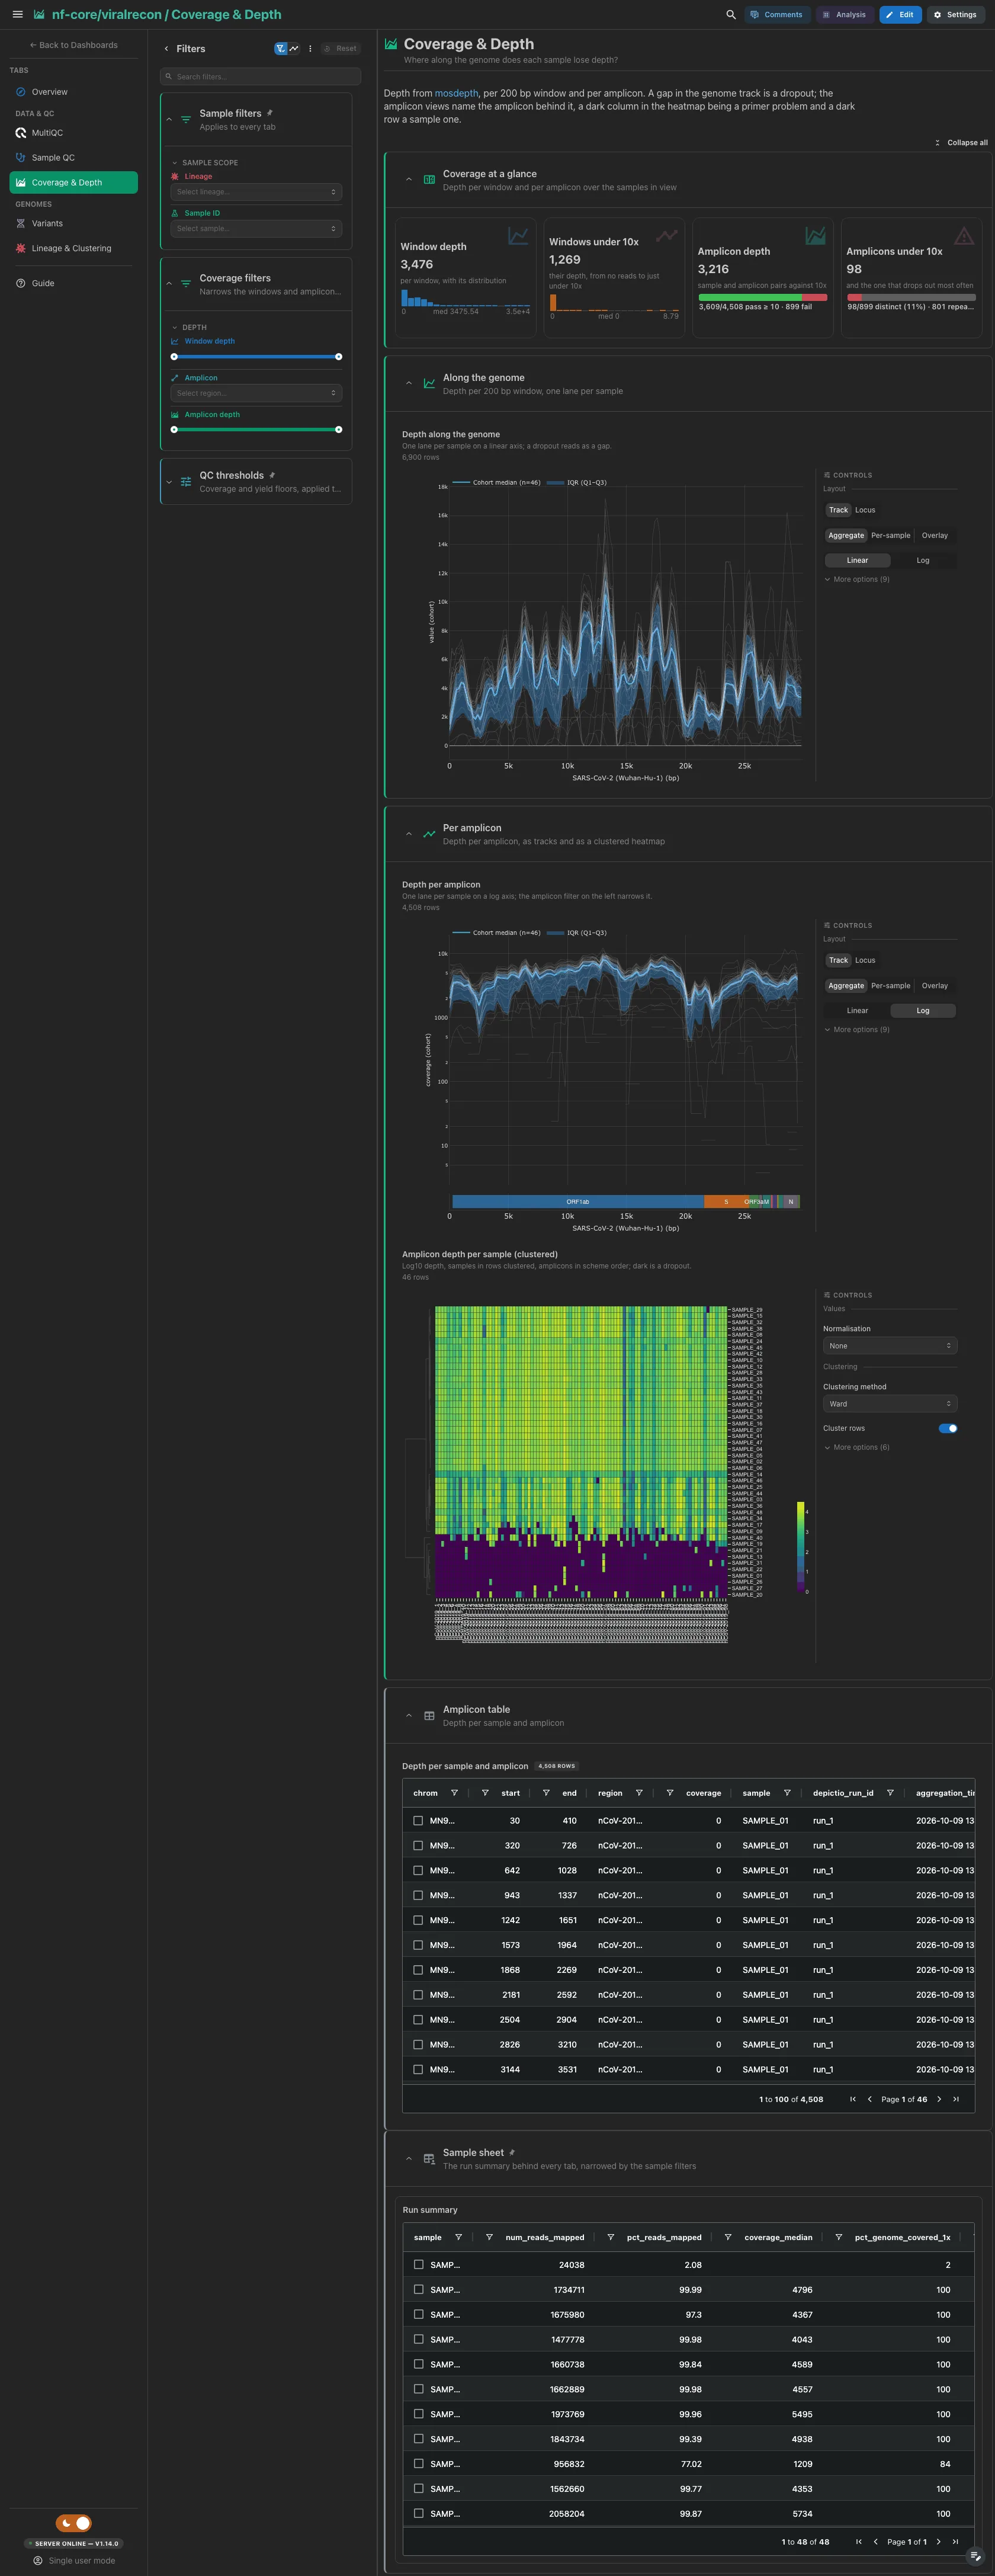
The median depth per 200 bp window, the windows under 10x, the median amplicon depth and the amplicons under 10x in at least one sample; 10x is the depth under which the consensus masks a position. Then the genome track, one lane per sample, the amplicon track and the clustered amplicon heatmap. A run without a primer scheme keeps only the window cards and the genome track.
Filters and components
Filters · window depth on mosdepth_genome_coverage, and the amplicon
and amplicon depth on mosdepth_amplicon_coverage.
| Section | What it holds |
|---|---|
| Coverage at a glance | 4 cards |
| Along the genome | 1 advanced visualization |
| Per amplicon | 2 advanced visualizations |
| Amplicon table (collapsed) | Depth per sample and amplicon |
Genomes · Which mutations does each sample carry, and how well supported?
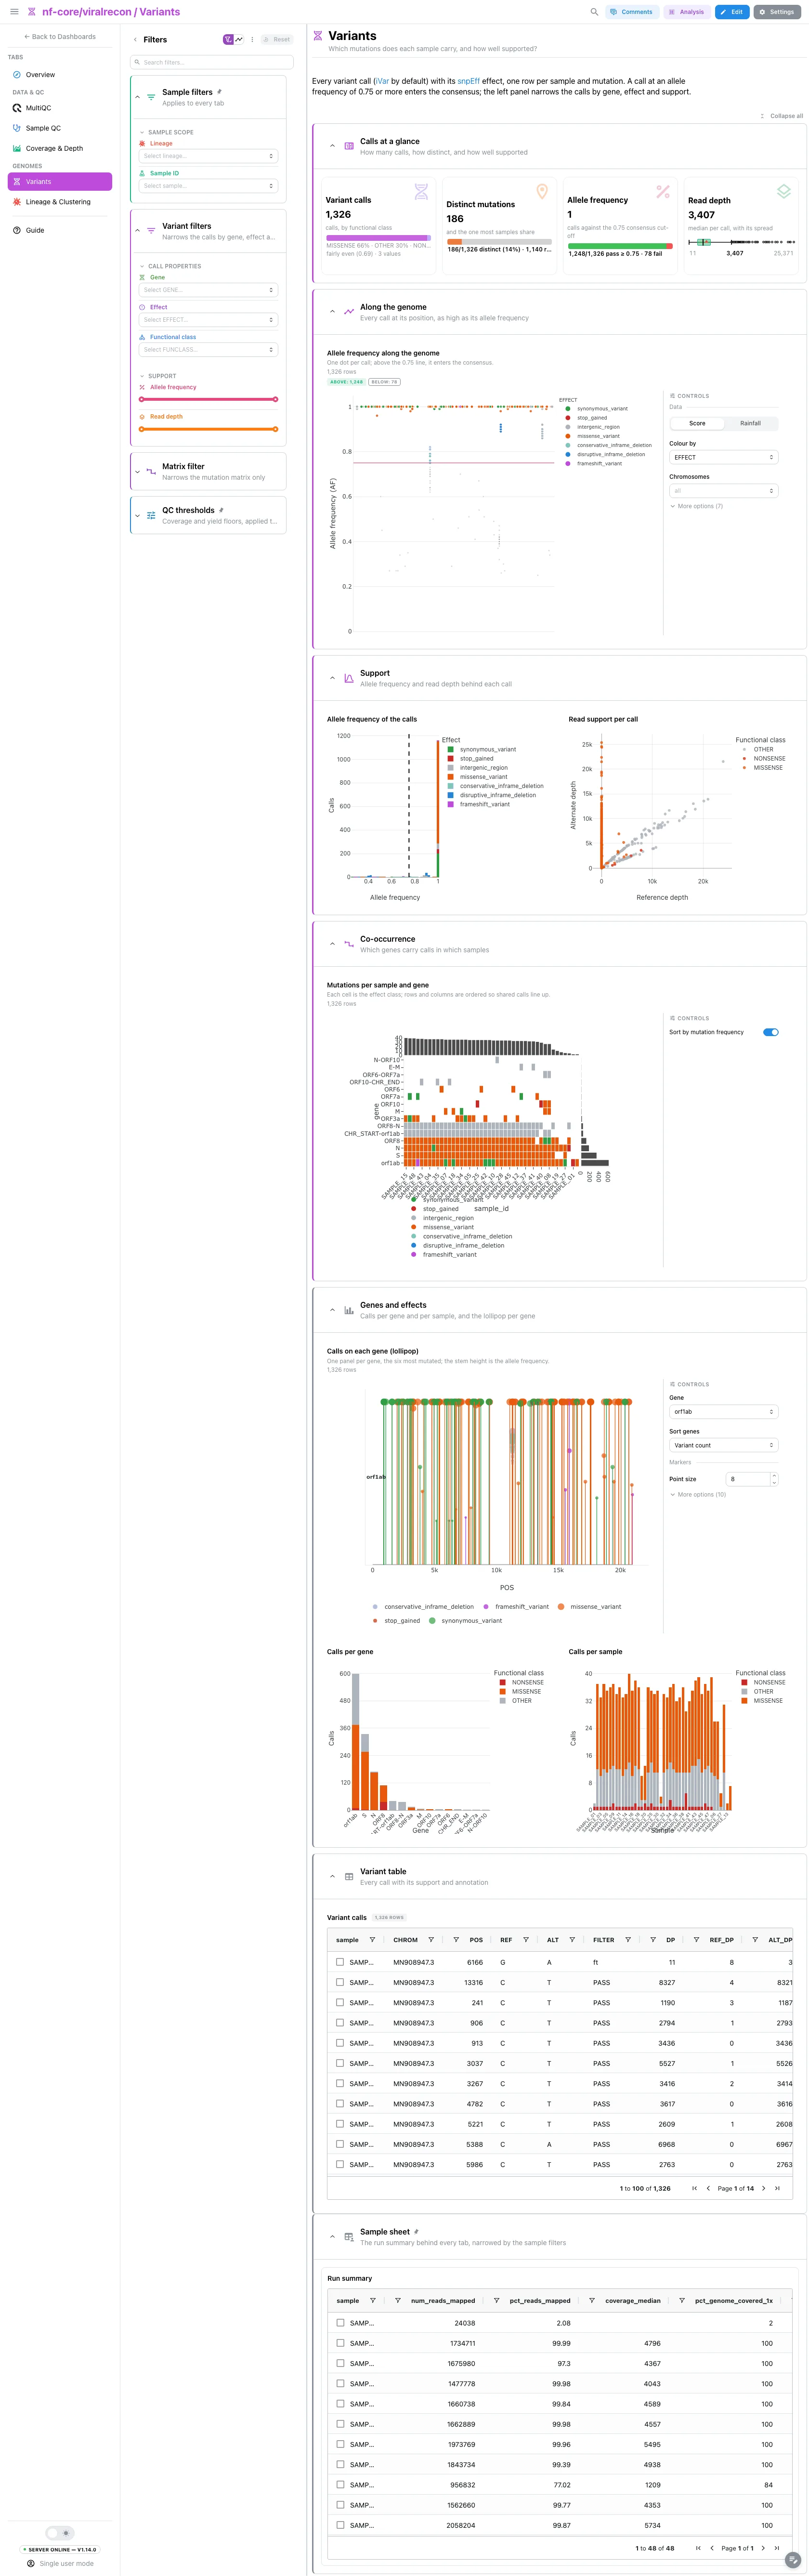
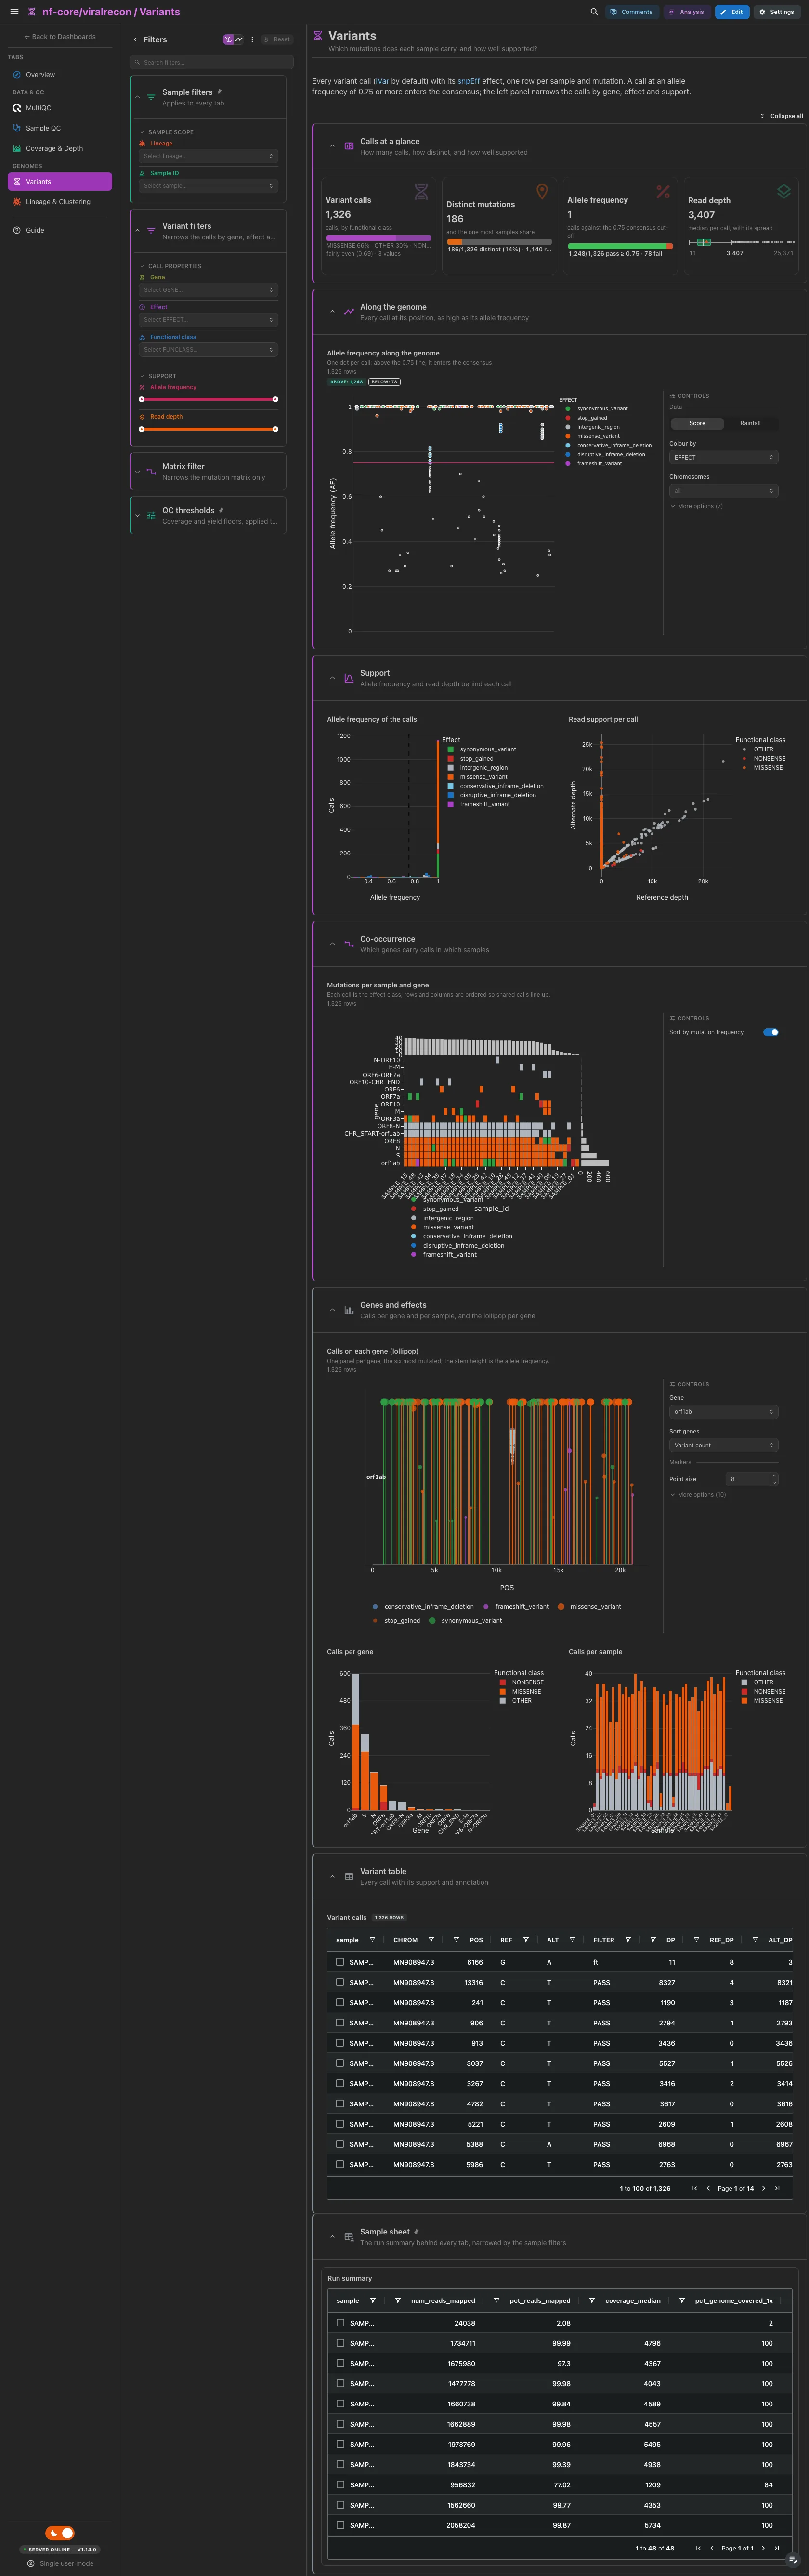
The calls by functional class, the distinct mutations, the median allele frequency against the 0.75 consensus cut-off and the median read depth. Then the allele frequency of every call along the genome, the allele frequency histogram beside the read support scatter, and the mutation matrix per sample and gene. The per-gene lollipops, the calls per gene and per sample, and the variant table are collapsed.
Filters and components
Filters · Gene, Effect, Functional class, allele frequency and
read depth on variants_long, plus a collapsed Matrix filter on the
mutation type that narrows the mutation matrix only.
| Section | What it holds |
|---|---|
| Calls at a glance | 4 cards |
| Along the genome | 1 advanced visualization |
| Support | Allele frequency of the calls, Read support per call |
| Co-occurrence | 1 advanced visualization (mutation matrix) |
| Genes and effects (collapsed) | 1 advanced visualization + Calls per gene, Calls per sample |
| Variant table (collapsed) | Variant calls |
Genomes · Which lineage and clade is each sample, and do they agree?
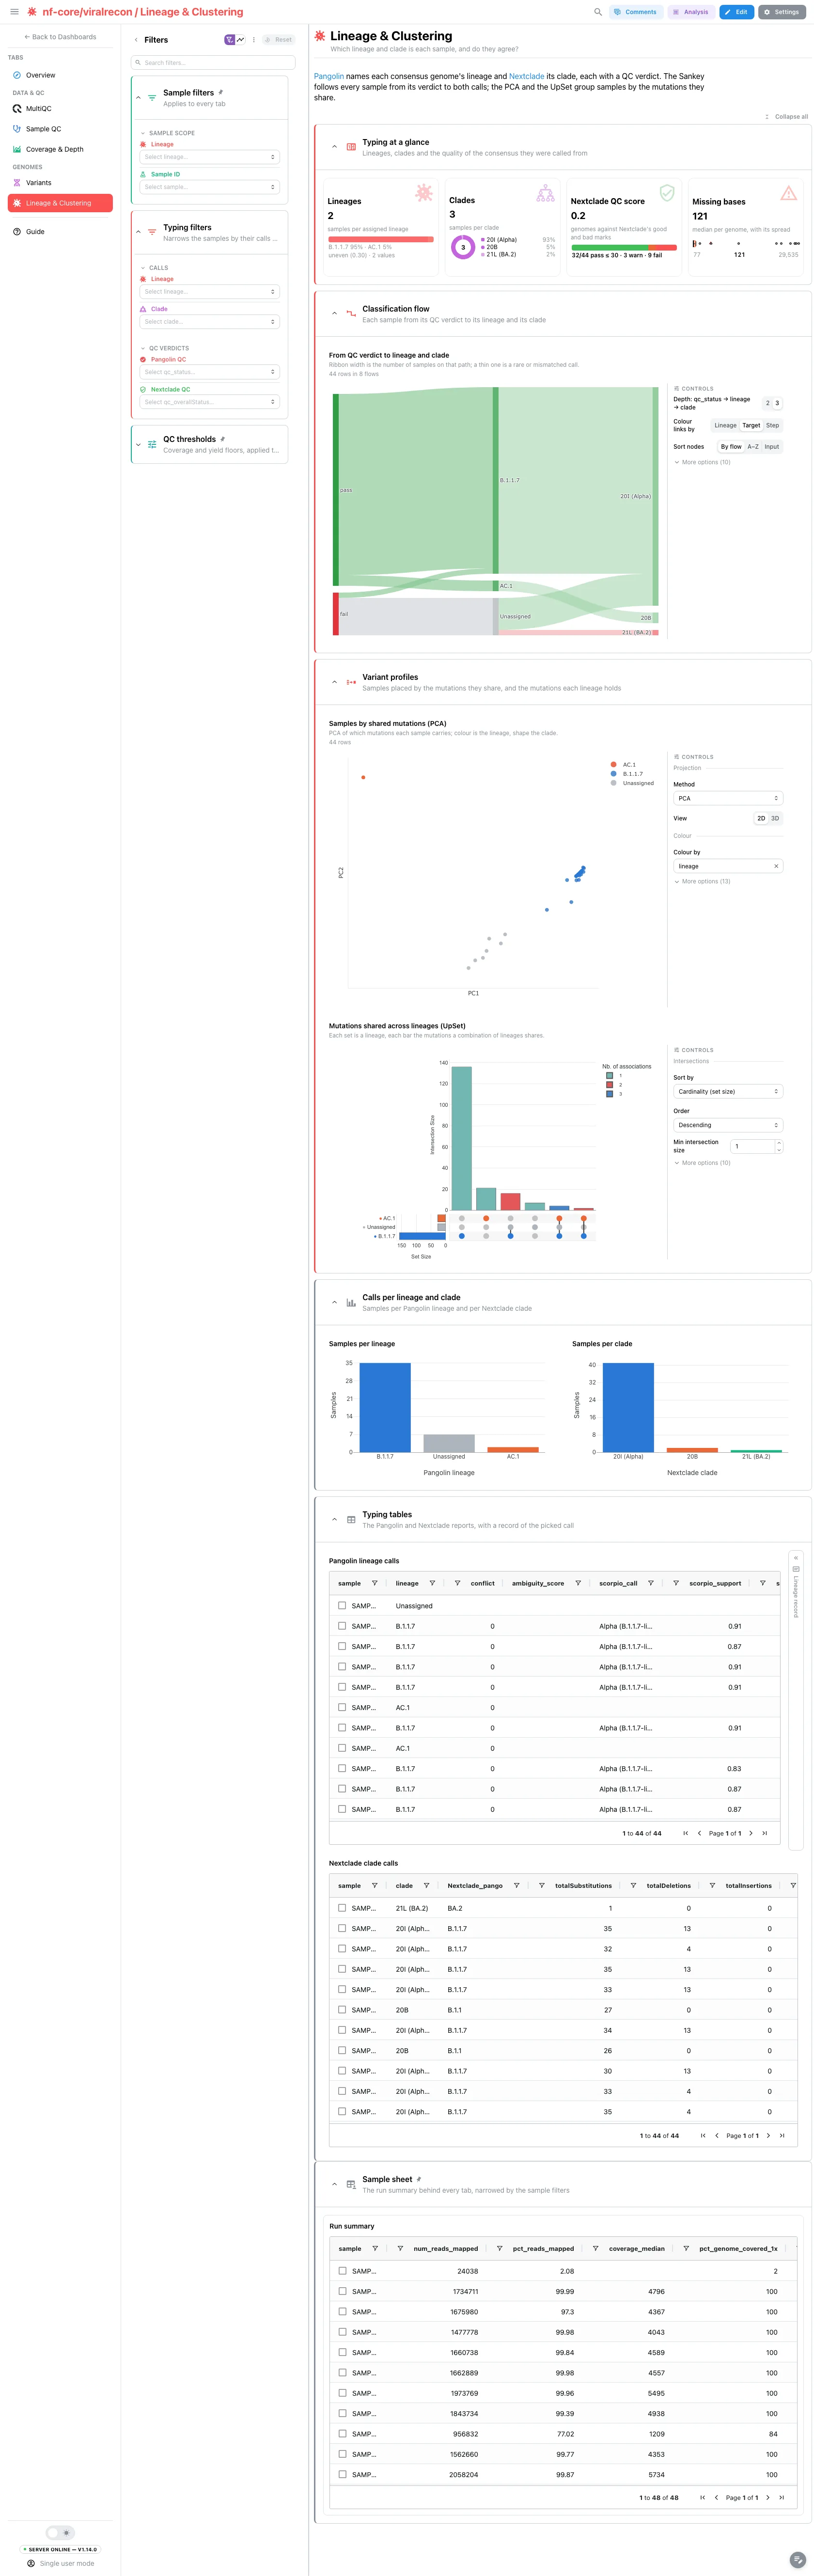
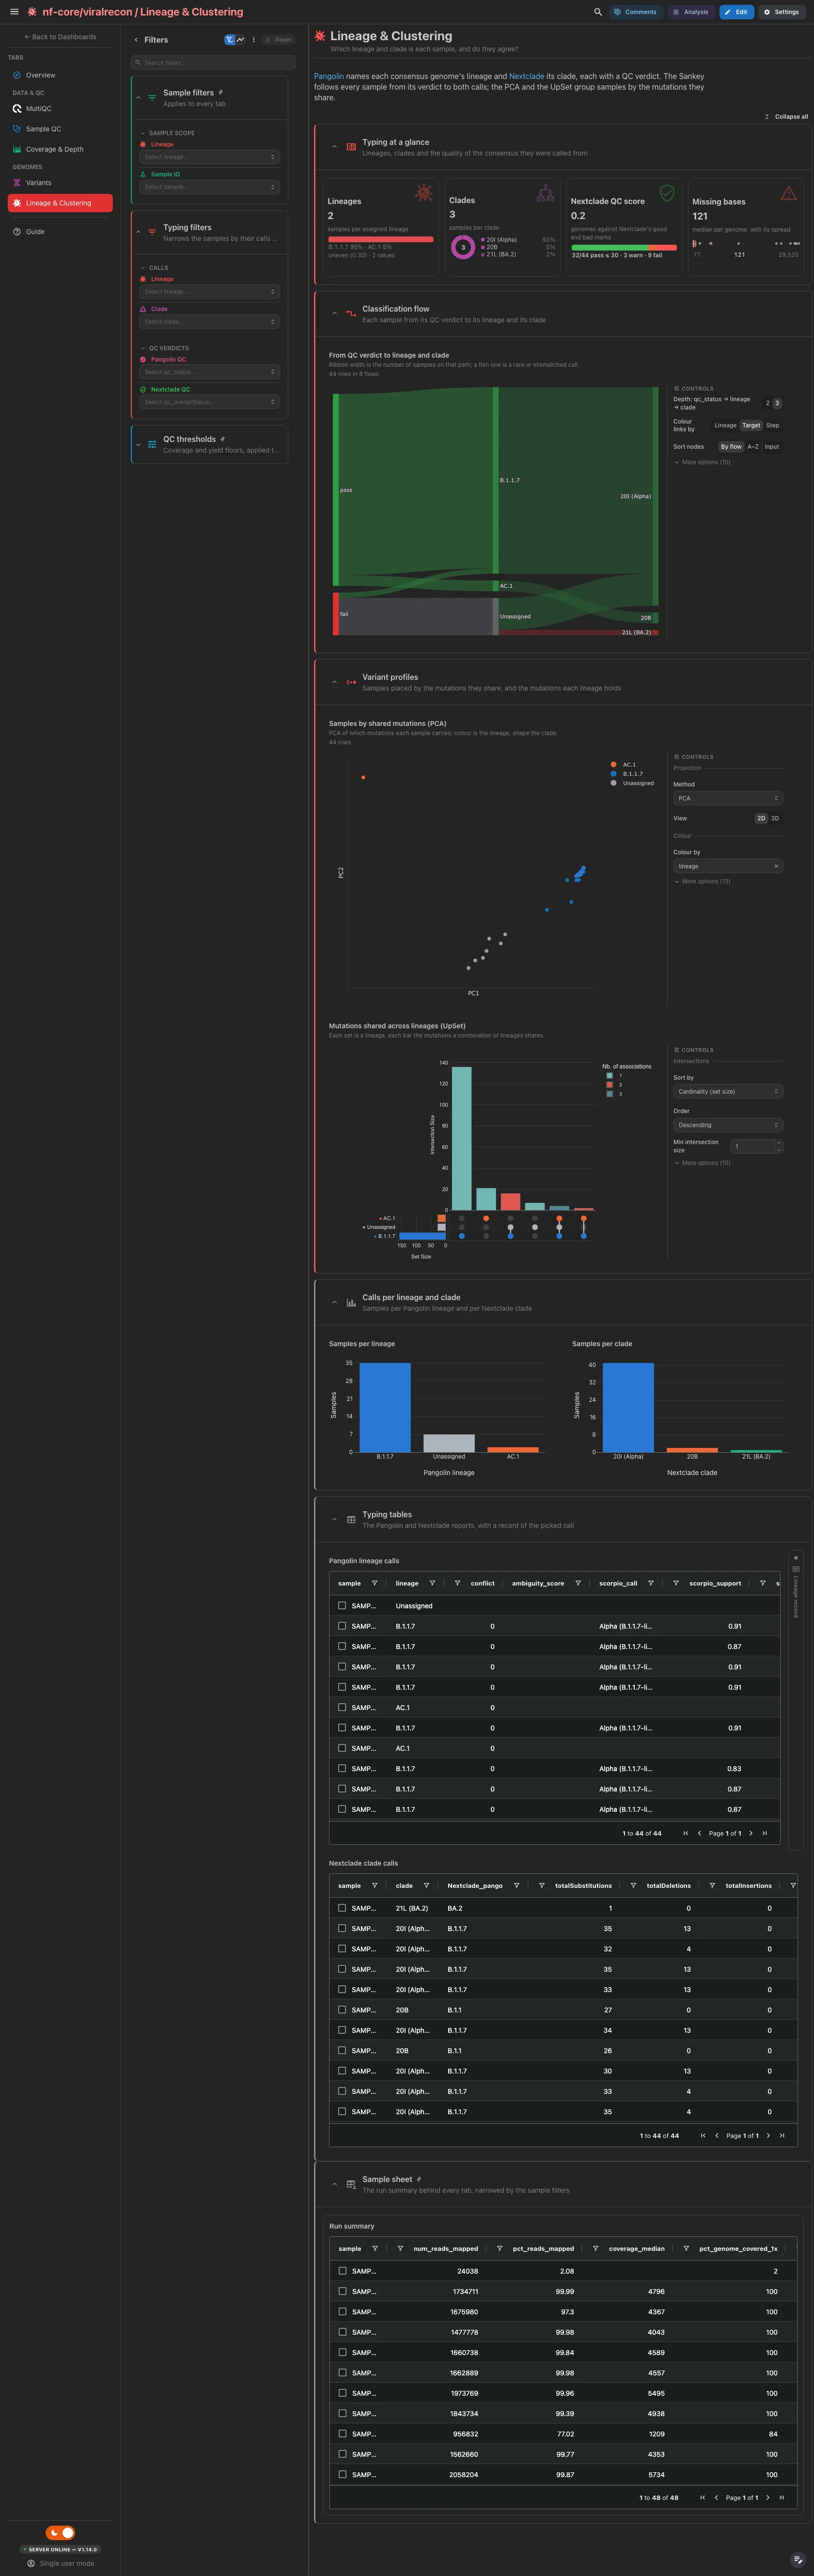
The distinct Pangolin lineages, the distinct Nextclade clades, the median Nextclade QC score and the median missing bases. Then the flow from Pangolin QC verdict to lineage to clade, the PCA of the samples by the mutations they share, and the UpSet of the mutations shared across lineages. A lasso on the PCA makes an analysis group.
Filters and components
Filters · Lineage, Clade, and the Pangolin and Nextclade QC
verdicts.
| Section | What it holds |
|---|---|
| Typing at a glance | 4 cards |
| Classification flow | 1 advanced visualization |
| Variant profiles | 2 advanced visualizations (PCA, UpSet) |
| Calls per lineage and clade (collapsed) | Samples per lineage, Samples per clade |
| Typing tables (collapsed) | Pangolin lineage calls + a lineage record card, Nextclade clade calls |
Every per-sample table (run summary, amplicon depth, Pangolin, Nextclade, variant
calls) selects rows on sample, and the depth against breadth scatter, the Nextclade
scatter, the allele frequency track, the read support scatter and the PCA select points
on it. summary_metrics links sample to every per-sample collection, so a pick
narrows the rest of the tab. The record cards wait for a pick, and a lasso on the PCA
becomes an analysis group.
Running the pipeline
Depictio reads the output of nf-core/viralrecon, it does not run the
pipeline. Run the pipeline first, using the iVar variant caller the template
targets, and write it into a run_* directory:
nextflow run nf-core/viralrecon -r 3.0.0 \
  --input samplesheet.csv \
  --platform illumina \
  --protocol amplicon \
  --variant_caller ivar \
  --outdir runs/run_1 \
  -profile docker
Then point Depictio at the parent of the run directories:
A later run written to runs/run_2 is aggregated into the same collections on
the next ingest. A nanopore ARTIC run (--platform nanopore) needs no extra
flag: Depictio reads platform: nanopore from the run's params.json and sets
IS_NANOPORE itself.
See nf-co.re/viralrecon/usage for full pipeline documentation.
Required data structure
Point depictio ingest at the directory holding the run_* directories. Depictio
scans each run recursively and matches on file name. Not all files are
required: optional collections that a run did not write (no Pangolin output
with --skip_pangolin, for example) are skipped, and the dashboard hides the
components bound to them.
The tree below shows the Illumina layout. On IS_NANOPORE the coverage and
typing collections are read from artic_minion/ instead.
<DATA_ROOT>/
└── run_1/                                        # one viralrecon --outdir per run_* directory
    ├── pipeline_info/params*.json                # read to set IS_NANOPORE
    ├── multiqc/
    │   ├── multiqc_data/
    │   │   └── multiqc.parquet
    │   └── summary_variants_metrics_mqc.csv      # the hub: one row per sample
    └── variants/
        └── ivar/                                 # artic_minion/ on IS_NANOPORE
            ├── consensus/
            │   └── bcftools/
            │       ├── pangolin/*.pangolin.csv   # Pangolin lineage, one file per sample
            │       └── nextclade/*.csv           # Nextclade clade, one file per sample
            ├── variants_long_table.csv           # iVar variant calls
            └── *.mosdepth.{coverage,heatmap}.tsv # amplicon and genome coverage
Validation runs
The nf-core AWS megatests do not publish the aggregated files this template
reads (multiqc.parquet, variants_long_table.csv, the Pangolin and Nextclade
reports, summary_variants_metrics_mqc.csv). The repository therefore ships
download_test_data.sh,
which runs nf-core/viralrecon with its test_illumina profile into a
sequencing-runs layout (Nextflow 24.10 or later, and Docker or Singularity):
The run lands in /tmp/viralrecon_test/run_1, so ingest its parent:
Do not pass --project when ingesting: the dashboard is attached to the
project by name, so renaming it breaks a later depictio dashboard import.
Re-ingesting accumulates dashboards, so delete the project before repeating a run.
Additional resources
- nf-co.re/viralrecon: official pipeline documentation
- nf-co.re/viralrecon/3.0.0/results: AWS test results
- Template System Reference: YAML format, variables, conditionals
- Recipes: how to read, test, and write recipes
Authorship
 weber8thomas
 Depictio team
Reviewing a template on your own data, or taking over a role here, is a contribution in itself: the contributing guide says what each one involves.