The funcscan template covers the four aggregated screening reports of a standard nf-core/funcscan run, plus the annotated contigs they share and the run's own record of what it ran:
- Overview: one key figure per screen, live findings and one figure per screen, each linked to the tab that explains it
- Data & QC: the screens and tool versions the run recorded, what each assembly yielded, and the contigs the screens share
- Antimicrobials: five ARG tools harmonised by hAMRonization, and AMPcombi peptide candidates in their property space
- Metabolism: comBGC regions from antiSMASH, DeepBGC and GECCO, and run_dbCAN CAZyme families with their substrates
Four screens, any subset
funcscan runs up to four independent screens over the same assemblies and
nothing joins them, which is why the dashboard has one tab per screen, after
the Data & QC tabs that cover all four. Every screen is optional: an arm that did not run leaves
no report, so its collections prune themselves. --var SKIP_ARG=true (or
SKIP_AMP, SKIP_BGC, SKIP_CAZYME) prunes an arm explicitly.
No MultiQC panels, only versions
funcscan feeds MultiQC nothing but software versions: the parquet holds one run-metadata row, with no general-statistics table and no module sections. The template turns that row into a table of tools per screen, which the Run report tab reads, and the same versions reach the dashboard Settings drawer through the template's provenance block.
Quick start
The results directory is the only thing you have to pass: which screens ran is read
from the reports. The samplesheet is auto-detected from {DATA_ROOT}/input/;
pass --var SAMPLESHEET_FILE=... to point elsewhere.
depictio config nextflow --install     # once per machine
nextflow run nf-core/funcscan -r 4.0.0 -profile docker --outdir results
No depictio ingest, and no template named: the pipeline ingests its own
output directory when it finishes and resolves this template from its own
manifest. See Nextflow trigger.
Reference
The template reads one aggregated report per arm: hAMRonization for the
resistome, AMPcombi for the peptides, comBGC for the gene clusters and run_dbCAN
for the CAZymes. From whichever of them the run produced it derives a per-sample
hub collection, joined to every screening collection on sample, so one sample
selection reaches every tab. A second hub, the per-contig annotation layer,
is rebuilt from the four screens and carries a contig selection into each of
them.
Self-adapting layout
The dashboard adapts to whatever the run actually produced: components bound to pruned or unparsed data collections are hidden, tabs left with no real visualizations are dropped entirely, and the remaining components re-packed so there are no empty rows. One template covers every combination of arms.
Template variables
Variables you provide when running the template: DATA_ROOT is the results directory given to depictio ingest, the others are set with --var NAME=value:
| Variable | Required | Description |
|---|---|---|
DATA_ROOT |
✓ | Root directory containing funcscan pipeline output (reports/, cazyme/, multiqc/) |
SAMPLESHEET_FILE |
— | Path to the funcscan samplesheet (sample,fasta). Auto-detected from {DATA_ROOT}/input/ when omitted. The AWS megatest does not publish it; see megatest.yaml post_fetch_help for the curl line. |
SKIP_ARG |
— | Set (--var SKIP_ARG=true) for a run without --run_arg_screening. Prunes the hAMRonization data collections and the Resistome tab. |
SKIP_AMP |
— | Set (--var SKIP_AMP=true) for a run without --run_amp_screening. Prunes the AMPcombi data collections and the AMPs tab. |
SKIP_BGC |
— | Set (--var SKIP_BGC=true) for a run without --run_bgc_screening. Prunes the comBGC data collections and the BGCs tab. |
SKIP_CAZYME |
— | Set (--var SKIP_CAZYME=true) for a run without --run_cazyme_screening. Prunes the run_dbCAN data collections and the CAZymes tab. |
Data collections
19 data collections — 1 required 18 optional · 16 direct 3 derived.
Origin tells you whether a collection is real pipeline data or a reshape of it: direct = a pipeline output (scanned, or a recipe that reads raw files); derived = a recipe that reshapes one or more direct collections into the layout a visualization needs (no new measurement). Reads shows what produces it: a recipe .py transform, whose name links to its source on GitHub, or a raw file scanned off disk. (A direct collection can still have a recipe — one that merely parses/cleans the raw file; derived means the recipe reshapes another collection.)
| Tag | Origin | Type | Reads | Status |
|---|---|---|---|---|
multiqc_data |
direct |  MultiQC MultiQC |
file (?:.*/)?multiqc(?:/[^/]+)?/multiqc_data/multiqc.parquet$ |
optional |
software_versions |
direct | Table | recipe funcscan/software_versions.py |
optional |
samplesheet |
direct | Table | file {SAMPLESHEET_FILE} |
optional |
hamronization_report |
direct | Table | recipe hamronization/report.py |
optional |
hamronization_gene_presence |
direct | Table | recipe hamronization/gene_presence.py |
optional |
hamronization_gene_matrix |
direct | Table | recipe hamronization/gene_matrix.py |
optional |
hamronization_class_matrix |
derived | Table | recipe hamronization/class_matrix.py |
optional |
hamronization_tool_overlap |
direct | Table | recipe hamronization/tool_overlap.py |
optional |
ampcombi_summary |
direct | Table | recipe ampcombi/summary.py |
optional |
ampcombi_embedding |
direct | Table | recipe ampcombi/embedding.py |
optional |
ampcombi_clusters |
direct | Table | recipe ampcombi/clusters.py |
optional |
combgc_summary |
direct | Table | recipe combgc/summary.py |
optional |
combgc_region_track |
direct | Table | recipe combgc/region_track.py |
optional |
combgc_tool_overlap |
direct | Table | recipe combgc/tool_overlap.py |
optional |
dbcan_overview |
direct | Table | recipe dbcan/overview.py |
optional |
dbcan_tool_overlap |
direct | Table | recipe dbcan/tool_overlap.py |
optional |
dbcan_substrates |
direct | Table | recipe dbcan/substrates.py |
optional |
screening_summary |
derived | Table | recipe funcscan/screening_summary.py |
required |
contig_annotation |
derived | Table | recipe funcscan/contig_annotation.py |
optional |
Conditional routes
Rows are data collections; columns are the variables you set or params.json flags auto-detected from the run. Each filled cell is the effect of setting that variable; an empty cell means that variable leaves the collection unchanged. (5 collections are unaffected by any variable — present on every run.)
+ included− removed⇄ repointed
| Data collection | SKIP_ARG |
SKIP_AMP |
SKIP_BGC |
SKIP_CAZYME |
|---|---|---|---|---|
hamronization_report |
− | |||
hamronization_gene_presence |
− | |||
hamronization_gene_matrix |
− | |||
hamronization_class_matrix |
− | |||
hamronization_tool_overlap |
− | |||
ampcombi_summary |
− | |||
ampcombi_embedding |
− | |||
ampcombi_clusters |
− | |||
combgc_summary |
− | |||
combgc_region_track |
− | |||
combgc_tool_overlap |
− | |||
dbcan_overview |
− | |||
dbcan_tool_overlap |
− | |||
dbcan_substrates |
− |
Cross-DC links
23 links — selecting a value in the source collection filters the target. The join column is shown after the source.
| Source · column | Target | Filters | |
|---|---|---|---|
screening_summary · sample |
→ | multiqc_data |
Filter MultiQC by the hub sample list |
screening_summary · sample |
→ | samplesheet |
Filter the samplesheet by the hub sample list |
screening_summary · sample |
→ | hamronization_report |
Filter ARG hits by the hub sample list |
screening_summary · sample |
→ | hamronization_gene_presence |
Filter ARG gene support by the hub sample list |
screening_summary · sample |
→ | hamronization_tool_overlap |
Filter the ARG tool-overlap matrix by the hub sample list |
screening_summary · sample |
→ | contig_annotation |
Filter the per-contig annotation summary by the hub sample list |
screening_summary · sample |
→ | combgc_region_track |
Filter the BGC region coordinates by the hub sample list |
screening_summary · sample |
→ | hamronization_class_matrix |
Narrow the ARG drug-class matrix to the hub sample list (column subset) |
contig_annotation · contig |
→ | hamronization_report |
Carry a contig selection into the ARG hits |
contig_annotation · contig |
→ | ampcombi_summary |
Carry a contig selection into the AMP candidates |
contig_annotation · contig |
→ | combgc_region_track |
Carry a contig selection into the BGC region coordinates |
contig_annotation · contig |
→ | dbcan_overview |
Carry a contig selection into the CAZyme annotations |
screening_summary · sample |
→ | hamronization_gene_matrix |
Narrow the ARG gene matrix to the hub sample list (column subset) |
screening_summary · sample |
→ | ampcombi_summary |
Filter AMP candidates by the hub sample list |
screening_summary · sample |
→ | ampcombi_embedding |
Filter the AMP property embedding by the hub sample list |
screening_summary · sample |
→ | ampcombi_clusters |
Filter AMP clusters by the sample that contributed the representative |
screening_summary · sample |
→ | combgc_summary |
Filter BGC regions by the hub sample list |
screening_summary · sample |
→ | combgc_tool_overlap |
Filter the BGC caller-overlap matrix by the hub sample list |
screening_summary · sample |
→ | dbcan_overview |
Filter CAZyme annotations by the hub sample list |
screening_summary · sample |
→ | dbcan_tool_overlap |
Filter the CAZyme tool-overlap matrix by the hub sample list |
screening_summary · sample |
→ | dbcan_substrates |
Filter CGC substrate predictions by the hub sample list |
ampcombi_summary · cds_id |
→ | ampcombi_embedding |
Carry an AMP candidate selection into the property embedding |
hamronization_report · gene_symbol |
→ | hamronization_gene_presence |
Carry an ARG gene selection into the gene-support collection |
Recipes
Each recipe reshapes raw pipeline output into a tidy table. The name links to its source; Output lists the validated OUTPUT_SCHEMA columns.
| Recipe | Transforms | Output |
|---|---|---|
ampcombi/clusters.py |
AMP sequence clusters from the AMPcombi cluster representative table. |
cluster_id, representative, sample, members |
ampcombi/embedding.py |
PCA embedding of AMP candidates over their physicochemical properties. | cds_id, dim_1, dim_2, sample, prob_ampir, prob_macrel, prob_max, charge_class, aa_length |
ampcombi/summary.py |
Tidy the AMPcombi complete summary: one row per AMP candidate. |
sample, cds_id, contig, prob_ampir, prob_macrel, prob_amplify, prob_max, n_tools, aa_length, molecular_weight, isoelectric_point, hydrophobicity, helix_fraction, turn_fraction, sheet_fraction, charge_class, transporter_protein, stop_codon, cds_start, cds_end, strand, db_hit, db_description, db_evalue, db_pident, aa_sequence |
combgc/region_track.py |
comBGC regions as coordinates: one row per BGC interval on its contig. | sample, contig, region_id, tool, product_class, start, end, strand, length_kb, cds_count, complete |
combgc/summary.py |
Tidy the comBGC complete summary into one row per predicted BGC region. | sample, contig, tool, product_class, probability, complete, start, end, length, cds_count, n_pfam, pfam_domains, mibig_id, regions |
combgc/tool_overlap.py |
Contig by tool membership matrix for an UpSet plot of BGC caller agreement. | contig, sample |
dbcan/overview.py |
Tidy the run_dbCAN overview.tsv files into one row per CAZyme gene. |
sample, gene_id, contig, hmmer, dbcan_sub, diamond, n_tools, family, cazy_class, substrate, ec_number, genes |
dbcan/substrates.py |
CAZyme gene cluster (CGC) substrate predictions from run_dbCAN. | sample, cgc_id, contig, pul_id, substrate, bitscore, sub_substrate, sub_score, clusters |
dbcan/tool_overlap.py |
Gene by tool membership matrix for an UpSet plot of dbCAN tool agreement. | gene_id, sample, hmmer, dbcan_sub, diamond |
funcscan/contig_annotation.py |
Per-contig annotation summary: the four funcscan screens on one locus. | sample, contig, contig_length, contig_coverage, arg_hits, amp_candidates, bgc_regions, cazyme_genes, features, screens_on_contig, features_per_kb, top_screen |
funcscan/screening_summary.py |
Per-sample screening summary: the hub every funcscan dashboard filter hangs off. | sample, arg_hits, arg_genes, arg_tools, amp_candidates, amp_high_confidence, bgc_regions, bgc_classes, cazymes, cazyme_families, screens |
funcscan/software_versions.py |
Software versions the run recorded, one row per process and tool. | process, tool, version, screen, tools |
hamronization/class_matrix.py |
Drug class by sample ARG hit matrix, one aggregation level above the genes. | drug_class, top_tool, n_genes_band |
hamronization/gene_matrix.py |
Gene by sample ARG hit matrix for a clustered heatmap. | gene_symbol, drug_class, drug_class_primary |
hamronization/gene_presence.py |
Per sample and gene ARG presence: how many hits, how many tools agree. | sample, gene_symbol, drug_class, hits, n_tools, tool_frac, mean_identity, mean_coverage |
hamronization/report.py |
Tidy the hAMRonization summarize combined report into one row per ARG hit. |
sample, gene_symbol, gene_name, drug_class, antimicrobial_agent, resistance_mechanism, tool, database, reference_accession, coverage_pct, coverage_frac, identity_pct, contig, sequence_id, start, stop, strand, hits |
hamronization/tool_overlap.py |
Contig by tool membership matrix for an UpSet plot of ARG tool concordance. | contig, sample |
Dashboard tabs
One dashboard: the Overview, then seven child tabs in three groups, read as a funnel from what the run executed to what each screen found. Each tab below carries the same icon and colour the dashboard gives it, so the page and the app read alike.
| Group | Tabs |
|---|---|
| Data & QC | Run report, Samples, Contigs |
| Antimicrobials | Resistome, AMPs |
| Metabolism | BGCs, CAZymes |
Each child tab opens with a short intro and a strip of cards, then at most three
open sections; tables and details follow, collapsed. The samplesheet carries no
experimental factor, so the persistent Sample filters hold the sample id only:
they sit in the left panel and narrow every tab through screening_summary, the
per-assembly hub every screen links to on sample. The Sample sheet section,
the hub table above the samplesheet, is pinned, collapsed, to the bottom of every
child tab.
Assemblies screened for resistance genes, peptides, gene clusters and CAZymes.
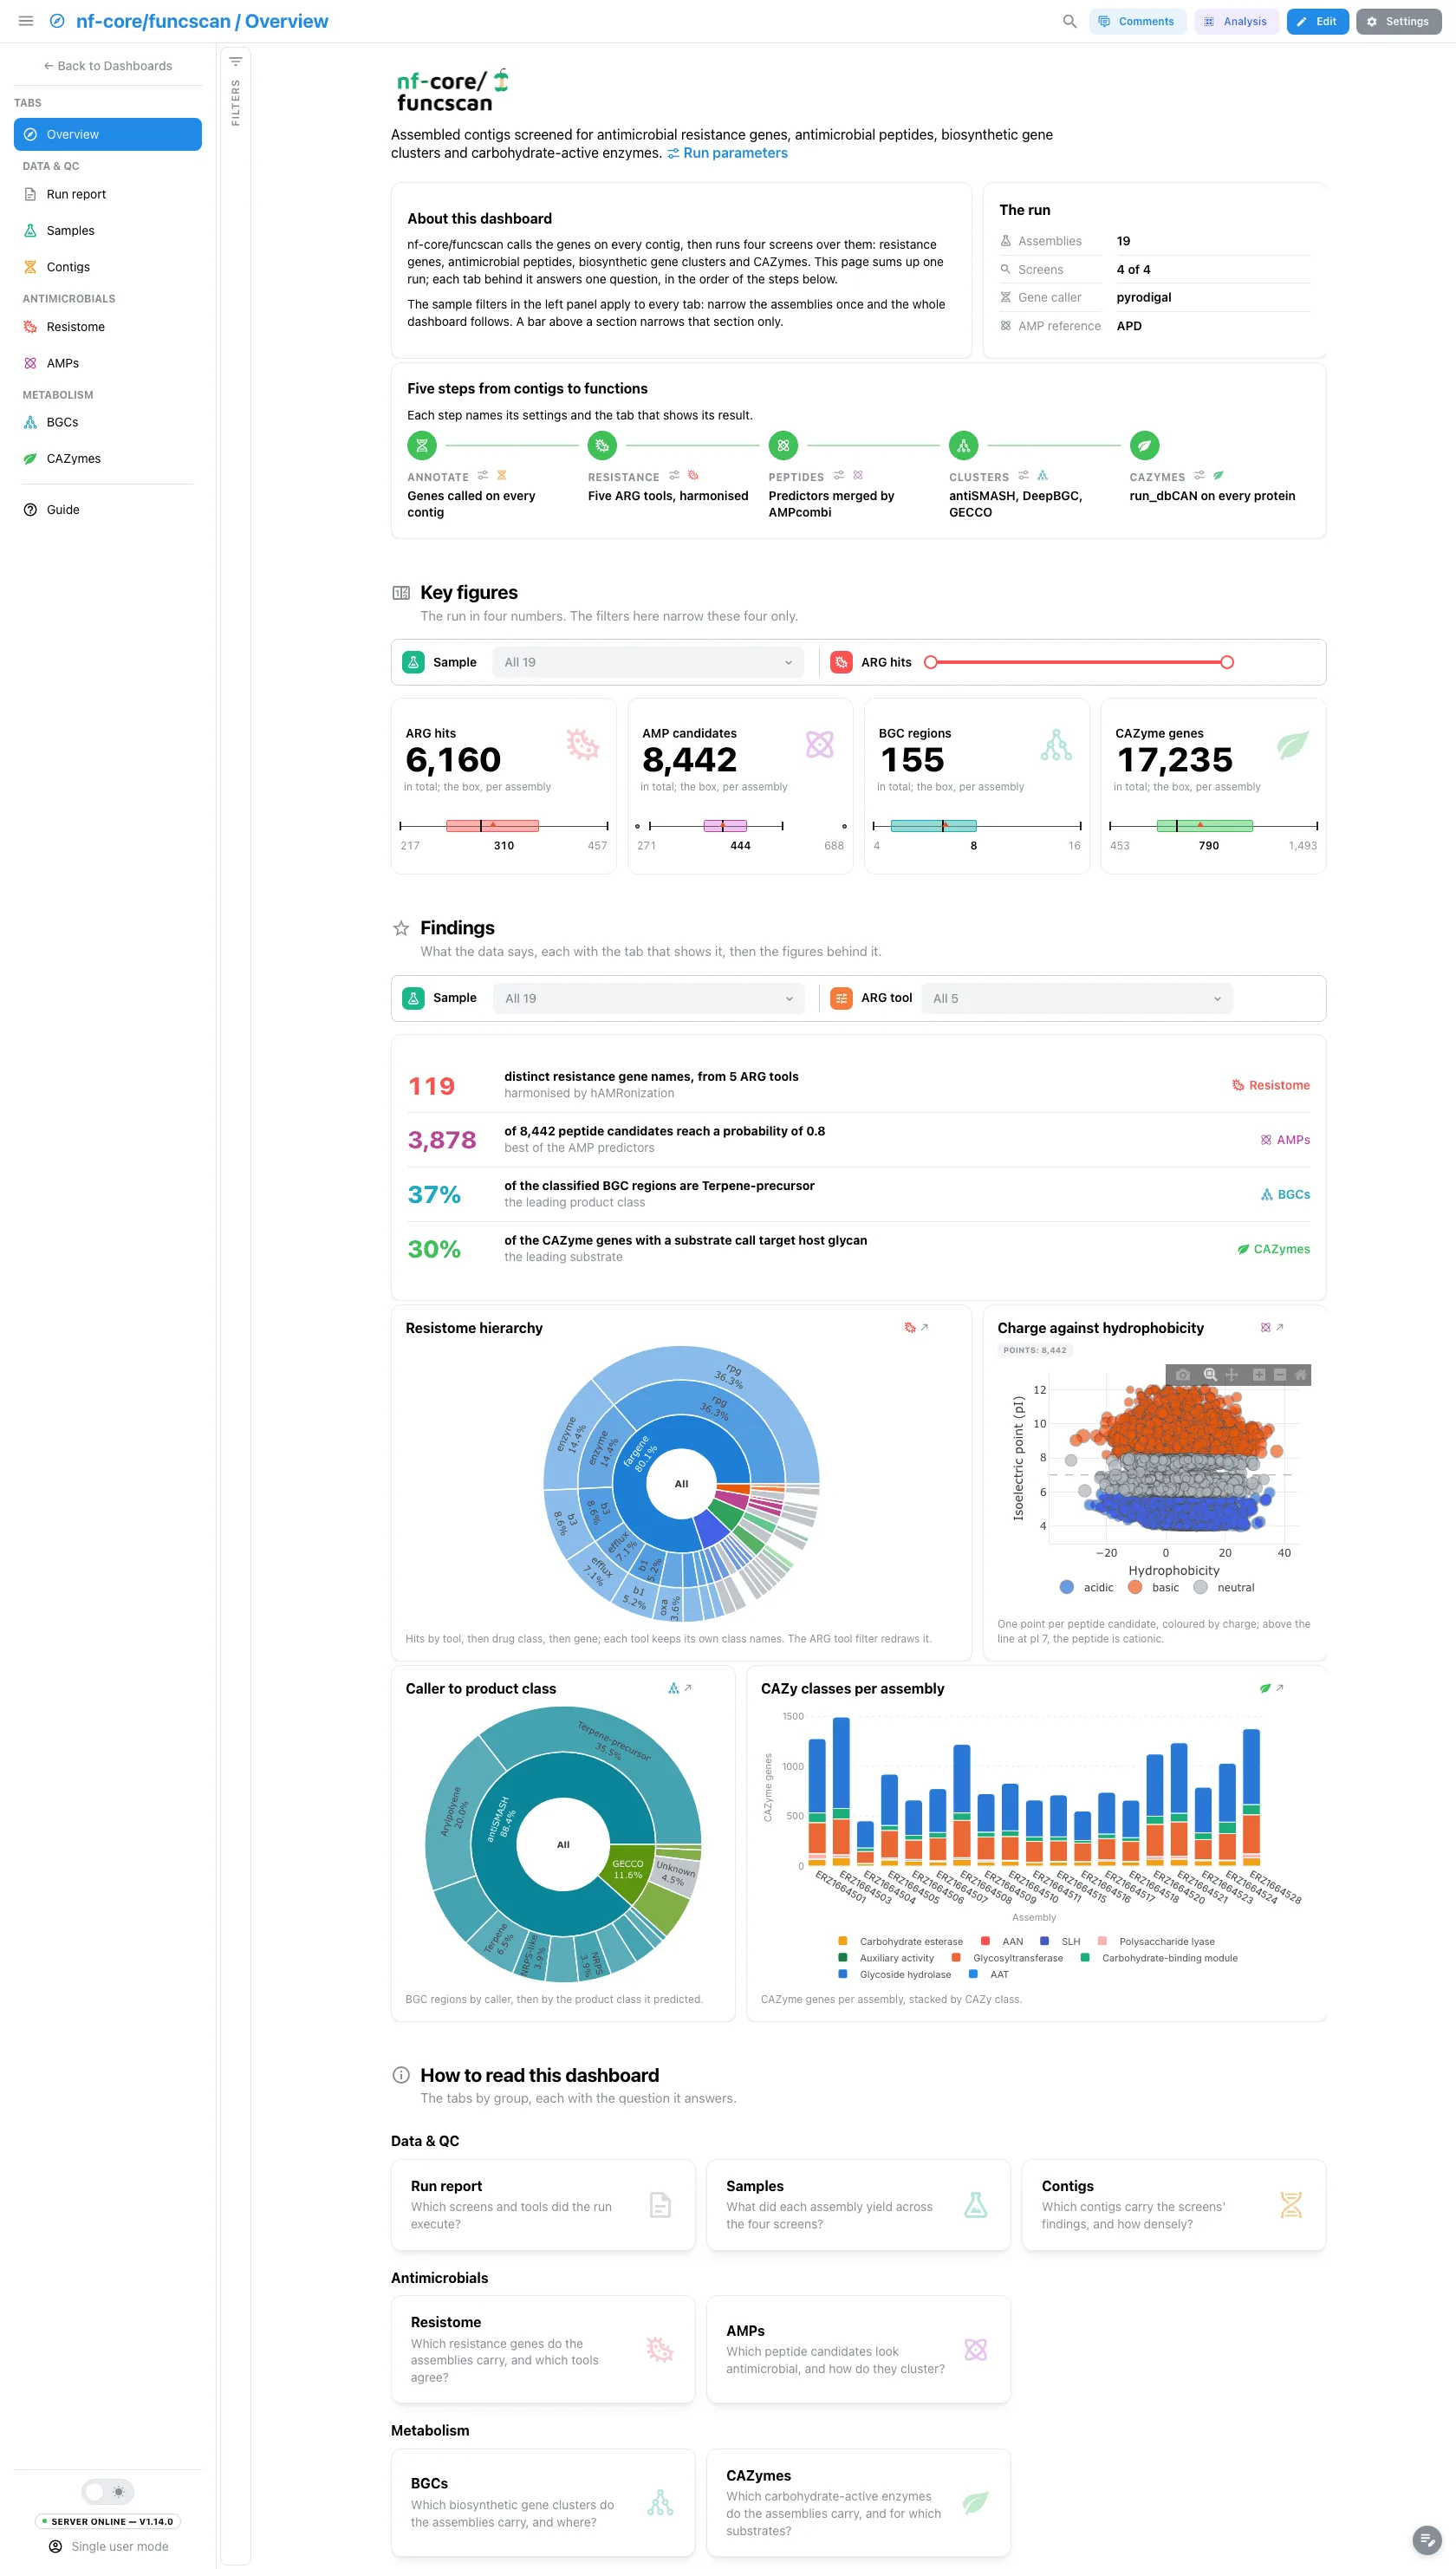
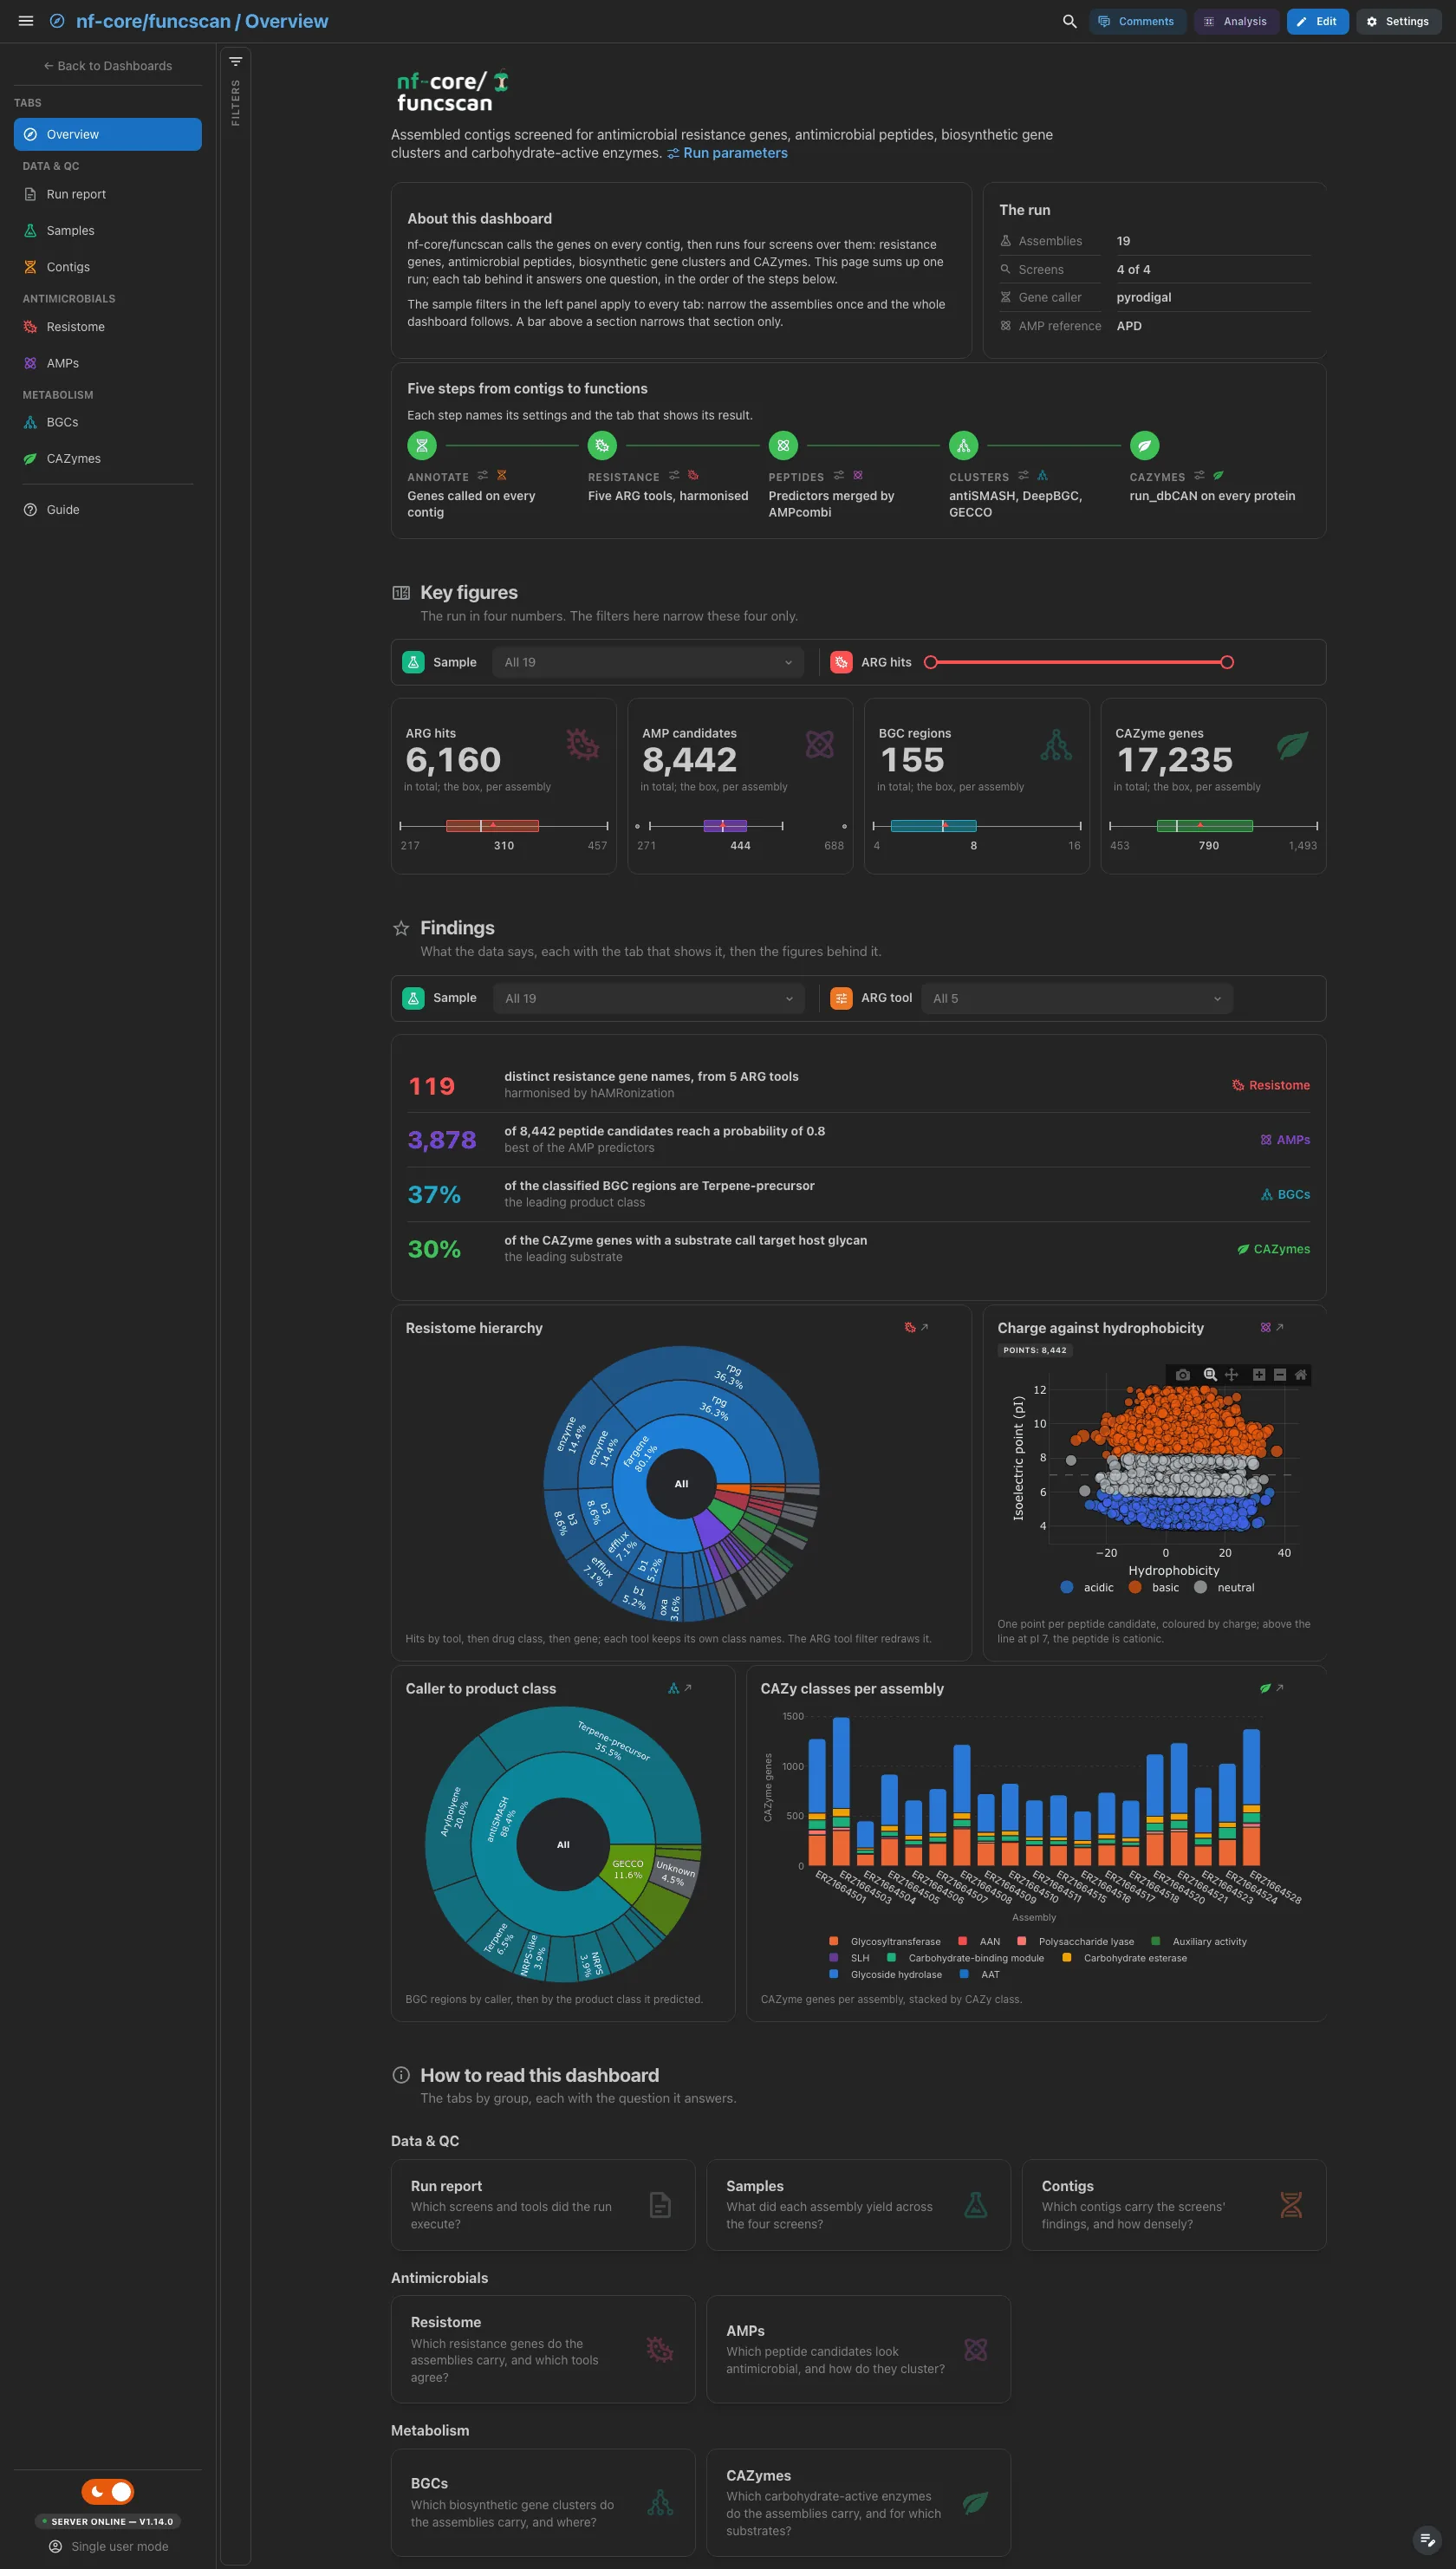
A short hero links the run parameters. About this dashboard says how to move through the tabs, The run lists the assemblies, the screens that ran, the gene caller and the AMP reference database, and Pipeline walks the five steps from annotation to the CAZyme screen, each linked to its parameters and its tab. The four key figures all read the screening hub, so a screen that did not run reads 0 instead of leaving a gap.
Filters and components
Filters · the left panel starts collapsed. Key figures has its own filter bar (the sample id and an ARG-hits range), and so does Findings (the sample id and the ARG tool): each narrows its own section only.
| Section | What it holds |
|---|---|
| Top | Hero, About this dashboard, The run, Pipeline |
| Key figures | 4 headline cards: ARG hits, AMP candidates, BGC regions, CAZyme genes |
| Findings | Live result rows, then 4 figures, one per screen: the resistome sunburst, the AMP property plane, the BGC caller sunburst and the CAZy classes per assembly |
| How to read this dashboard | The tabs by group, each with its question |
Data & QC · Which screens and tools did the run execute?
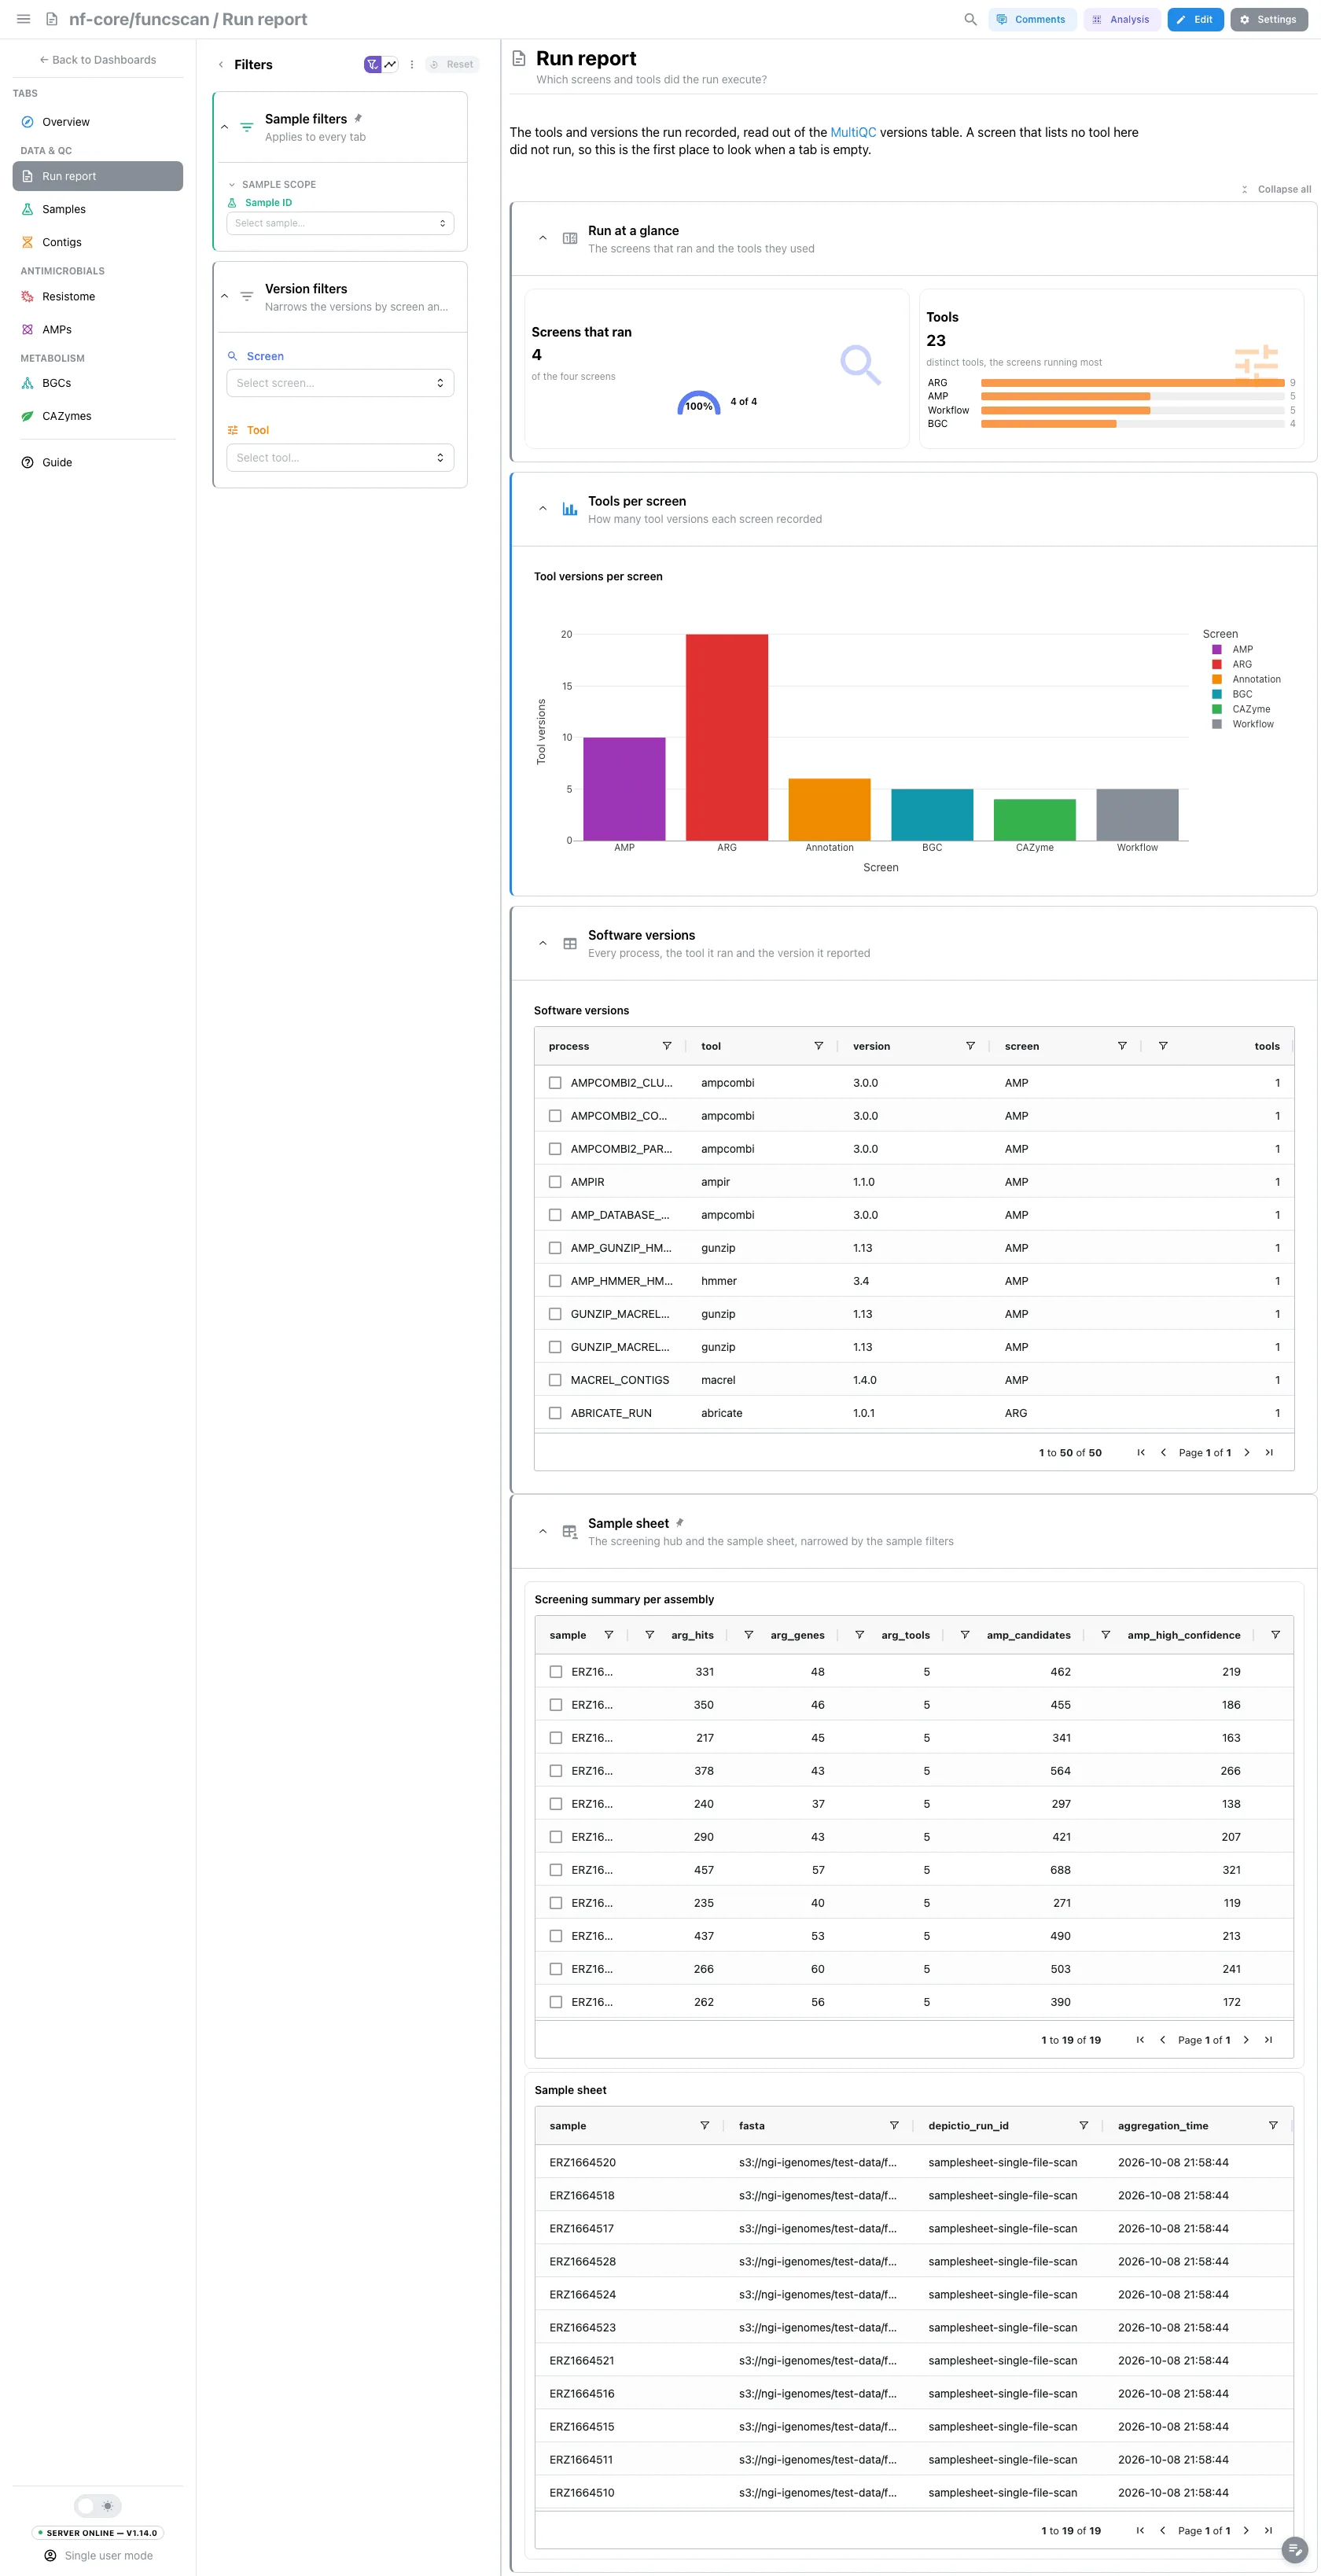
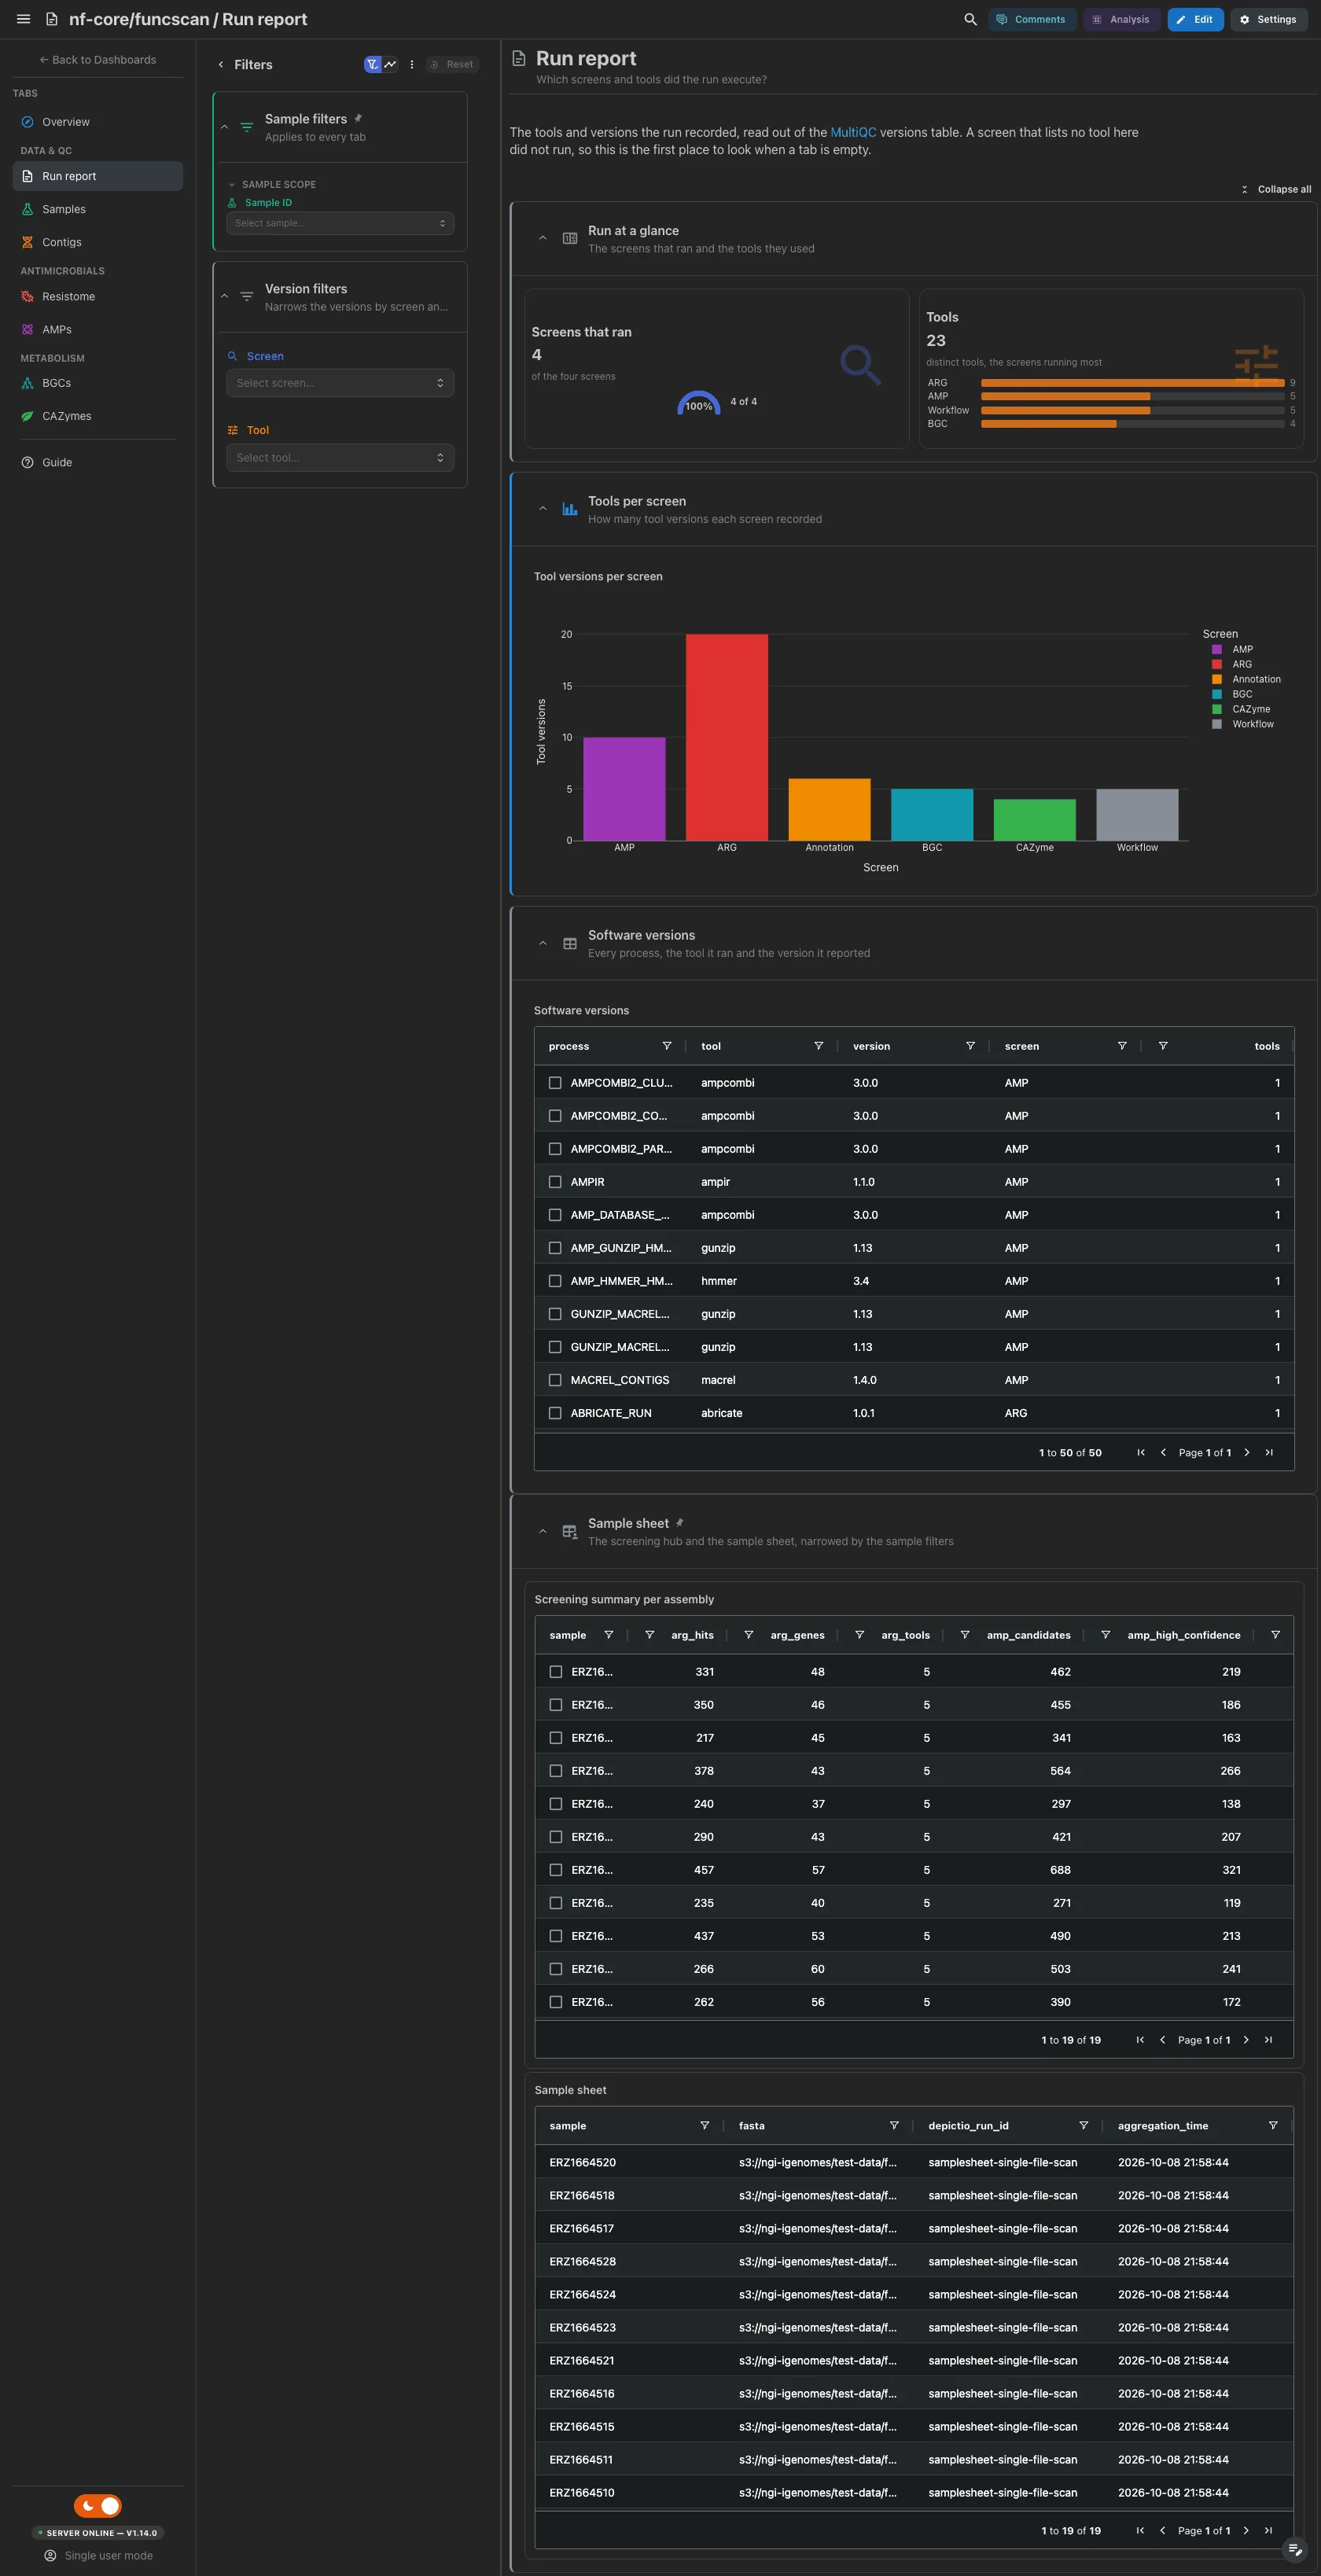
The run's MultiQC report carries software versions only, so there is no MultiQC tab: this one reads the versions back out of it, one row per Nextflow process and tool, assigned to a screen by the process name. Processes that belong to no screen are labelled as workflow plumbing rather than dropped. The screens that ran and the distinct tools come first, then the tool versions per screen. A screen missing here did not run, the first thing to check when a tab is empty.
Filters and components
Filters · Screen and Tool on software_versions.
| Section | What it holds |
|---|---|
| Run at a glance | 2 cards |
| Tools per screen | Tool versions per screen |
| Software versions (collapsed) | Software versions |
Data & QC · What did each assembly yield across the four screens?
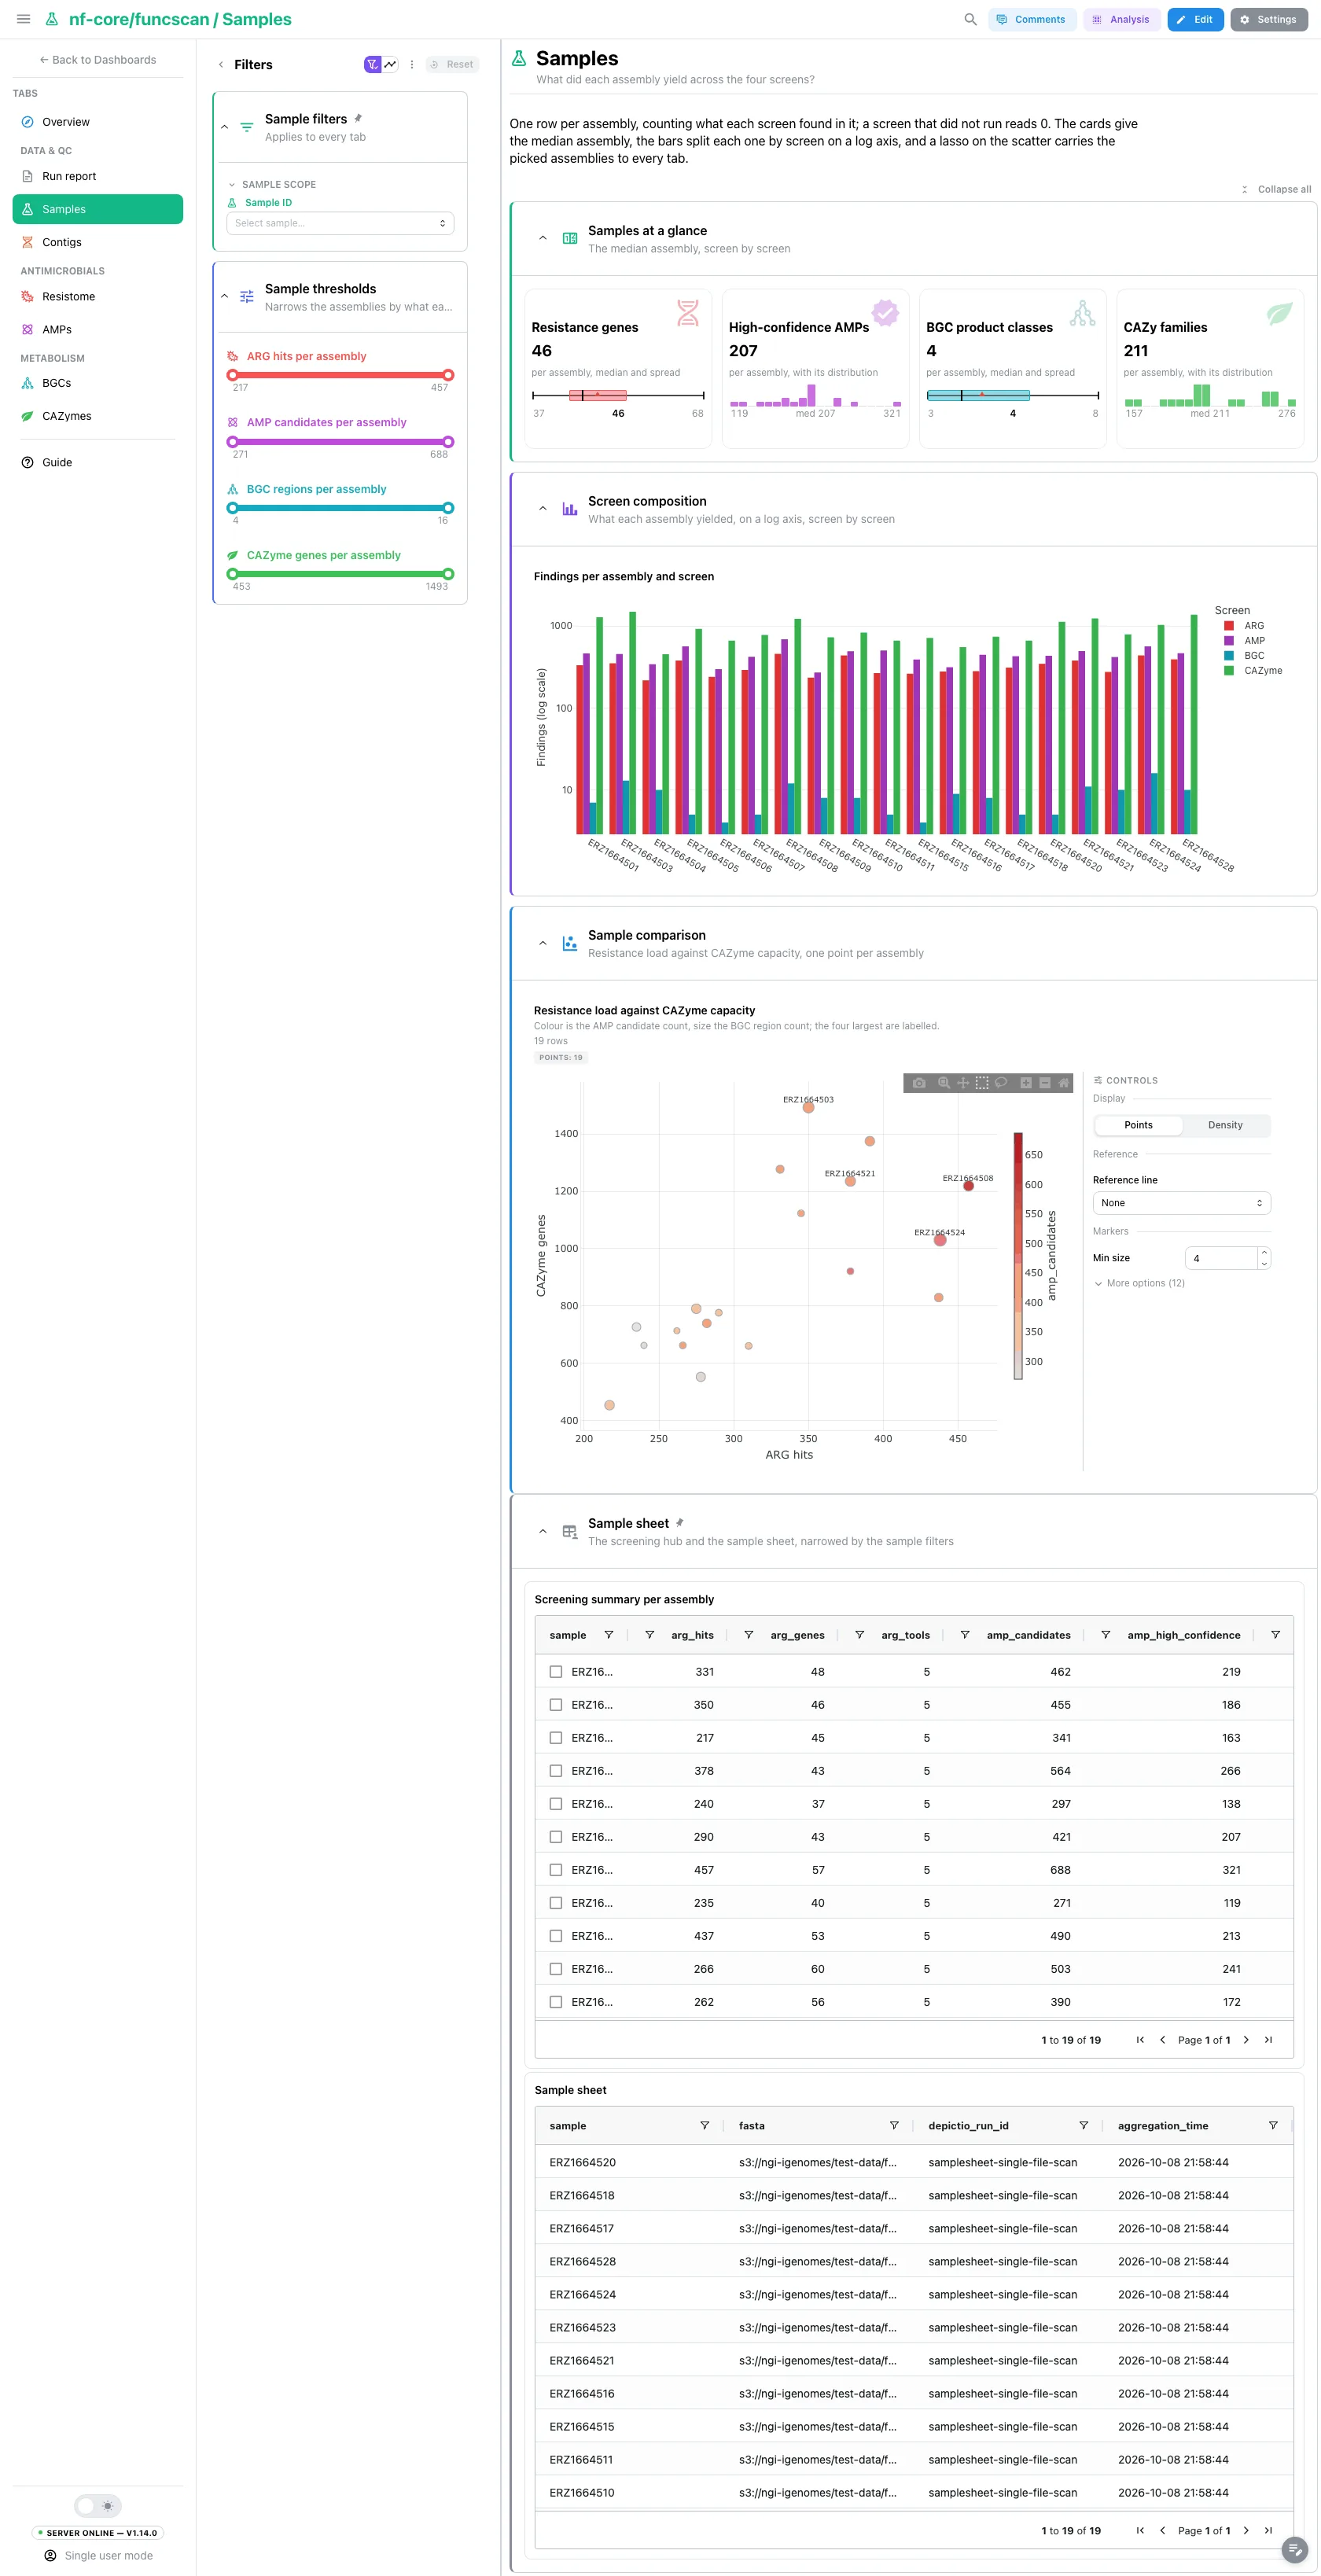
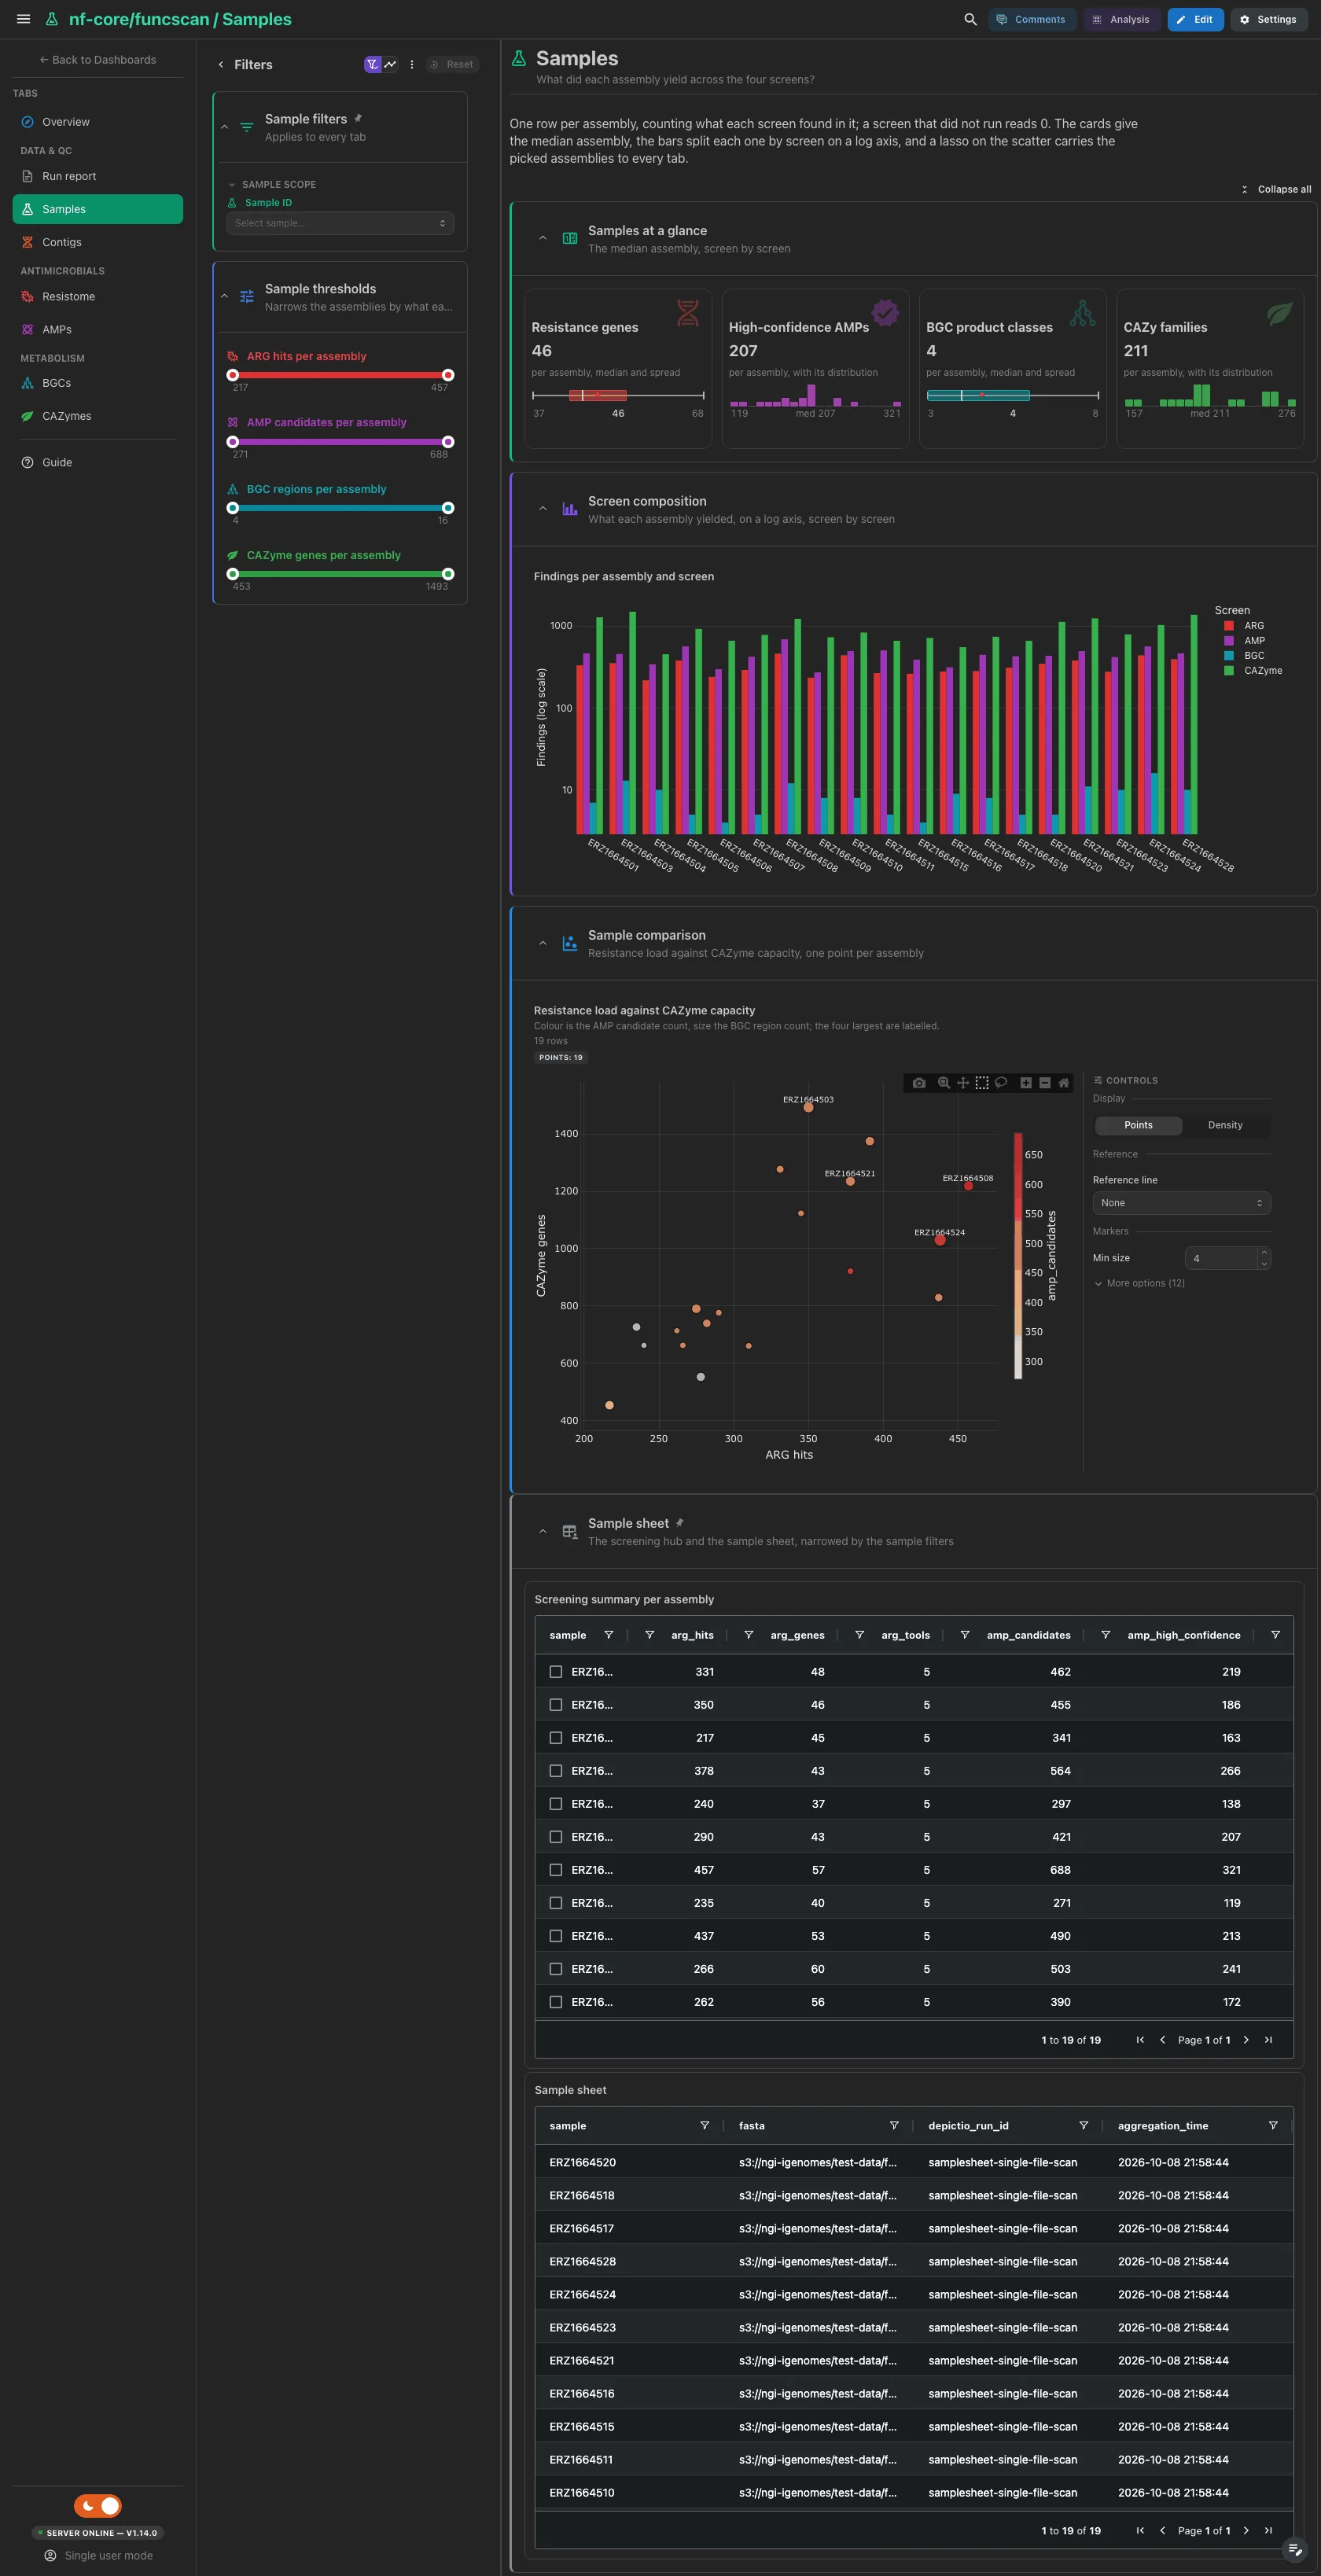
The median assembly's resistance genes, high-confidence AMPs, BGC product classes and CAZy families. Then the findings per assembly and screen as grouped bars on a log axis, since the screens differ by orders of magnitude, and the resistance load against CAZyme capacity. A lasso on that scatter picks assemblies for every tab.
Filters and components
Filters · a range per screen (ARG hits, AMP candidates, BGC regions,
CAZyme genes) on screening_summary, plus the sample filters.
| Section | What it holds |
|---|---|
| Samples at a glance | 4 cards |
| Screen composition | Findings per assembly and screen |
| Sample comparison | 1 advanced visualization |
Data & QC · Which contigs carry the screens' findings, and how densely?
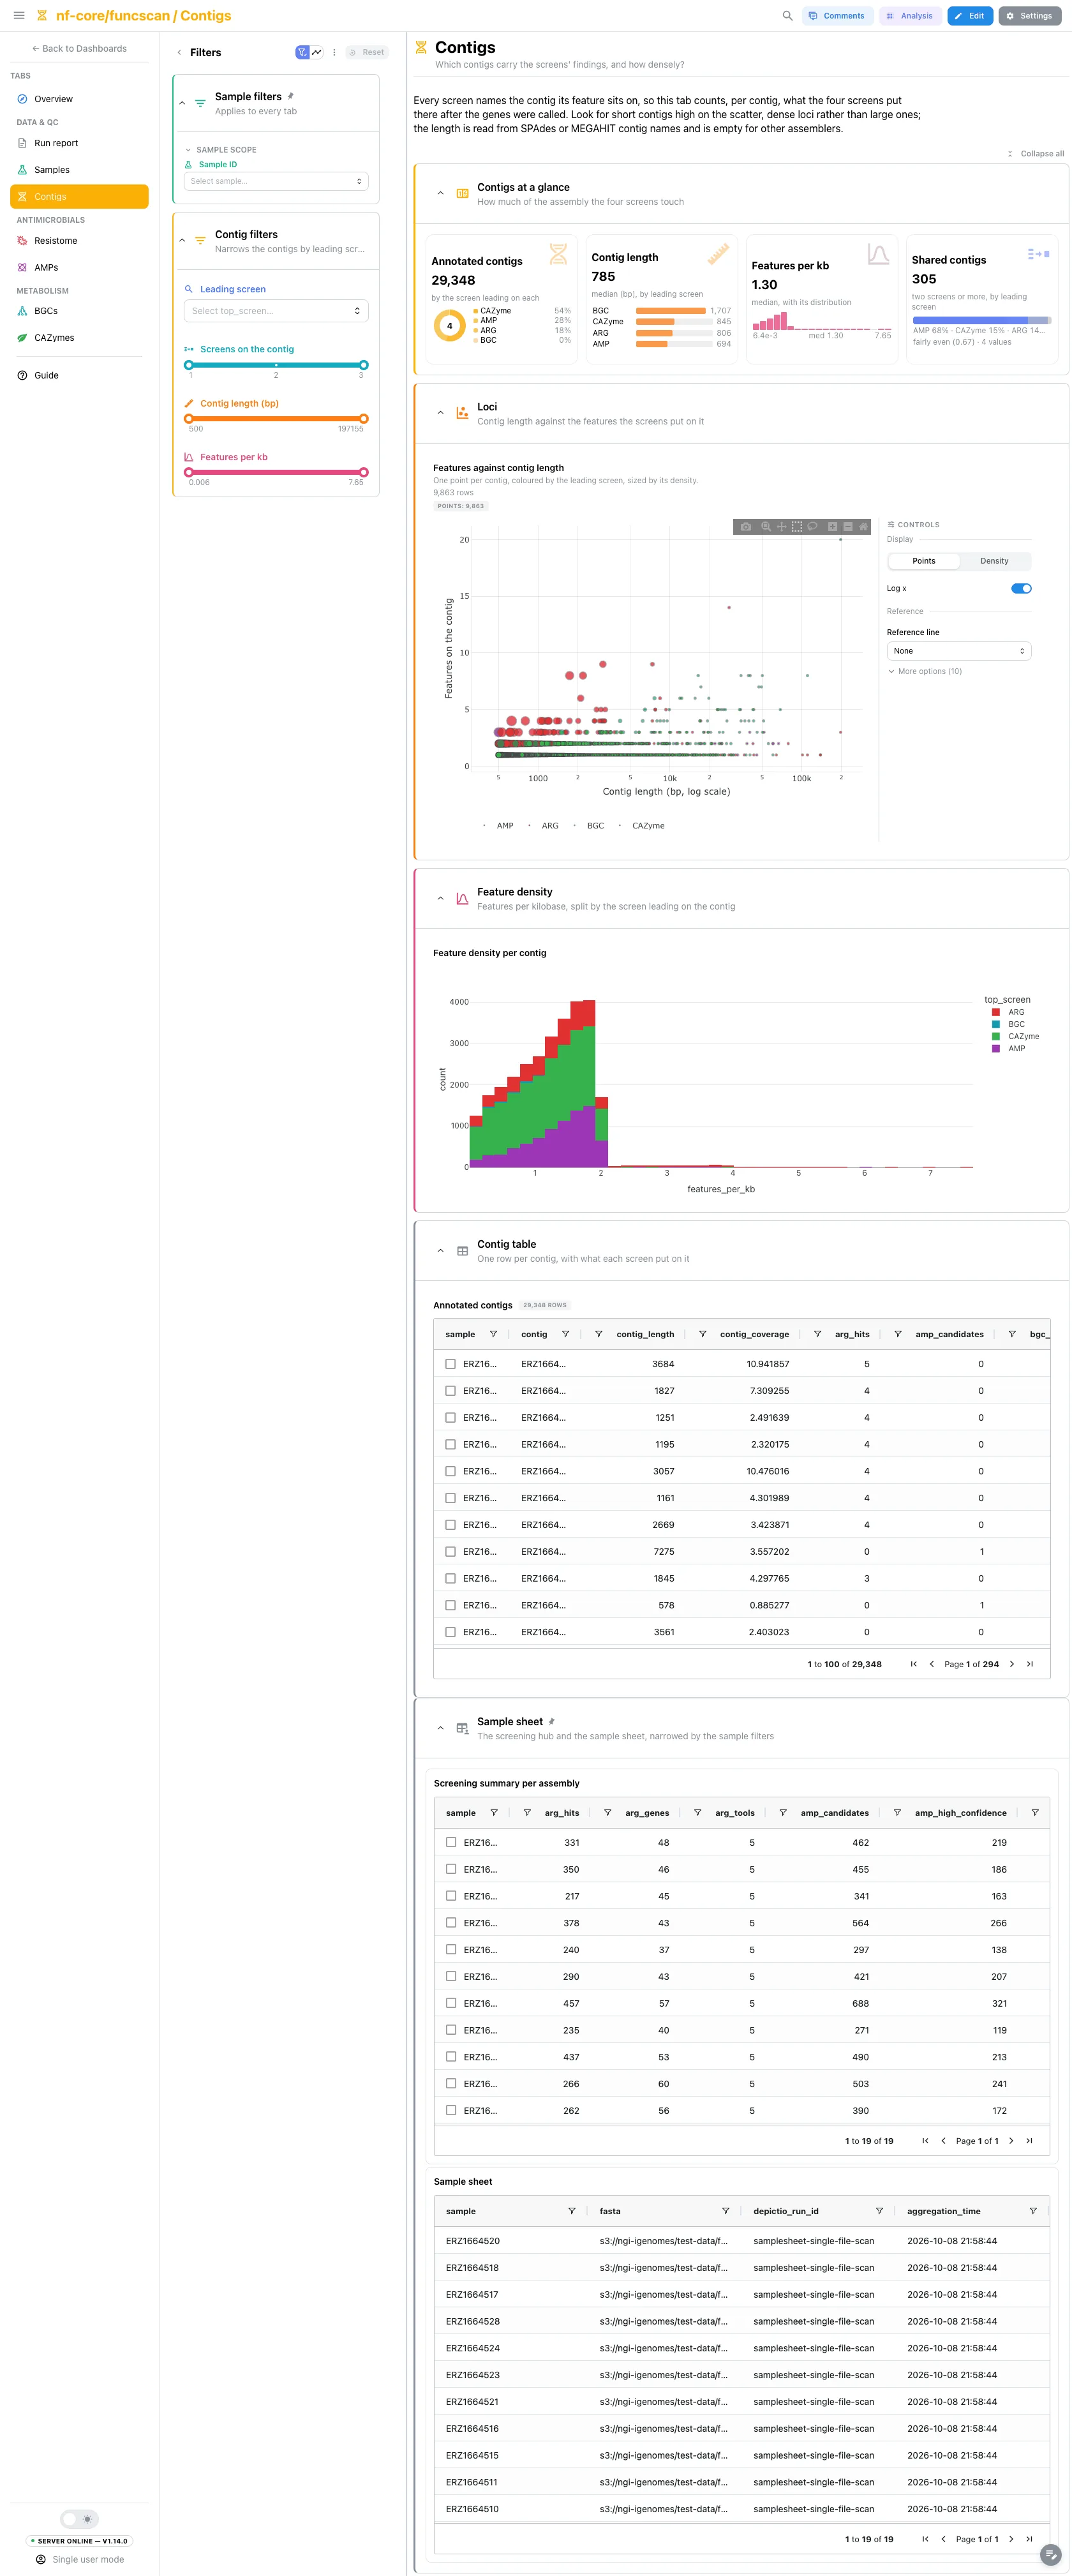
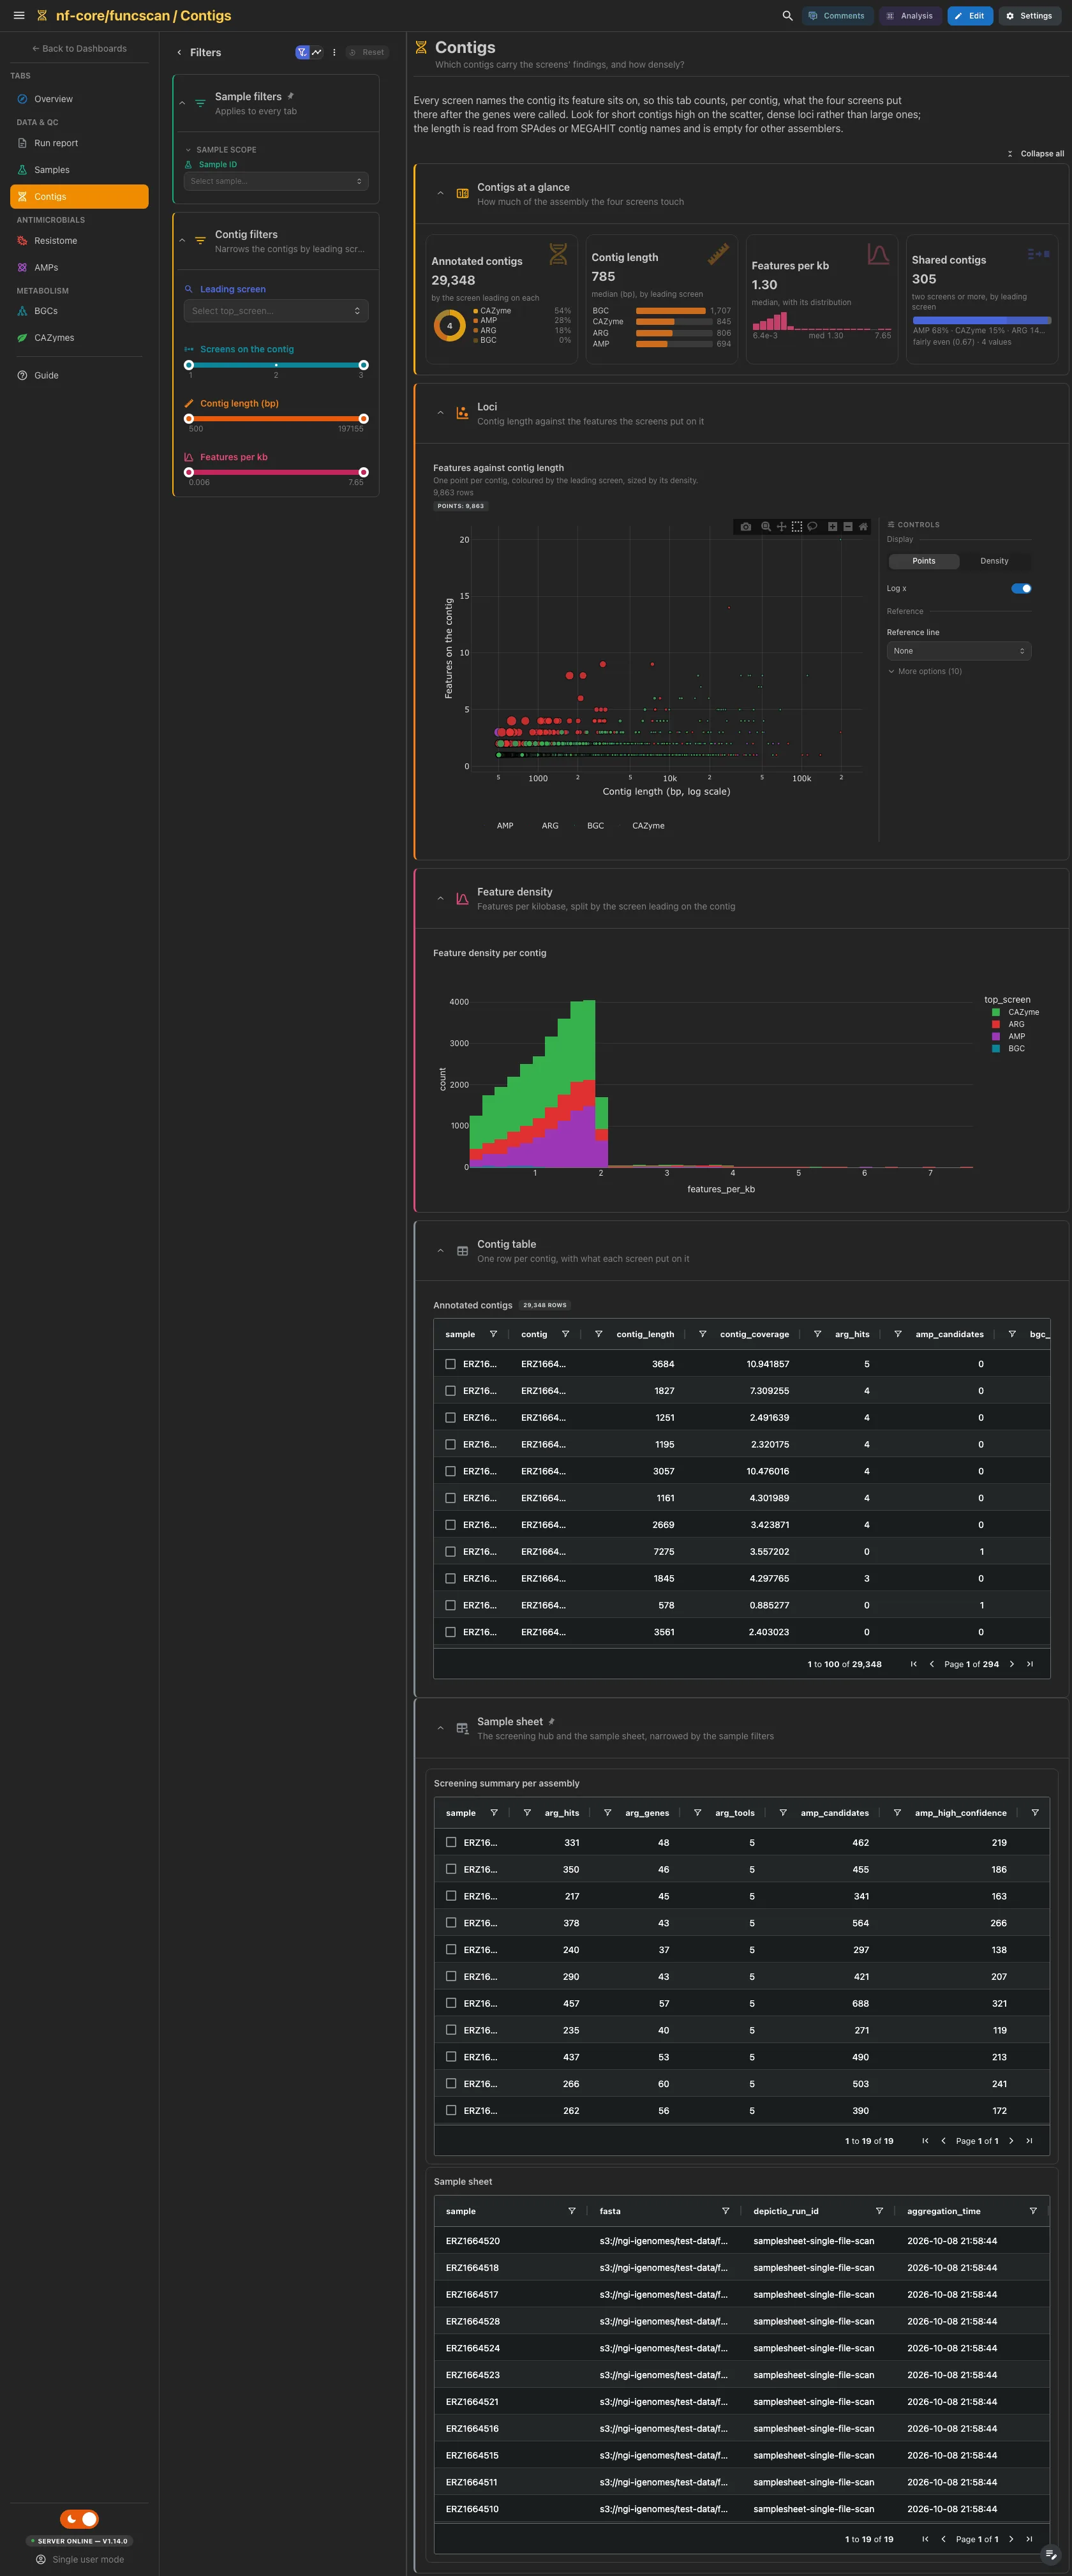
Every screen names the contig its feature sits on, so this tab counts, per contig, what the four screens put there. The cards give the annotated contigs, their length, the feature density and the contigs two screens or more share. Then the features against contig length and the density histogram. The length is read from SPAdes or MEGAHIT contig names, and stays empty for other assemblers.
Filters and components
Filters · Leading screen, plus ranges on the screens per contig, the
contig length and the features per kb, all on contig_annotation.
| Section | What it holds |
|---|---|
| Contigs at a glance | 4 cards |
| Loci | 1 advanced visualization |
| Feature density | Feature density per contig |
| Contig table (collapsed) | Annotated contigs |
Antimicrobials · Which resistance genes do the assemblies carry, and which tools agree?
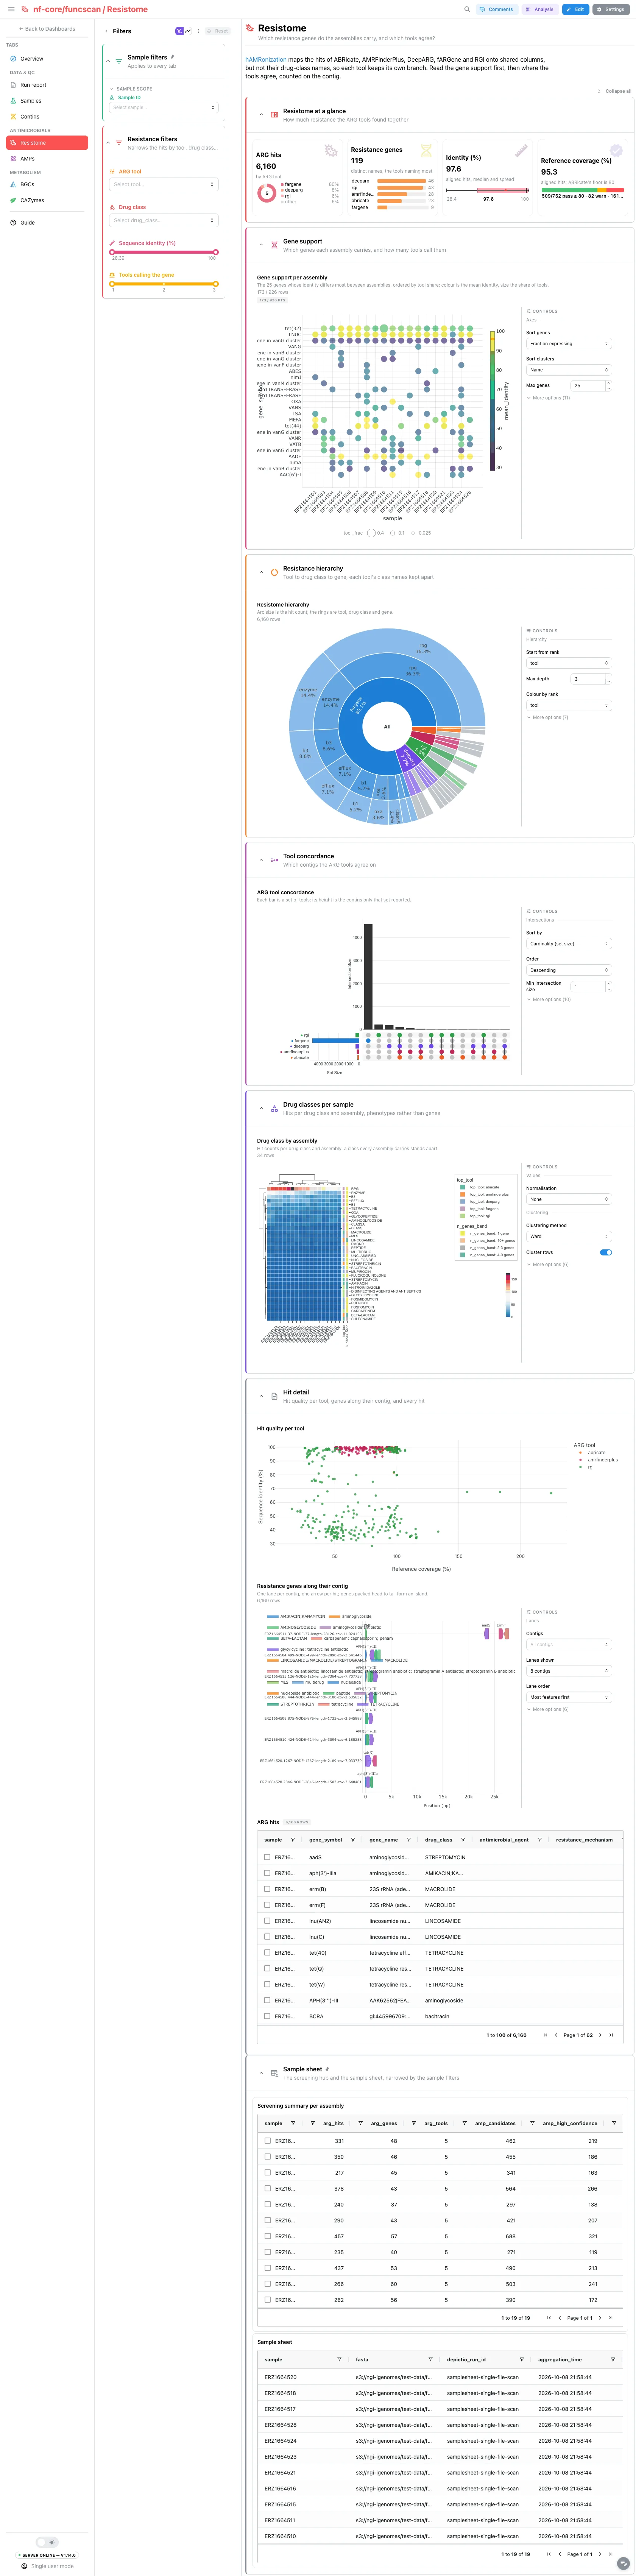
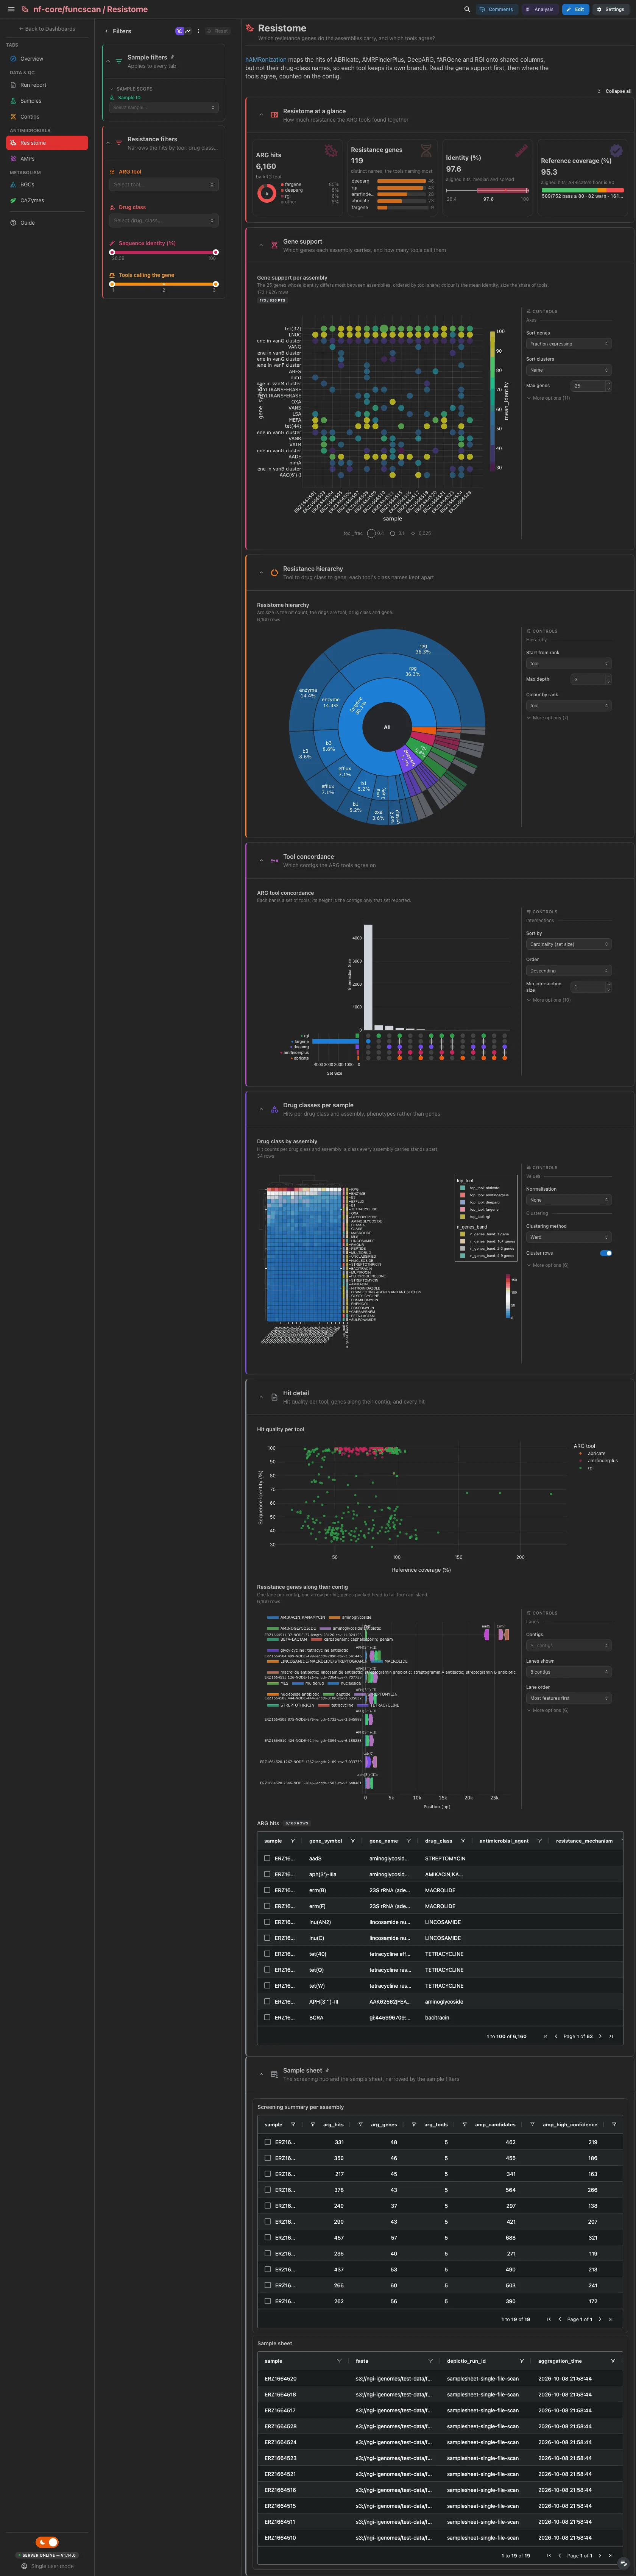
hAMRonization maps the hits of ABRicate, AMRFinderPlus, DeepARG, fARGene and RGI onto shared columns, but not their drug-class names. So the hierarchy starts at the tool, after the gene support per assembly, and the UpSet counts tool agreement on the contig. The drug class by assembly heatmap, the hit quality per tool, the contig track of resistance islands and the hit table are collapsed.
Filters and components
Filters · ARG tool, Drug class and an identity range on
hamronization_report, plus a range on the tools calling a gene.
| Section | What it holds |
|---|---|
| Resistome at a glance | 4 cards |
| Gene support | 1 advanced visualization |
| Resistance hierarchy | 1 advanced visualization |
| Tool concordance | 1 advanced visualization |
| Drug classes per sample (collapsed) | 1 advanced visualization |
| Hit detail (collapsed) | Hit quality per tool, a contig track, ARG hits |
Antimicrobials · Which peptide candidates look antimicrobial, and how do they cluster?
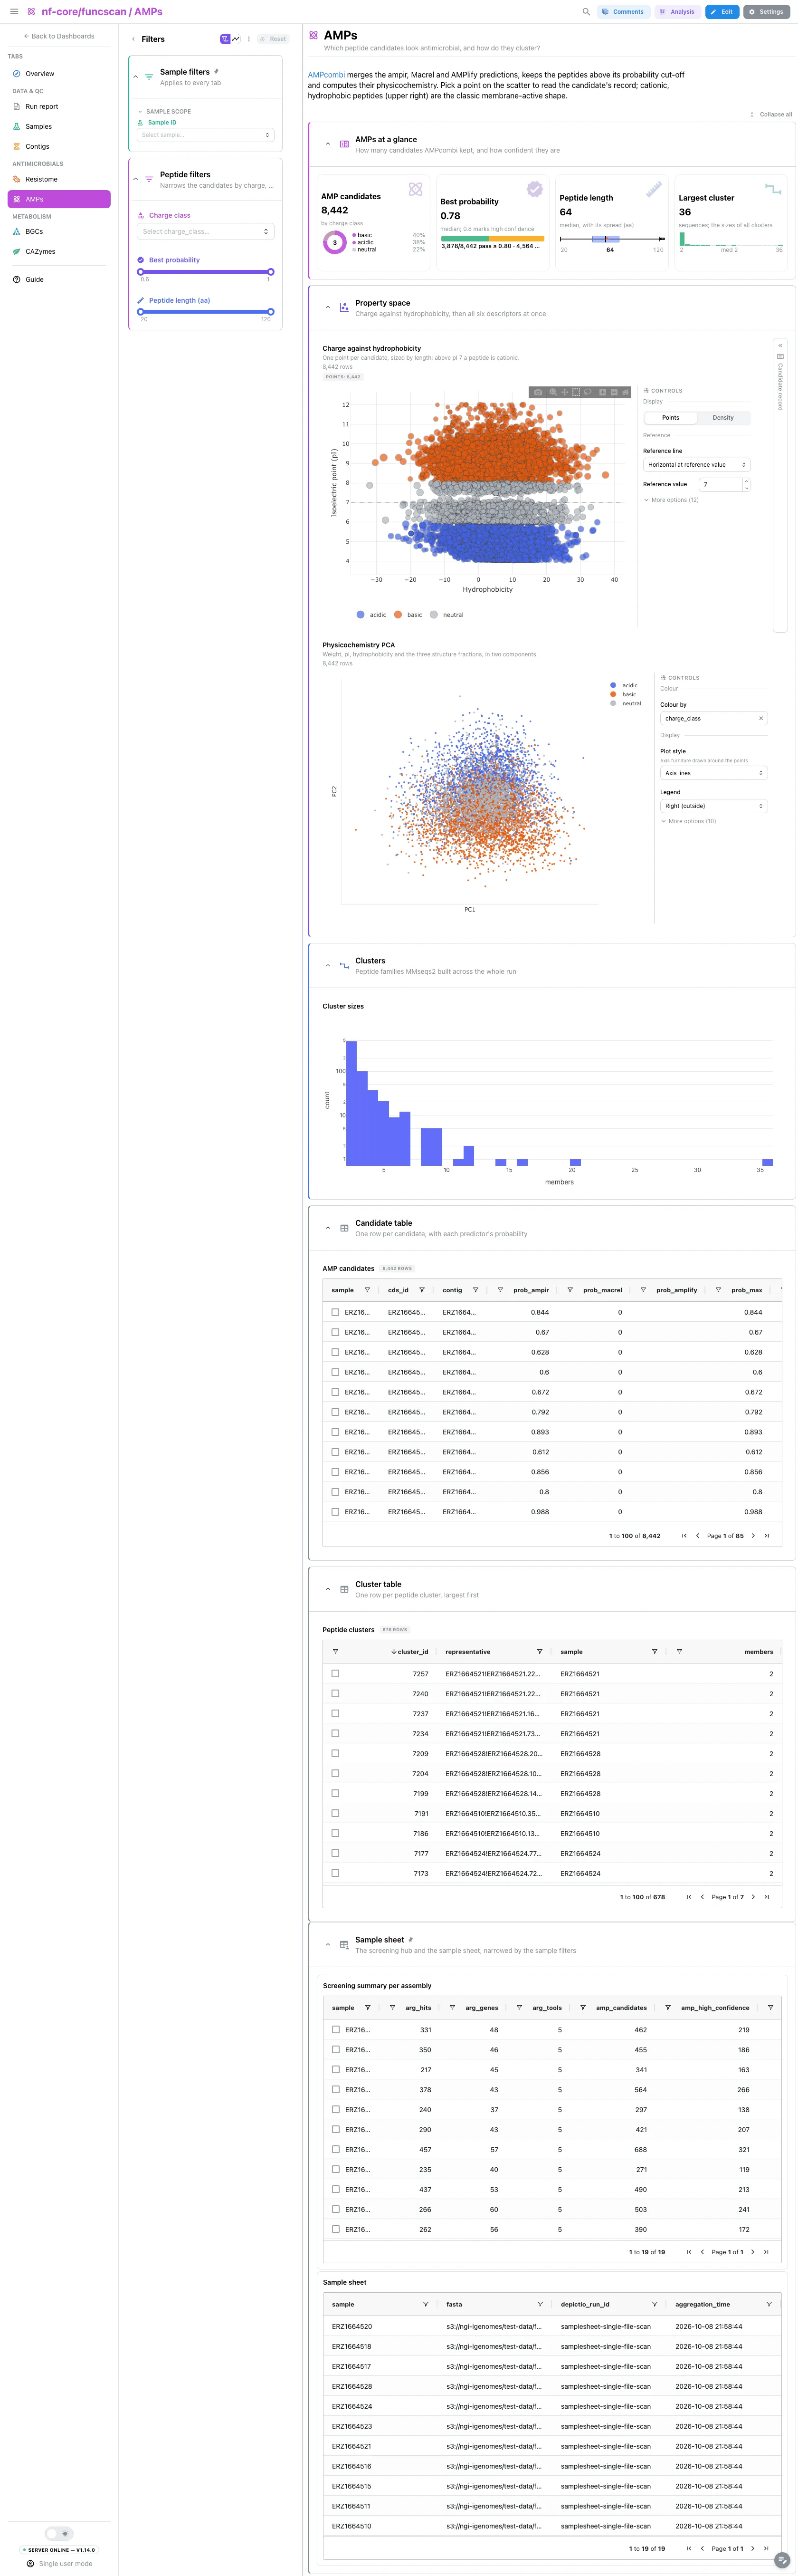
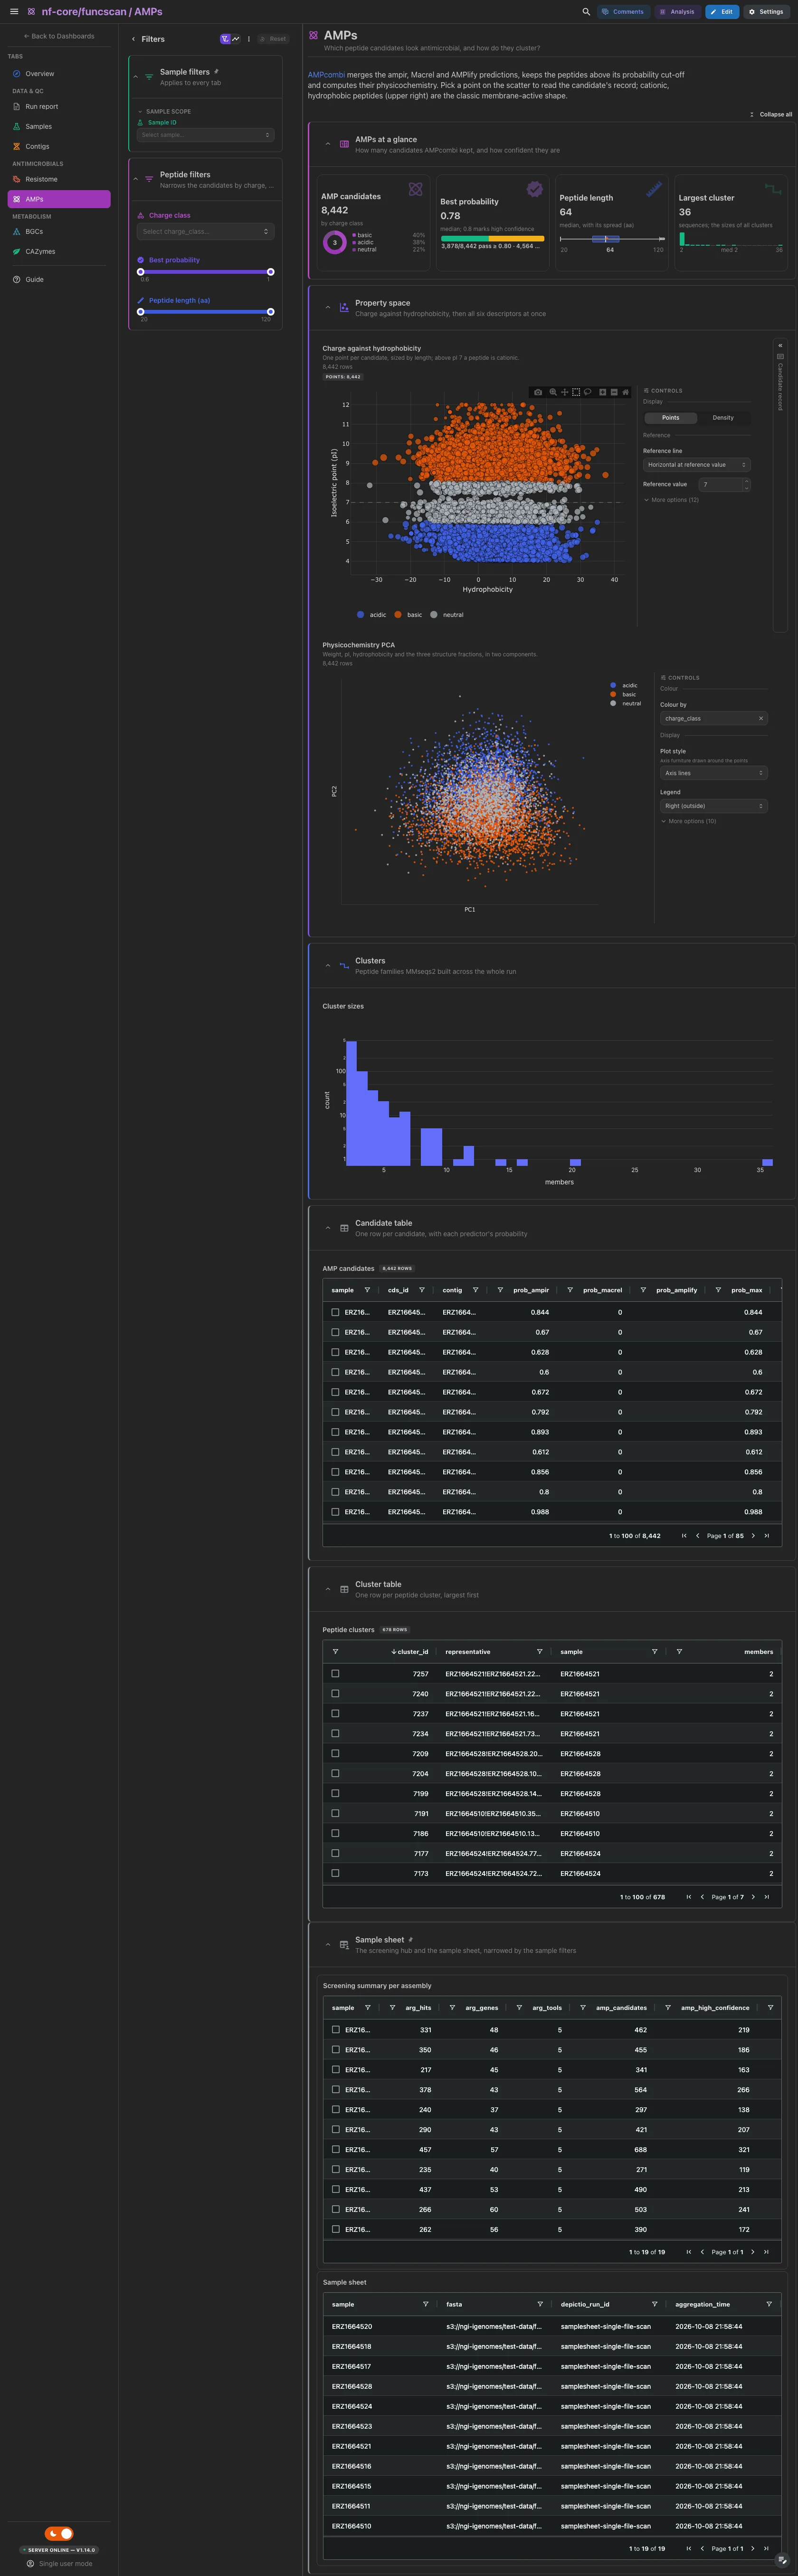
AMPcombi merges the ampir, Macrel and AMPlify predictions and computes the physicochemistry of each peptide. The property plane puts hydrophobicity against the isoelectric point, coloured by charge, beside a record card for the peptide you pick. The physicochemistry PCA and the MMseqs2 cluster sizes follow.
Filters and components
Filters · Charge class, plus best-probability and length ranges, on
ampcombi_summary.
| Section | What it holds |
|---|---|
| AMPs at a glance | 4 cards |
| Property space | 2 advanced visualizations + a candidate record card |
| Clusters | Cluster sizes |
| Candidate table (collapsed) | AMP candidates |
| Cluster table (collapsed) | Peptide clusters |
Metabolism · Which biosynthetic gene clusters do the assemblies carry, and where?
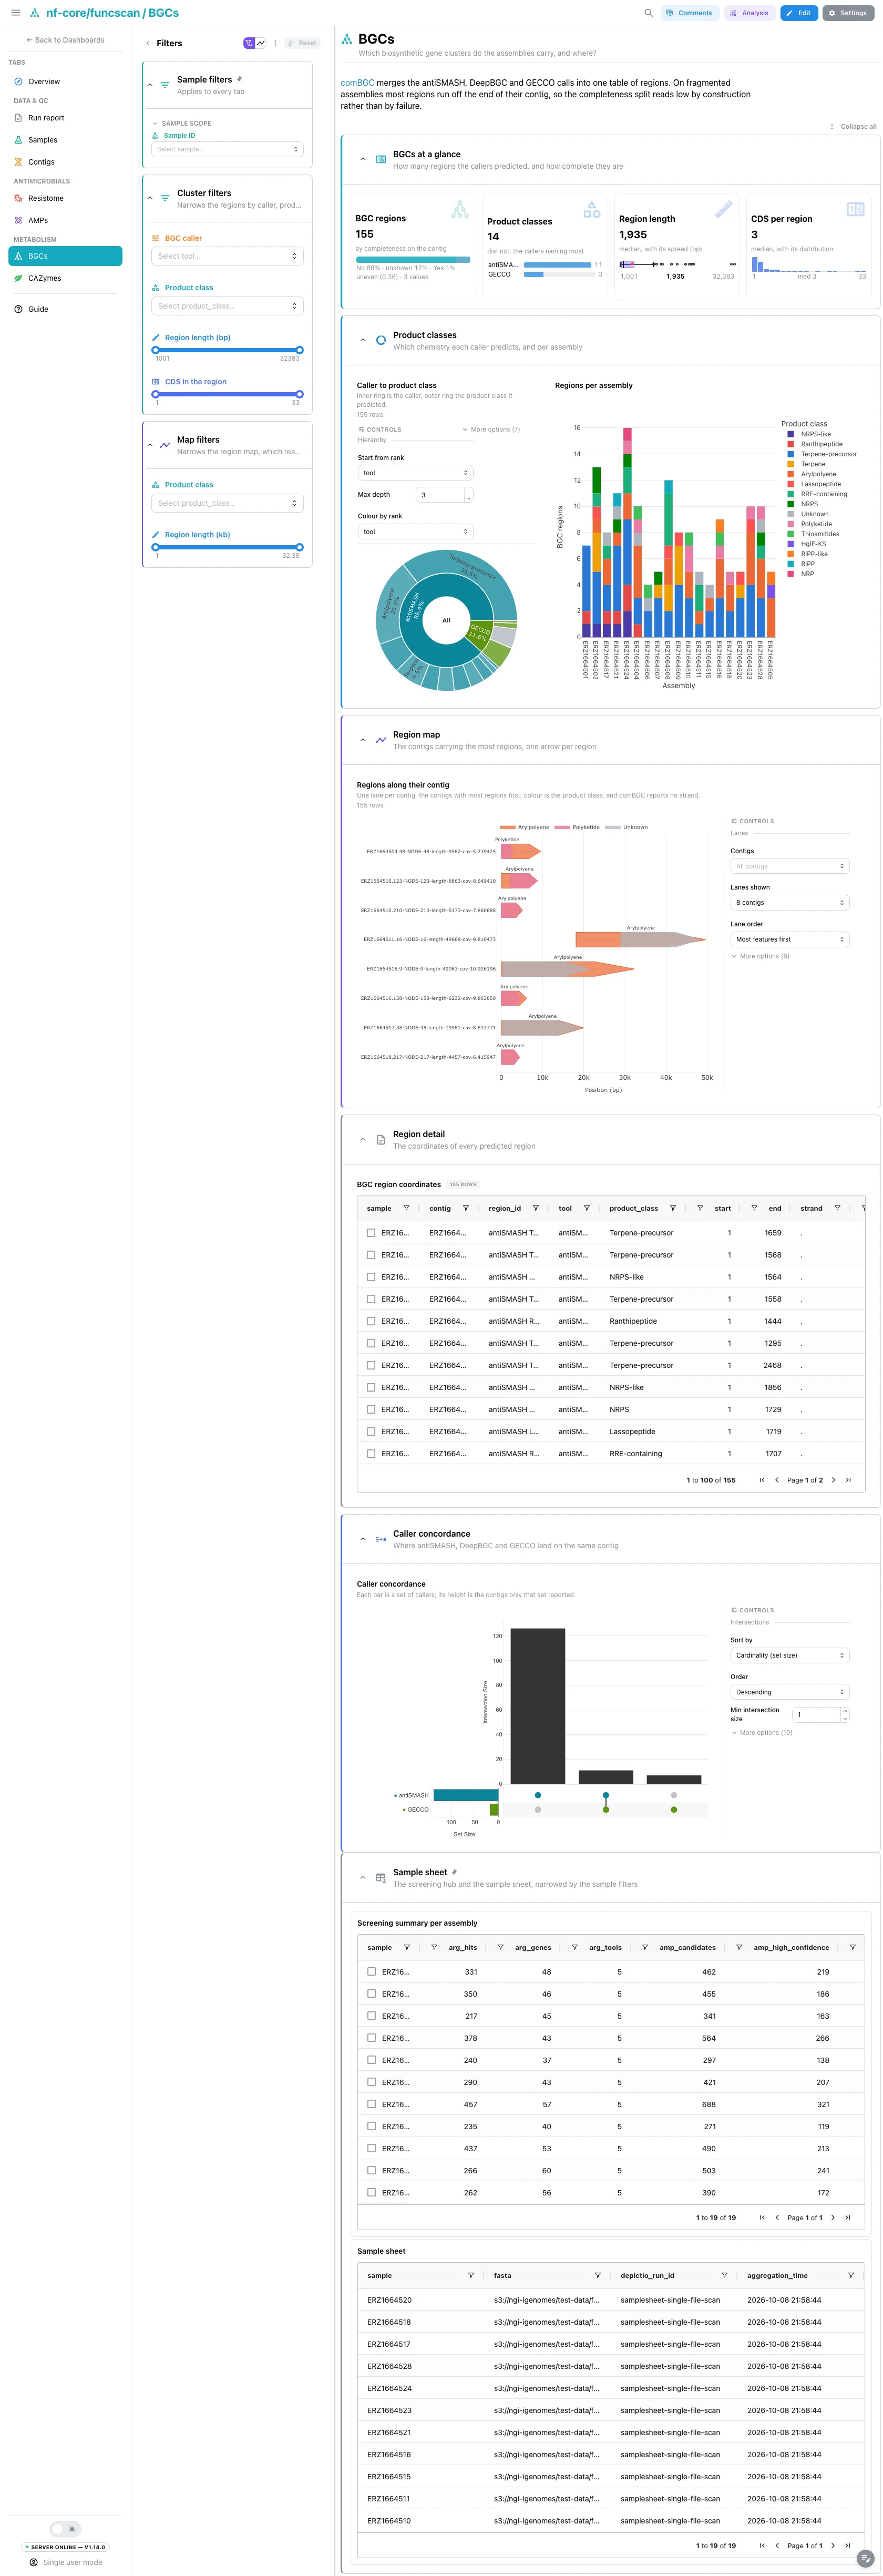
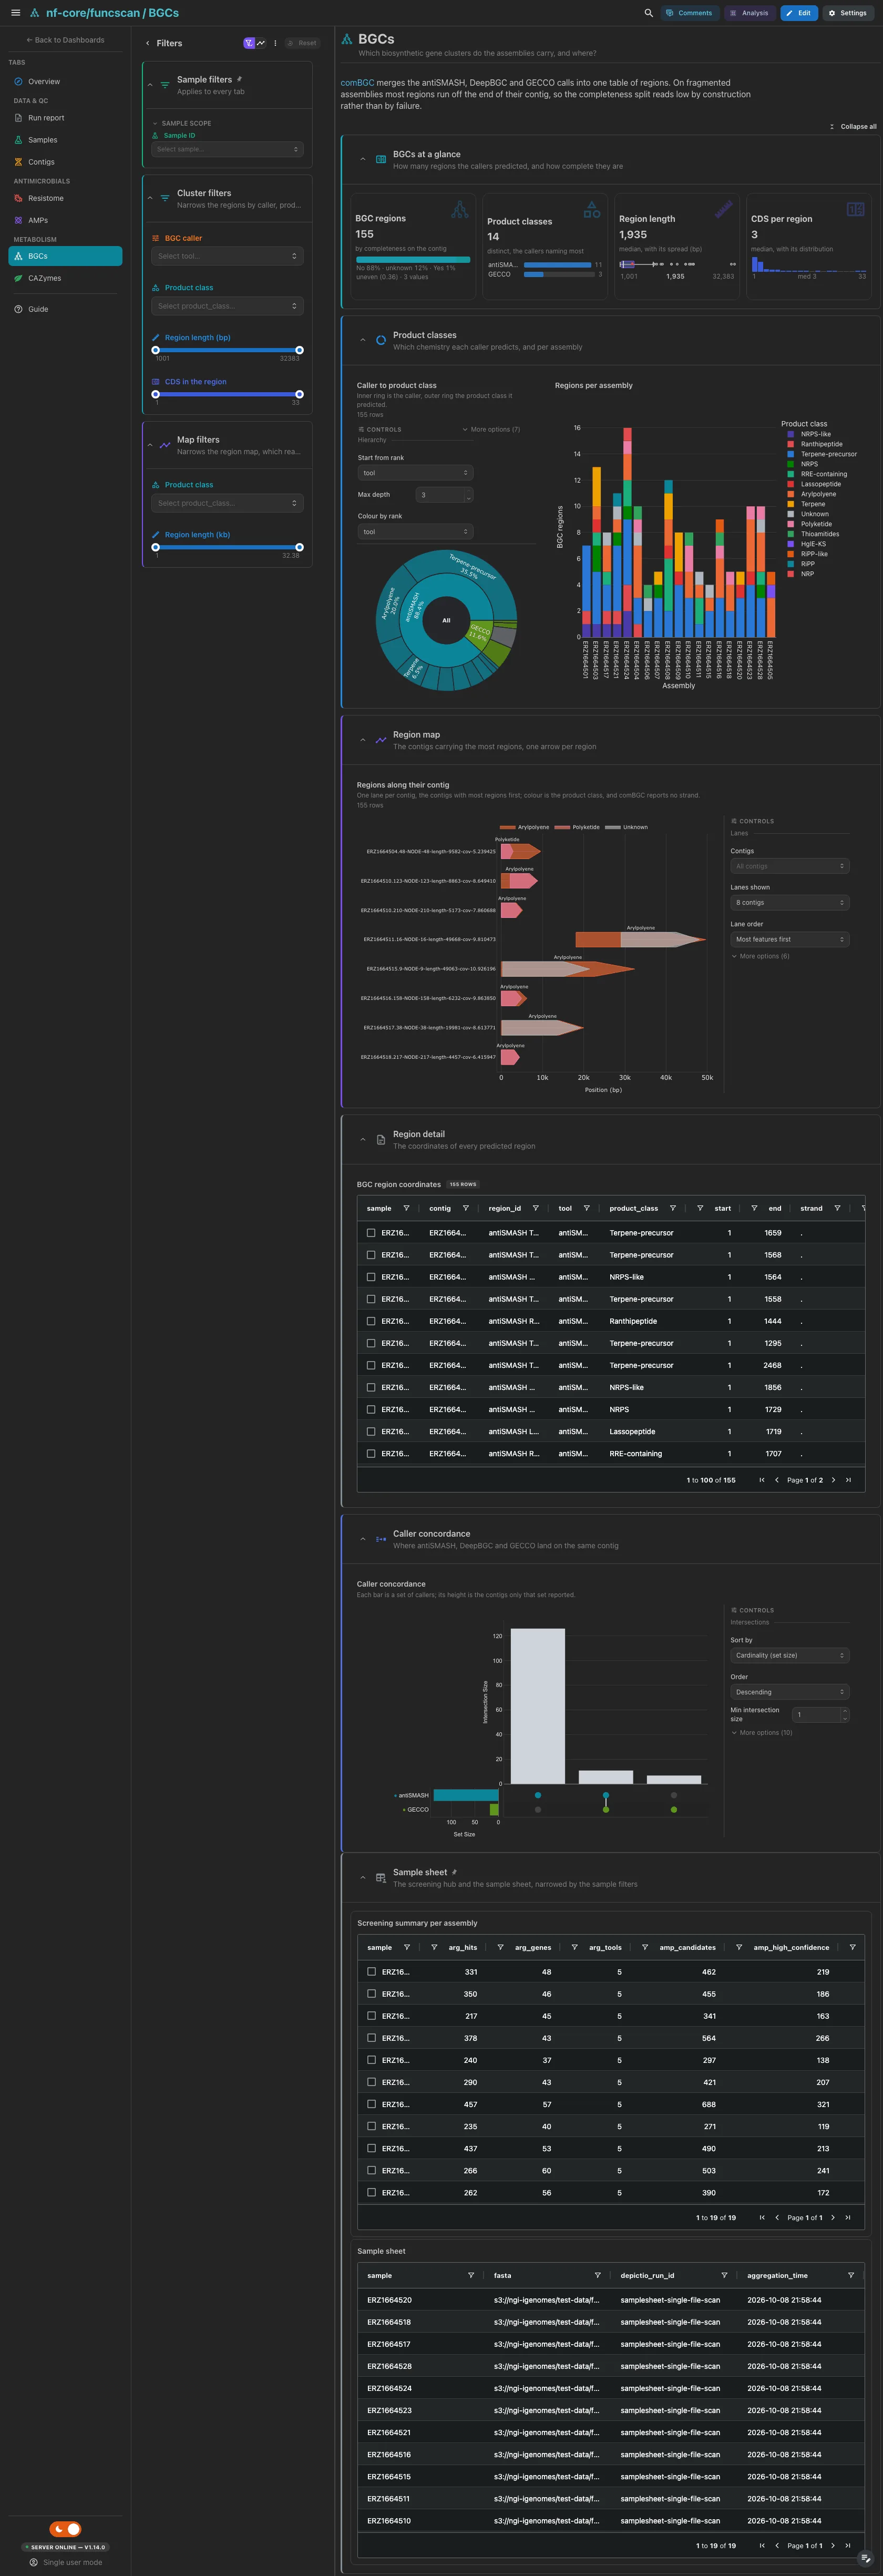
comBGC merges the antiSMASH, DeepBGC and GECCO calls into one table of regions. On fragmented assemblies most regions run off the end of their contig, so the completeness split reads low by construction. The caller to product class sunburst sits beside the regions per assembly, then one arrow lane per contig. The caller concordance UpSet, counted on the contig, is collapsed.
Filters and components
Filters · BGC caller and Product class, plus length and CDS-count
ranges, on combgc_summary; a second product class and length pair narrows
the region map.
| Section | What it holds |
|---|---|
| BGCs at a glance | 4 cards |
| Product classes | 1 advanced visualization + Regions per assembly |
| Region map | 1 advanced visualization |
| Region detail (collapsed) | BGC region coordinates |
| Caller concordance (collapsed) | 1 advanced visualization |
Metabolism · Which carbohydrate-active enzymes do the assemblies carry, and for which substrates?
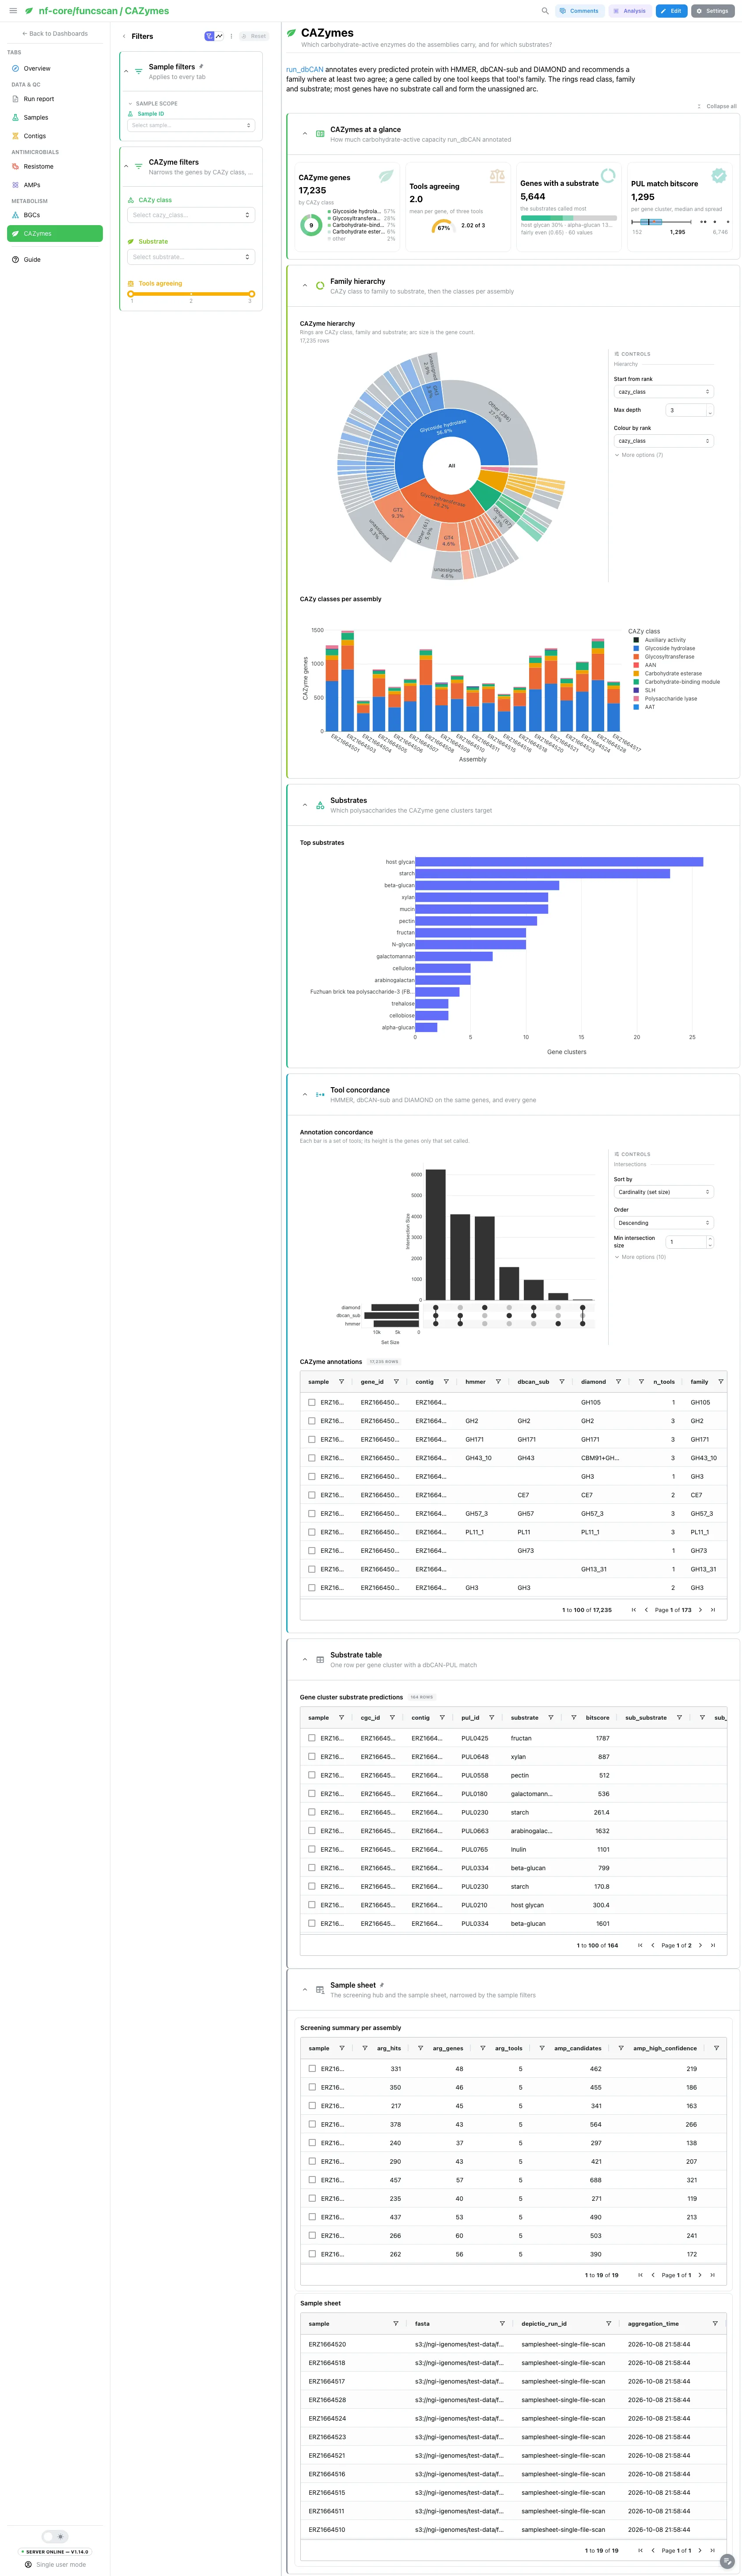
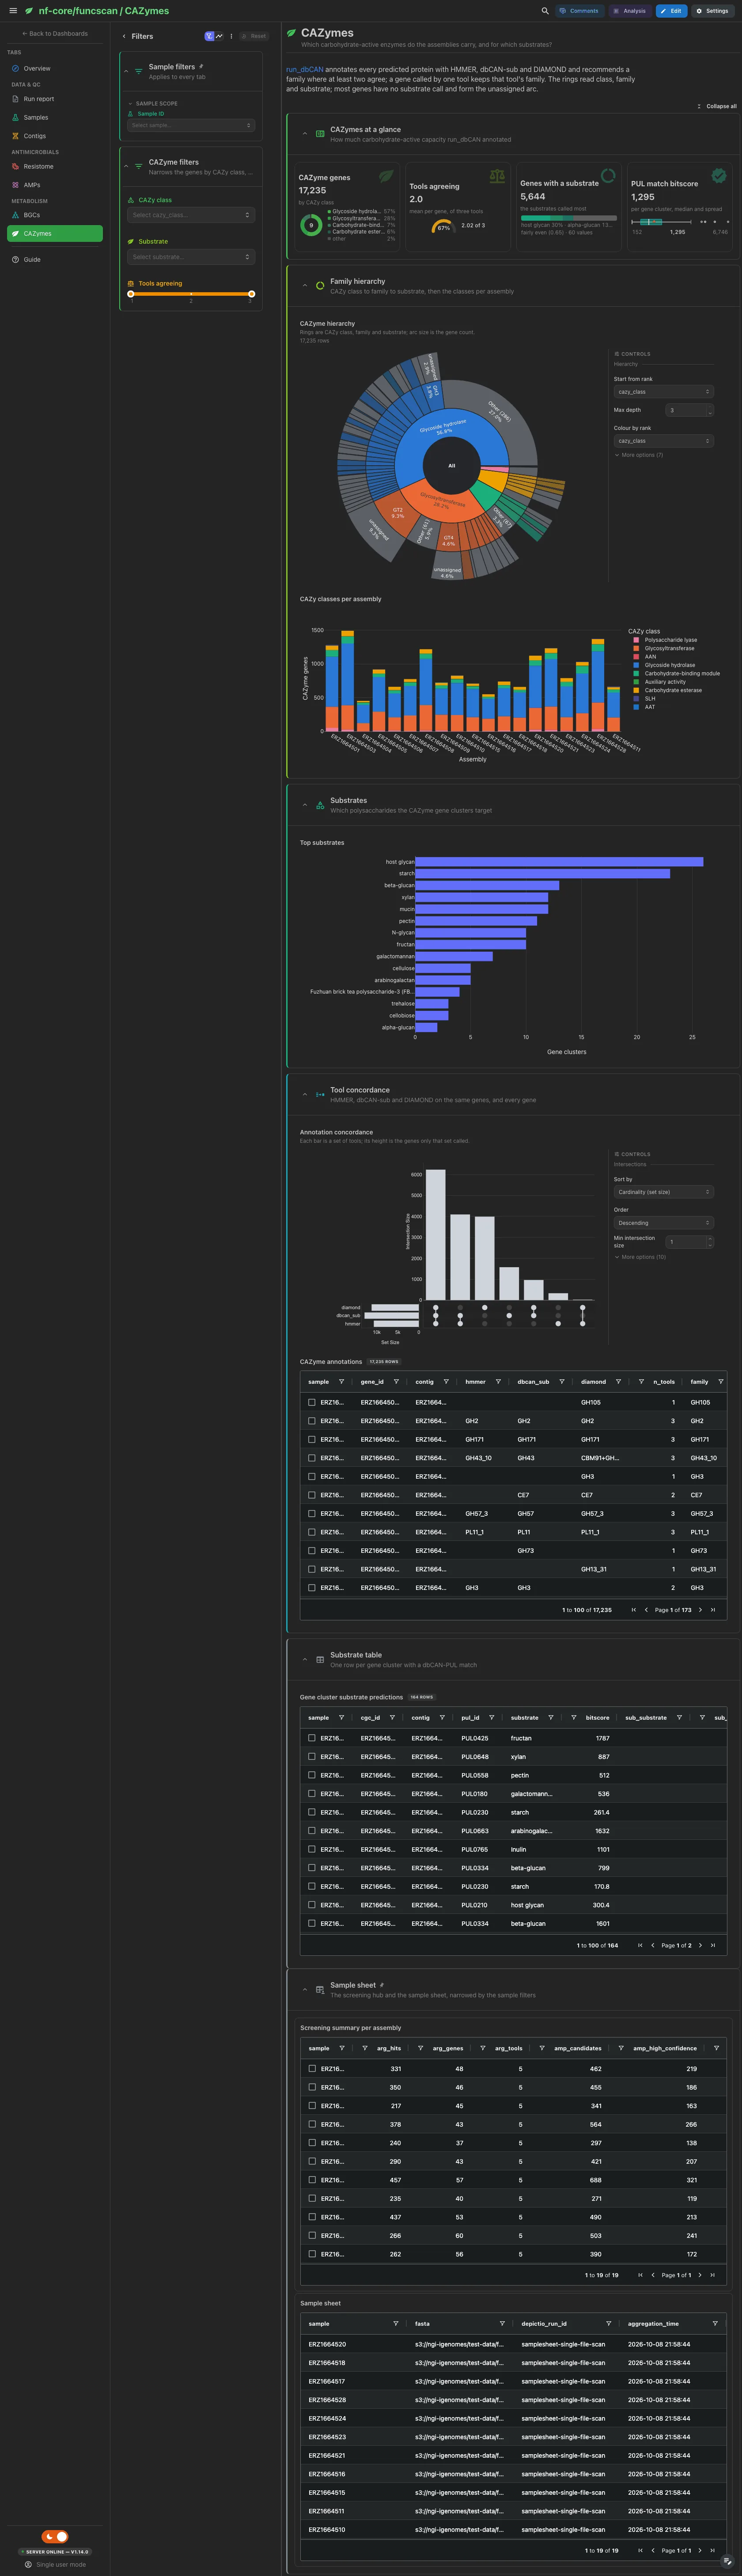
run_dbCAN annotates every protein with HMMER, dbCAN-sub and DIAMOND. The cards give the CAZyme genes, the tools agreeing, the genes with a substrate call and the dbCAN-PUL bitscore. The class to family to substrate sunburst, the CAZy classes per assembly and the top substrates follow; the annotation concordance and the tables are collapsed.
Filters and components
Filters · CAZy class, Substrate and a tools-agreeing range on
dbcan_overview.
| Section | What it holds |
|---|---|
| CAZymes at a glance | 4 cards |
| Family hierarchy | 1 advanced visualization + CAZy classes per assembly |
| Substrates | Top substrates |
| Tool concordance (collapsed) | 1 advanced visualization + CAZyme annotations |
| Substrate table (collapsed) | Gene cluster substrate predictions |
Vocabularies that do not line up
The five ARG tools, the three BGC callers and the three CAZyme annotators each report in their own terms, so every concordance panel is scored on a shared key (the contig for ARGs and BGCs, the gene for CAZymes).
Every hub selects on its own key: the screening hub on sample, the contig
tiles on contig, the resistance hits on gene_symbol, the AMP plane and
candidate table on cds_id, the peptide cluster table on cluster_id, the BGC
tiles on contig, the CAZyme gene table on family, the substrate table on
cgc_id and the versions table on tool. A pick narrows the other tiles of its
collection and follows the project links to the collections they reach. The
pinned sample sheet and the AMP embedding do not select: their collections have
no outgoing link.
Running the pipeline
Depictio reads the output of nf-core/funcscan, it does not run the pipeline. Run the pipeline first:
nextflow run nf-core/funcscan -r 4.0.0 \
  --input samplesheet.csv \
  --run_arg_screening --run_amp_screening \
  --run_bgc_screening --run_cazyme_screening \
  --outdir results -profile docker
Then point Depictio at the results:
See nf-co.re/funcscan/usage for full pipeline documentation.
Required data structure
Point depictio ingest at the directory holding the pipeline output. Depictio scans
recursively and matches on file name; only the aggregated reports below matter.
<DATA_ROOT>/
├── input/samplesheet_full.csv                     # --var SAMPLESHEET_FILE (auto-detected)
├── pipeline_info/
│   ├── params.json                                # carries the four run_*_screening flags
│   └── software_versions.yml
├── multiqc/multiqc_data/multiqc.parquet           # versions only, read by the Run report tab
├── reports/
│   ├── hamronization_summarize/
│   │   └── hamronization_combined_report.tsv      # ARG: one row per hit, five tools
│   ├── ampcombi2/
│   │   ├── Ampcombi_summary.tsv                   # AMP: candidates + physicochemistry
│   │   └── Ampcombi_summary_cluster*.tsv          # AMP: cluster assignments
│   └── combgc/
│       └── combgc_complete_summary.tsv            # BGC: run-level, every caller
└── cazyme/
    └── dbcan/
        ├── cazyme_annotation/
        │   └── <sample>/<sample>_overview.tsv     # CAZyme: per-gene family calls
        └── substrate/
            └── <sample>/<sample>_substrate_prediction.tsv
Use the run-level comBGC summary
The per-sample reports/combgc/<sample>/combgc_summary.tsv files carry the
antiSMASH branch alone, which is why the template reads
combgc_complete_summary.tsv.
Validation runs
The repository ships
download_test_data.sh,
which fetches the subset of nf-core's AWS megatest run that the template needs:
47 files and 6.5 MB, out of 3769 files and roughly 2.8 GB.
The run is
s3://nf-core-awsmegatests/funcscan/results-aee3dc965eb0c77267435544dda30da858763913/:
19 MGnify metagenome assemblies with all four screening arms enabled. Its outdir
publishes no input/ directory, so post_fetch_help in megatest.yaml gives
the curl command that puts the samplesheet under input/. Then run Depictio:
Additional resources
- nf-co.re/funcscan: official pipeline documentation
- nf-co.re/funcscan/4.0.0/results: AWS test results
- Template System Reference: YAML format, variables, conditionals
- Recipes: how to read, test, and write recipes
Authorship
 weber8thomas
Reviewing a template on your own data, or taking over a role here, is a contribution in itself: the contributing guide says what each one involves.