

The eager template follows an nf-core/eager run from raw lanes to genotypes, one question per tab, in three groups:
- Overview: the run in four key figures, live findings and four figures, each linked to the tab that explains it
- Data & QC: FastQC, AdapterRemoval and bcftools panels from the regenerated MultiQC report, every library on every tool at once, and where each sequenced read stops, from trimming and collapsing to deduplication
- Ancient DNA: how much of each extract is the target organism, how many distinct molecules each library holds, and whether the DNA is damaged and short, as ancient DNA is
- Genome: depth per contig and the depth distribution, depth and mapping quality at one locus, and the variants called per sample
The persistent Sample filters (sample, library, UDG treatment) sit in the left
panel and narrow every tab. Below them, the collapsed QC thresholds set
coverage, duplication and endogenous-DNA floors: the collections they read link
back to the library hub, so a floor narrows the hub and, through it, every tab.
The MultiQC report must be regenerated
eager 2.4.5 ships MultiQC 1.13, which writes no parquet, and Depictio reads
only multiqc.parquet (MultiQC 1.31 and later). Re-run MultiQC over the
run's own tool outputs before ingesting, or the MultiQC tab stays empty:
Copy the --input TSV under input/
eager 2.x does not publish the samplesheet it was launched with. The library
hub and the per-lane table read any input/*.tsv under the data root, so copy
the TSV there (several are concatenated, one per batch).
Optional branches appear when the run enabled them
Sex.DetERRmine, MTNucRatio, ANGSD nuclear contamination, MaltExtract and Kraken are optional collections, each bound to one table in a collapsed section: Off-target screen on Endogenous DNA, Contamination on Authentication, Sex determination on Coverage. A run that did not enable the branch ingests without it, and the import drops its table.
Quick start
The results directory is the only thing you have to pass, once the --input TSV is
copied under input/ and the MultiQC report regenerated. SHORT_FRAGMENT_BP
(default 70) sets the short-fragment cut-off the Authentication tab counts:
depictio config nextflow --install     # once per machine
nextflow run nf-core/eager -r 2.4.5 -profile docker --outdir results
No depictio ingest, and no template named: the pipeline ingests its own
output directory when it finishes and resolves this template from its own
manifest. The samplesheet copy and the MultiQC regeneration above still
apply. See Nextflow trigger.
Reference
The template reads the run's --input TSV, the regenerated MultiQC report and the
tool tables behind it: AdapterRemoval, samtools flagstat, endorS.py, Picard
MarkDuplicates, preseq, DamageProfiler, Qualimap BamQC and bcftools stats. 63 of
its 89 tiles carry a use: catalog reference, so a tile says where its panel
comes from. Every file is matched on its name, never on the per-library directory
around it.
Self-adapting layout
The dashboard adapts to whatever the run actually produced: components bound to pruned or unparsed data collections are hidden, tabs left with no real visualizations are dropped entirely, and the remaining components are re-packed so there are no empty rows.
Template variables
Variables you provide when running the template: DATA_ROOT is the results directory given to depictio ingest, the others are set with --var NAME=value:
| Variable | Required | Description |
|---|---|---|
DATA_ROOT |
✓ | Root directory containing eager output (fastqc/, adapterremoval/, samtools/, deduplication/, damageprofiler/, qualimap/, preseq/, endorspy/, bcftools/, pipeline_info/) plus the reprocessed multiqc/multiqc_data/multiqc.parquet, and the run's --input TSV under input/ (see the LAYOUT NOTE above). |
SHORT_FRAGMENT_BP |
— | Short-fragment cut-off in bp. The damageprofiler/authenticity recipe counts fragments shorter than it (column fraction_under_70bp, name kept for schema stability) and the Authentication tab names it (card title and fragment-length intro). |
Data collections
39 data collections — 34 required 5 optional · 20 direct 19 derived.
Origin tells you whether a collection is real pipeline data or a reshape of it: direct = a pipeline output (scanned, or a recipe that reads raw files); derived = a recipe that reshapes one or more direct collections into the layout a visualization needs (no new measurement). Reads shows what produces it: a recipe .py transform, whose name links to its source on GitHub, or a raw file scanned off disk. (A direct collection can still have a recipe — one that merely parses/cleans the raw file; derived means the recipe reshapes another collection.)
| Tag | Origin | Type | Reads | Status |
|---|---|---|---|---|
samples |
direct | Table | recipe nf-core/eager/samples.py |
required |
multiqc_data |
direct |  MultiQC MultiQC |
file (?:.*/)?multiqc(?:/[^/]+)?/multiqc_data/multiqc.parquet$ |
required |
adapterremoval_settings_raw |
direct | Table | file .*.settings$ |
required |
adapterremoval_settings |
derived | Table | recipe adapterremoval/settings.py |
required |
eager_lane_stats |
derived | Table | recipe nf-core/eager/lane_stats.py |
required |
samtools_flagstat_raw |
direct | Table | file .*flagstat.stats$ |
required |
samtools_flagstat |
derived | Table | recipe samtools/flagstat.py |
required |
endorspy_endogenous_raw |
direct | Table | file .*_endogenous_dna(?:_mqc)?.json$ |
required |
endorspy_endogenous |
derived | Table | recipe endorspy/endogenous.py |
required |
picard_markduplicates_metrics_raw |
direct | Table | file .*.metrics(?:.txt)?$ |
required |
picard_markduplicates_metrics |
derived | Table | recipe picard/markduplicates_metrics.py |
required |
eager_read_fate |
derived | Table | recipe nf-core/eager/read_fate.py |
required |
qualimap_bamqc_genome_results_raw |
direct | Table | file genome_results.txt$ |
required |
qualimap_bamqc_genome_results |
derived | Table | recipe qualimap/bamqc_genome_results.py |
required |
qualimap_coverage_per_contig |
derived | Table | recipe qualimap/coverage_per_contig.py |
required |
qualimap_coverage_across_reference_raw |
direct | Table | file .*coverage_across_reference.txt$ |
required |
qualimap_coverage_across_reference |
derived | Table | recipe qualimap/coverage_across_reference.py |
required |
qualimap_mapq_across_reference_raw |
direct | Table | file .*mapping_quality_across_reference.txt$ |
required |
qualimap_mapq_across_reference |
derived | Table | recipe nf-core/eager/mapq_across_reference.py |
required |
qualimap_coverage_histogram_raw |
direct | Table | file .*coverage_histogram.txt$ |
required |
qualimap_coverage_histogram |
derived | Table | recipe qualimap/coverage_histogram.py |
required |
qualimap_genome_fraction_coverage_raw |
direct | Table | file .*genome_fraction_coverage.txt$ |
required |
qualimap_genome_fraction_coverage |
derived | Table | recipe qualimap/genome_fraction_coverage.py |
required |
preseq_ccurve_raw |
direct | Table | file .*.filtered.preseq$ |
required |
preseq_complexity_curve |
derived | Table | recipe nf-core/eager/complexity_curve.py |
required |
damageprofiler_misincorporation_raw |
direct | Table | file .*_freq_misincorporations.txt$ |
required |
damageprofiler_misincorporation |
derived | Table | recipe damageprofiler/misincorporation.py |
required |
damageprofiler_lgdistribution_raw |
direct | Table | file .*lgdistribution.txt$ |
required |
damageprofiler_lgdistribution |
derived | Table | recipe damageprofiler/lgdistribution.py |
required |
damageprofiler_authenticity |
derived | Table | recipe damageprofiler/authenticity.py |
required |
eager_library_qc |
derived | Table | recipe nf-core/eager/library_qc.py |
required |
bcftools_stats_raw |
direct | Table | file .*.(?:vcf.stats|bcftools_stats.txt)$ |
required |
bcftools_stats_summary |
derived | Table | recipe bcftools/stats_summary.py |
required |
bcftools_stats_tstv |
derived | Table | recipe bcftools/stats_tstv.py |
required |
sexdeterrmine |
direct | Table | file .*(?:SexDet|sexdeterrmine).tsv$ |
optional |
mtnucratio |
direct | Table | file .*.mtnucratio(?:.json)?$ |
optional |
nuclear_contamination |
direct | Table | file .*nuclear_contamination(?:_mqc)?.txt$ |
optional |
maltextract_heatmap |
direct | Table | file .*heatmap_overview_Wevid.tsv$ |
optional |
kraken_report |
direct | Table | file .*kraken(?:_merged_report|_parsed)?.(?:csv|tsv)$ |
optional |
Cross-DC links
26 links — selecting a value in the source collection filters the target. The join column is shown after the source.
| Source · column | Target | Filters | |
|---|---|---|---|
samples · sample_id |
→ | multiqc_data |
Filter the MultiQC panels by the libraries picked in the left panel |
samples · sample_id |
→ | preseq_complexity_curve |
Filter the complexity curves by the libraries picked in the left panel |
samples · sample_id |
→ | samtools_flagstat |
Filter the flagstat table by the libraries picked in the left panel |
samples · sample_id |
→ | qualimap_bamqc_genome_results |
Filter the coverage table by the libraries picked in the left panel |
samples · sample_id |
→ | qualimap_coverage_per_contig |
Filter the per-contig depth table by the libraries picked in the left panel |
samples · sample_id |
→ | qualimap_coverage_across_reference |
Filter the coverage track by the libraries picked in the left panel |
samples · sample_id |
→ | qualimap_coverage_histogram |
Filter the depth histogram by the libraries picked in the left panel |
samples · sample_id |
→ | qualimap_genome_fraction_coverage |
Filter the cumulative coverage curve by the libraries picked in the left panel |
samples · sample_id |
→ | damageprofiler_misincorporation |
Filter the damage profile by the libraries picked in the left panel |
samples · sample_id |
→ | damageprofiler_lgdistribution |
Filter the fragment length profile by the libraries picked in the left panel |
samples · sample_id |
→ | damageprofiler_authenticity |
Filter the authenticity plane by the libraries picked in the left panel |
samples · sample_id |
→ | endorspy_endogenous |
Filter the endogenous DNA tiles by the libraries picked in the left panel |
samples · sample_id |
→ | picard_markduplicates_metrics |
Filter the duplication metrics by the libraries picked in the left panel |
samples · sample_id |
→ | eager_lane_stats |
Filter the per-lane trimming table by the libraries picked in the left panel |
samples · sample_id |
→ | eager_read_fate |
Filter the read-fate flow by the libraries picked in the left panel |
samples · sample_name |
→ | bcftools_stats_summary |
Filter the variant counts by the biological samples behind the libraries picked in the left panel |
samples · sample_name |
→ | bcftools_stats_tstv |
Filter the Ts to Tv ratio by the biological samples behind the libraries picked in the left panel |
damageprofiler_misincorporation · sample |
→ | qualimap_bamqc_genome_results |
Carry a library selected on the damage profile over to its coverage row |
damageprofiler_misincorporation · sample |
→ | preseq_complexity_curve |
Carry a library selected on the damage profile over to its complexity curve |
damageprofiler_authenticity · sample |
→ | damageprofiler_lgdistribution |
Carry a library selected on the authenticity plane over to its full length profile |
endorspy_endogenous · sample |
→ | samtools_flagstat |
Carry a library selected on the endogenous DNA tiles over to its flagstat rows |
qualimap_bamqc_genome_results · sample |
→ | samples |
Carry a coverage or duplication floor to the library hub, and through it to every tab |
endorspy_endogenous · sample |
→ | samples |
Carry an endogenous-DNA floor to the library hub, and through it to every tab |
samples · sample_id |
→ | eager_library_qc |
Filter the per-library QC profile by the libraries picked in the left panel |
samples · sample_id |
→ | qualimap_mapq_across_reference |
Filter the mapping-quality track by the libraries picked in the left panel |
qualimap_coverage_across_reference · chromosome |
→ | qualimap_mapq_across_reference |
A region brushed or typed on the depth navigator narrows the mapping-quality track |
Recipes
Each recipe reshapes raw pipeline output into a tidy table. The name links to its source; Output lists the validated OUTPUT_SCHEMA columns.
| Recipe | Transforms | Output |
|---|---|---|
adapterremoval/settings.py |
Trimming and collapsing statistics from an AdapterRemoval settings report. | sample, total_read_pairs, total_reads, well_aligned_read_pairs, unaligned_read_pairs, discarded_reads, singleton_reads, collapsed_pairs, truncated_collapsed_pairs, retained_reads, retained_nucleotides, average_retained_length, collapse_rate, discard_rate |
bcftools/stats_summary.py |
Per-sample, per-caller variant record counts from bcftools stats. |
sample, caller, n_records, n_no_alts, n_snps, n_mnps, n_indels, n_others, n_multiallelic_sites, n_multiallelic_snp_sites, snp_fraction, log10_n_records |
bcftools/stats_tstv.py |
Per-sample, per-caller transition/transversion ratio from bcftools stats. |
sample, caller, ts, tv, ts_tv, ts_1st_alt, tv_1st_alt, ts_tv_1st_alt |
damageprofiler/authenticity.py |
The ancient-DNA authenticity plane: terminal deamination against fragment length. | sample, ct_5p_first, ga_3p_first, terminal_damage, background, mean_length, median_length, fraction_under_70bp, n_reads |
damageprofiler/lgdistribution.py |
Fragment-length distribution of a mapped library, from DamageProfiler. | sample, strand, series, length, occurrences, fraction |
damageprofiler/misincorporation.py |
Ancient-DNA misincorporation frequency by position, both read ends, one row | sample, end, position, base_change, frequency |
endorspy/endogenous.py |
Endogenous DNA percentage per library, from endorS.py's MultiQC custom content. | sample, endogenous_dna, endogenous_dna_post, endogenous_dna_loss, off_target_pct |
nf-core/eager/complexity_curve.py |
eager-local override of depictio/catalog/preseq/complexity_curve.py. |
sample, total_reads, expected_distinct, lower_ci, upper_ci, ci_width |
nf-core/eager/lane_stats.py |
One row per sequencing LANE, joining AdapterRemoval's report to the samplesheet. | lane_id, sample_id, sample_name, lane, run_accession, seq_type, strandedness, total_read_pairs, total_reads, discarded_reads, collapsed_pairs, retained_reads, retained_nucleotides, average_retained_length, collapse_rate, discard_rate |
nf-core/eager/library_qc.py |
One row per library pooling the numbers an ancient-DNA library is judged on. | sample, endogenous_dna, endogenous_dna_post, clonality_pct, mean_coverage, mean_mapping_quality, error_rate_pct, gc_percentage, ct_5p_first_pct, mean_length |
nf-core/eager/mapq_across_reference.py |
Mapping quality along the reference, from Qualimap BamQC's windowed table. | sample, chromosome, position, mapping_quality, global_position |
nf-core/eager/read_fate.py |
Where every sequenced read of a library ends up, as a flow of read counts. | sample, step_sequencing, step_trimming, step_mapping, step_filtering, step_duplication, reads |
nf-core/eager/samples.py |
One row per eager LIBRARY, from the TSV samplesheet the run was launched with. | sample_id, sample_name, organism, seq_type, udg_treatment, n_lanes, lane_ids |
picard/markduplicates_metrics.py |
Duplication metrics from a Picard MarkDuplicates report. | sample, library, unpaired_reads_examined, read_pairs_examined, unmapped_reads, unpaired_read_duplicates, read_pair_duplicates, read_pair_optical_duplicates, duplicate_reads, reads_after_dedup, percent_duplication, estimated_library_size |
qualimap/bamqc_genome_results.py |
One row per sample from a Qualimap BamQC genome_results.txt report. |
sample, total_reads, mapped_reads, percentage_aligned, mean_coverage, mean_mapping_quality, general_error_rate, gc_percentage, duplication_rate |
qualimap/coverage_across_reference.py |
Read depth along the reference, from Qualimap BamQC's own windowed table. | sample, chromosome, position, coverage, coverage_std, global_position |
qualimap/coverage_histogram.py |
How many bases of the reference sit at each depth, from Qualimap BamQC. | sample, coverage, n_genomic_locations, fraction |
qualimap/coverage_per_contig.py |
Per-contig depth, from the Coverage per contig block of genome_results.txt. |
sample, chromosome, length, mapped_bases, mean_coverage, coverage_std, relative_coverage |
qualimap/genome_fraction_coverage.py |
What share of the reference is covered at least X deep, from Qualimap BamQC. | sample, min_coverage, genome_fraction_pct |
samtools/flagstat.py |
One row per (sample, filter stage) from a samtools flagstat report. |
sample, stage, total_reads, mapped_reads, mapped_pct, duplicate_reads, properly_paired_reads, properly_paired_pct, singleton_pct |
Dashboard tabs
One dashboard: the Overview, then nine child tabs in three groups, read as a funnel from the reads to the genotypes called from an ancient extract. Each tab below carries the same icon and colour the dashboard gives it, so the page and the app read alike.
| Group | Tabs |
|---|---|
| Data & QC | MultiQC, Libraries, Read fate |
| Ancient DNA | Endogenous DNA, Complexity, Authentication |
| Genome | Coverage, Locus, Genotypes |
Each child tab opens with a short intro and, except on MultiQC, a strip of four
cards, then at most three open sections; tables, record cards and the optional
branches follow, collapsed. The template has no group column: the library hub
(samples) is one row per eager library, and the biological sample plays the
group's part. The persistent Sample filters (sample, library, UDG treatment)
sit in the left panel and narrow every tab through the project links. The
persistent QC thresholds, collapsed below them, filter the Qualimap BamQC
summary (mean coverage, duplication rate) and endorS.py (endogenous DNA); both
collections link back to the hub, so a floor narrows the hub and the hub fans the
surviving libraries out. The Sample sheet (the library hub) and Reference
tables (the BamQC summary the thresholds read) are pinned, collapsed, to the
bottom of every child tab.
Ancient DNA, from the reads to authentication, coverage and genotypes.
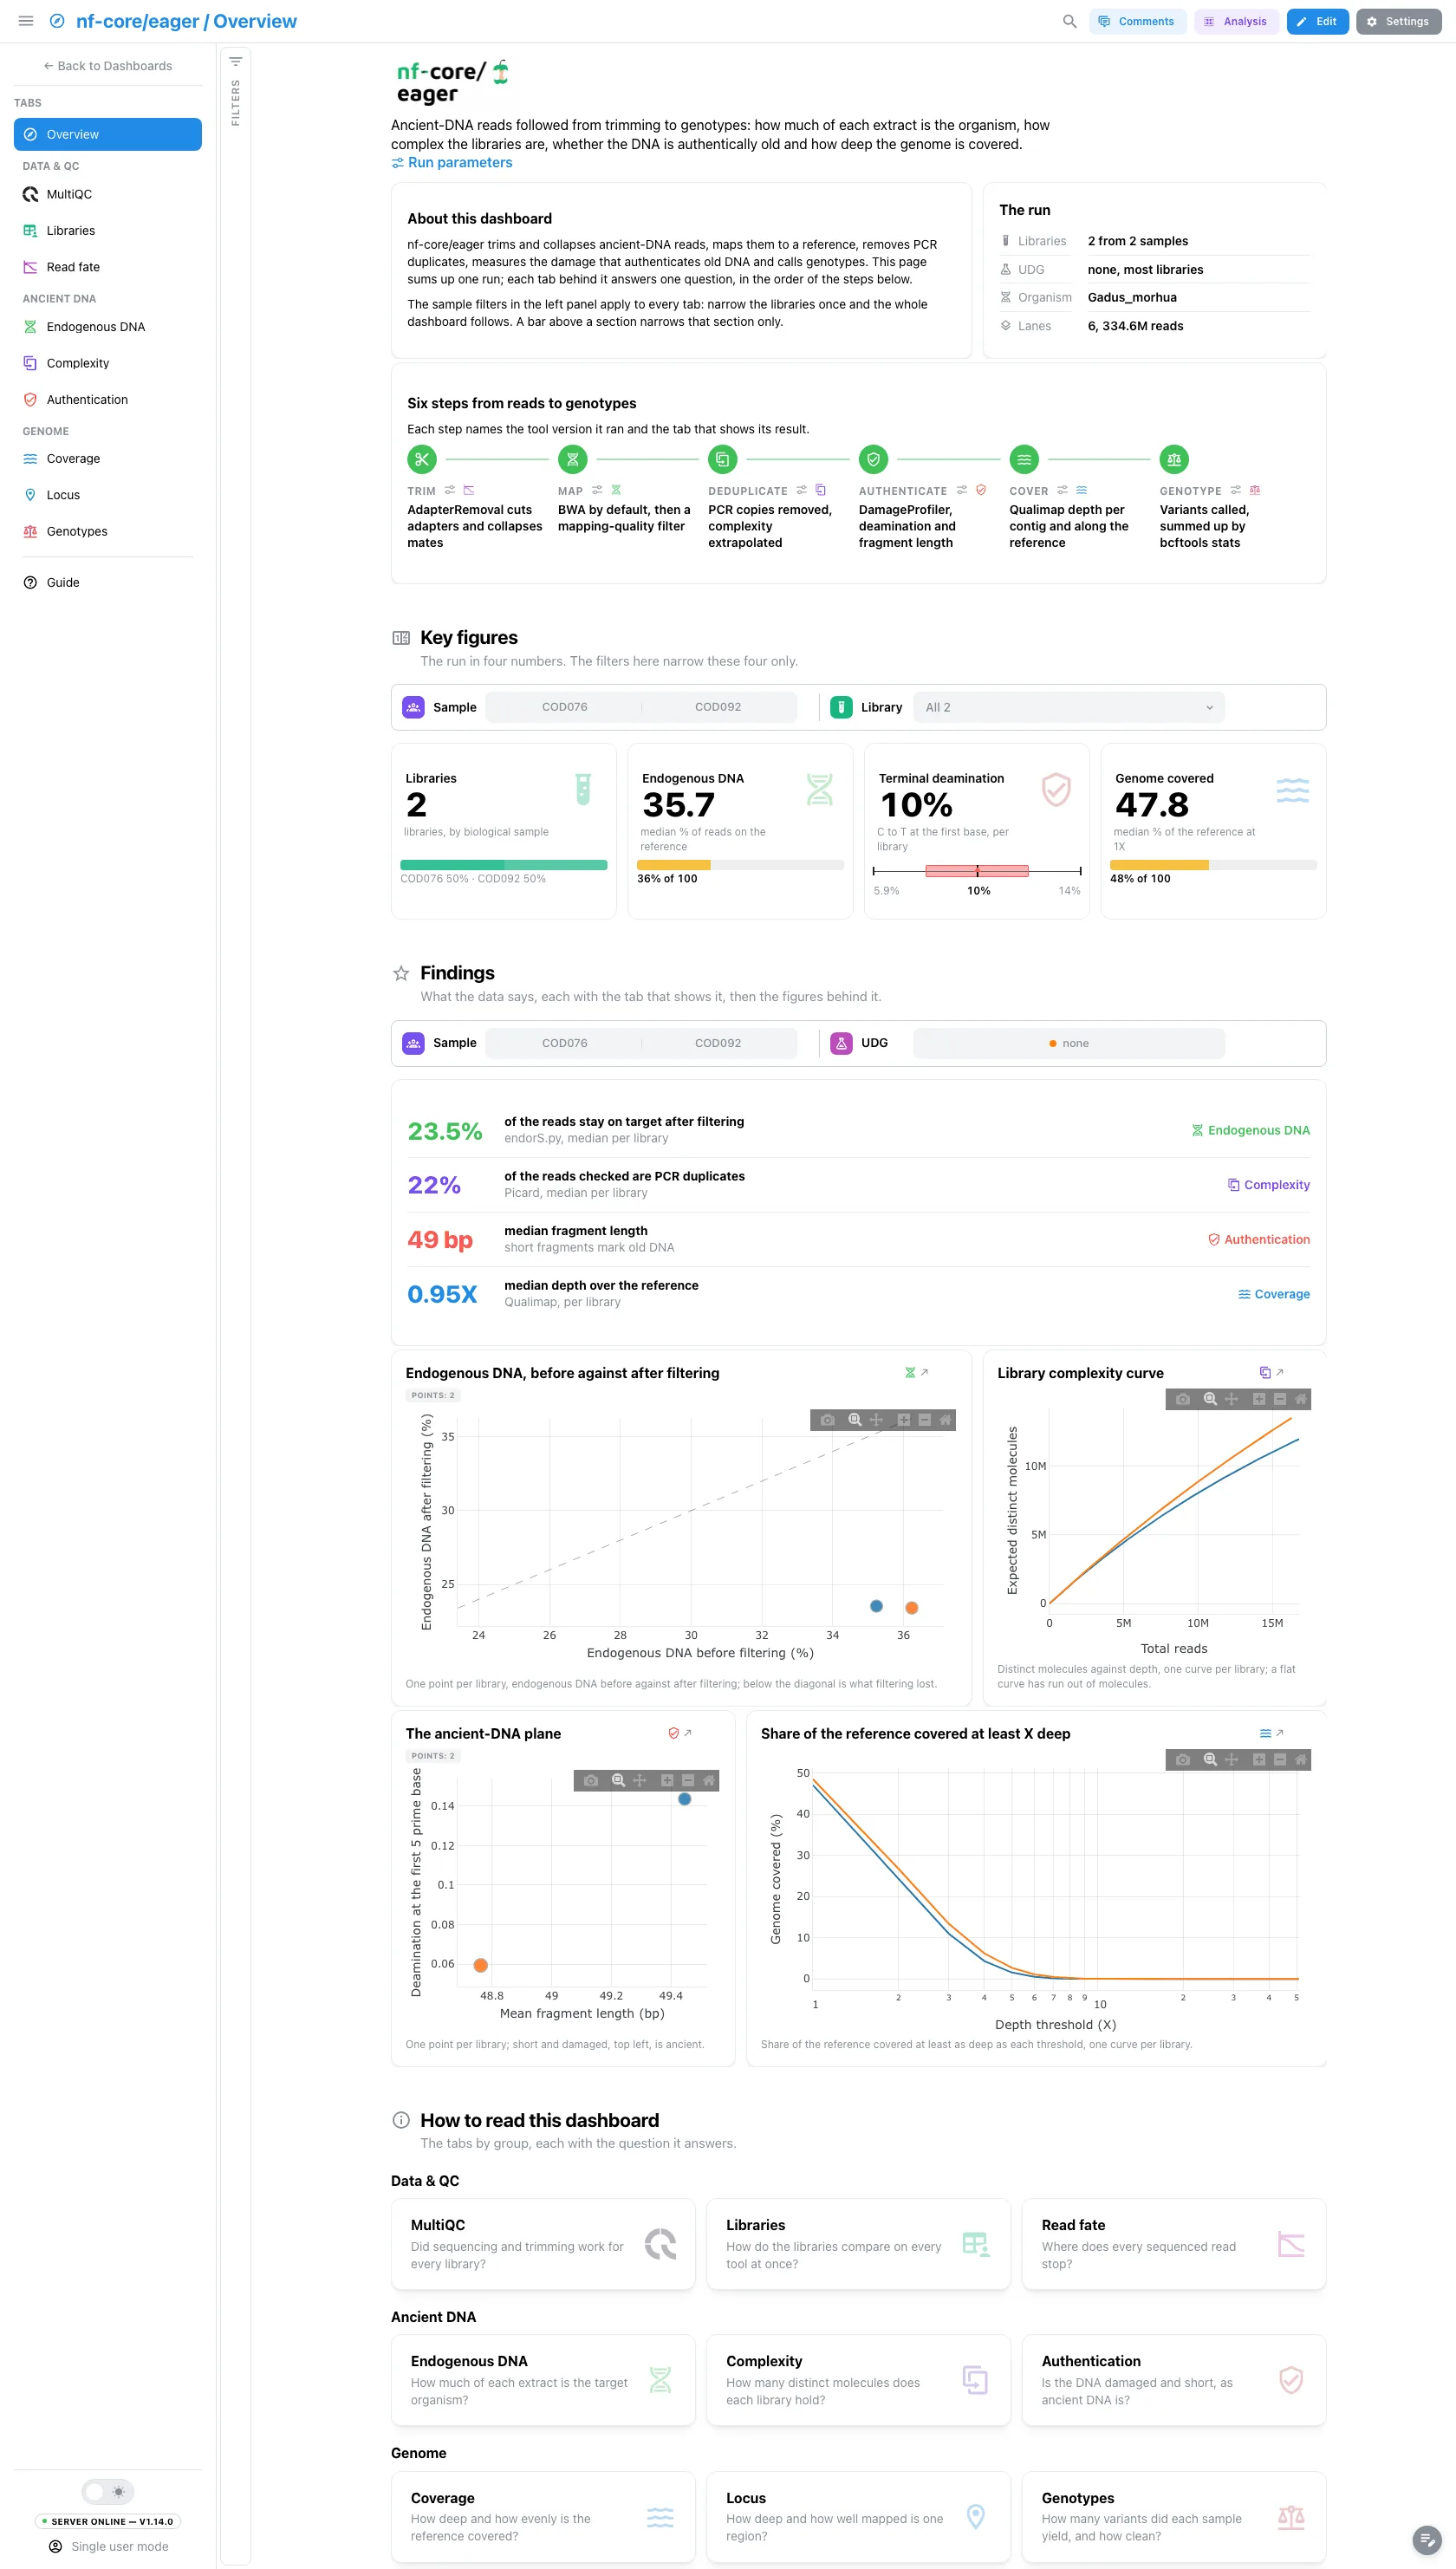
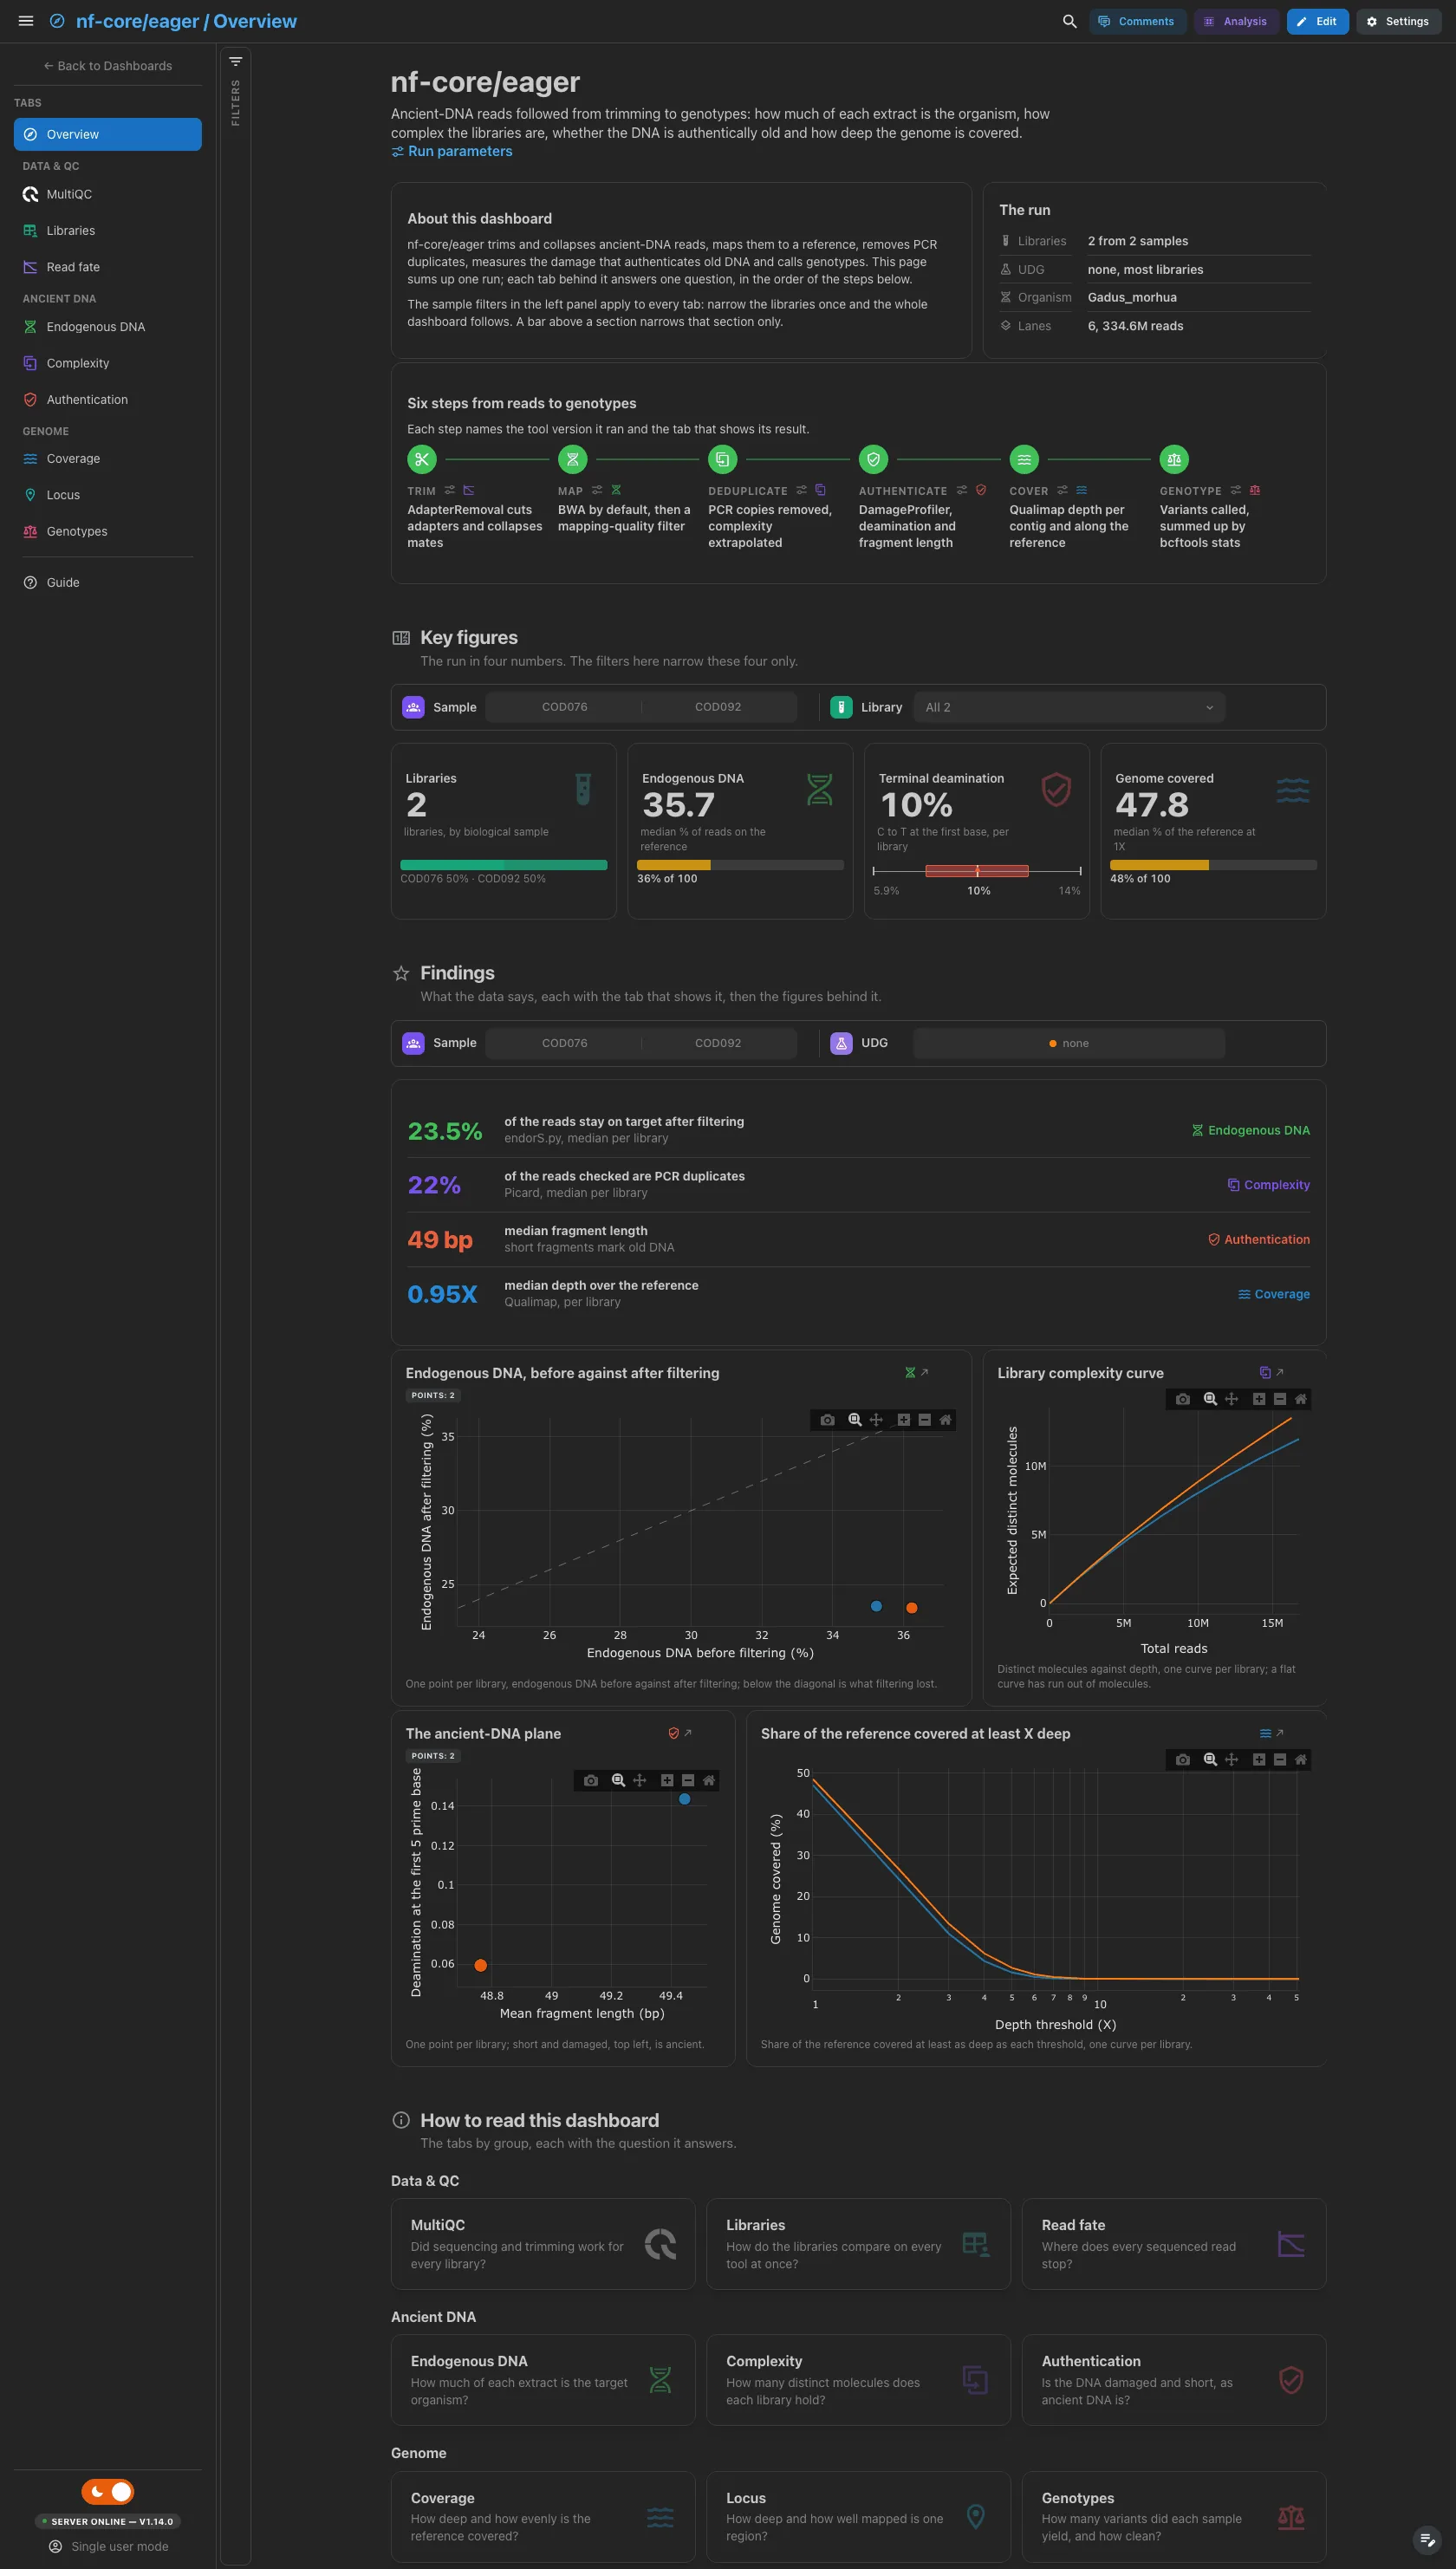
A short hero links the run's provenance: eager 2.4.5 writes no params.json,
so the dialog lists the software versions the run recorded. About this
dashboard says how the two filter levels work, The run lists facts read
from the run's tables (libraries and samples, the most common UDG treatment,
the organism, the lanes and reads sequenced), and Pipeline walks the six
steps from trimming to genotyping, each linked to the version of its tool and
to its tab. The findings are live values: they follow the filters. Each figure
draws one point or curve per library, so its legend is hidden and the caption
says what the colour is.
Filters and components
Filters · the left panel starts collapsed. Key figures has its own filter bar (sample and library), and Findings another (sample and UDG treatment): each narrows its own section only.
| Section | What it holds |
|---|---|
| Top | Hero, About this dashboard, The run, Pipeline |
| Key figures | 4 headline cards: libraries by sample, endogenous DNA, C to T at the first base, genome covered at 1X |
| Findings | Live result rows, then 4 figures: endogenous DNA before against after filtering, the preseq complexity curves, the ancient-DNA plane and the genome fraction curves |
| How to read this dashboard | The tabs by group, each with its question |
Data & QC · Did sequencing and trimming work for every library?
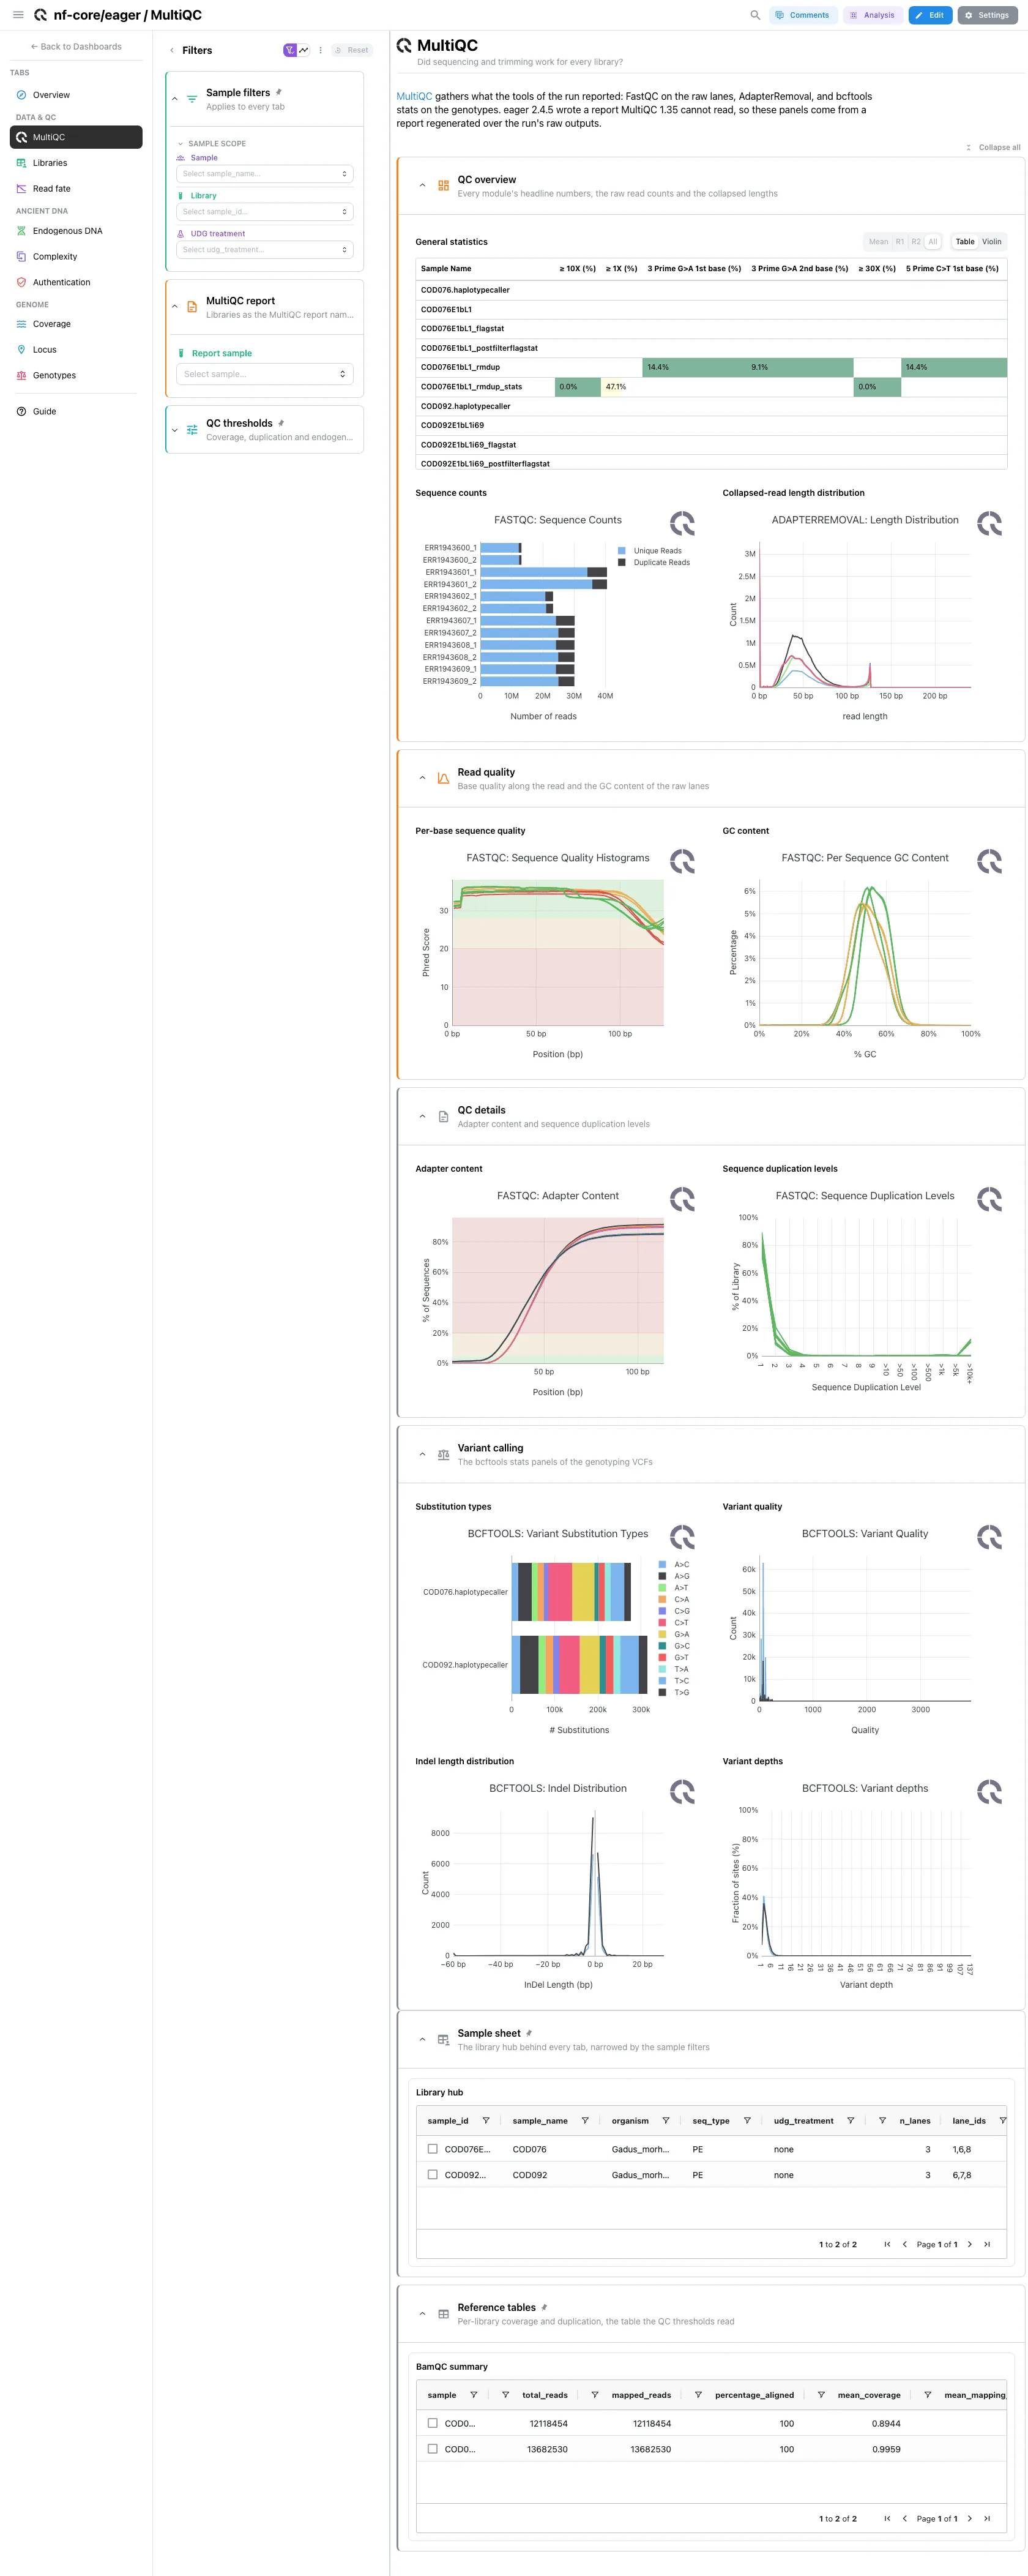
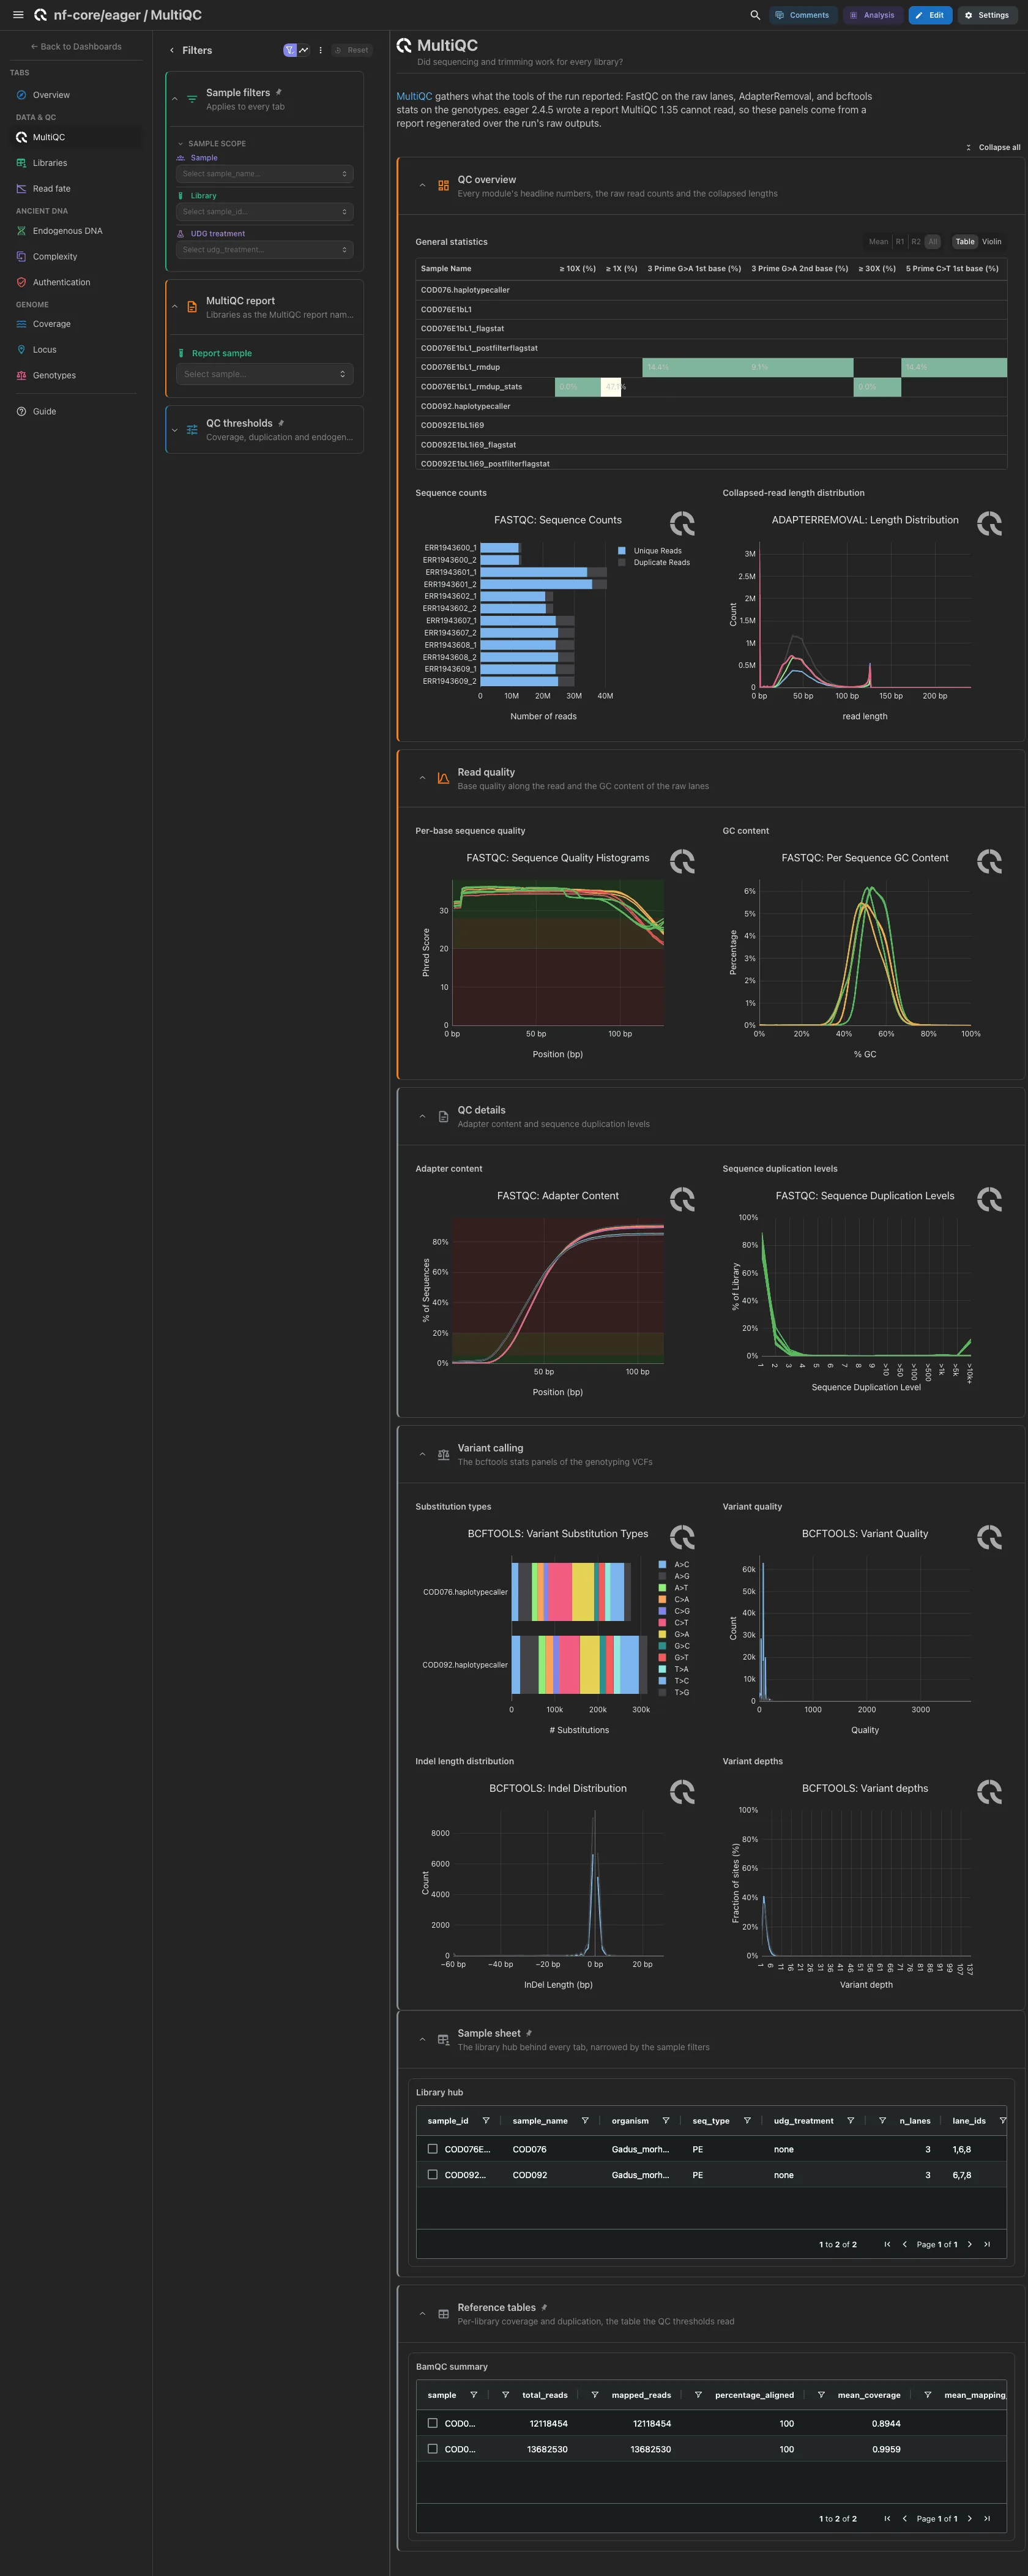
MultiQC panels only, from the regenerated report, and only those no tile redraws from a tool table: flagstat, Picard, preseq, DamageProfiler and Qualimap are left to their tiles. Open: general statistics (endorS.py's endogenous DNA included), FastQC sequence counts and the AdapterRemoval collapsed-read length, then per-base quality and GC content. Adapter content and duplication levels, and the four bcftools panels (substitution types, quality, indel lengths, depths), are collapsed.
Filters and components
Filters · Report sample on multiqc_data, the sample as the report
names it.
| Section | What it holds |
|---|---|
| QC overview | 3 MultiQC panels |
| Read quality | 2 MultiQC panels |
| QC details (collapsed) | 2 MultiQC panels |
| Variant calling (collapsed) | 4 MultiQC panels |
Data & QC · How do the libraries compare on every tool at once?
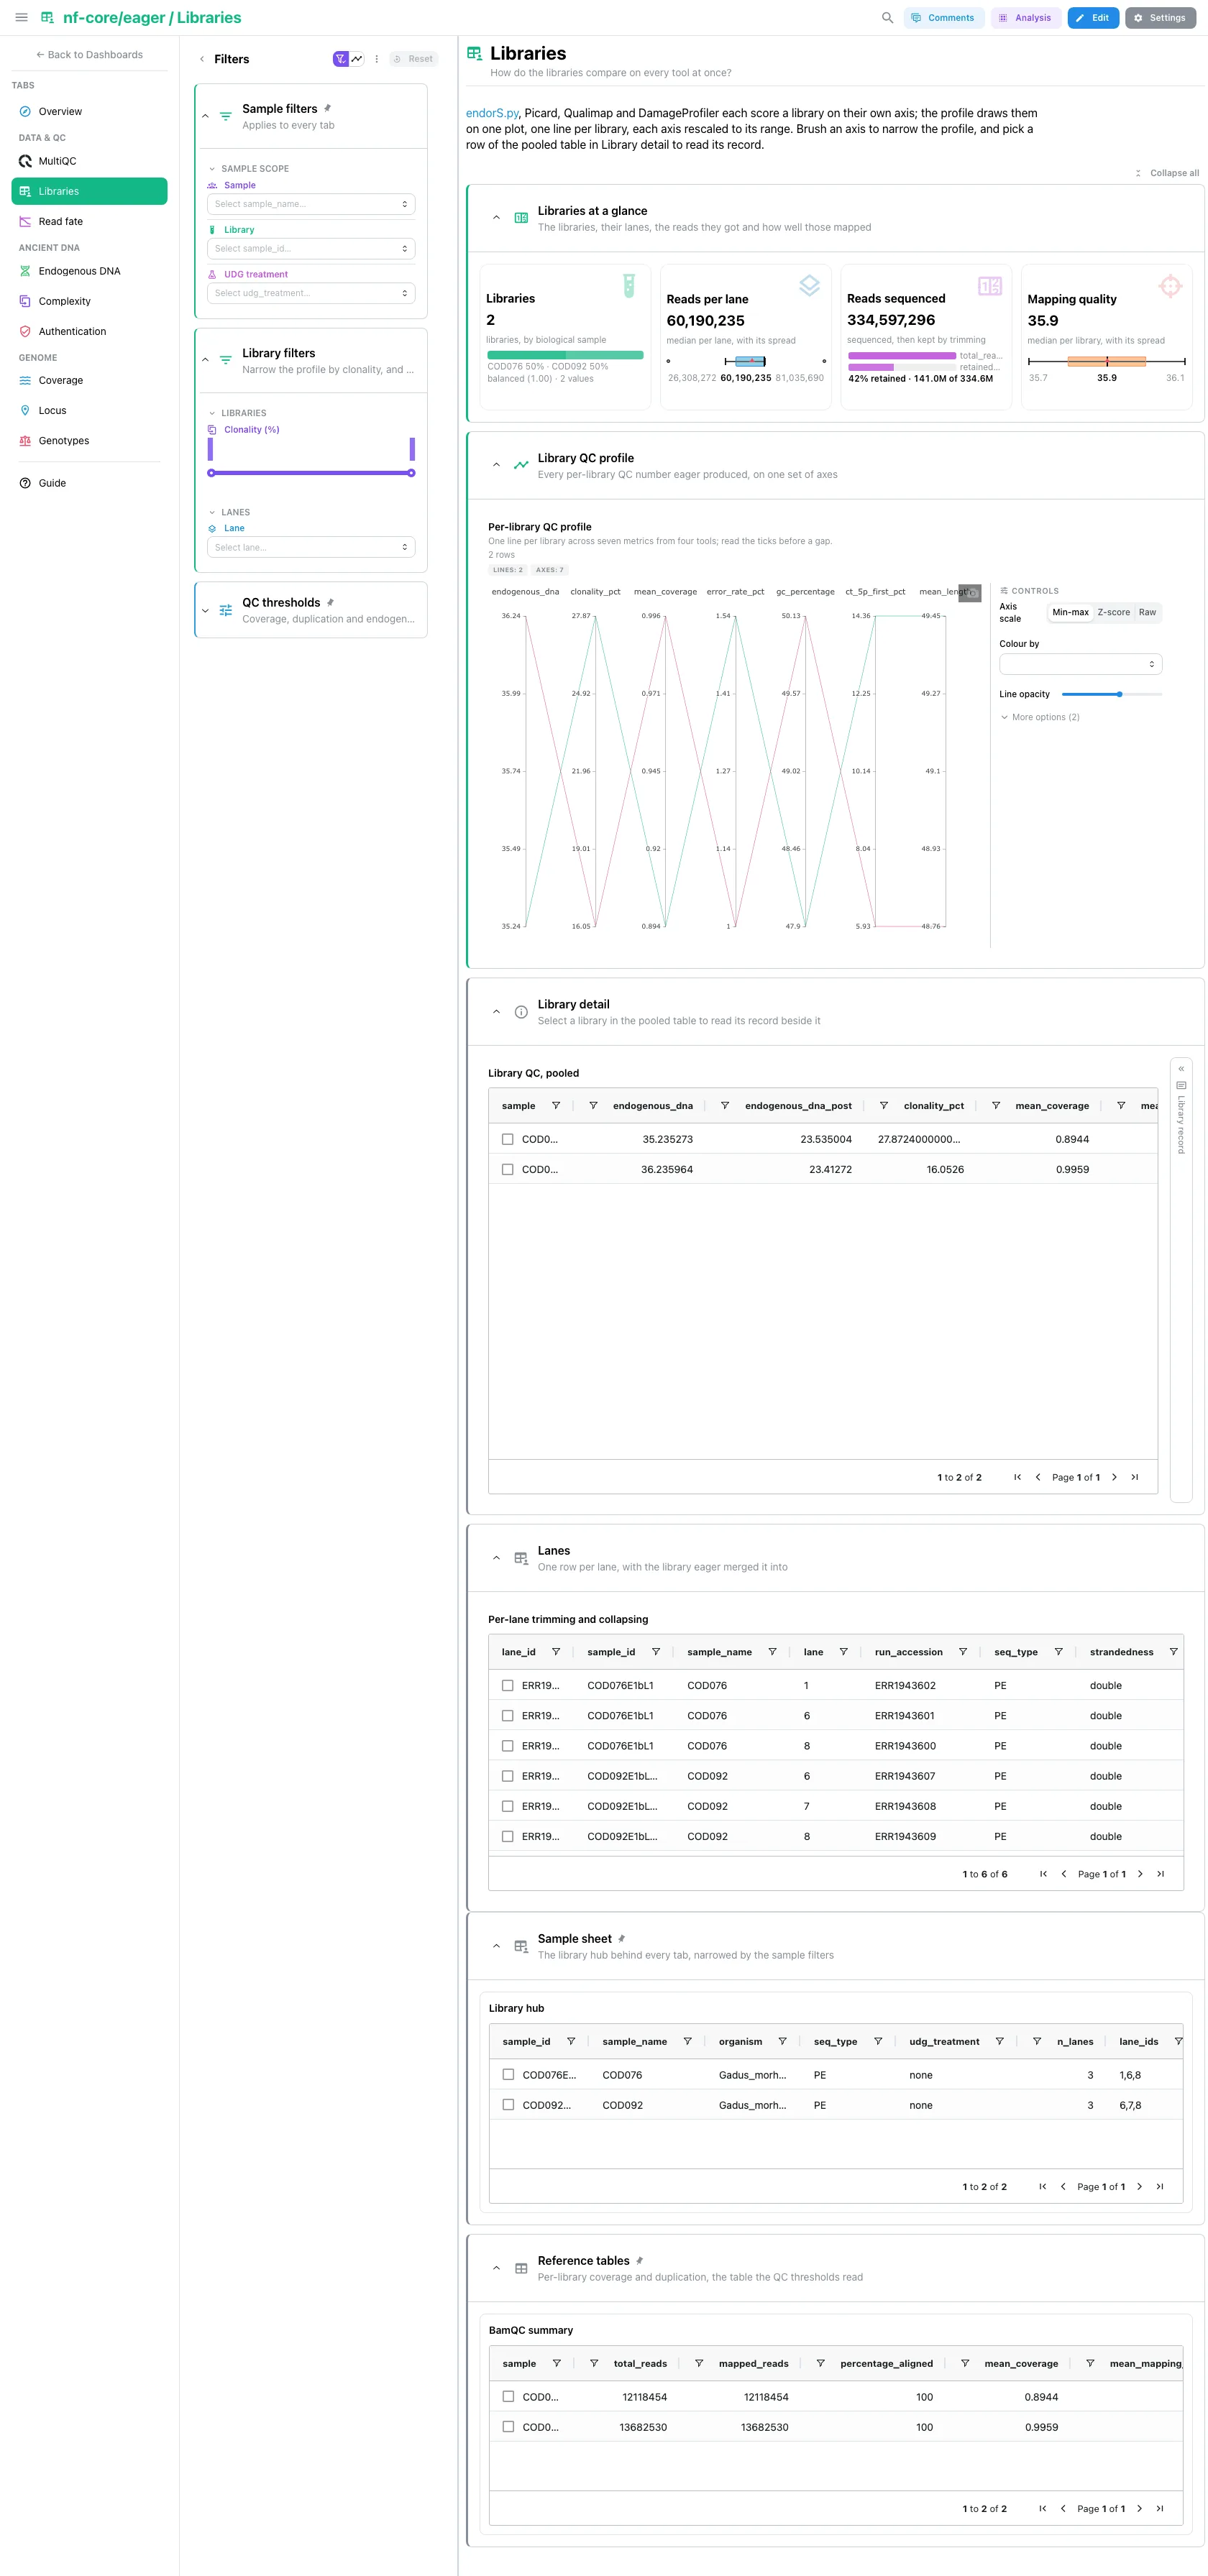
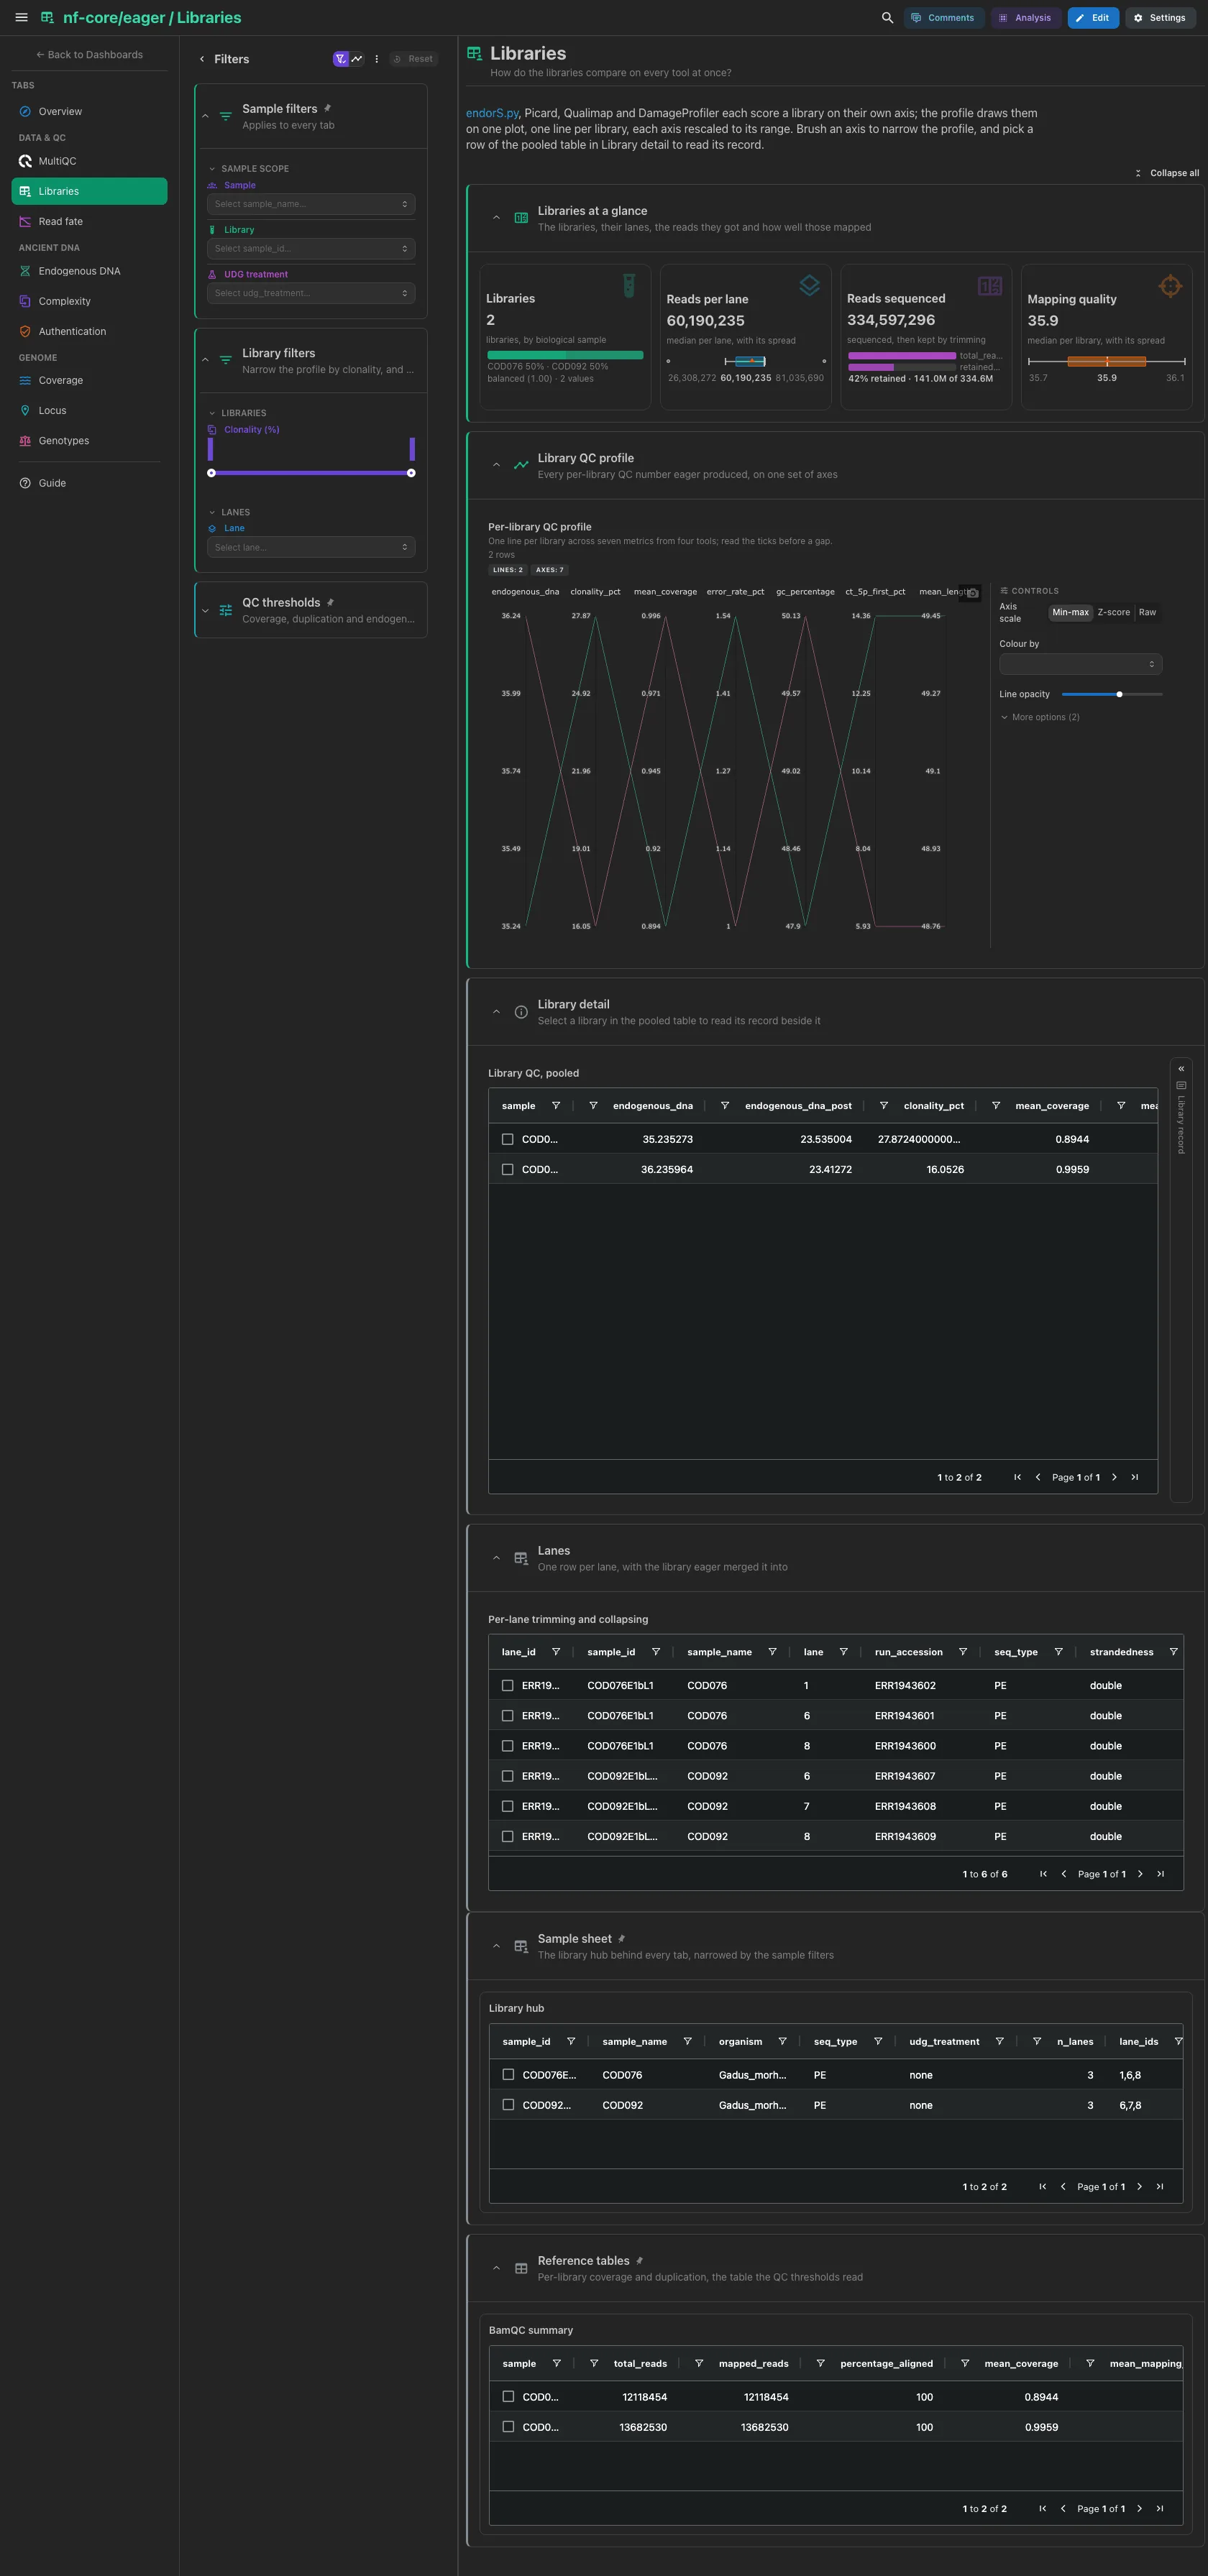
Libraries split by sample, the reads per lane, the reads sequenced (a funnel to
the reads AdapterRemoval kept) and the mapping quality. Then the per-library QC
profile: the pipeline-local eager/library_qc.py recipe joins endorS.py,
Picard, Qualimap and DamageProfiler on the library id, and a
parallel-coordinates tile draws one line per library across seven axes, each
rescaled to its range. Brush an axis to narrow the profile. Collapsed: the
pooled table with the record of the row you pick beside it, and the per-lane
AdapterRemoval table.
Filters and components
Filters · a Clonality (%) range on eager_library_qc and Lane on
eager_lane_stats.
| Section | What it holds |
|---|---|
| Libraries at a glance | 4 cards |
| Library QC profile | 1 advanced visualization |
| Library detail (collapsed) | Library QC, pooled + a library record card |
| Lanes (collapsed) | Per-lane trimming and collapsing |
Data & QC · Where does every sequenced read stop?
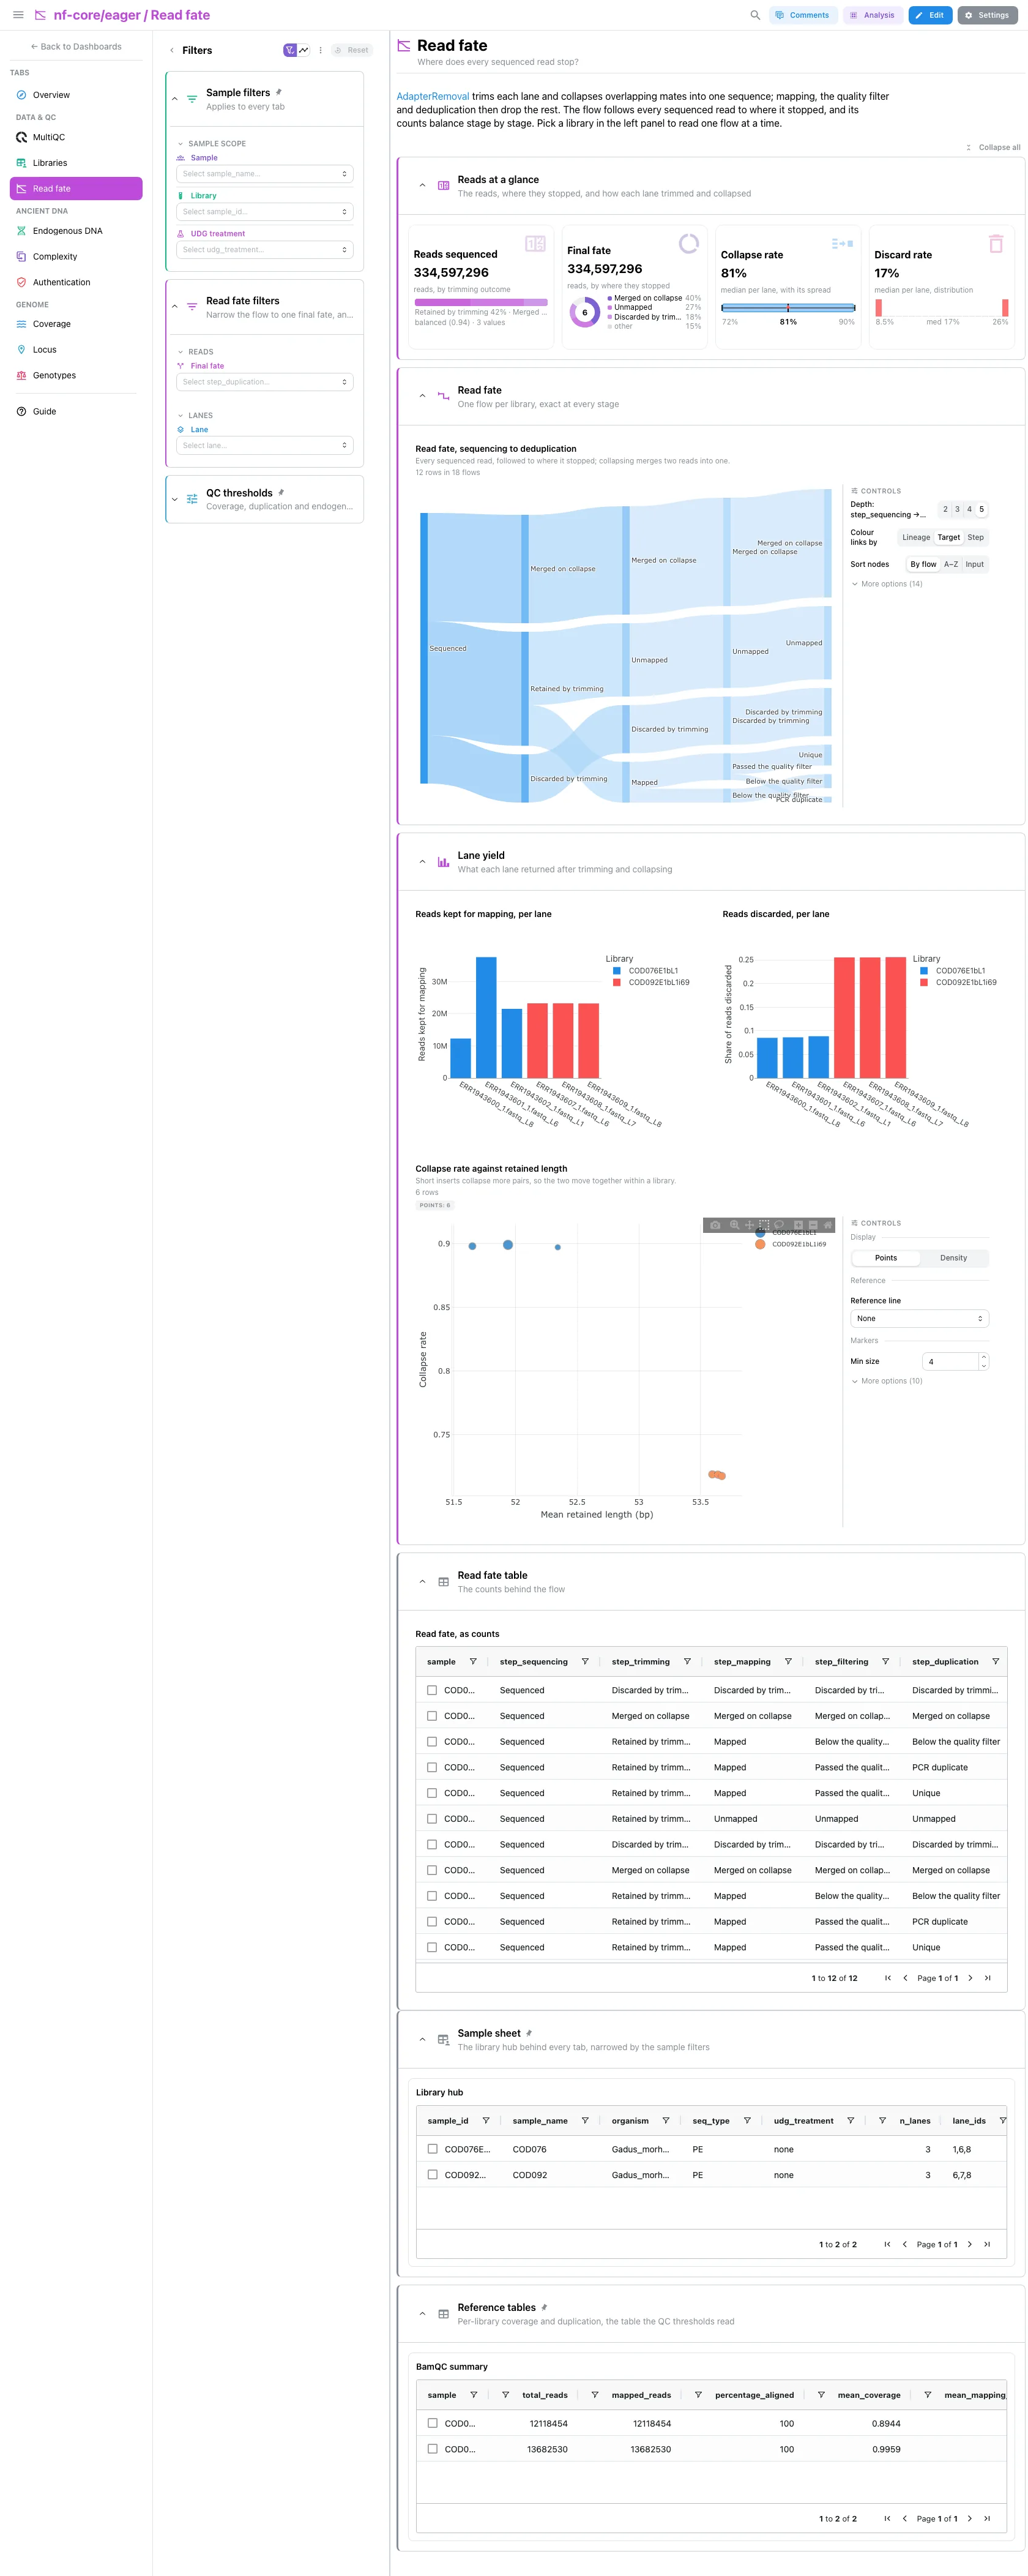
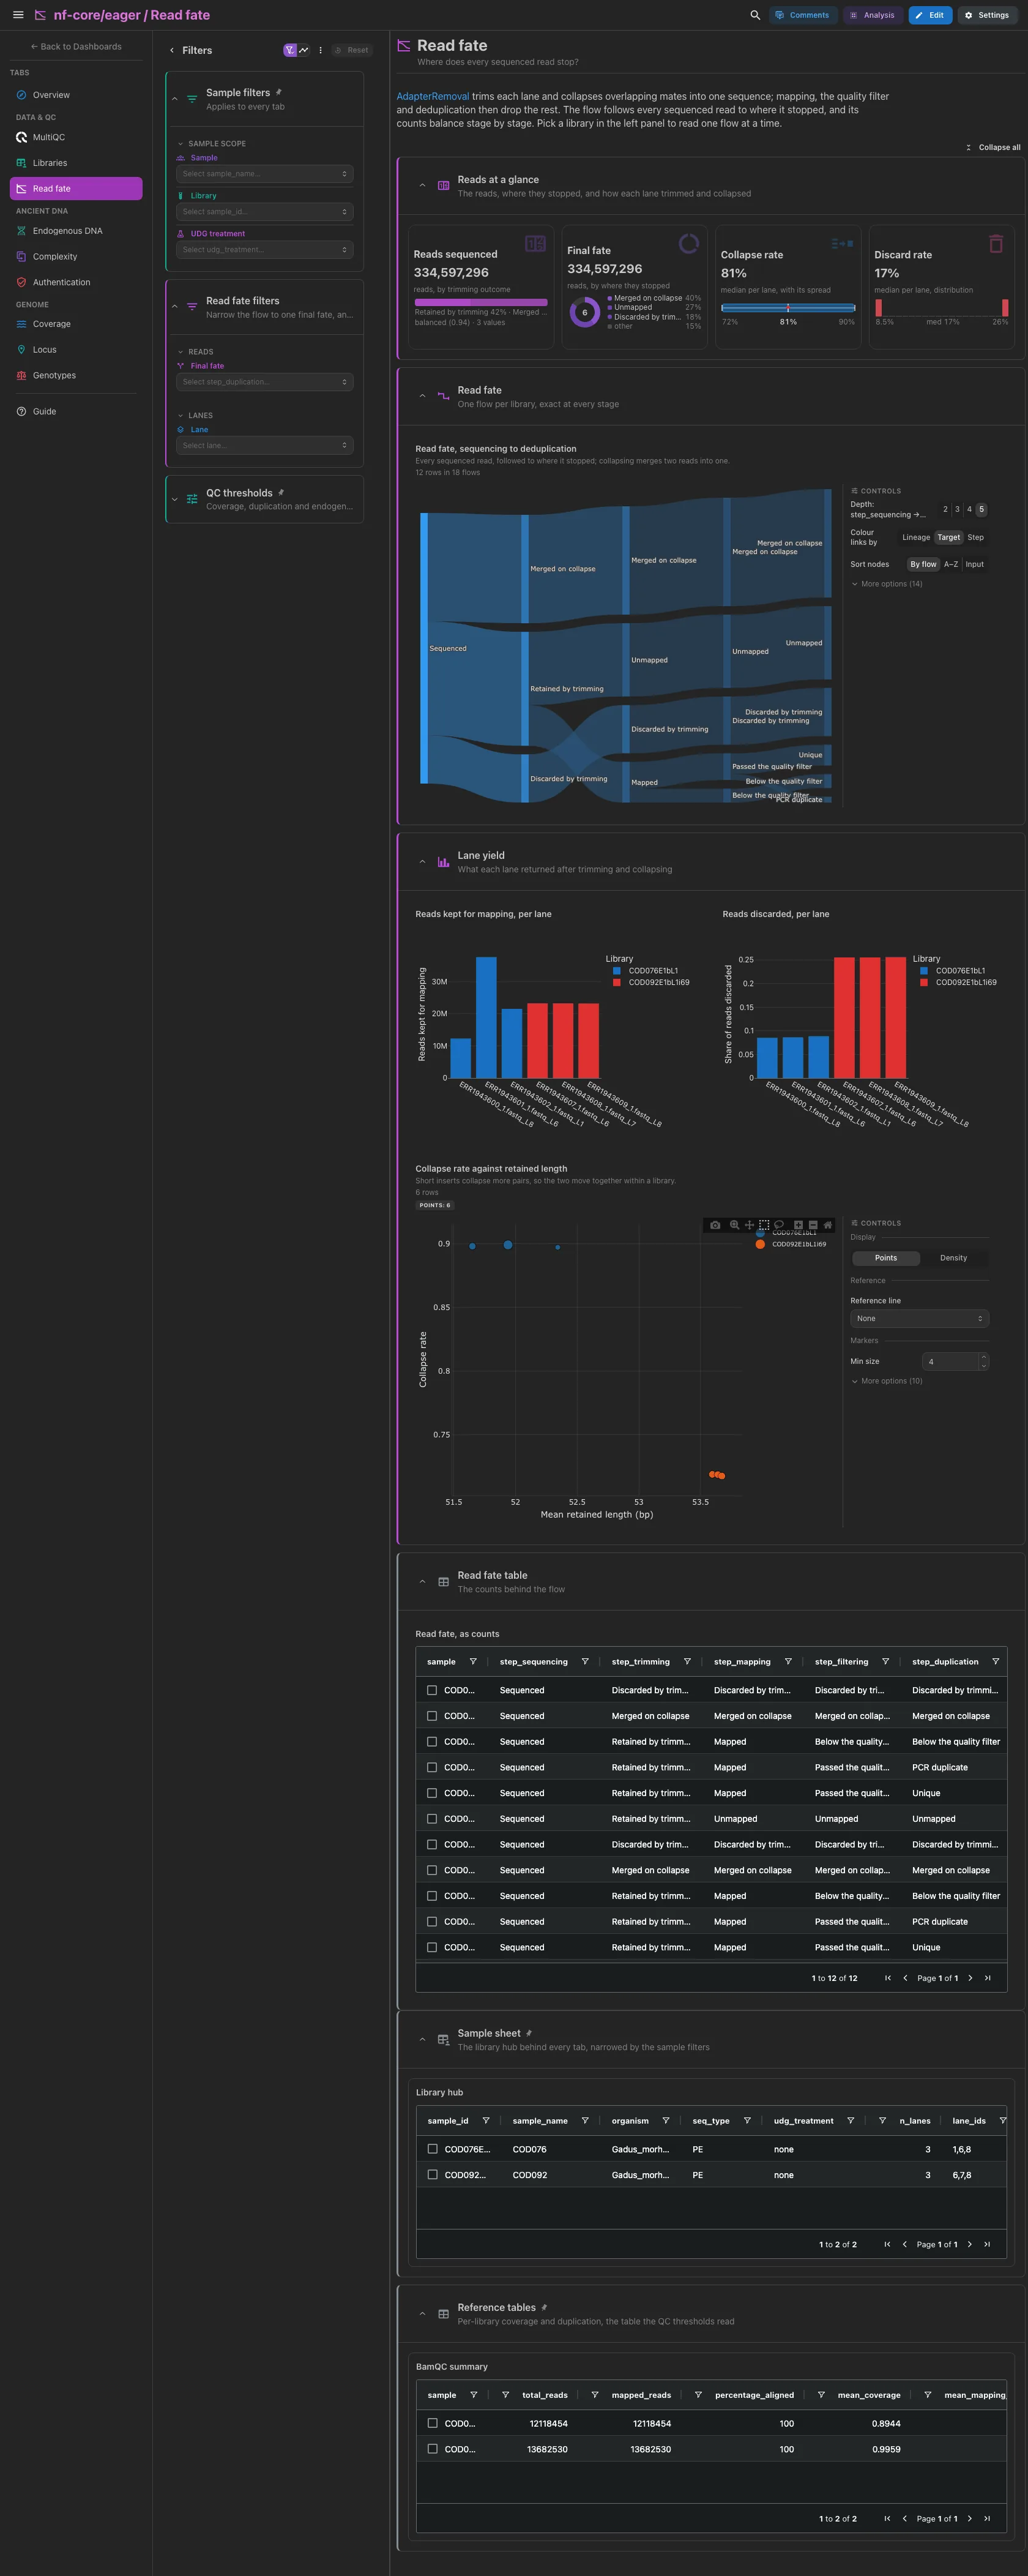
Reads sequenced split by trimming outcome, the same reads by final fate (a
ring), the collapse rate and the discard rate per lane. Then one sankey, five
stages with the reads that fall out at each, its flows coloured by where they
end. The pipeline-local eager/read_fate.py recipe chains AdapterRemoval,
samtools flagstat and Picard MarkDuplicates, and the accounting is exact: a
library's retained reads equal its pre-filter flagstat total, so nothing is
apportioned. Then the lane yield: reads kept and the discard share per lane,
and the collapse rate against the retained length. The fate table is
collapsed.
Filters and components
Filters · Final fate on eager_read_fate and Lane on
eager_lane_stats. There is no trimming-outcome filter: it would leave
the strip's first card on one outcome.
| Section | What it holds |
|---|---|
| Reads at a glance | 4 cards |
| Read fate | 1 advanced visualization |
| Lane yield | Reads kept for mapping, per lane, Reads discarded, per lane, 1 advanced visualization (collapse rate against retained length) |
| Read fate table (collapsed) | Read fate, as counts |
Ancient DNA · How much of each extract is the target organism?
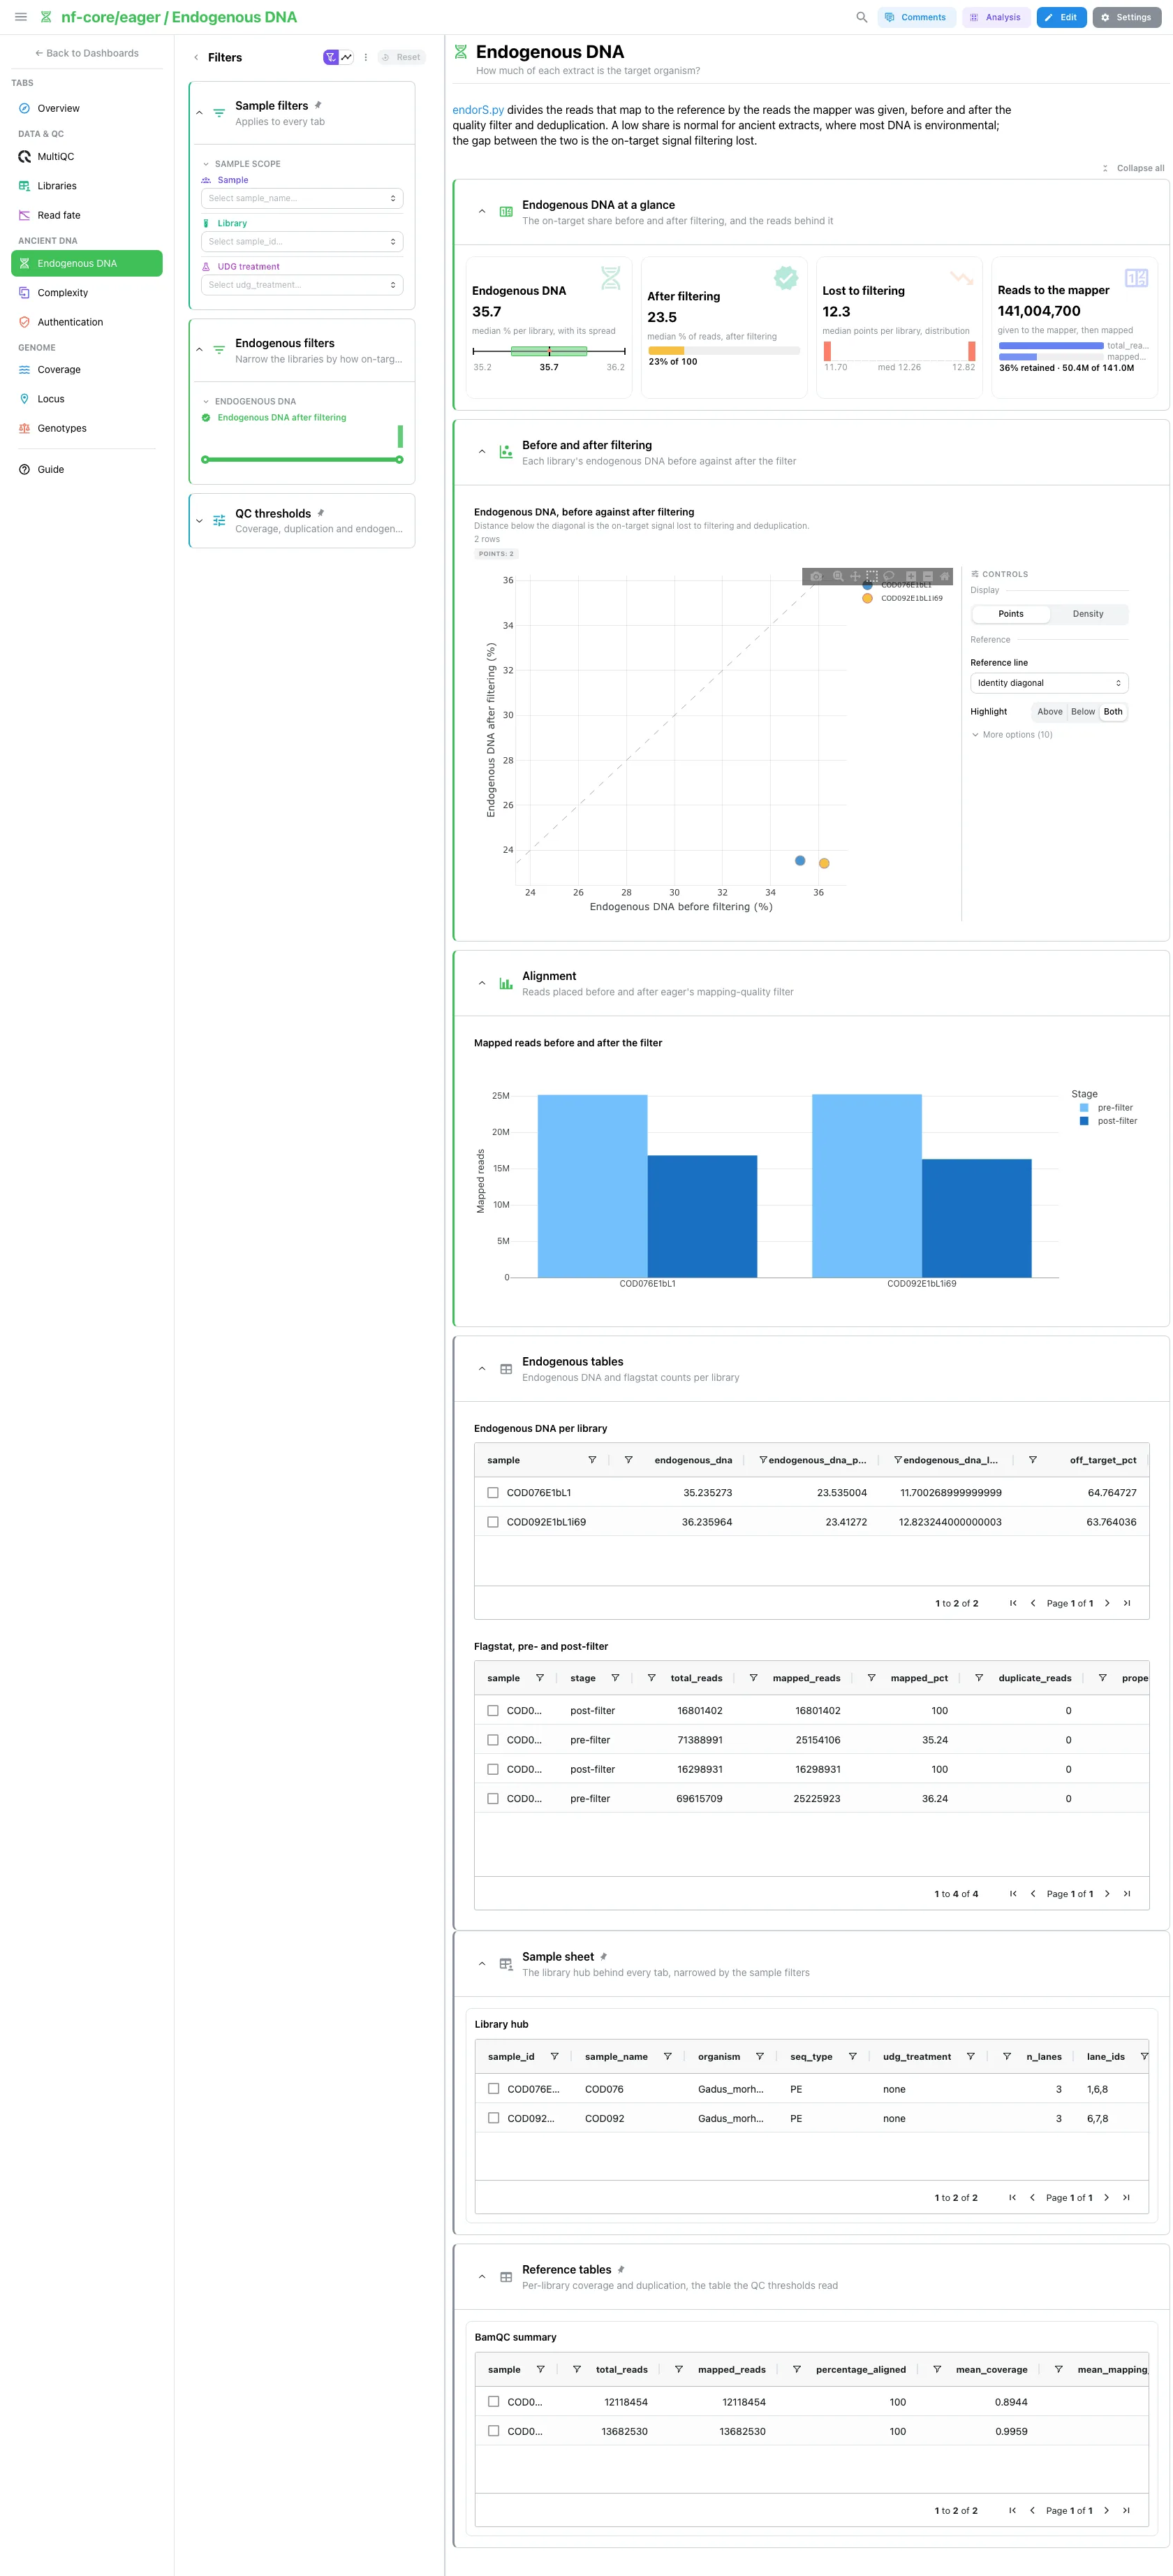
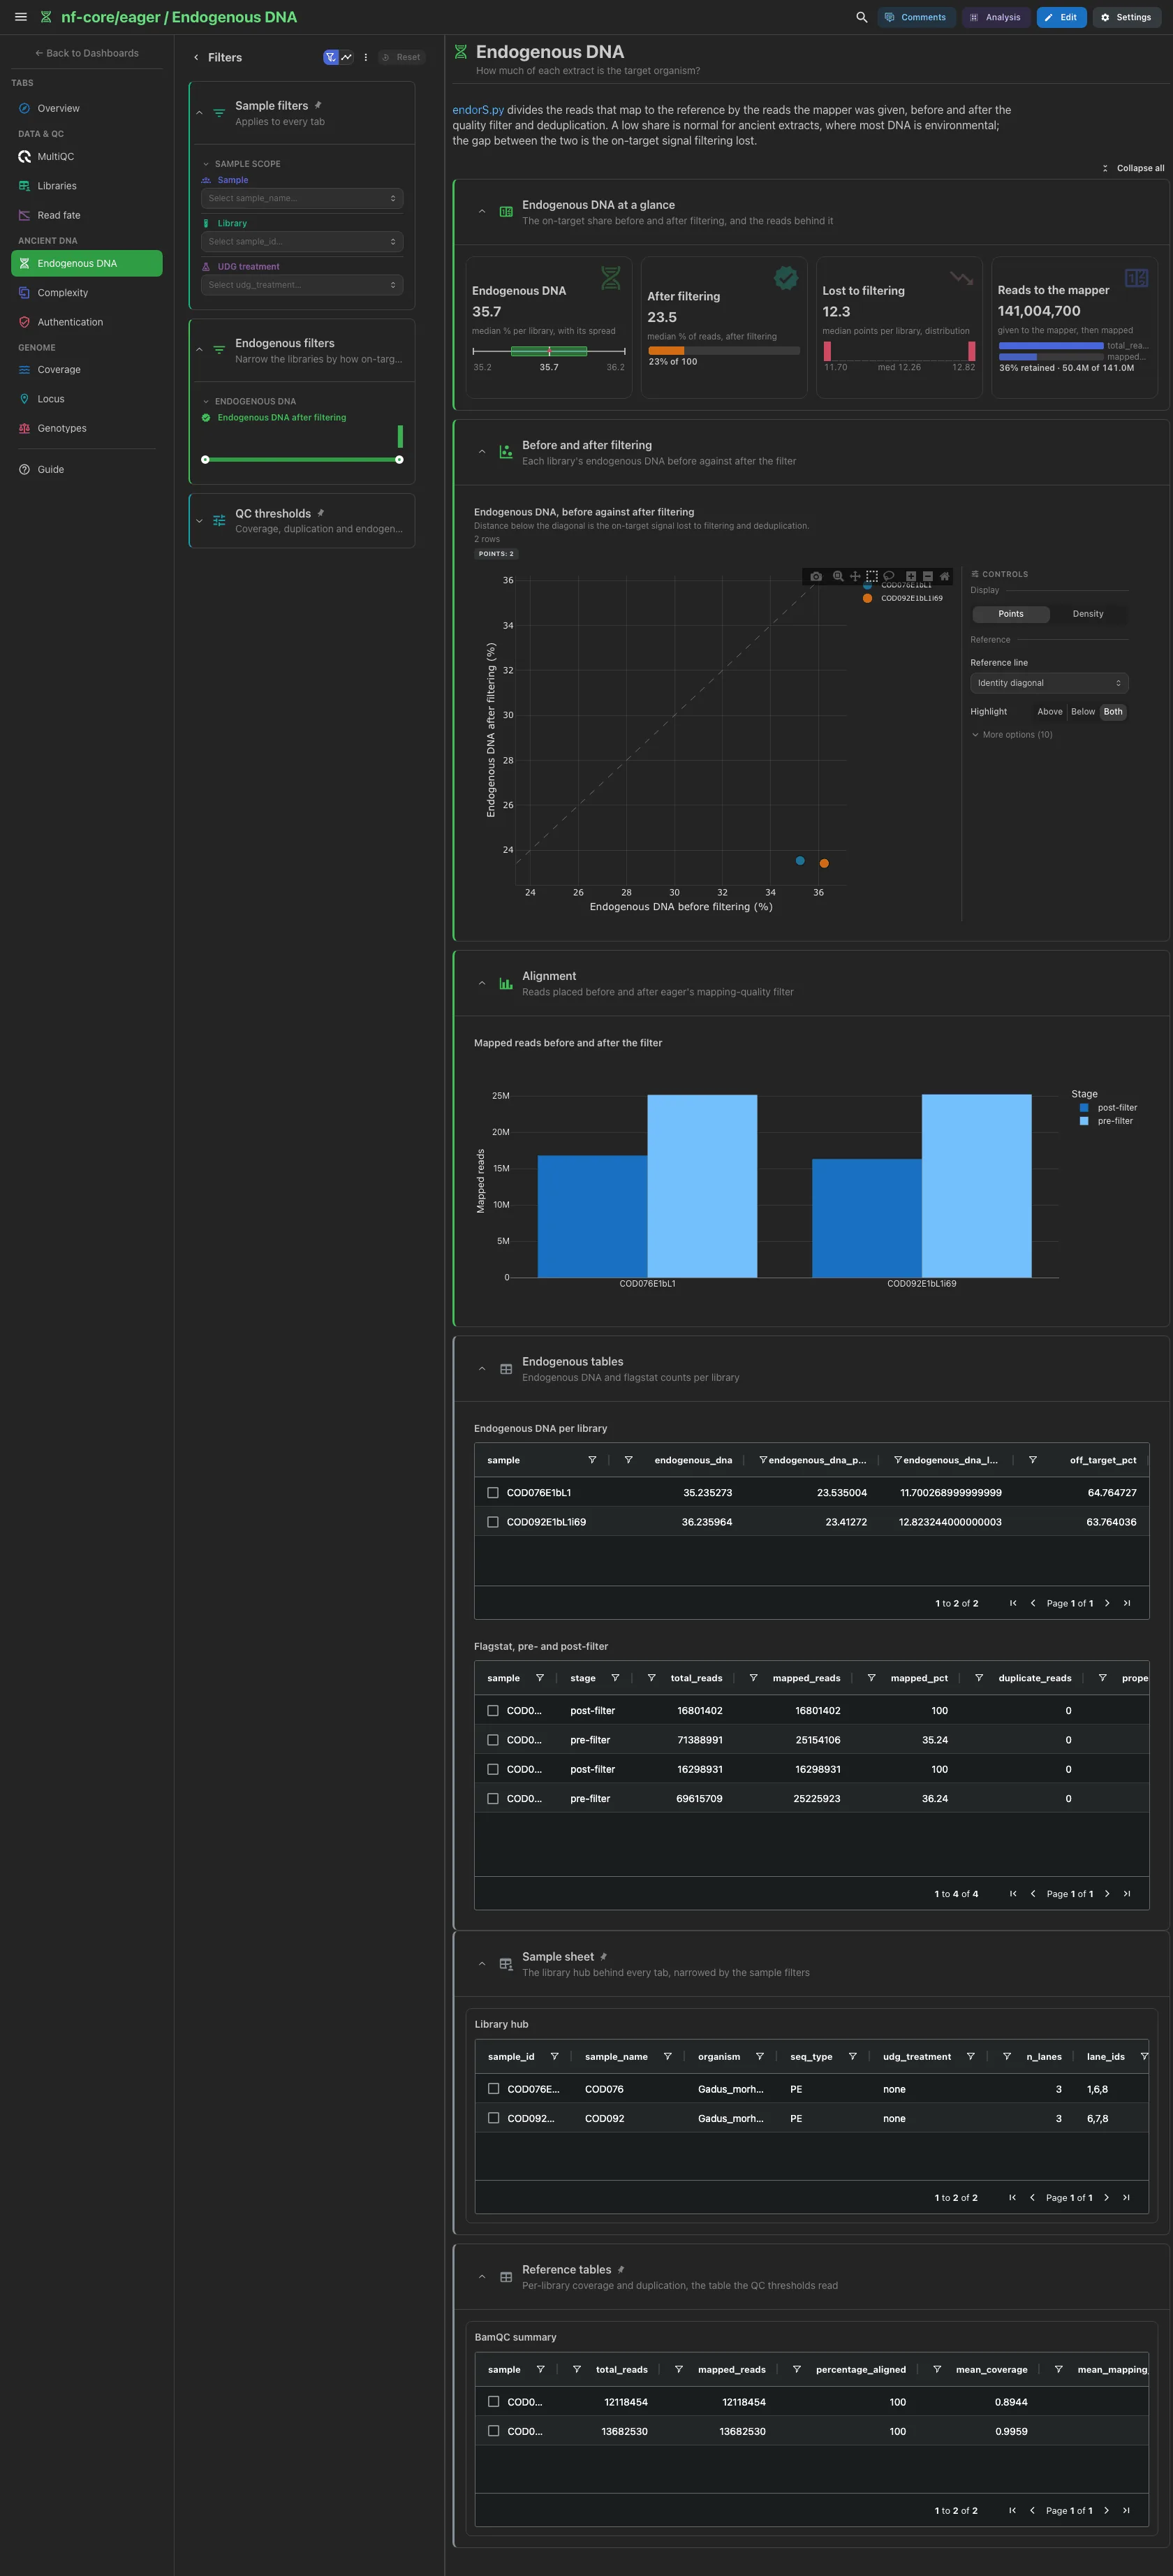
Endogenous DNA before filtering, after filtering (a share of 100%), the points lost between them and the reads given to the mapper (a funnel to those mapped, from flagstat's pre-filter stage). Then each library's endogenous DNA before against after filtering, the on-target signal lost to filtering below the diagonal, and the mapped reads per library and stage. A low share is normal for ancient extracts, where most DNA is environmental. The off-target screen (MaltExtract and Kraken, when the run enabled them) and the endorS.py and flagstat tables are collapsed.
Filters and components
Filters · an Endogenous DNA after filtering range on
endorspy_endogenous. There is no stage filter, for the same reason there
is no trimming-outcome filter on Read fate.
| Section | What it holds |
|---|---|
| Endogenous DNA at a glance | 4 cards |
| Before and after filtering | 1 advanced visualization |
| Alignment | Mapped reads before and after the filter |
| Off-target screen (collapsed) | MaltExtract authentication overview, Kraken classification |
| Endogenous tables (collapsed) | Endogenous DNA per library, Flagstat, pre- and post-filter |
Ancient DNA · How many distinct molecules does each library hold?
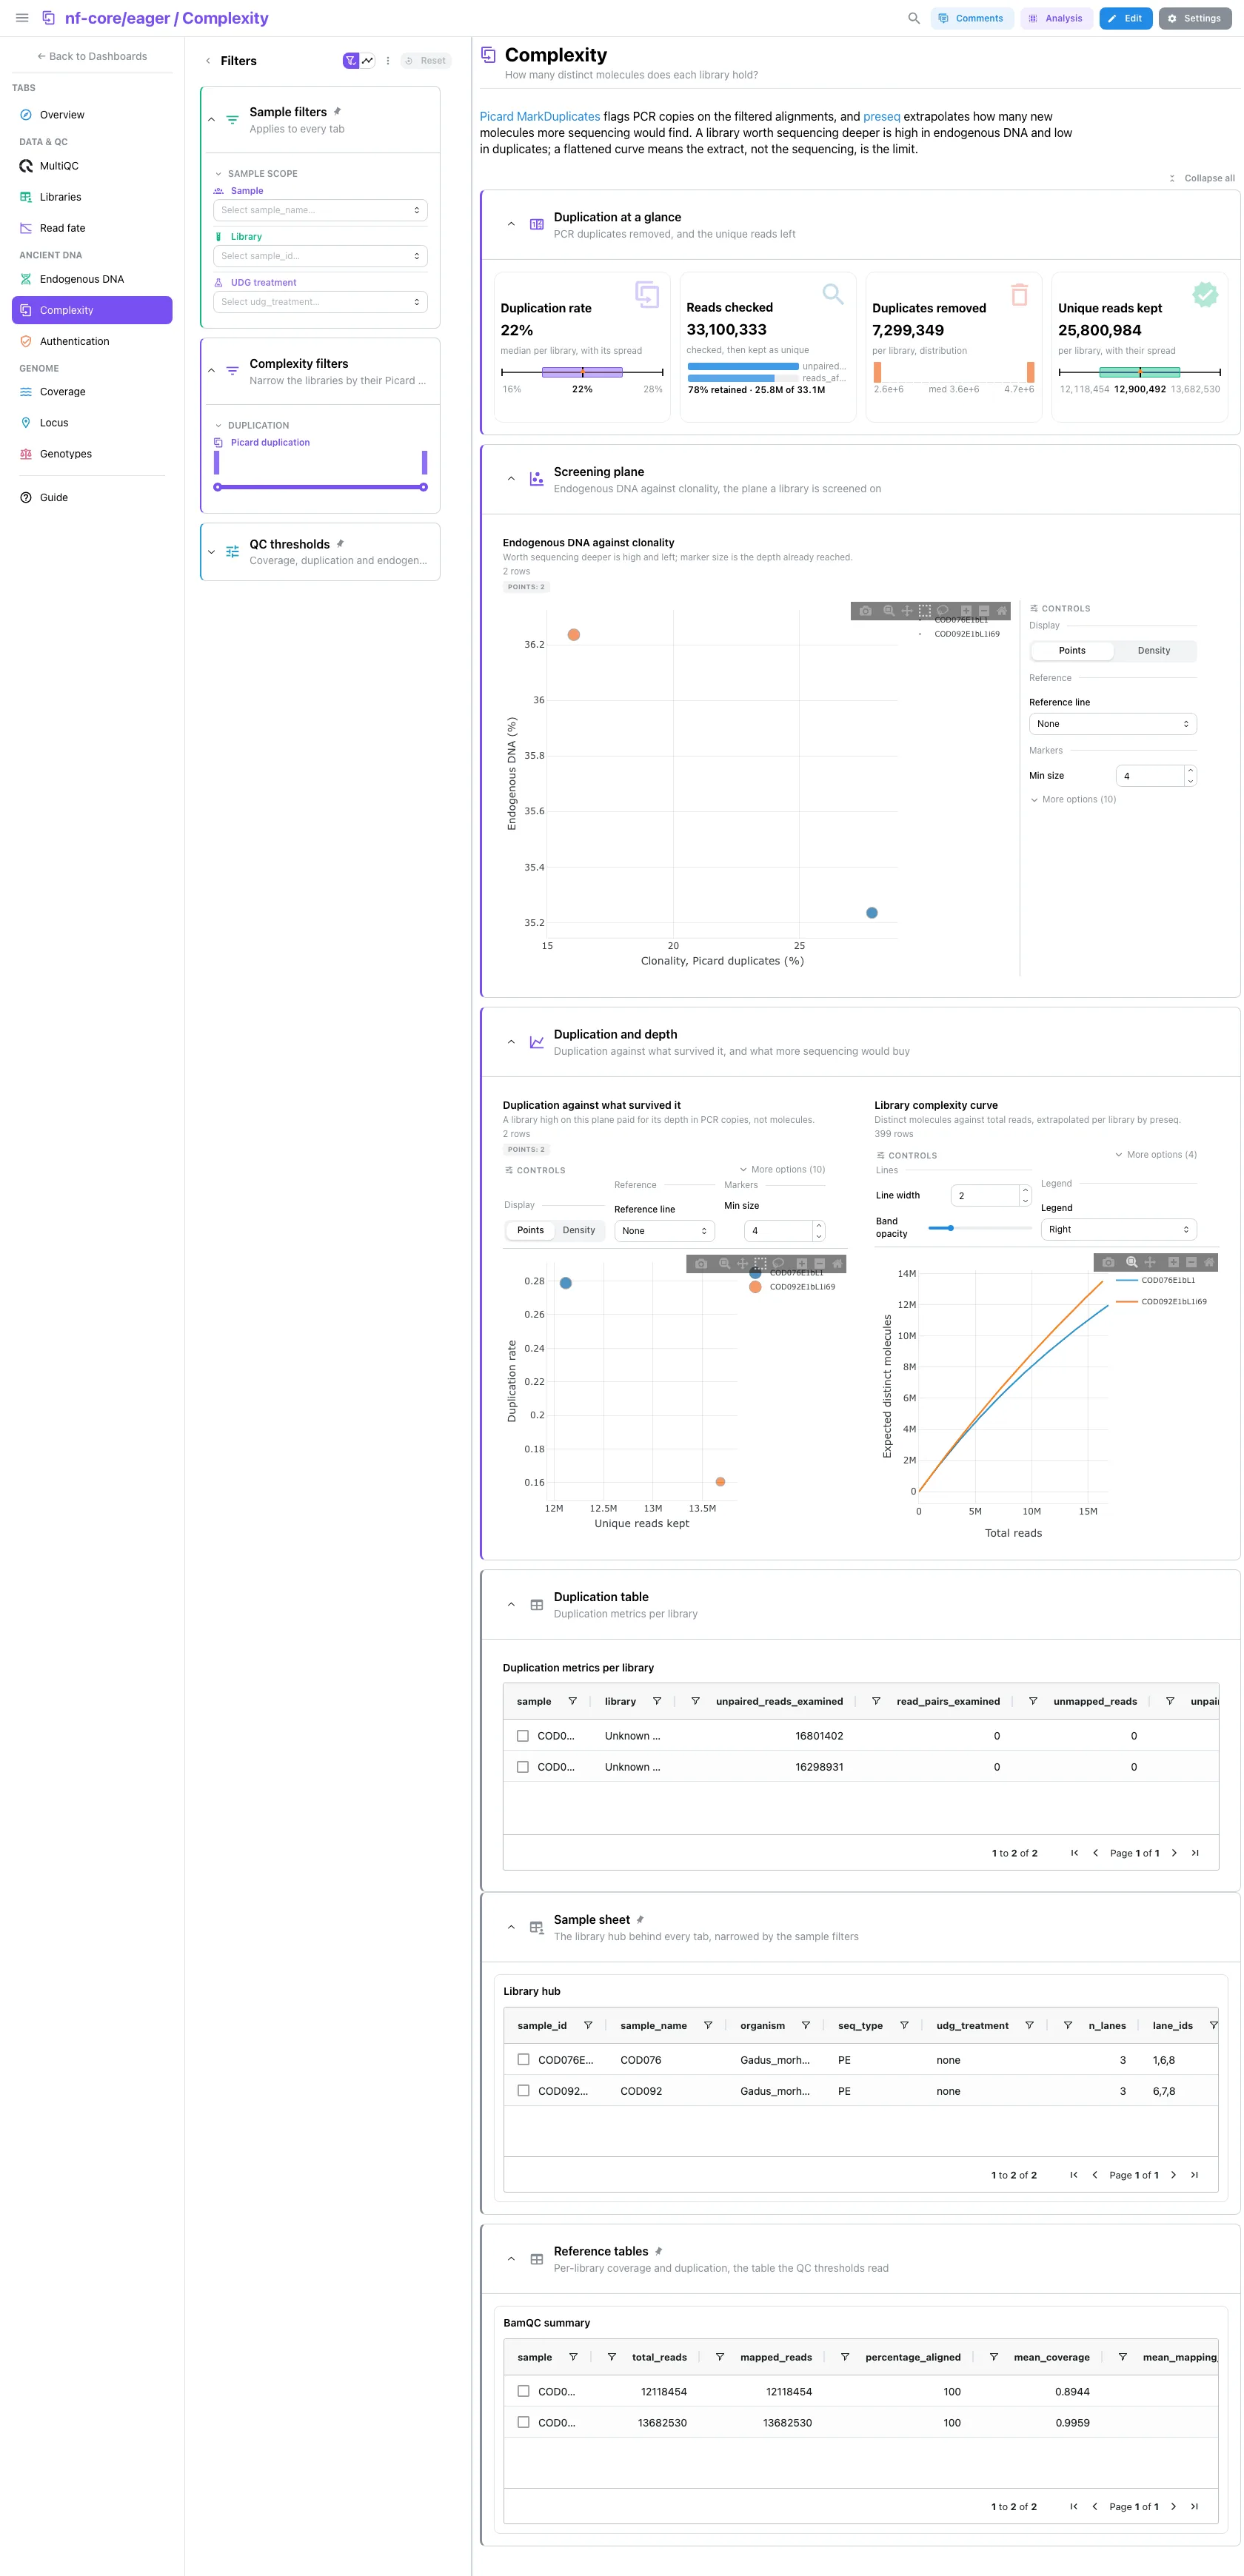
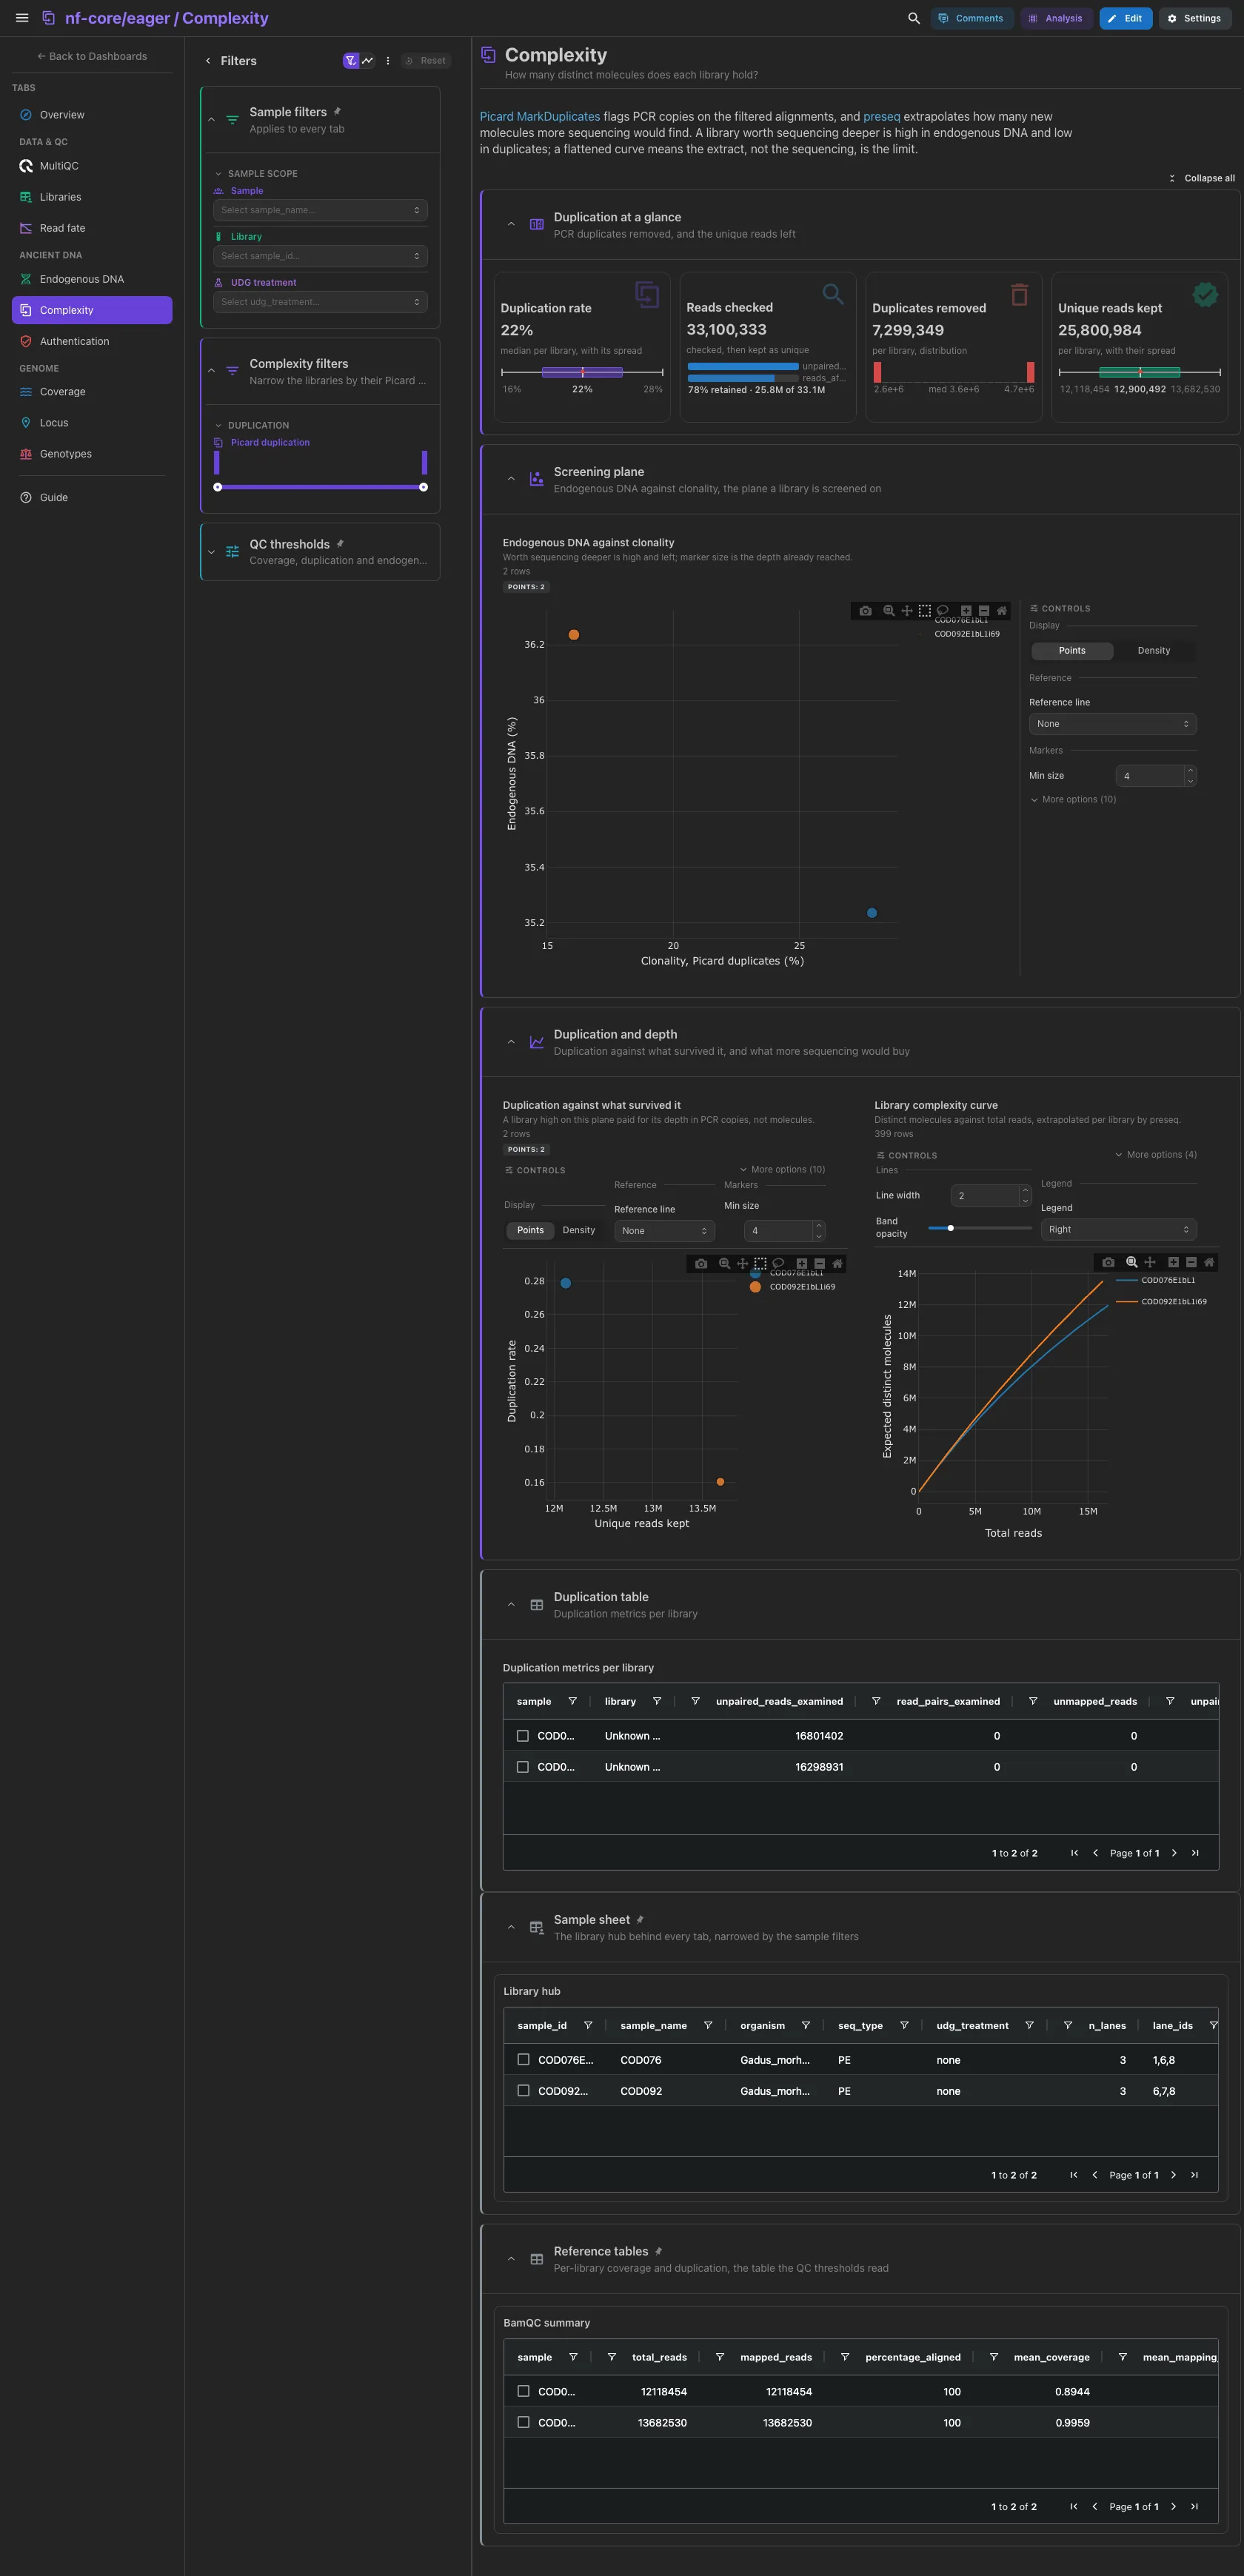
The Picard duplication rate, the reads checked (a funnel to the unique reads kept), the duplicates removed and the unique reads kept. Then the screening plane, endogenous DNA against clonality with each point sized by depth, and side by side the duplication against the unique reads kept and the preseq complexity curves. A library worth sequencing deeper is high in endogenous DNA and low in duplicates; a flattened curve means the extract, not the sequencing, is the limit. eager's preseq run wrote no bootstrap interval, so the curves carry no band. The Picard table is collapsed.
Filters and components
Filters · a Picard duplication range on
picard_markduplicates_metrics.
| Section | What it holds |
|---|---|
| Duplication at a glance | 4 cards |
| Screening plane | 1 advanced visualization |
| Duplication and depth | 2 advanced visualizations: duplication against what survived it and the library complexity curve |
| Duplication table (collapsed) | Duplication metrics per library |
Ancient DNA · Is the DNA damaged and short, as ancient DNA is?
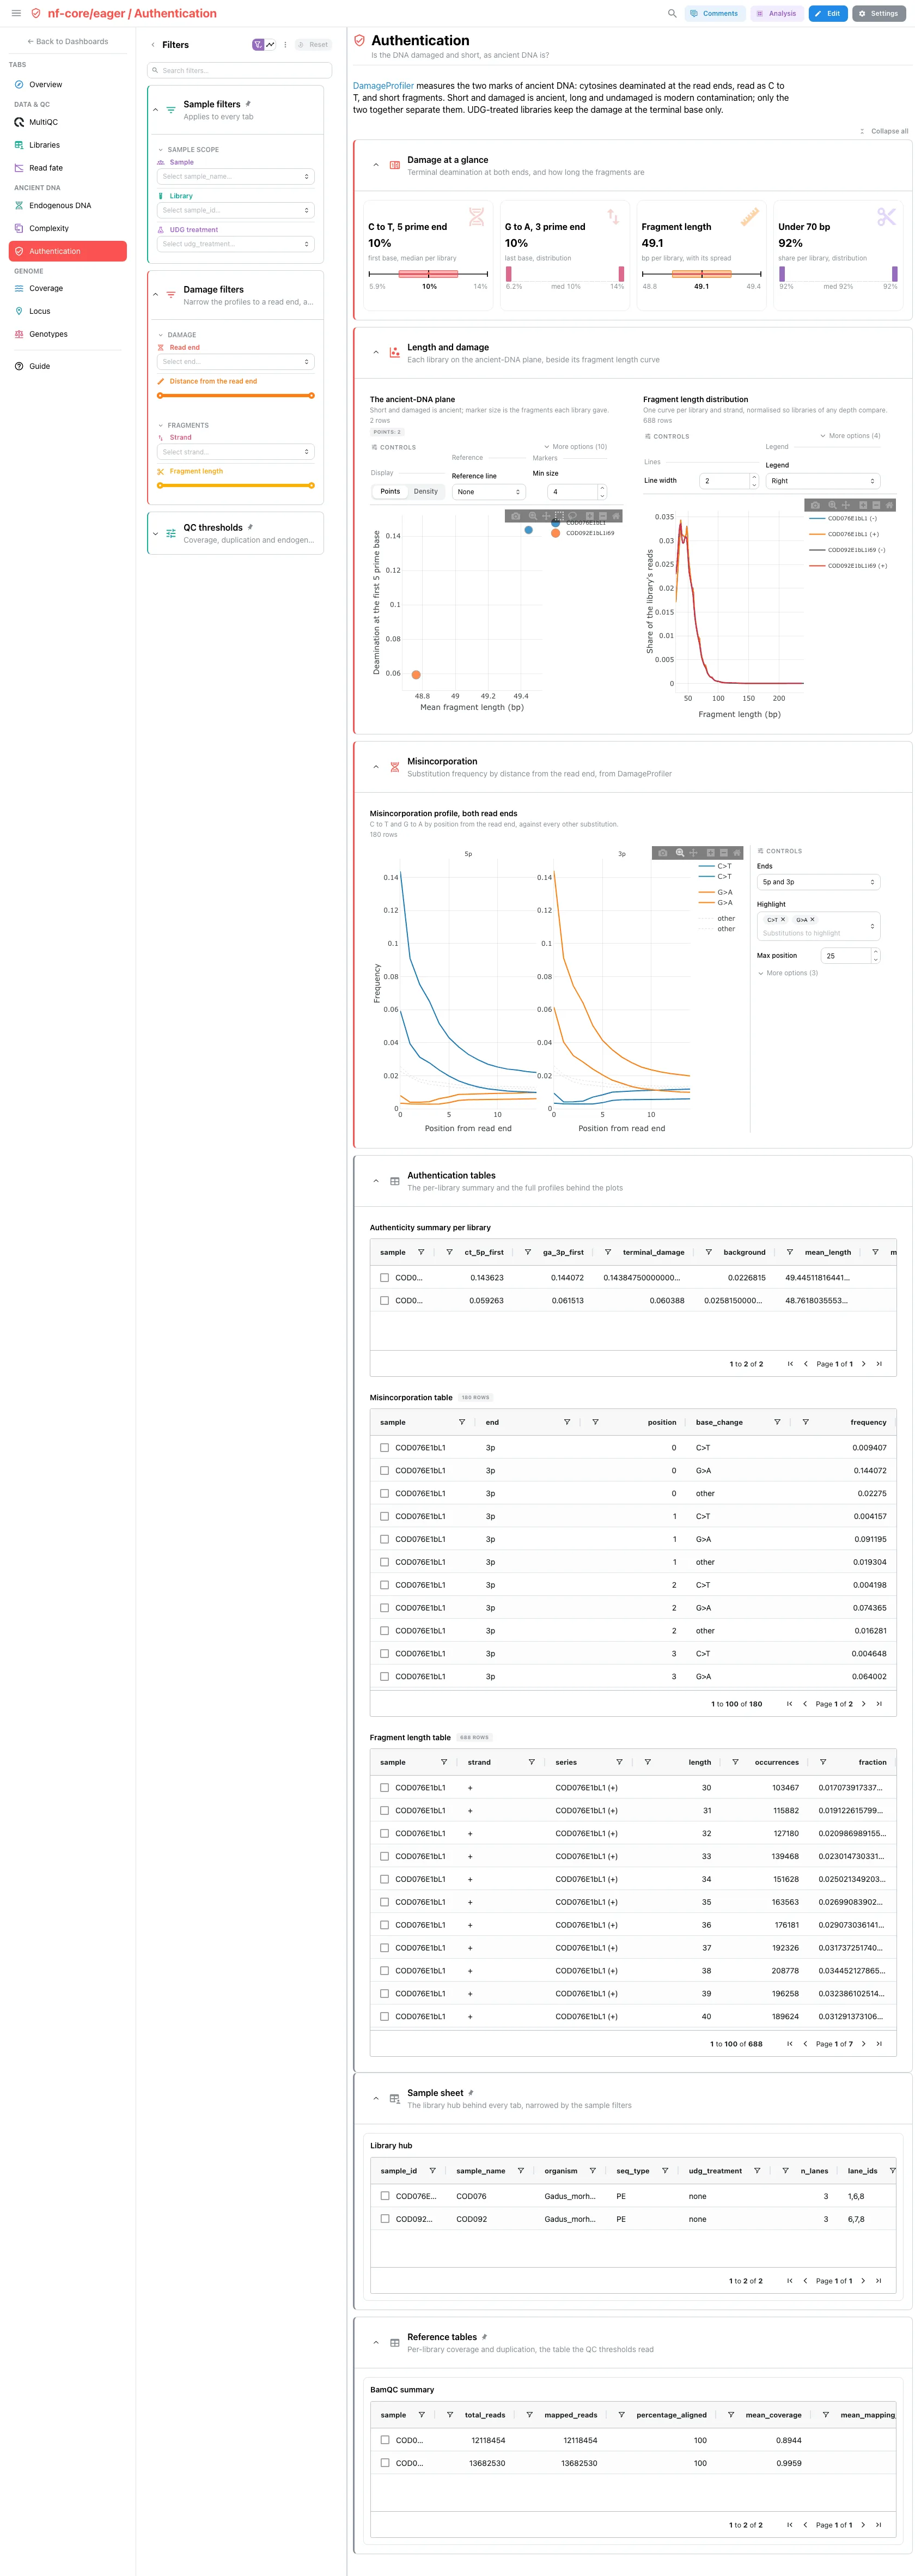
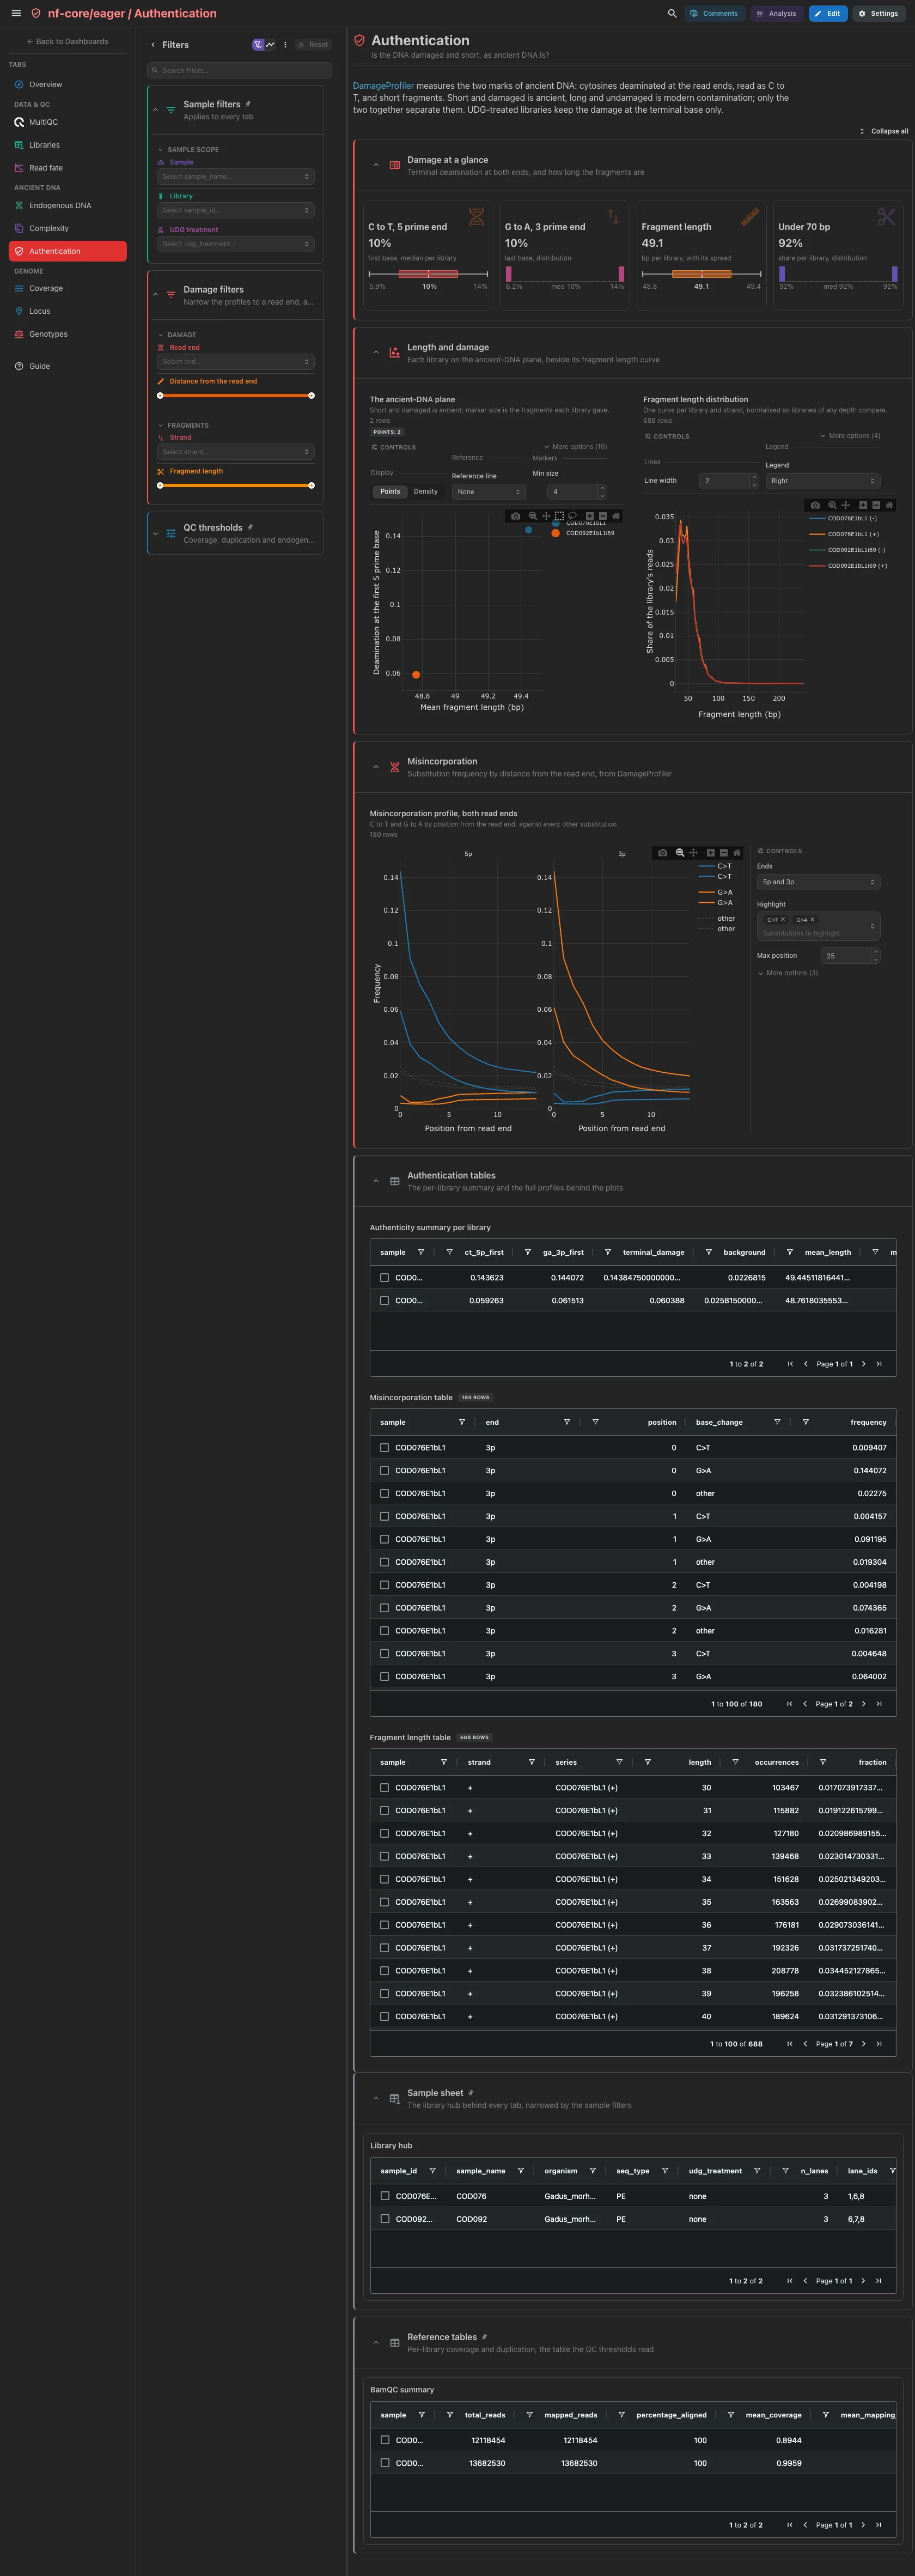
C to T at the 5 prime end, G to A at the 3 prime end, the mean fragment length
and the share under the SHORT_FRAGMENT_BP cut-off. Then the ancient-DNA
plane, mean length against terminal deamination, beside the fragment length
curves, and the misincorporation profile (C>T, G>A and the pooled
background by position from each read end). Short and damaged is ancient, long
and undamaged is modern contamination; UDG-treated libraries keep the damage at
the terminal base only. DamageProfiler 0.4.9 writes no length-binned damage
table, so the profile is not split by length. The contamination estimates
(ANGSD and MTNucRatio, when the run enabled them) and the DamageProfiler
tables are collapsed.
Filters and components
Filters · Read end and a Distance from the read end range on
damageprofiler_misincorporation, Strand and a Fragment length range
on damageprofiler_lgdistribution.
| Section | What it holds |
|---|---|
| Damage at a glance | 4 cards |
| Length and damage | 2 advanced visualizations: the ancient-DNA plane and the fragment length distribution |
| Misincorporation | 1 advanced visualization |
| Contamination (collapsed) | Nuclear contamination (ANGSD), Mitochondrial to nuclear ratio |
| Authentication tables (collapsed) | Authenticity summary per library, Misincorporation table, Fragment length table |
Genome · How deep and how evenly is the reference covered?
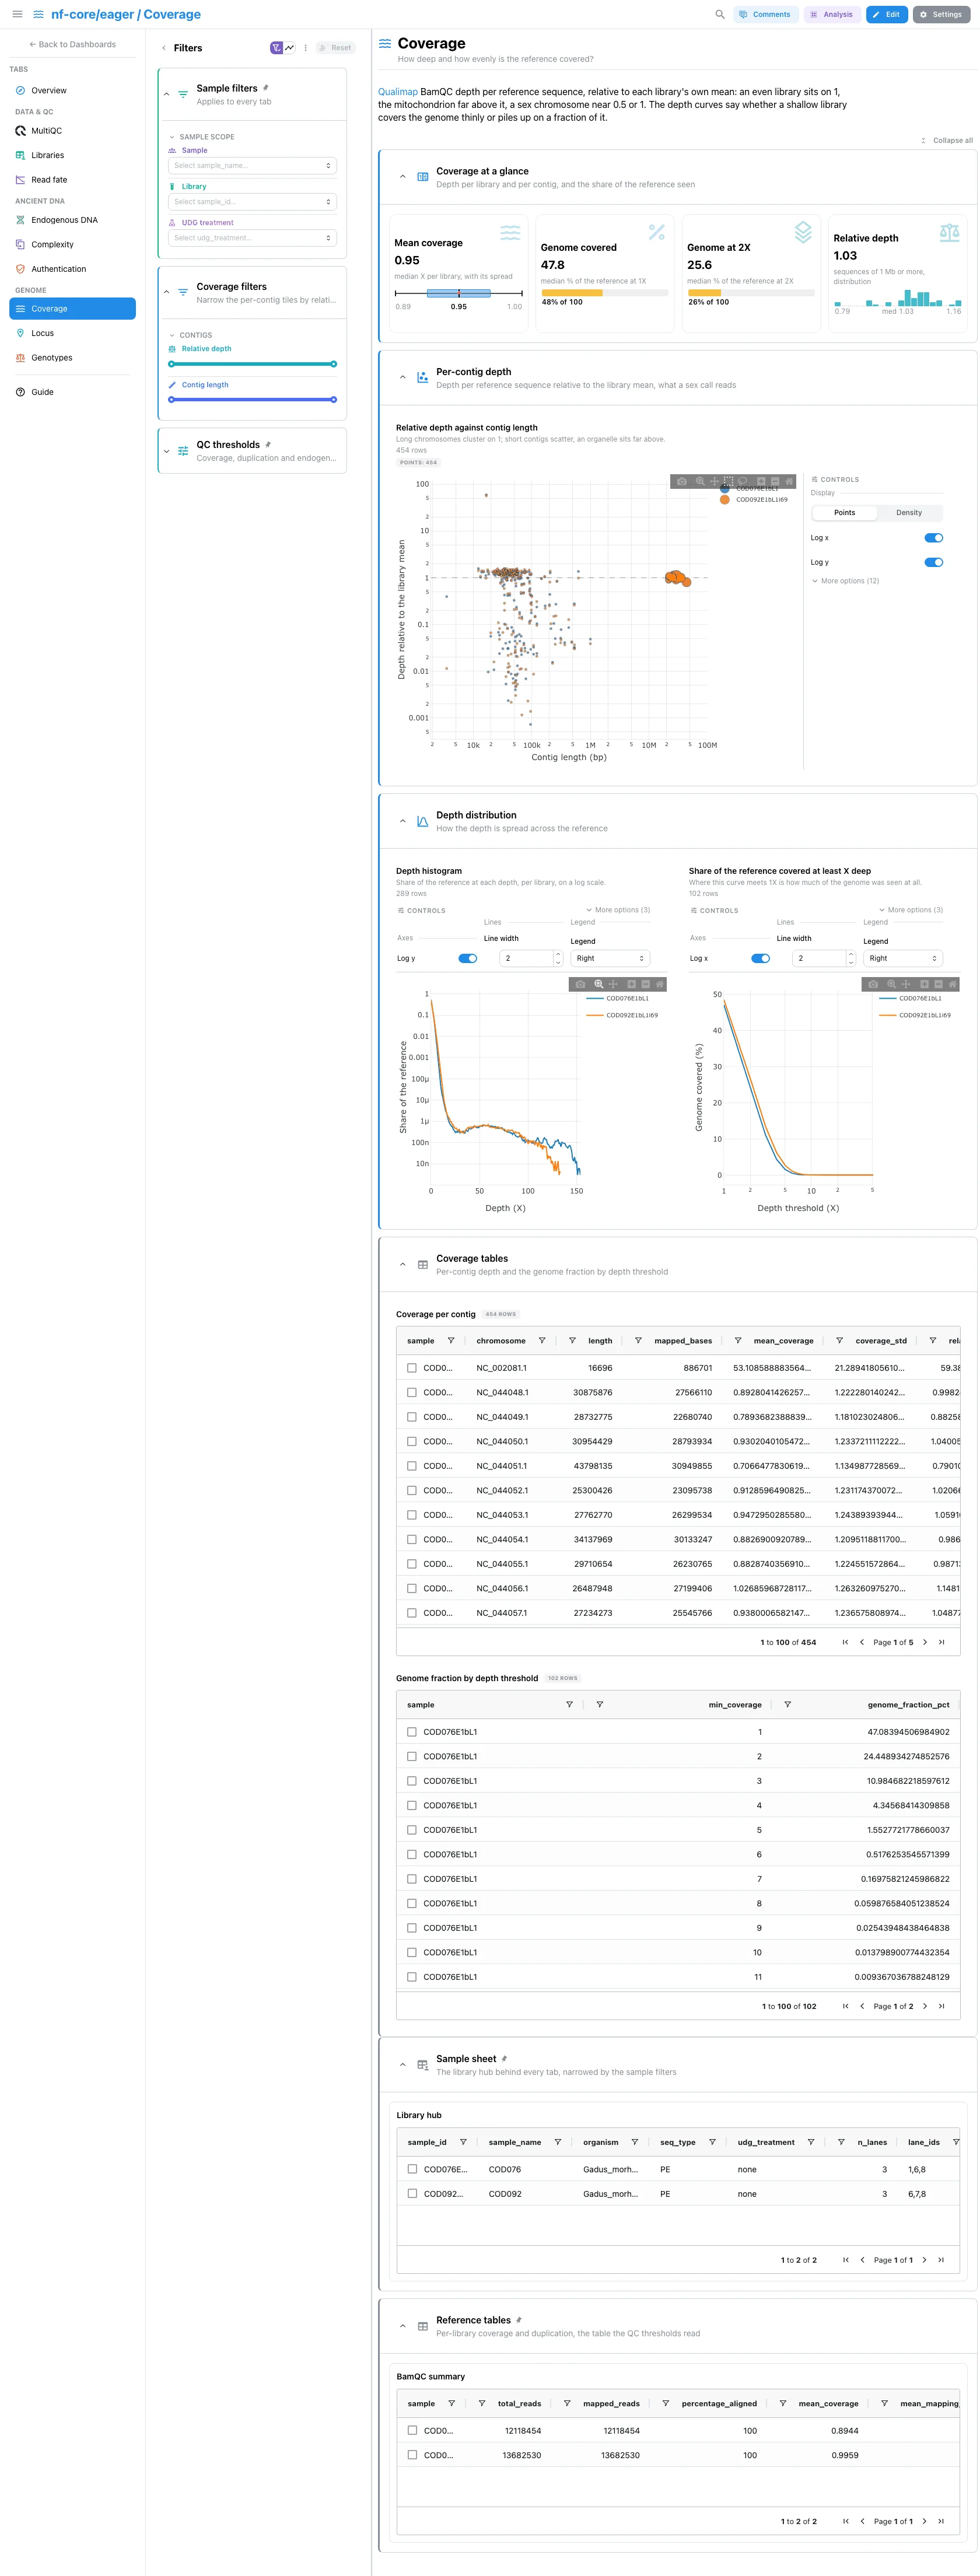
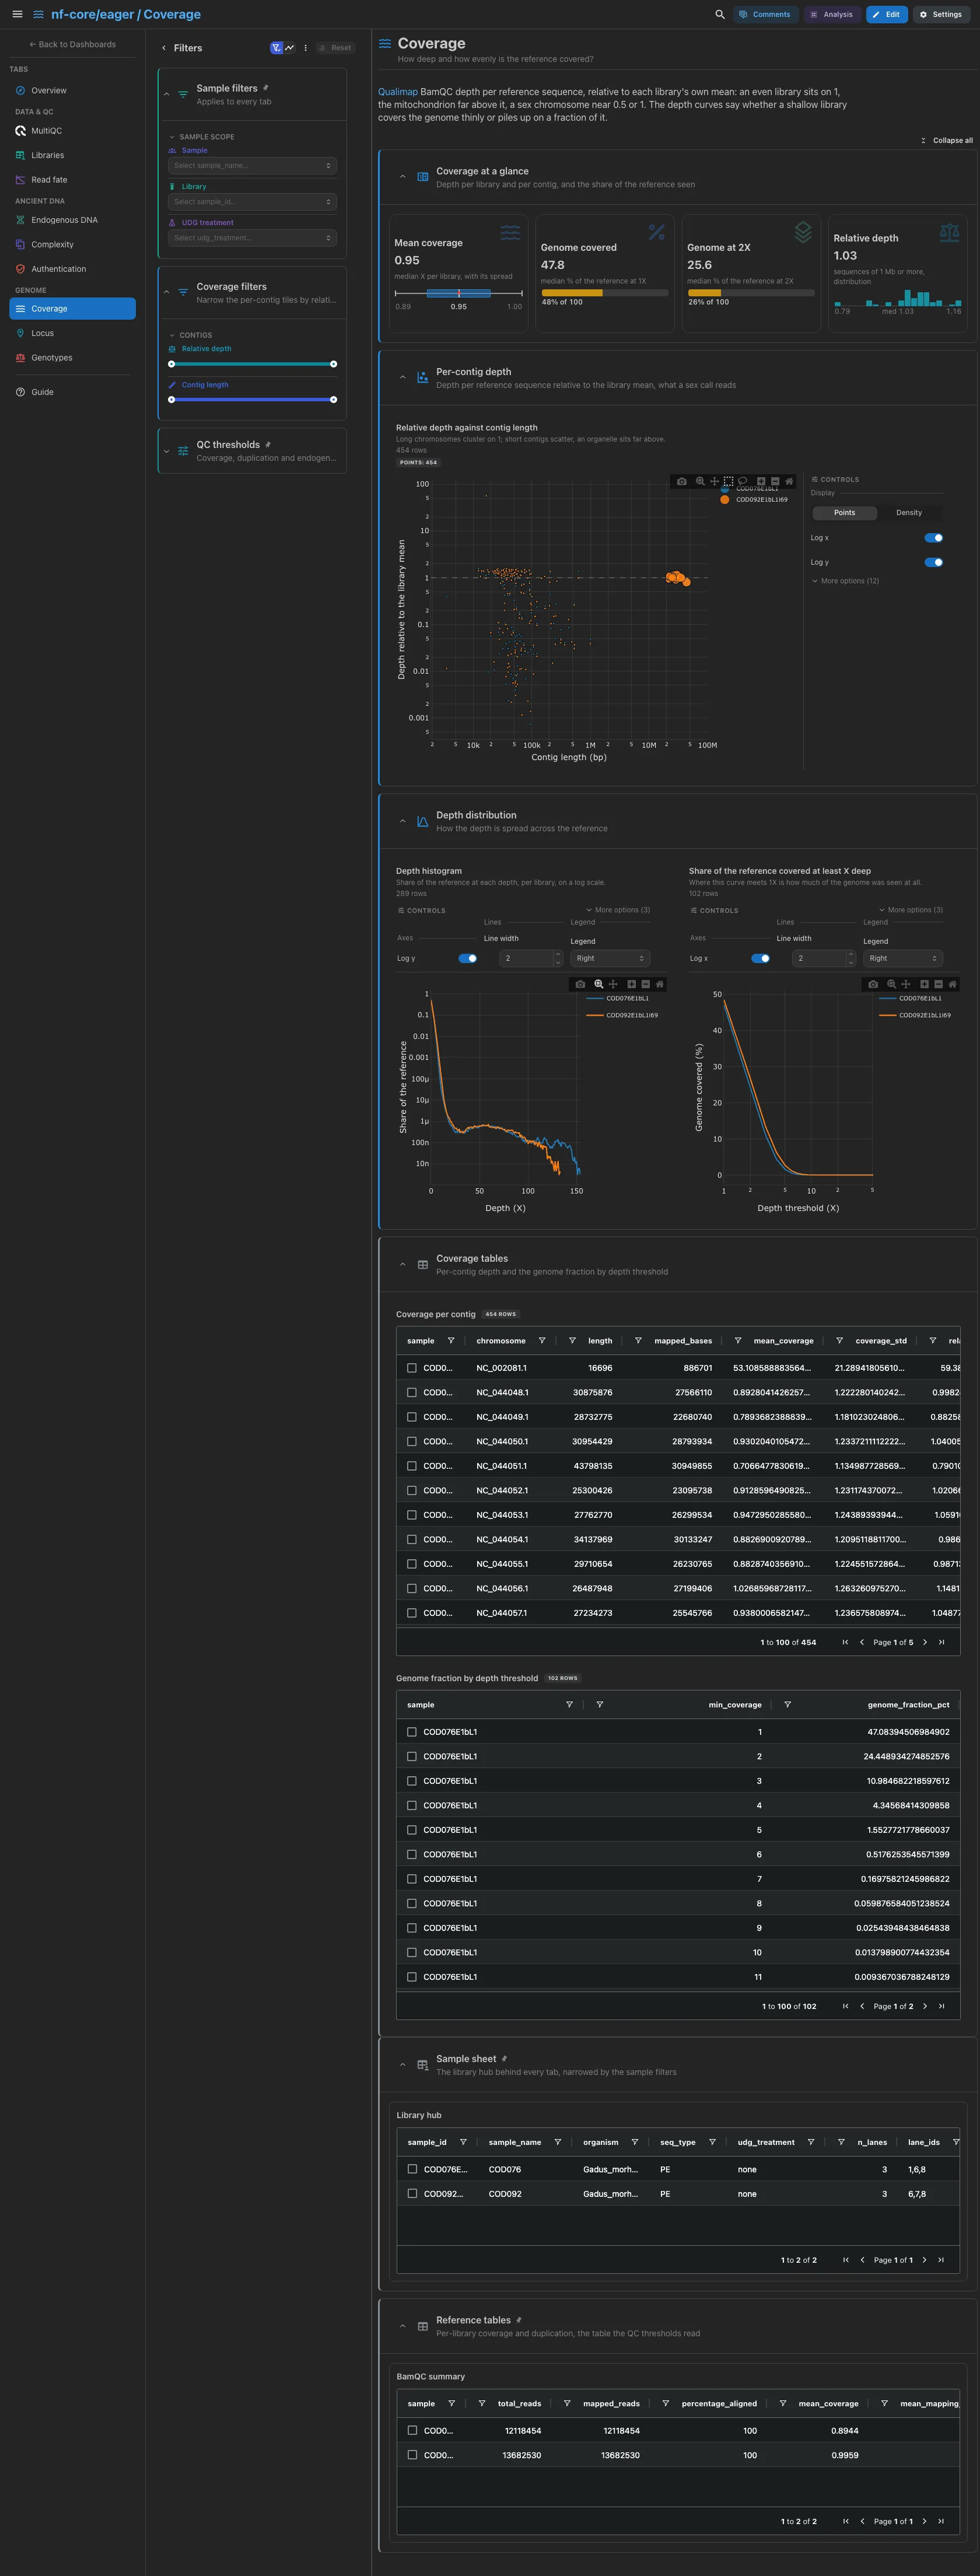
The mean coverage per library, the share of the reference covered at 1X and at 2X, and the depth of the sequences of 1 Mb or more relative to the library mean. Then the relative depth against contig length, the quantity a sex call and an organelle ratio are made from: an even library sits on 1, the mitochondrion far above it, a sex chromosome near 0.5 or 1. Side by side, the depth histogram and the share of the reference covered at least X deep, on a log depth axis. There is no per-contig bar: on a reference with hundreds of scaffolds its axis cannot be read. The Sex.DetERRmine table (when the run enabled it) and the per-contig and genome fraction tables are collapsed.
Filters and components
Filters · Relative depth and Contig length ranges on
qualimap_coverage_per_contig. There is no depth-threshold filter: the 1X
and 2X cards would print a dash once it excluded their threshold.
| Section | What it holds |
|---|---|
| Coverage at a glance | 4 cards |
| Per-contig depth | 1 advanced visualization |
| Depth distribution | 2 advanced visualizations: the depth histogram and the genome fraction curve |
| Sex determination (collapsed) | Sex.DetERRmine |
| Coverage tables (collapsed) | Coverage per contig, Genome fraction by depth threshold |
Genome · How deep and how well mapped is one region?
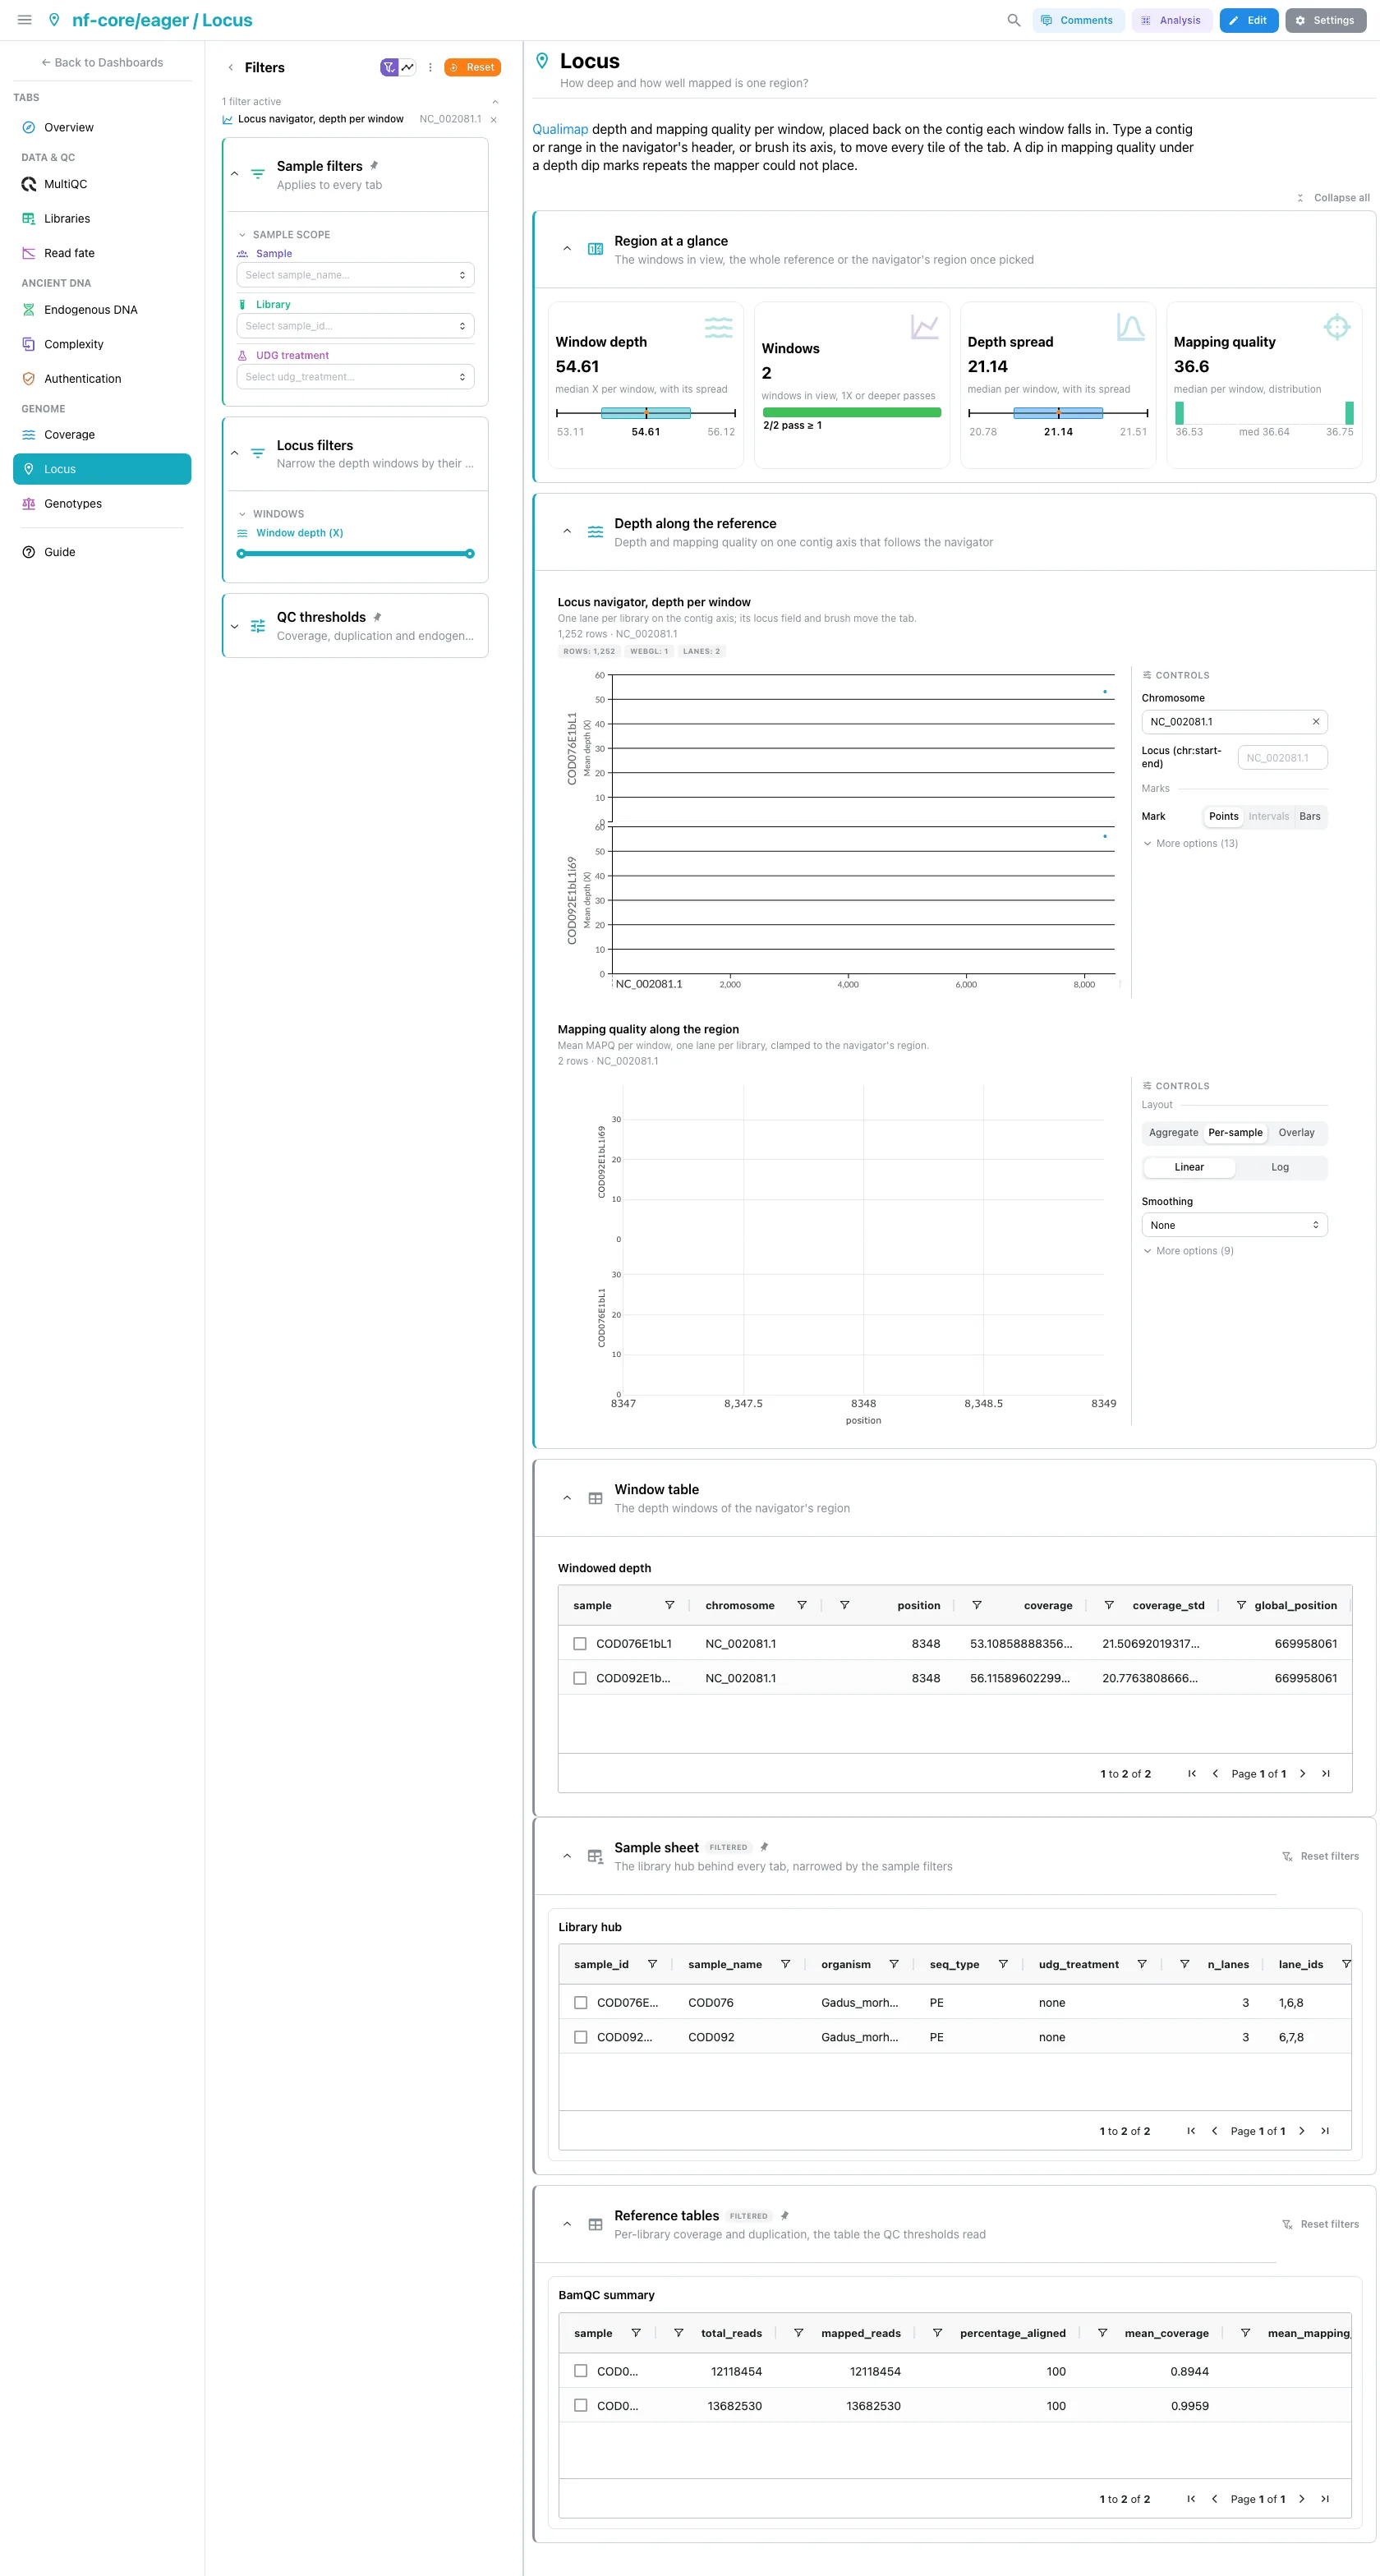
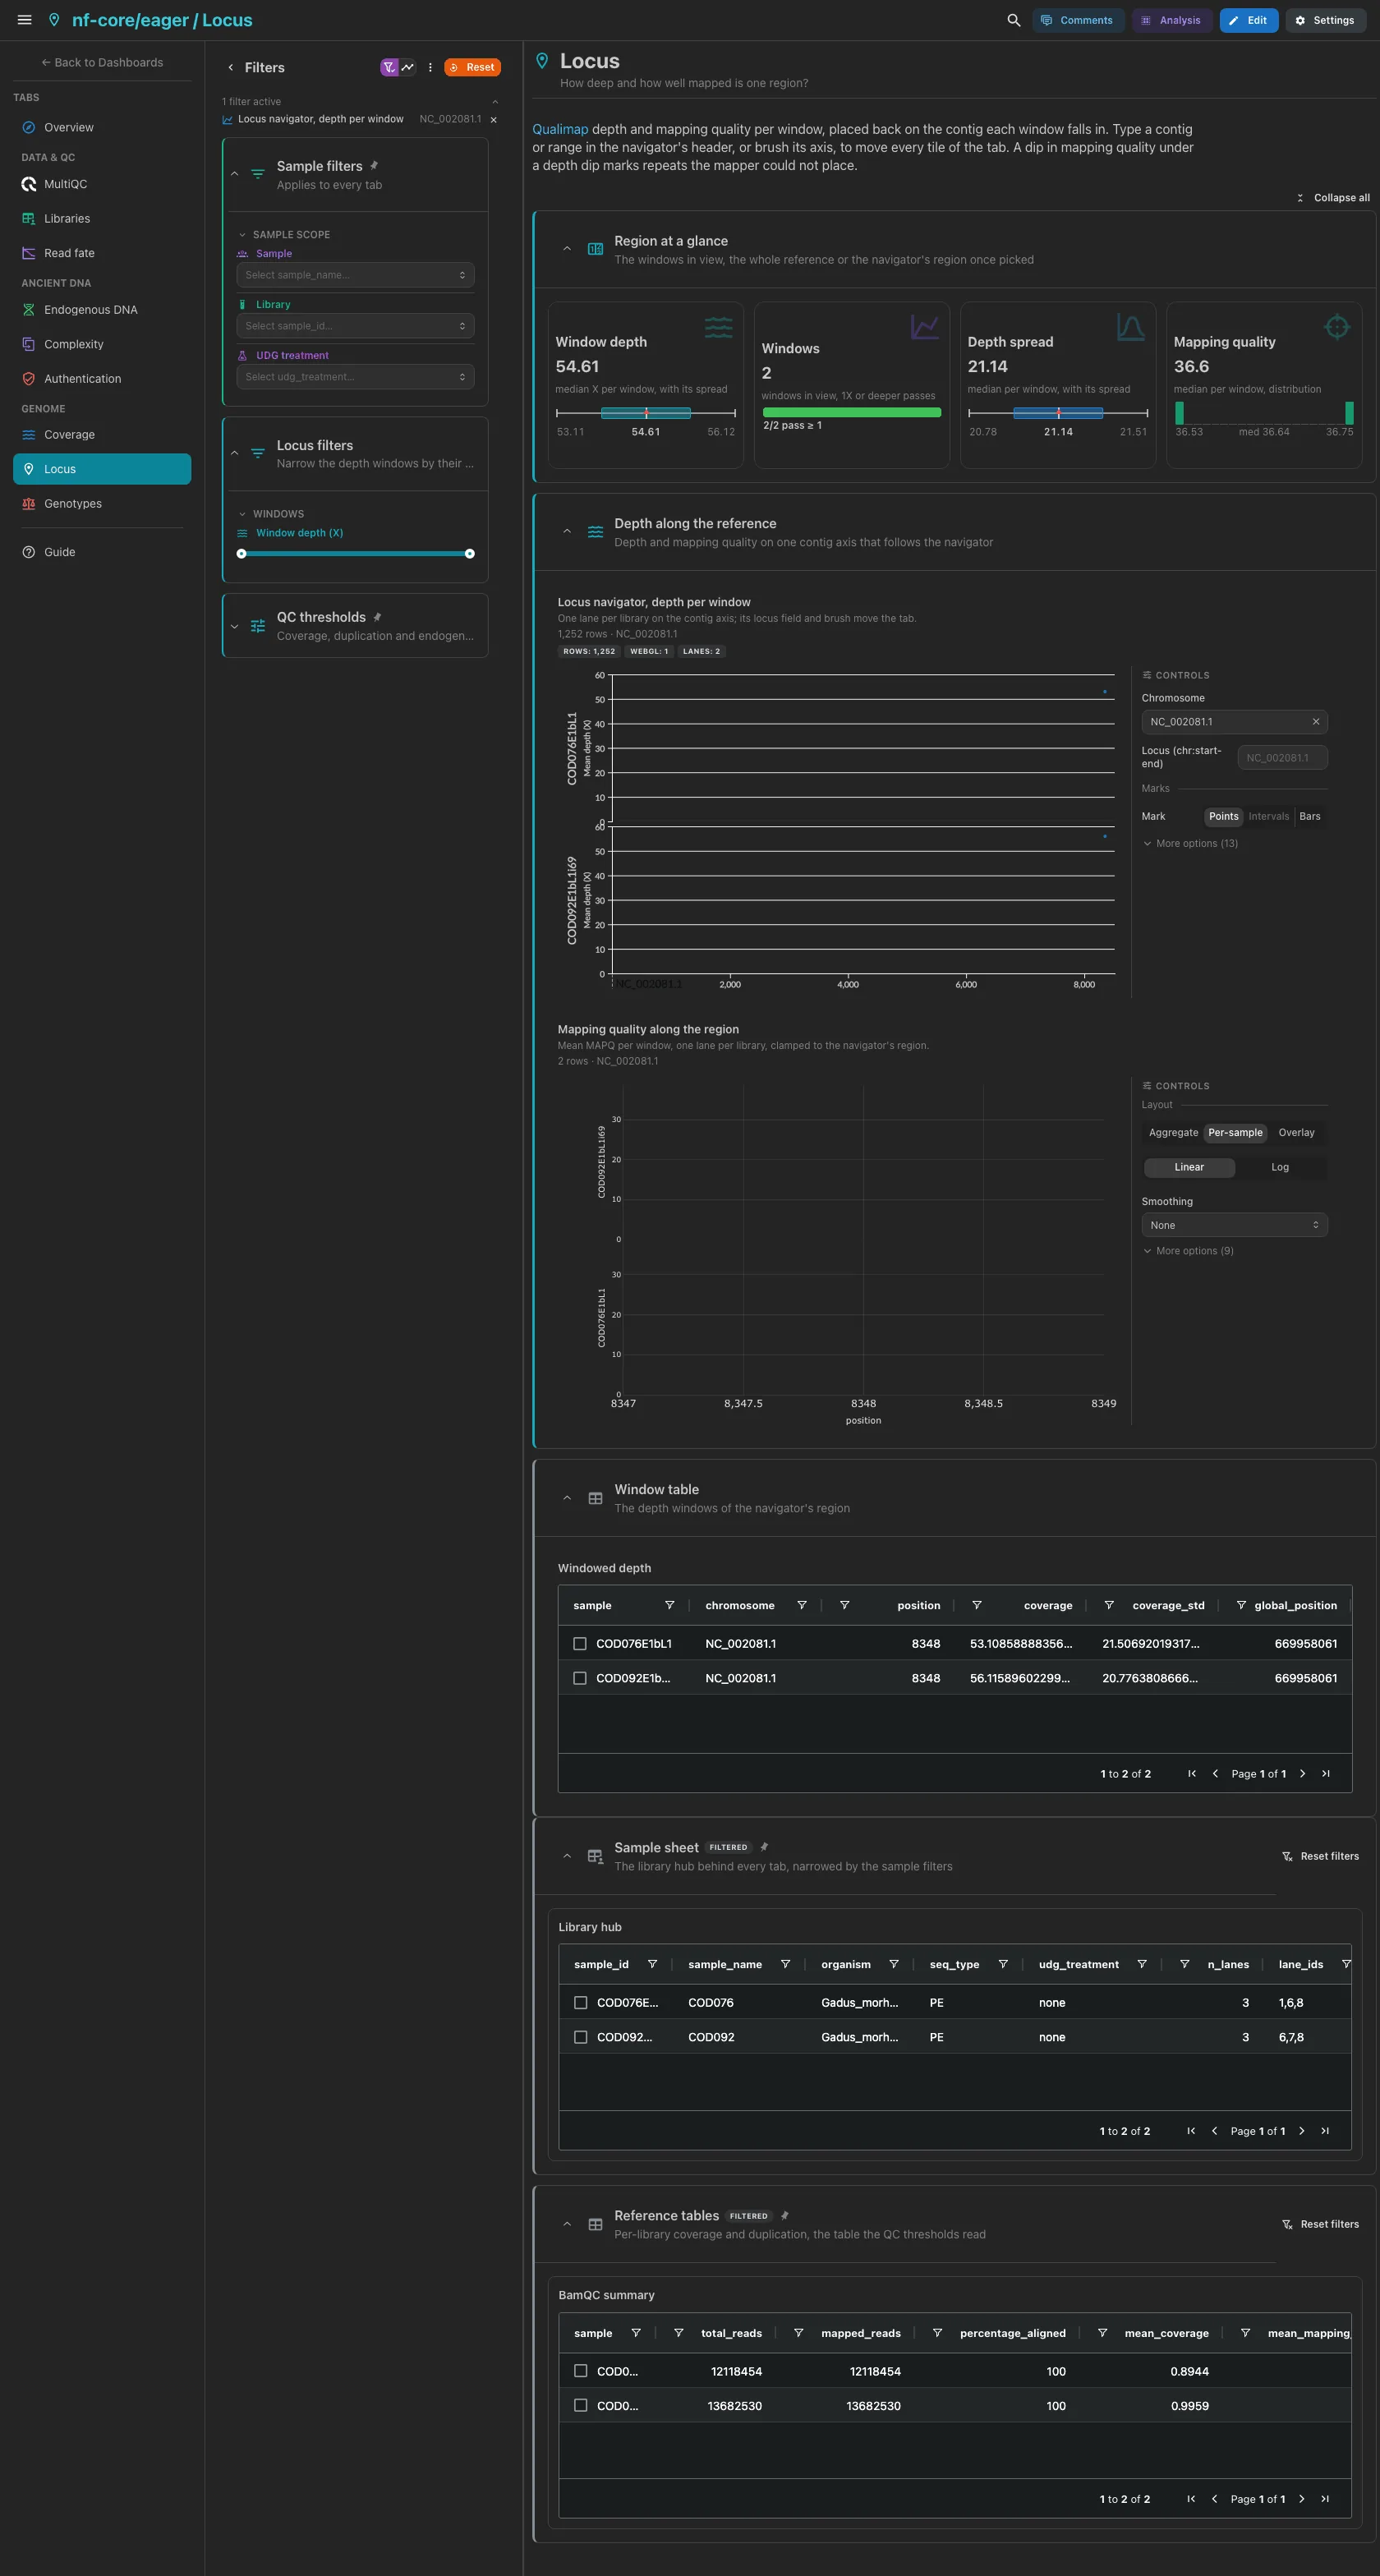
The window depth, the windows in view (those at 1X or deeper against the rest),
the depth spread within a window and the mapping quality; the four cards read
the whole reference until a region is picked, then that region. Then the locus
navigator, Qualimap's windows mapped back onto their contigs, with a track of
mean mapping quality under it from the pipeline-local
eager/mapq_across_reference.py. A region link carries the navigator's
chromosome and position onto that track, so a brush or a typed locus moves both
tracks and the strip together. A dip in mapping quality under a depth dip marks
repeats the mapper could not place. The window table is collapsed.
Filters and components
Filters · a Window depth (X) range on
qualimap_coverage_across_reference. There is no chromosome filter: the
navigator owns the region.
| Section | What it holds |
|---|---|
| Region at a glance | 4 cards |
| Depth along the reference | 2 advanced visualizations: the locus navigator and the mapping quality track |
| Window table (collapsed) | Windowed depth |
The navigator opens on the first contig
No contig name holds across references, so the navigator opens on the whole first contig of the data. A non-model reference has no built-in assembly: the contig list comes from the data and there is no gene lane.
Genome · How many variants did each sample yield, and how clean?
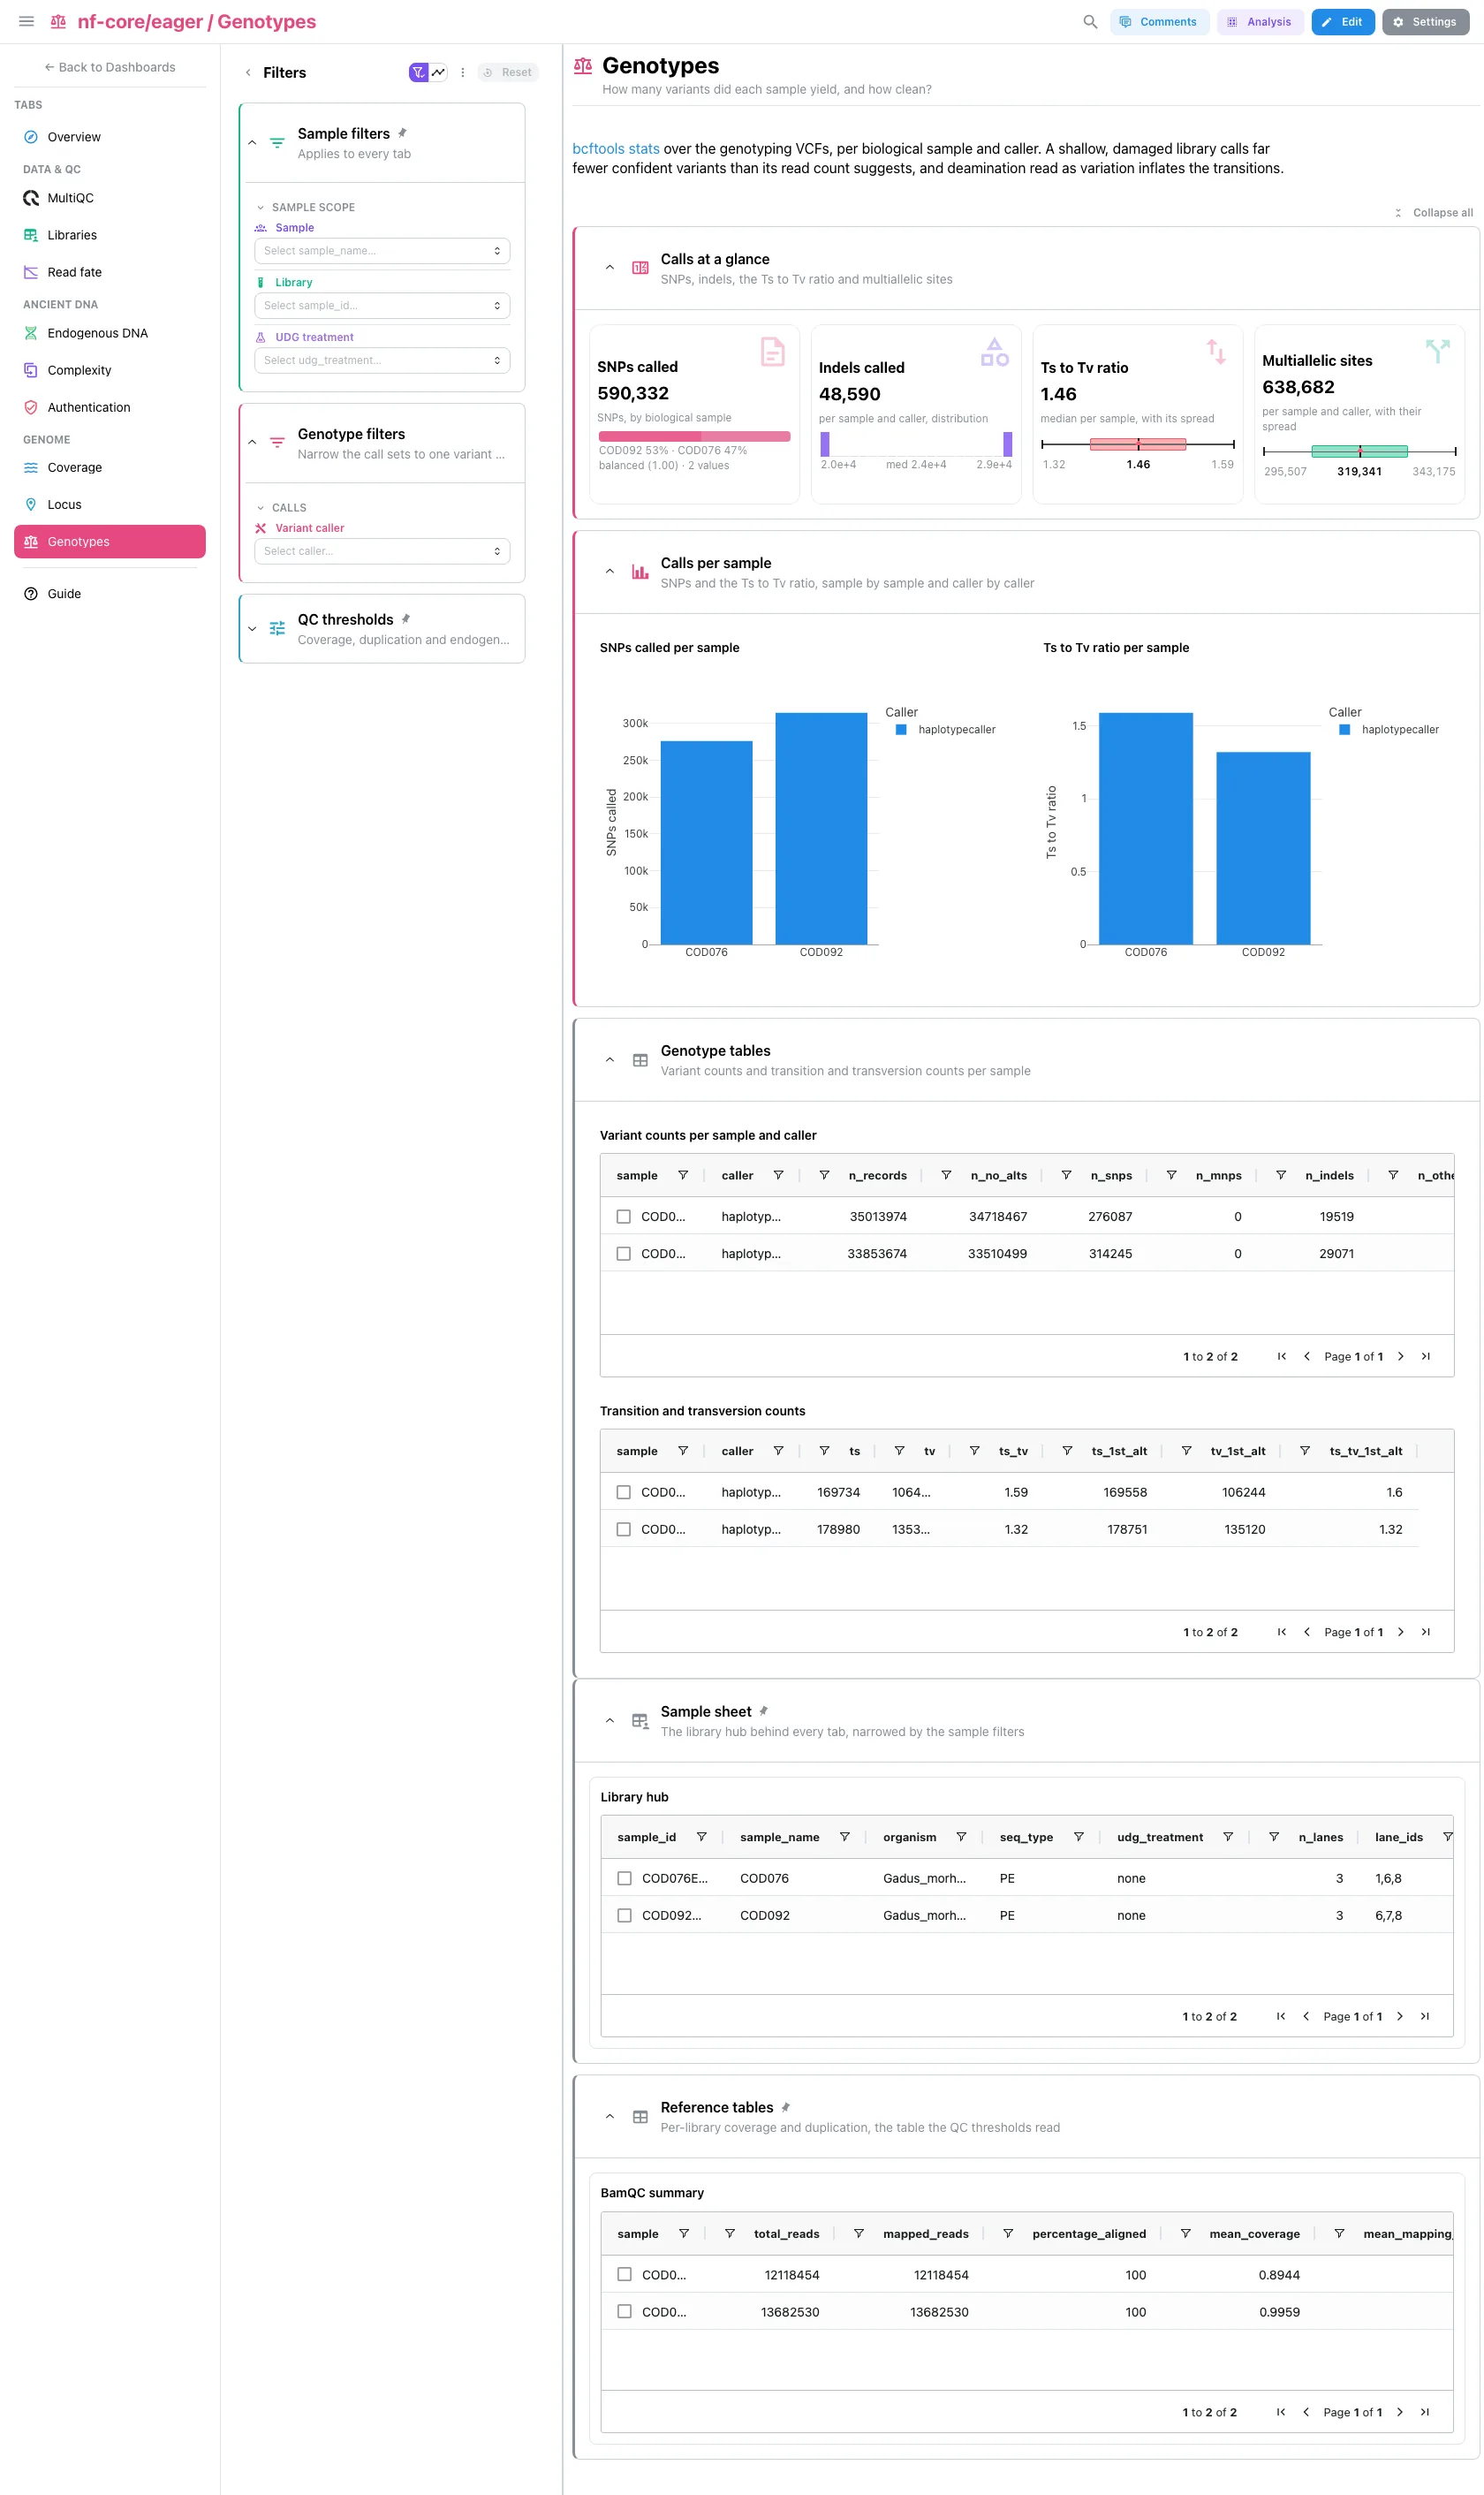
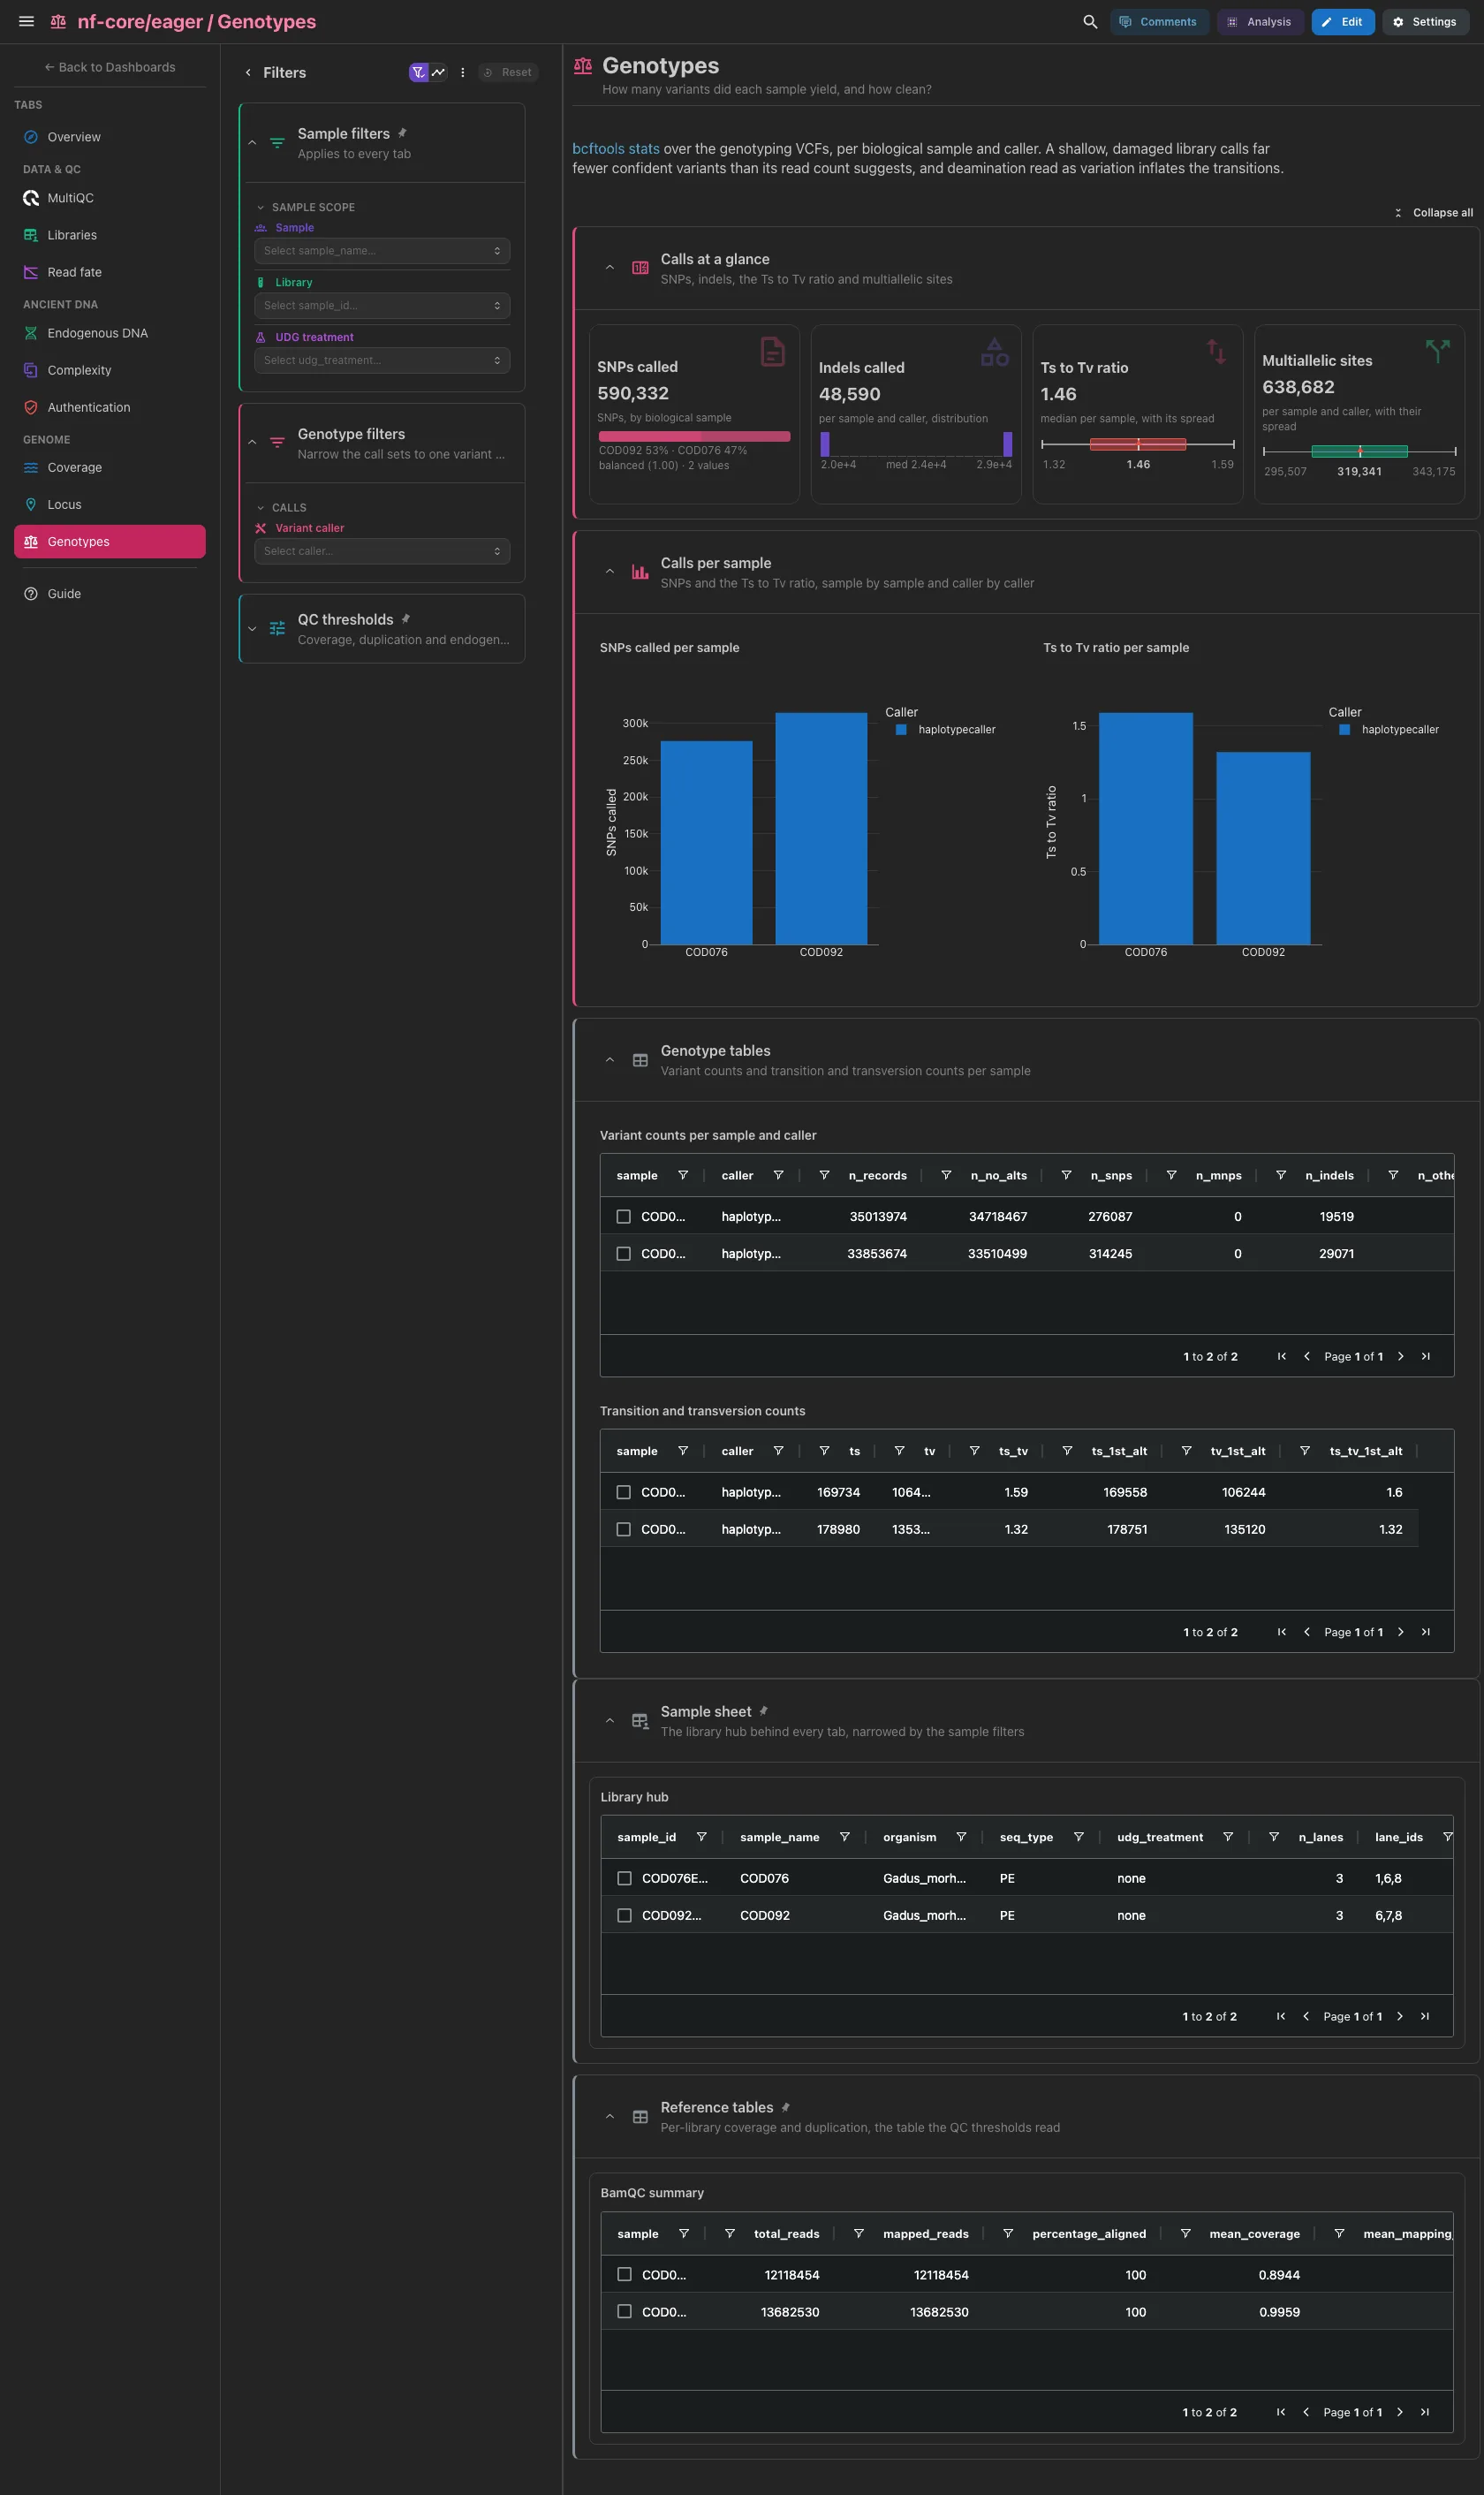
SNPs called split by sample, indels, the Ts to Tv ratio and multiallelic sites. The VCF record count is not a card: a VCF that emits reference sites counts them as records too. Then SNPs and the Ts to Tv ratio per sample, one bar per caller. bcftools reads the biological sample from the VCF header, not the library, so the hub carries both ids and links on both. A shallow, damaged library calls fewer confident variants than its read count suggests, and deamination read as variation inflates the transitions. The bcftools summary and Ts/Tv tables are collapsed.
Filters and components
Filters · Variant caller on bcftools_stats_summary.
| Section | What it holds |
|---|---|
| Calls at a glance | 4 cards |
| Calls per sample | SNPs called per sample, Ts to Tv ratio per sample |
| Genotype tables (collapsed) | Variant counts per sample and caller, Transition and transversion counts |
Tables and points select on their entity column: the pinned sample sheet on
sample_id and the BamQC reference table on sample; the lane table and the
collapse scatter on lane_id; the pooled library table, the read fate table and
every per-library table and scatter of the Ancient DNA and Genome tabs on
sample, as do the fragment length and genome fraction profiles. A pick narrows
the other tiles of its collection and follows the project links to the
collections they reach. The complexity curve and depth histogram profiles, the
coverage track, and the raw MaltExtract, Kraken, contamination and
Sex.DetERRmine tables do not select. The screening plane emits a selection, but
its collection has no outgoing link, so it narrows no other tile.
Running the pipeline
Depictio reads the output of nf-core/eager, it does not run the pipeline. Run the pipeline first:
nextflow run nf-core/eager -r 2.4.5 \
  --input libraries.tsv \
  --fasta reference.fa \
  -profile docker --outdir results
Then copy the TSV beside the results, regenerate the MultiQC report and point Depictio at them:
mkdir -p results/input && cp libraries.tsv results/input/
python -m depictio.dev_scripts.multiqc_reprocess --src results/ --dest results/
depictio ingest results/ --template nf-core/eager/latest
See nf-co.re/eager/usage for full pipeline documentation.
Required data structure
Point depictio ingest at the directory holding the pipeline output. Depictio scans
recursively and matches on file name, so a run with --dedupper dedup or a
different directory layout lands in the same collections.
<DATA_ROOT>/
├── input/*.tsv                                # the run's --input TSV (required, copied by hand)
├── pipeline_info/software_versions.csv
├── multiqc/multiqc_data/multiqc.parquet       # written by multiqc_reprocess
├── fastqc/{input_fastq,after_clipping}/zips/*_fastqc.zip
├── adapterremoval/output/*.settings
├── samtools/
│   ├── stats/*_flagstat.stats
│   └── filtered_stats/*_postfilterflagstat.stats
├── endorspy/*_endogenous_dna_mqc.json
├── deduplication/<library>/*_rmdup.metrics
├── preseq/*.filtered.preseq
├── damageprofiler/<library>_rmdup/
│   ├── *_freq_misincorporations.txt
│   └── *lgdistribution.txt
├── qualimap/<library>_rmdup_stats/
│   ├── genome_results.txt
│   └── raw_data_qualimapReport/*.txt          # coverage and mapping quality across the reference
├── bcftools/stats/*.vcf.stats
└── (optional branches, anywhere under the root)
    ├── *SexDet*.tsv                           # Sex.DetERRmine
    ├── *.mtnucratio                           # MTNucRatio
    ├── nuclear_contamination.txt              # ANGSD
    ├── heatmap_overview_Wevid.tsv             # MaltExtract (HOPS)
    └── *kraken{_parsed,_merged_report}.{csv,tsv}  # Kraken
Validation runs
The template was validated on the nf-core AWS megatest of the 2.4.5 release,
s3://nf-core-awsmegatests/eager/results-42c9d5f8602e5e88fdcec28f194d2cd4cff61c75/
(every 2.5.x prefix holds pipeline_info/ only), and the screenshots above come
from that run. The megatest did not enable sex determination, contamination
estimation or a metagenomic screen, so the import drops those tables. Its
samplesheet is not part of the results; the template ships a reconstructed one
under input/:
DEST=/tmp/eager_test
bash depictio/projects/nf-core/eager/2.4.5/download_test_data.sh "$DEST"
mkdir -p "$DEST/input" && cp depictio/projects/nf-core/eager/2.4.5/input/*.tsv "$DEST/input/"
python -m depictio.dev_scripts.multiqc_reprocess --src "$DEST" --dest "$DEST"
depictio ingest "$DEST" --template nf-core/eager/latest
Do not pass --project when ingesting: the dashboard is attached to the
project by name, so renaming it breaks a later depictio dashboard import.
Re-ingesting accumulates dashboards, so delete the project before repeating a run.
Additional resources
- nf-co.re/eager: official pipeline documentation
- nf-co.re/eager/2.4.5/results: AWS test results
- Template System Reference: YAML format, variables, conditionals
- Recipes: how to read, test, and write recipes
Authorship
 weber8thomas
Reviewing a template on your own data, or taking over a role here, is a contribution in itself: the contributing guide says what each one involves.