

The rnaseq template covers the default STAR + Salmon route of a standard nf-core/rnaseq run:
- Overview: the run in four key figures, live findings and four figures, each linked to the tab that explains it
- Data & QC: the MultiQC report, a per-library QC profile with the RSeQC read distribution, and the pipeline's own DESeq2 QC PCA beside the sample distances
- Expression: the 500 most variable genes, clustered, the most variable ones per condition, and a mean-variance plane with a record card per gene
The STAR + Salmon route
This template binds the pipeline default: STAR for alignment, Salmon for
quantification, with the merged matrices read from star_salmon/. A
--skip_alignment run writes the same file names under salmon/; pass
--var PSEUDOALIGNER_ONLY=true and the expression collections are repointed
there. The STAR, samtools, Picard, Qualimap and RSeQC tiles then have nothing
to show, and the RSeQC figure drops.
The condition comes from the sample name
The nf-core/rnaseq samplesheet is sample,fastq_1,fastq_2,strandedness and
has no condition column. A project-local recipe derives condition and
replicate from the <condition>_REP<n> names the pipeline's own test data
and docs use, because that is an nf-core/rnaseq convention rather than a
Salmon one. Names that do not follow it give one condition per sample, which
dulls the colouring but breaks nothing.
Quick start
The results directory is the only thing you have to pass. The samplesheet is
auto-detected from {DATA_ROOT}/input/; pass --var SAMPLESHEET_FILE=...
to point somewhere else.
depictio config nextflow --install     # once per machine
nextflow run nf-core/rnaseq -r 3.26.0 -profile docker --outdir results
No depictio ingest, and no template named: the pipeline ingests its own
output directory when it finishes and resolves this template from its own
manifest. See Nextflow trigger.
Ingest one aligner route, not the run root
A run that publishes more than one aligner (the nf-core megatest publishes
aligner_star_salmon/ and aligner_star_rsem/ side by side) writes a
complete output tree per route, each with its own multiqc/, star_salmon/
and salmon/. Point depictio ingest at one of those directories: at the
prefix root every scan becomes ambiguous between the routes, and the MultiQC
scan attaches whichever report the walk reached first. A normal
single-aligner run has no such split, so its results/ is already right.
Reference
The template reads one MultiQC report and one merged expression matrix. The
salmon catalog recipes reshape star_salmon/salmon.merged.gene_tpm.tsv into
one row per library (detection counts, median TPM), the 500 most variable genes
wide with the samplesheet annotation, one row per gene and sample, and one row
per expressed gene with its mean, spread and peak condition. The pipeline's
DESeq2 QC files, the RSeQC read distribution reports and the MultiQC general
statistics feed the Sample Space and Library QC tabs, and all three are
optional. The merged count matrix ships as rows only.
MultiQC 1.33 wrote this pipeline's report one directory deeper and with a
different suffix, multiqc/star_salmon/multiqc_report_data/ rather than
multiqc/multiqc_data/. The scan pattern is path-qualified but
aligner-agnostic: multiqc/, then an optional route directory (star_salmon/,
salmon/, or none), then either spelling of the data directory. A
--skip_alignment run, which writes multiqc/salmon/, therefore finds its
report too.
Self-adapting layout
The dashboard adapts to whatever the run actually produced: components bound
to pruned or unparsed data collections are hidden, tabs left with no real
visualizations are dropped entirely, and the remaining components are
re-packed so there are no empty rows. SKIP_MULTIQC and
SKIP_QUANTIFICATION_MERGE prune the QC and the expression side.
Template variables
Variables you provide when running the template: DATA_ROOT is the results directory given to depictio ingest, the others are set with --var NAME=value:
| Variable | Required | Description |
|---|---|---|
DATA_ROOT |
✓ | Root directory containing rnaseq pipeline output for one aligner route (multiqc/, star_salmon/, salmon/, trimgalore/) |
SAMPLESHEET_FILE |
— | Path to the rnaseq samplesheet (sample, fastq_1, fastq_2, strandedness). Auto-detected from {DATA_ROOT}/input/ (CSV or TSV) when omitted. |
PSEUDOALIGNER_ONLY |
— | Set (--var PSEUDOALIGNER_ONLY=true) for a --skip_alignment run: there is no star_salmon/, so the expression panels read the matrices under salmon/ instead. Matches the run's params.json skip_alignment. |
SKIP_MULTIQC |
— | Set (--var SKIP_MULTIQC=true) for a run with --skip_multiqc or --skip_qc. Prunes the MultiQC data collection: no report was written, so the QC tab has nothing to read. |
SKIP_QUANTIFICATION_MERGE |
— | Set (--var SKIP_QUANTIFICATION_MERGE=true) for a run with --skip_quantification_merge. The merged salmon.merged.gene_*.tsv matrices are absent, so every expression panel loses its source and only the QC tab survives. |
Data collections
12 data collections — 7 required 5 optional · 11 direct 1 derived.
Origin tells you whether a collection is real pipeline data or a reshape of it: direct = a pipeline output (scanned, or a recipe that reads raw files); derived = a recipe that reshapes one or more direct collections into the layout a visualization needs (no new measurement). Reads shows what produces it: a recipe .py transform, whose name links to its source on GitHub, or a raw file scanned off disk. (A direct collection can still have a recipe — one that merely parses/cleans the raw file; derived means the recipe reshapes another collection.)
| Tag | Origin | Type | Reads | Status |
|---|---|---|---|---|
multiqc_data |
direct |  MultiQC MultiQC |
file (?:.*/)?multiqc(?:/[^/]+)?/multiqc(?:_report)?_data/multiqc.parquet$ |
required |
samplesheet |
direct | Table | recipe nf-core/rnaseq/samplesheet.py |
required |
sample_overview |
direct | Table | recipe salmon/sample_pca.py |
required |
expression_heatmap |
direct | Table | recipe salmon/top_variable_genes.py |
required |
gene_expression |
direct | Table | recipe salmon/gene_expression_long.py |
required |
deseq2_qc_pca |
direct | Table | recipe deseq2/qc_pca.py |
optional |
deseq2_qc_dists |
direct | Table | recipe deseq2/qc_sample_dists.py |
optional |
rseqc_read_distribution_raw |
direct | Table | file .*.read_distribution.txt$ |
optional |
rseqc_read_distribution |
derived | Table | recipe rseqc/read_distribution.py |
optional |
general_stats |
direct | Table | recipe nf-core/rnaseq/general_stats.py |
optional |
gene_summary |
direct | Table | recipe nf-core/rnaseq/gene_summary.py |
required |
gene_counts |
direct | Table | file {DATA_ROOT}/star_salmon/salmon.merged.gene_counts.tsv |
required |
Conditional routes
Rows are data collections; columns are the variables you set or params.json flags auto-detected from the run. Each filled cell is the effect of setting that variable; an empty cell means that variable leaves the collection unchanged. (3 collections are unaffected by any variable — present on every run.)
+ included− removed⇄ repointed
| Data collection | SKIP_MULTIQC |
SKIP_QUANTIFICATION_MERGE |
PSEUDOALIGNER_ONLY |
|---|---|---|---|
multiqc_data |
− | ||
sample_overview |
− | ⇄ | |
expression_heatmap |
− | ⇄ | |
gene_expression |
− | ⇄ | |
deseq2_qc_pca |
⇄ | ||
deseq2_qc_dists |
⇄ | ||
general_stats |
− | ||
gene_summary |
− | ⇄ | |
gene_counts |
− | ⇄ |
Cross-DC links
24 links — selecting a value in the source collection filters the target. The join column is shown after the source.
| Source · column | Target | Filters | |
|---|---|---|---|
samplesheet · sample |
→ | multiqc_data |
Filter the MultiQC panels by samplesheet selection |
samplesheet · sample |
→ | sample_overview |
Filter the sample overview by samplesheet selection |
samplesheet · sample |
→ | gene_expression |
Filter the gene explorer by samplesheet selection |
samplesheet · sample |
→ | expression_heatmap |
Narrow the expression heatmap to the selected samples (column subset on a wide matrix) |
samplesheet · sample |
→ | gene_counts |
Narrow the merged count matrix to the selected samples (column subset on a wide matrix) |
samplesheet · sample |
→ | deseq2_qc_pca |
Filter the DESeq2 QC PCA by samplesheet selection |
samplesheet · sample |
→ | deseq2_qc_dists |
Narrow the DESeq2 QC distance matrix to the selected samples, rows and columns |
samplesheet · sample |
→ | rseqc_read_distribution |
Filter the read distribution composition by samplesheet selection |
sample_overview · sample_id |
→ | gene_expression |
Filter the gene explorer by the samples picked in the library summary table |
sample_overview · sample_id |
→ | expression_heatmap |
Narrow the expression heatmap to the samples picked in the PCA (column subset) |
sample_overview · sample_id |
→ | deseq2_qc_pca |
Filter the DESeq2 QC PCA by the samples picked in the library summary table |
sample_overview · sample_id |
→ | deseq2_qc_dists |
Narrow the DESeq2 QC distance matrix to the samples picked in the library summary table |
sample_overview · sample_id |
→ | rseqc_read_distribution |
Filter the read distribution composition by the samples picked in the library summary table |
samplesheet · sample |
→ | general_stats |
Filter the per-library QC profile by samplesheet selection |
sample_overview · sample_id |
→ | general_stats |
Filter the per-library QC profile by the samples picked in the library summary table |
gene_summary · gene_id |
→ | gene_expression |
Filter the gene explorer to the genes picked on the mean-variance plane |
sample_overview · sample_id |
→ | multiqc_data |
Filter the MultiQC panels by the samples picked in the library summary table |
deseq2_qc_pca · sample_id |
→ | sample_overview |
Narrow the library summary to the samples picked on the DESeq2 QC PCA |
deseq2_qc_pca · sample_id |
→ | gene_expression |
Narrow the gene explorer to the samples picked on the DESeq2 QC PCA |
deseq2_qc_pca · sample_id |
→ | expression_heatmap |
Narrow the top variable gene heatmap (column subset) to the samples picked on the DESeq2 QC PCA |
deseq2_qc_pca · sample_id |
→ | deseq2_qc_dists |
Narrow the DESeq2 QC distance matrix to the samples picked on the DESeq2 QC PCA |
deseq2_qc_pca · sample_id |
→ | rseqc_read_distribution |
Narrow the read distribution composition to the samples picked on the DESeq2 QC PCA |
deseq2_qc_pca · sample_id |
→ | general_stats |
Narrow the per-library QC profile to the samples picked on the DESeq2 QC PCA |
deseq2_qc_pca · sample_id |
→ | multiqc_data |
Filter the MultiQC panels by the samples picked on the DESeq2 QC PCA |
Recipes
Each recipe reshapes raw pipeline output into a tidy table. The name links to its source; Output lists the validated OUTPUT_SCHEMA columns.
| Recipe | Transforms | Output |
|---|---|---|
deseq2/qc_pca.py |
The DESeq2 QC PCA the pipeline already computed, read rather than recomputed. | sample_id, dim_1, dim_2, dim_1_percent, dim_2_percent, pca_set |
deseq2/qc_sample_dists.py |
The DESeq2 QC sample-distance matrix the pipeline already computed. | sample |
nf-core/rnaseq/gene_summary.py |
nf-core/rnaseq genes as one row each: how much, how variable, where highest. | gene_id, gene_name, mean_log2_tpm, sd_log2_tpm, max_tpm, top_sample, top_condition, log2fc_top_vs_rest, libraries_detected |
nf-core/rnaseq/general_stats.py |
nf-core/rnaseq MultiQC general statistics as one row per library. | sample, condition, total_reads_m, pct_trimmed, pct_gc, pct_uniquely_mapped, pct_salmon_mapped, pct_duplication, dupradar_intercept, pct_exonic, bias_5_3, error_rate, insert_size |
nf-core/rnaseq/samplesheet.py |
nf-core/rnaseq samplesheet with the condition and replicate it encodes. | sample, condition, replicate, read_type |
rseqc/read_distribution.py |
Where a library's reads land on the annotation, from RSeQC read_distribution. | sample_id, rank, taxon, region_class, tag_count, abundance |
salmon/gene_expression_long.py |
Merged Salmon TPMs as one long row per gene and sample, for a gene explorer. | gene_id, gene_name, sample, tpm, log2_tpm, group |
salmon/sample_pca.py |
Sample PCA of a merged Salmon TPM matrix, plus the per-sample library summary. | sample_id, dim_1, dim_2, group, genes_detected, genes_expressed, median_tpm |
salmon/top_variable_genes.py |
Top variable genes of a merged Salmon TPM matrix, for ComplexHeatmap. | gene_name |
Dashboard tabs
One dashboard: the Overview, then five child tabs in two groups, read as a funnel from the run to the genes that vary between conditions. Each tab below carries the same icon and colour the dashboard gives it, so the page and the app read alike.
| Group | Tabs |
|---|---|
| Data & QC | MultiQC, Library QC, Sample Space |
| Expression | Variable Genes, Gene Explorer |
Each child tab opens with a short intro and a strip of four cards, then at most three open sections; tables and details follow, collapsed. The persistent Sample filters (condition, sample, replicate) sit in the left panel and narrow every tab through the samplesheet links. The Sample sheet is pinned, collapsed, to the bottom of every child tab. nf-core/rnaseq runs no differential test: the gene numbers are rankings, by spread across the libraries or by the lead of one condition, and every tile that shows one says so.
Bulk RNA-seq, from reads to the genes that vary between conditions.
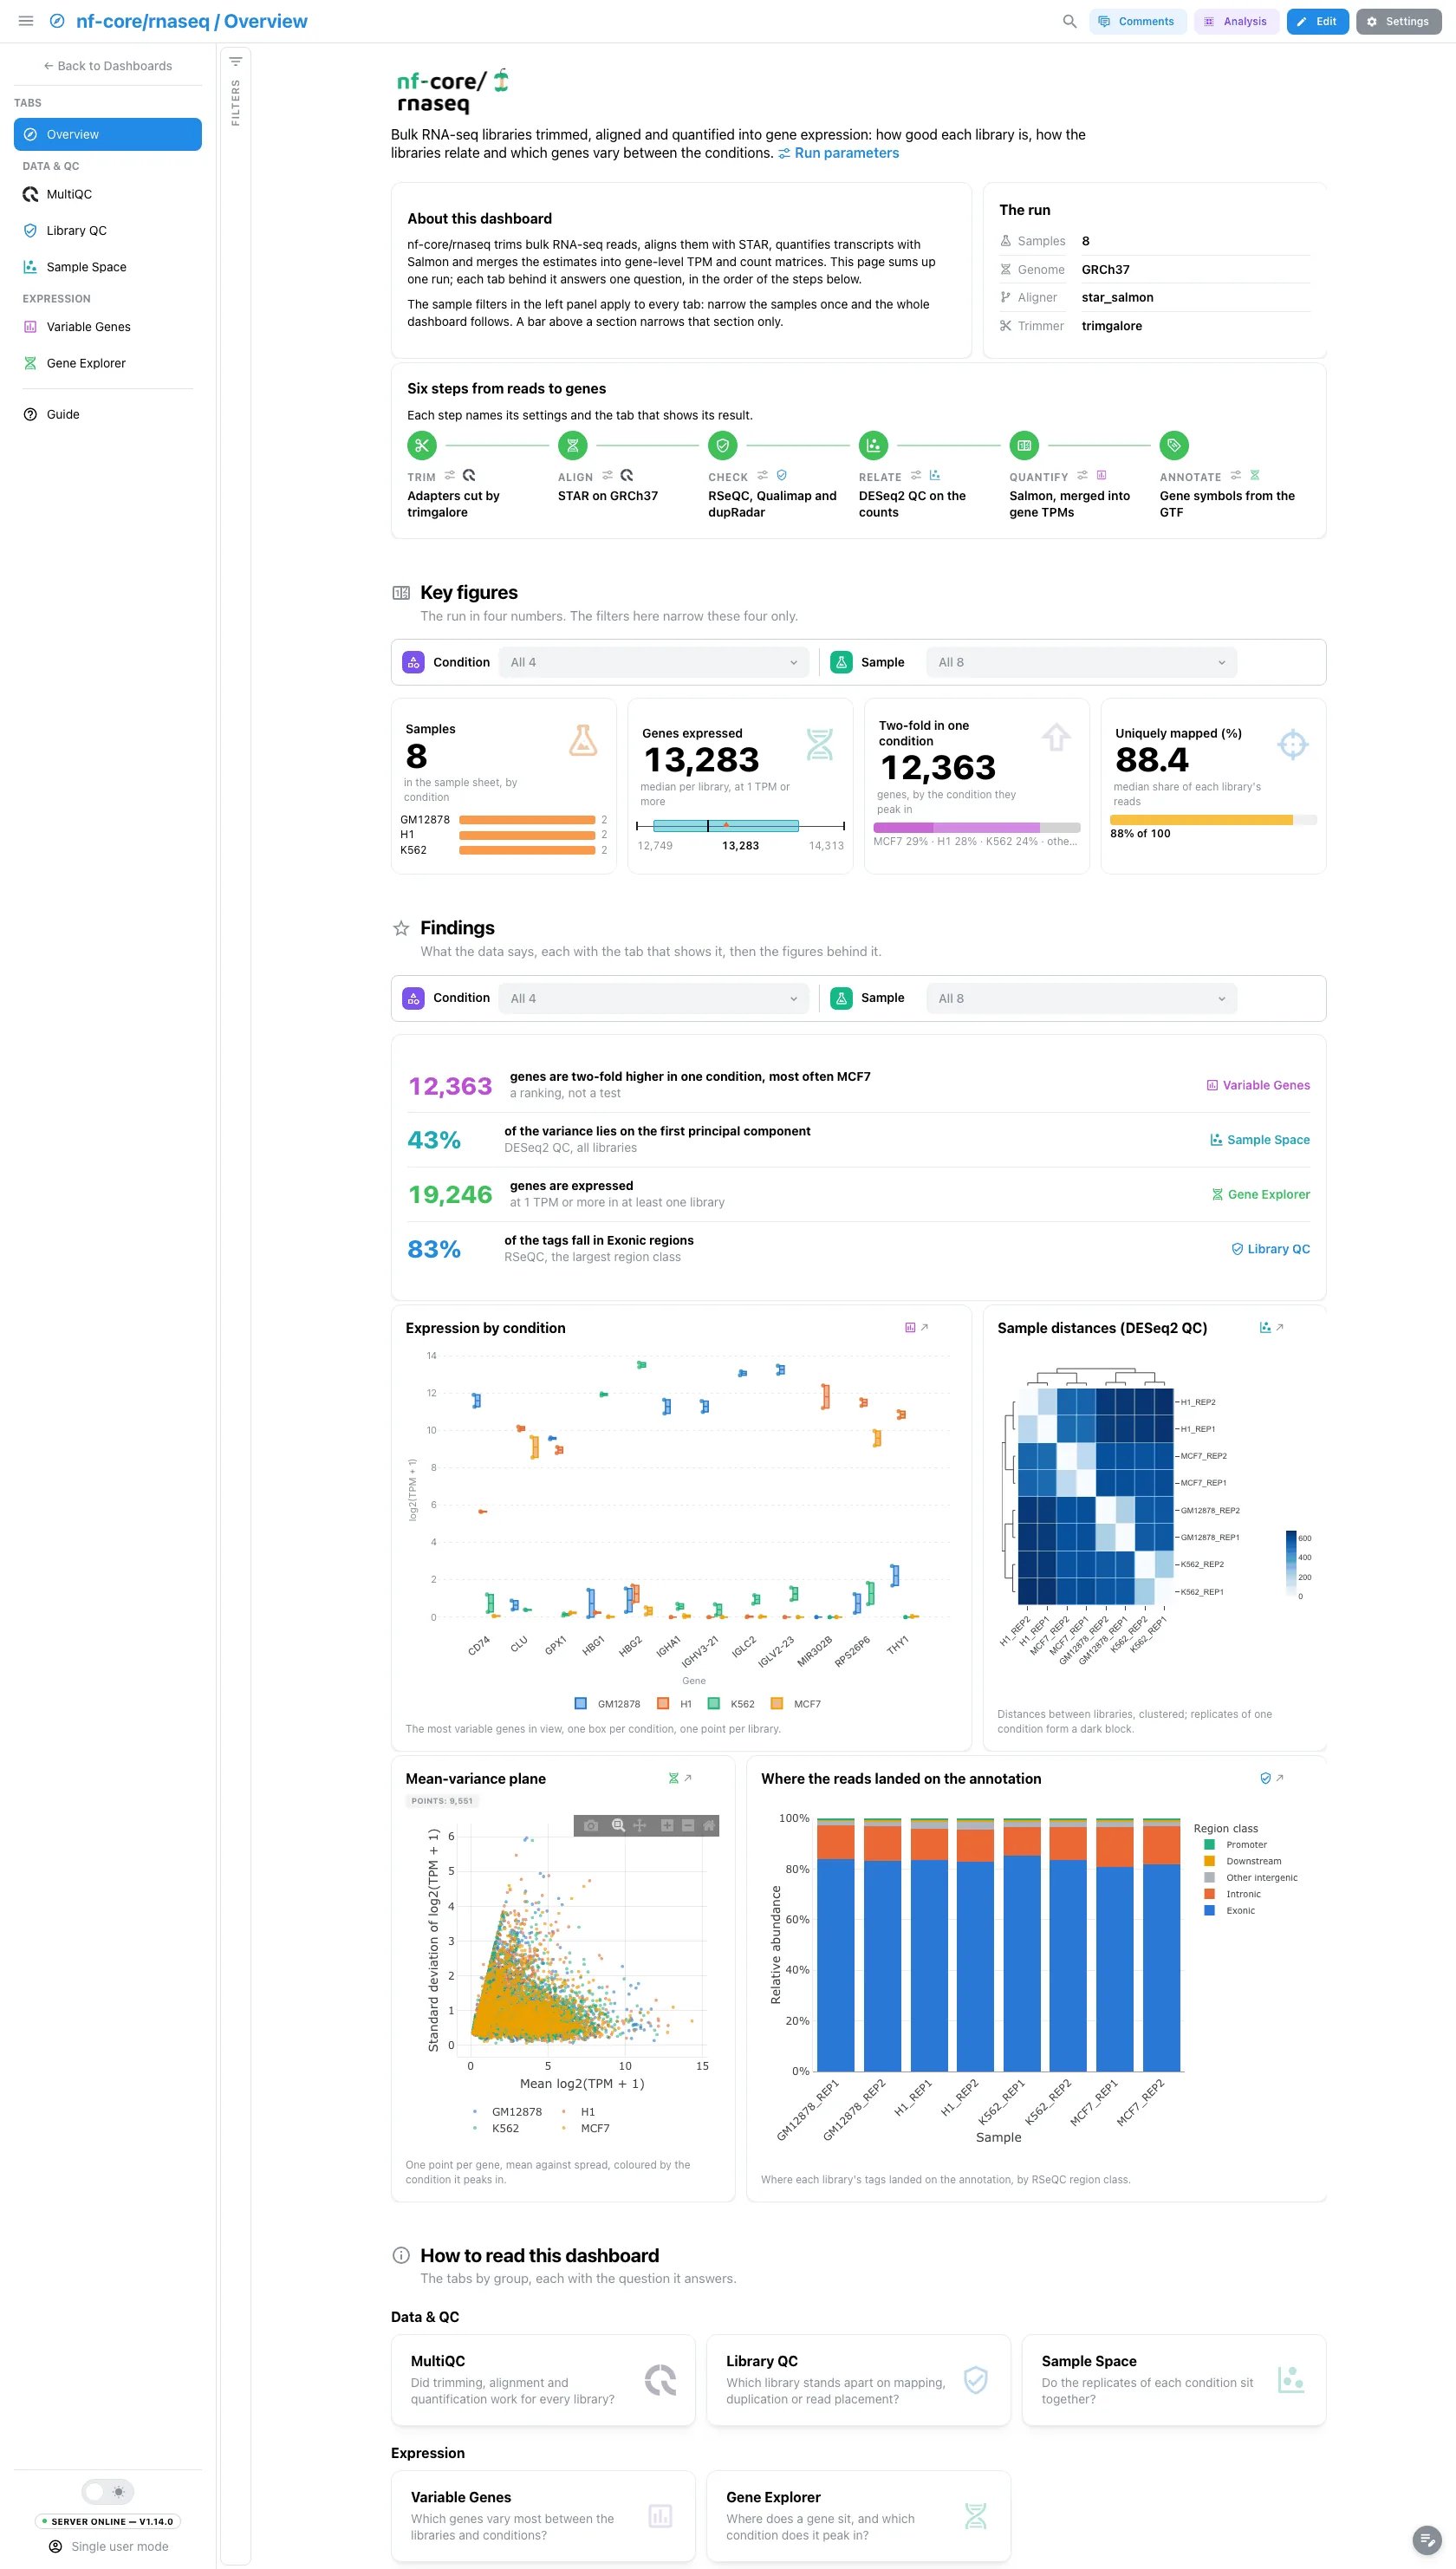
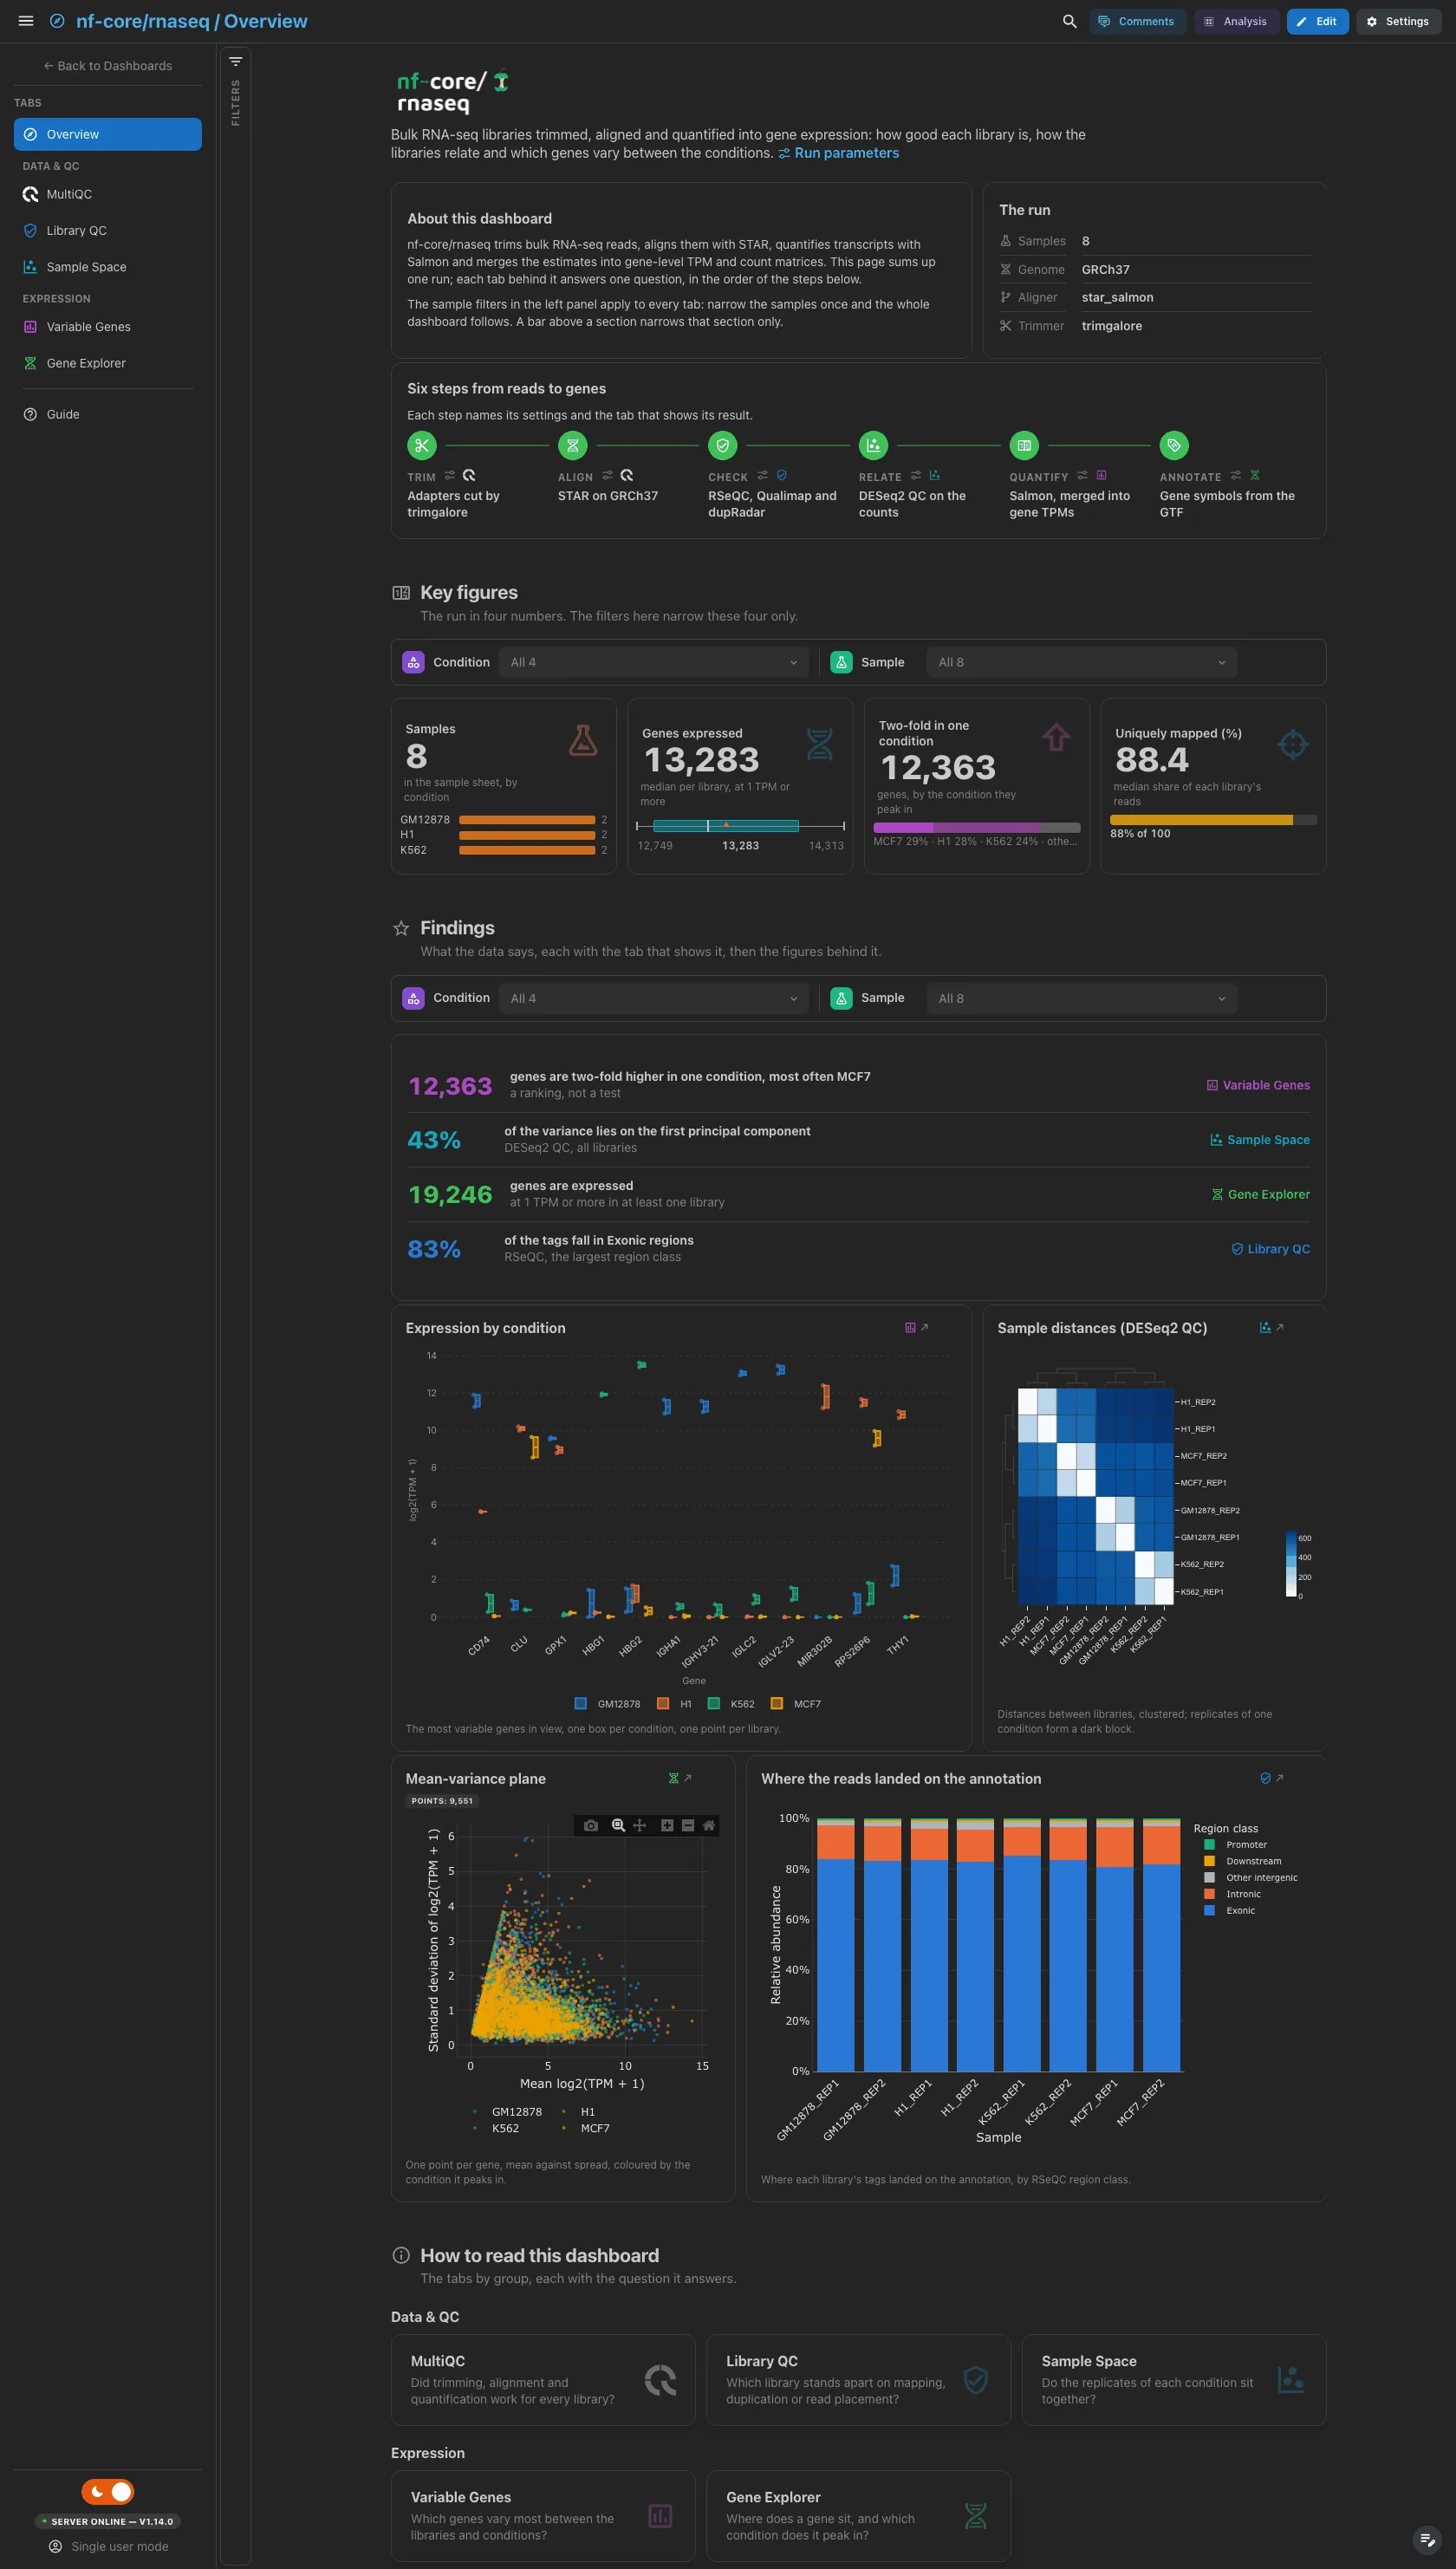
A short hero links the run parameters. About this dashboard says how to move through the tabs, The run lists the samples, genome, aligner and trimmer, and Pipeline walks the six steps from trimming to annotation, each linked to its parameters and its tab. The findings are live values: they follow the filters, and a route that lacks their data drops them.
Filters and components
Filters · the left panel starts collapsed. Key figures and Findings each have their own filter bar (condition and sample id): each narrows its own section only.
| Section | What it holds |
|---|---|
| Top | Hero, About this dashboard, The run, Pipeline |
| Key figures | 4 headline cards: samples, genes expressed, genes two-fold in one condition, uniquely mapped share |
| Findings | Live result rows, then 4 figures: the most variable genes per condition, the clustered sample distances, the mean-variance plane and the RSeQC read distribution |
| How to read this dashboard | The tabs by group, each with its question |
Data & QC · Did trimming, alignment and quantification work for every library?
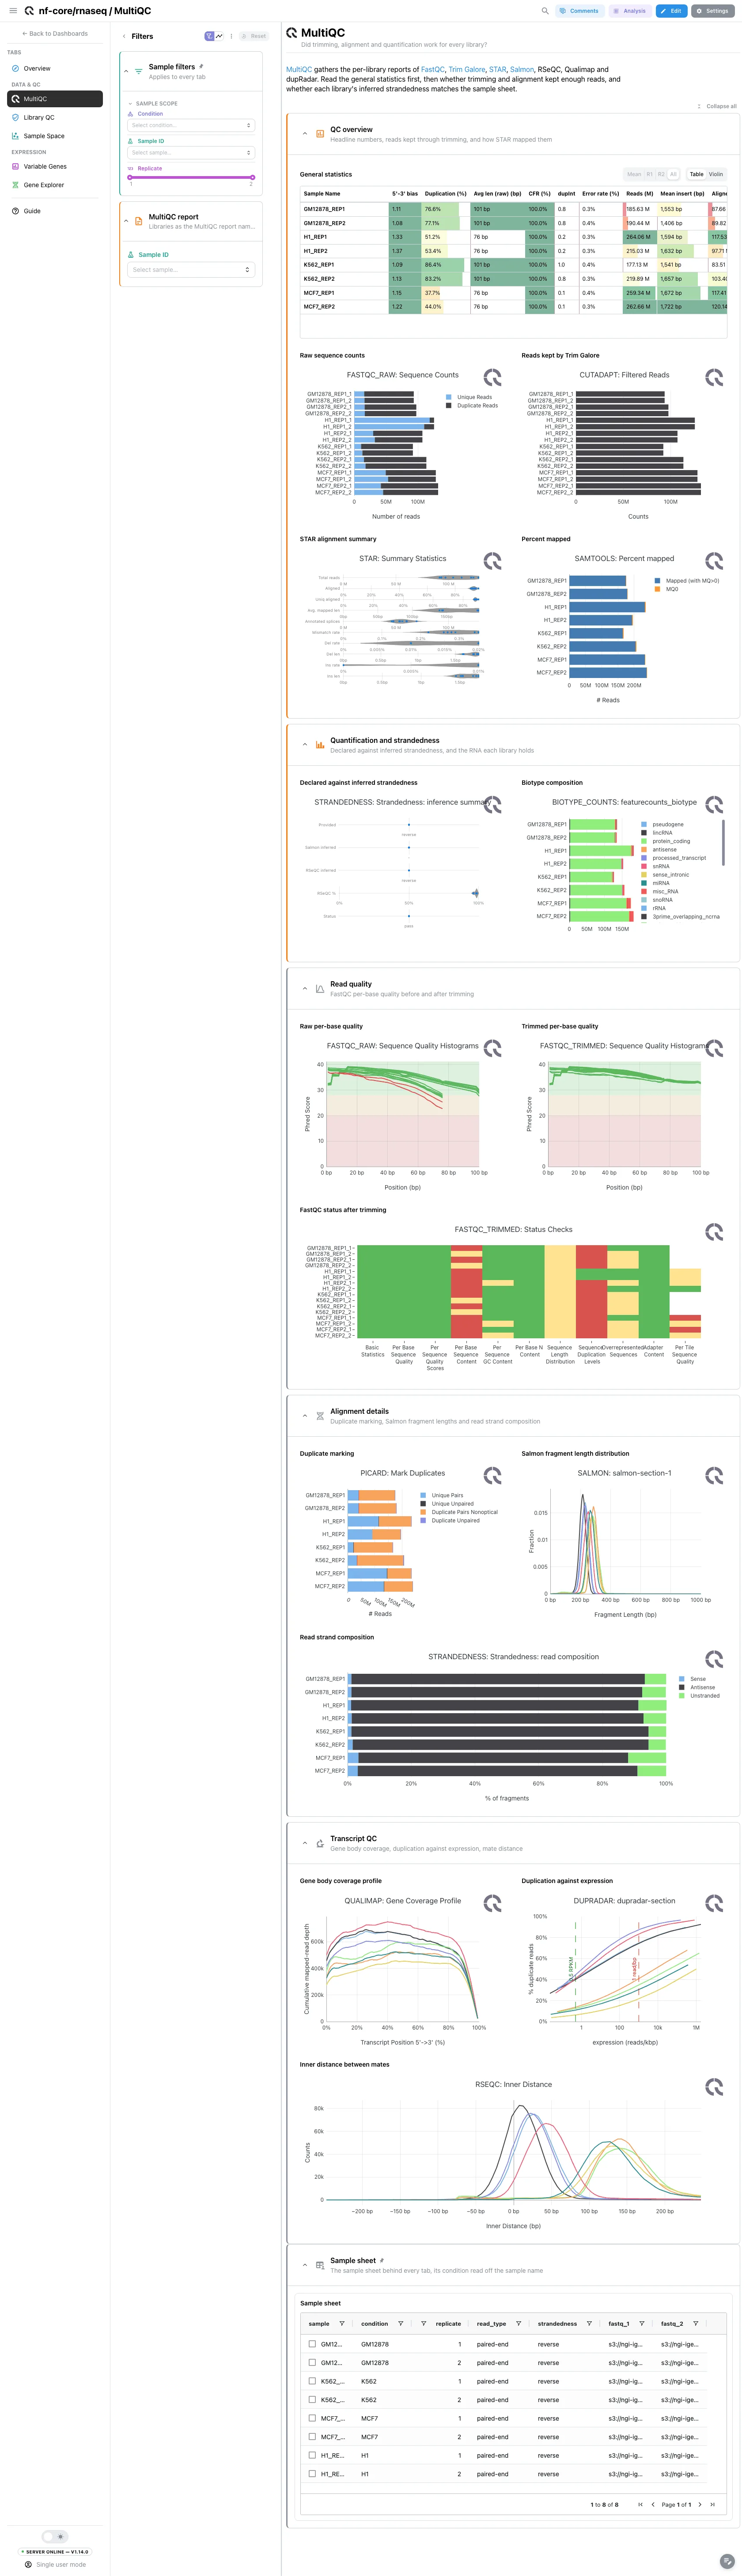
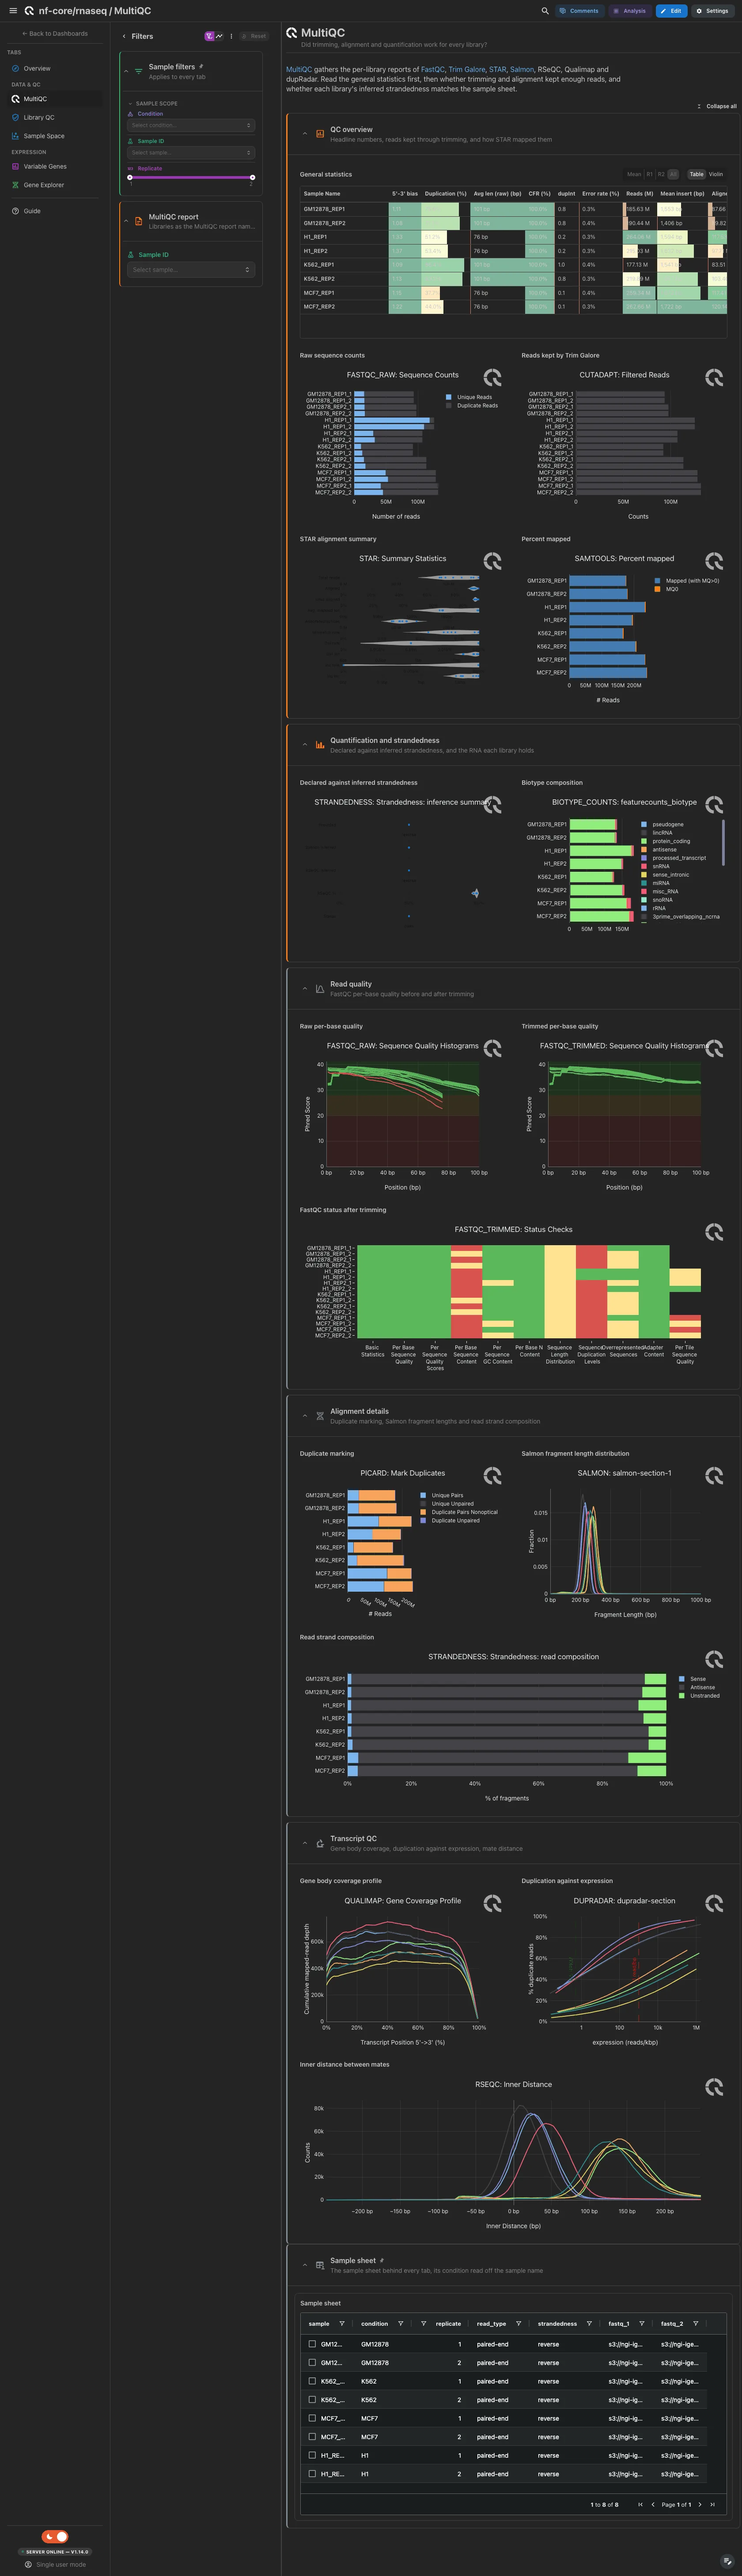
MultiQC panels only. Open: general statistics, the raw read counts beside the reads Trim Galore kept, STAR's summary beside samtools percent mapped, then the strandedness inference beside the biotype composition. A library whose inferred strandedness disagrees with the sheet was quantified against the wrong library type. Read quality, alignment details and transcript QC are collapsed.
Filters and components
Filters · Sample ID, read from the MultiQC report.
| Section | What it holds |
|---|---|
| QC overview | 5 MultiQC panels |
| Quantification and strandedness | 2 MultiQC panels |
| Read quality (collapsed) | 3 MultiQC panels |
| Alignment details (collapsed) | 3 MultiQC panels |
| Transcript QC (collapsed) | 3 MultiQC panels |
Data & QC · Which library stands apart on mapping, duplication or read placement?
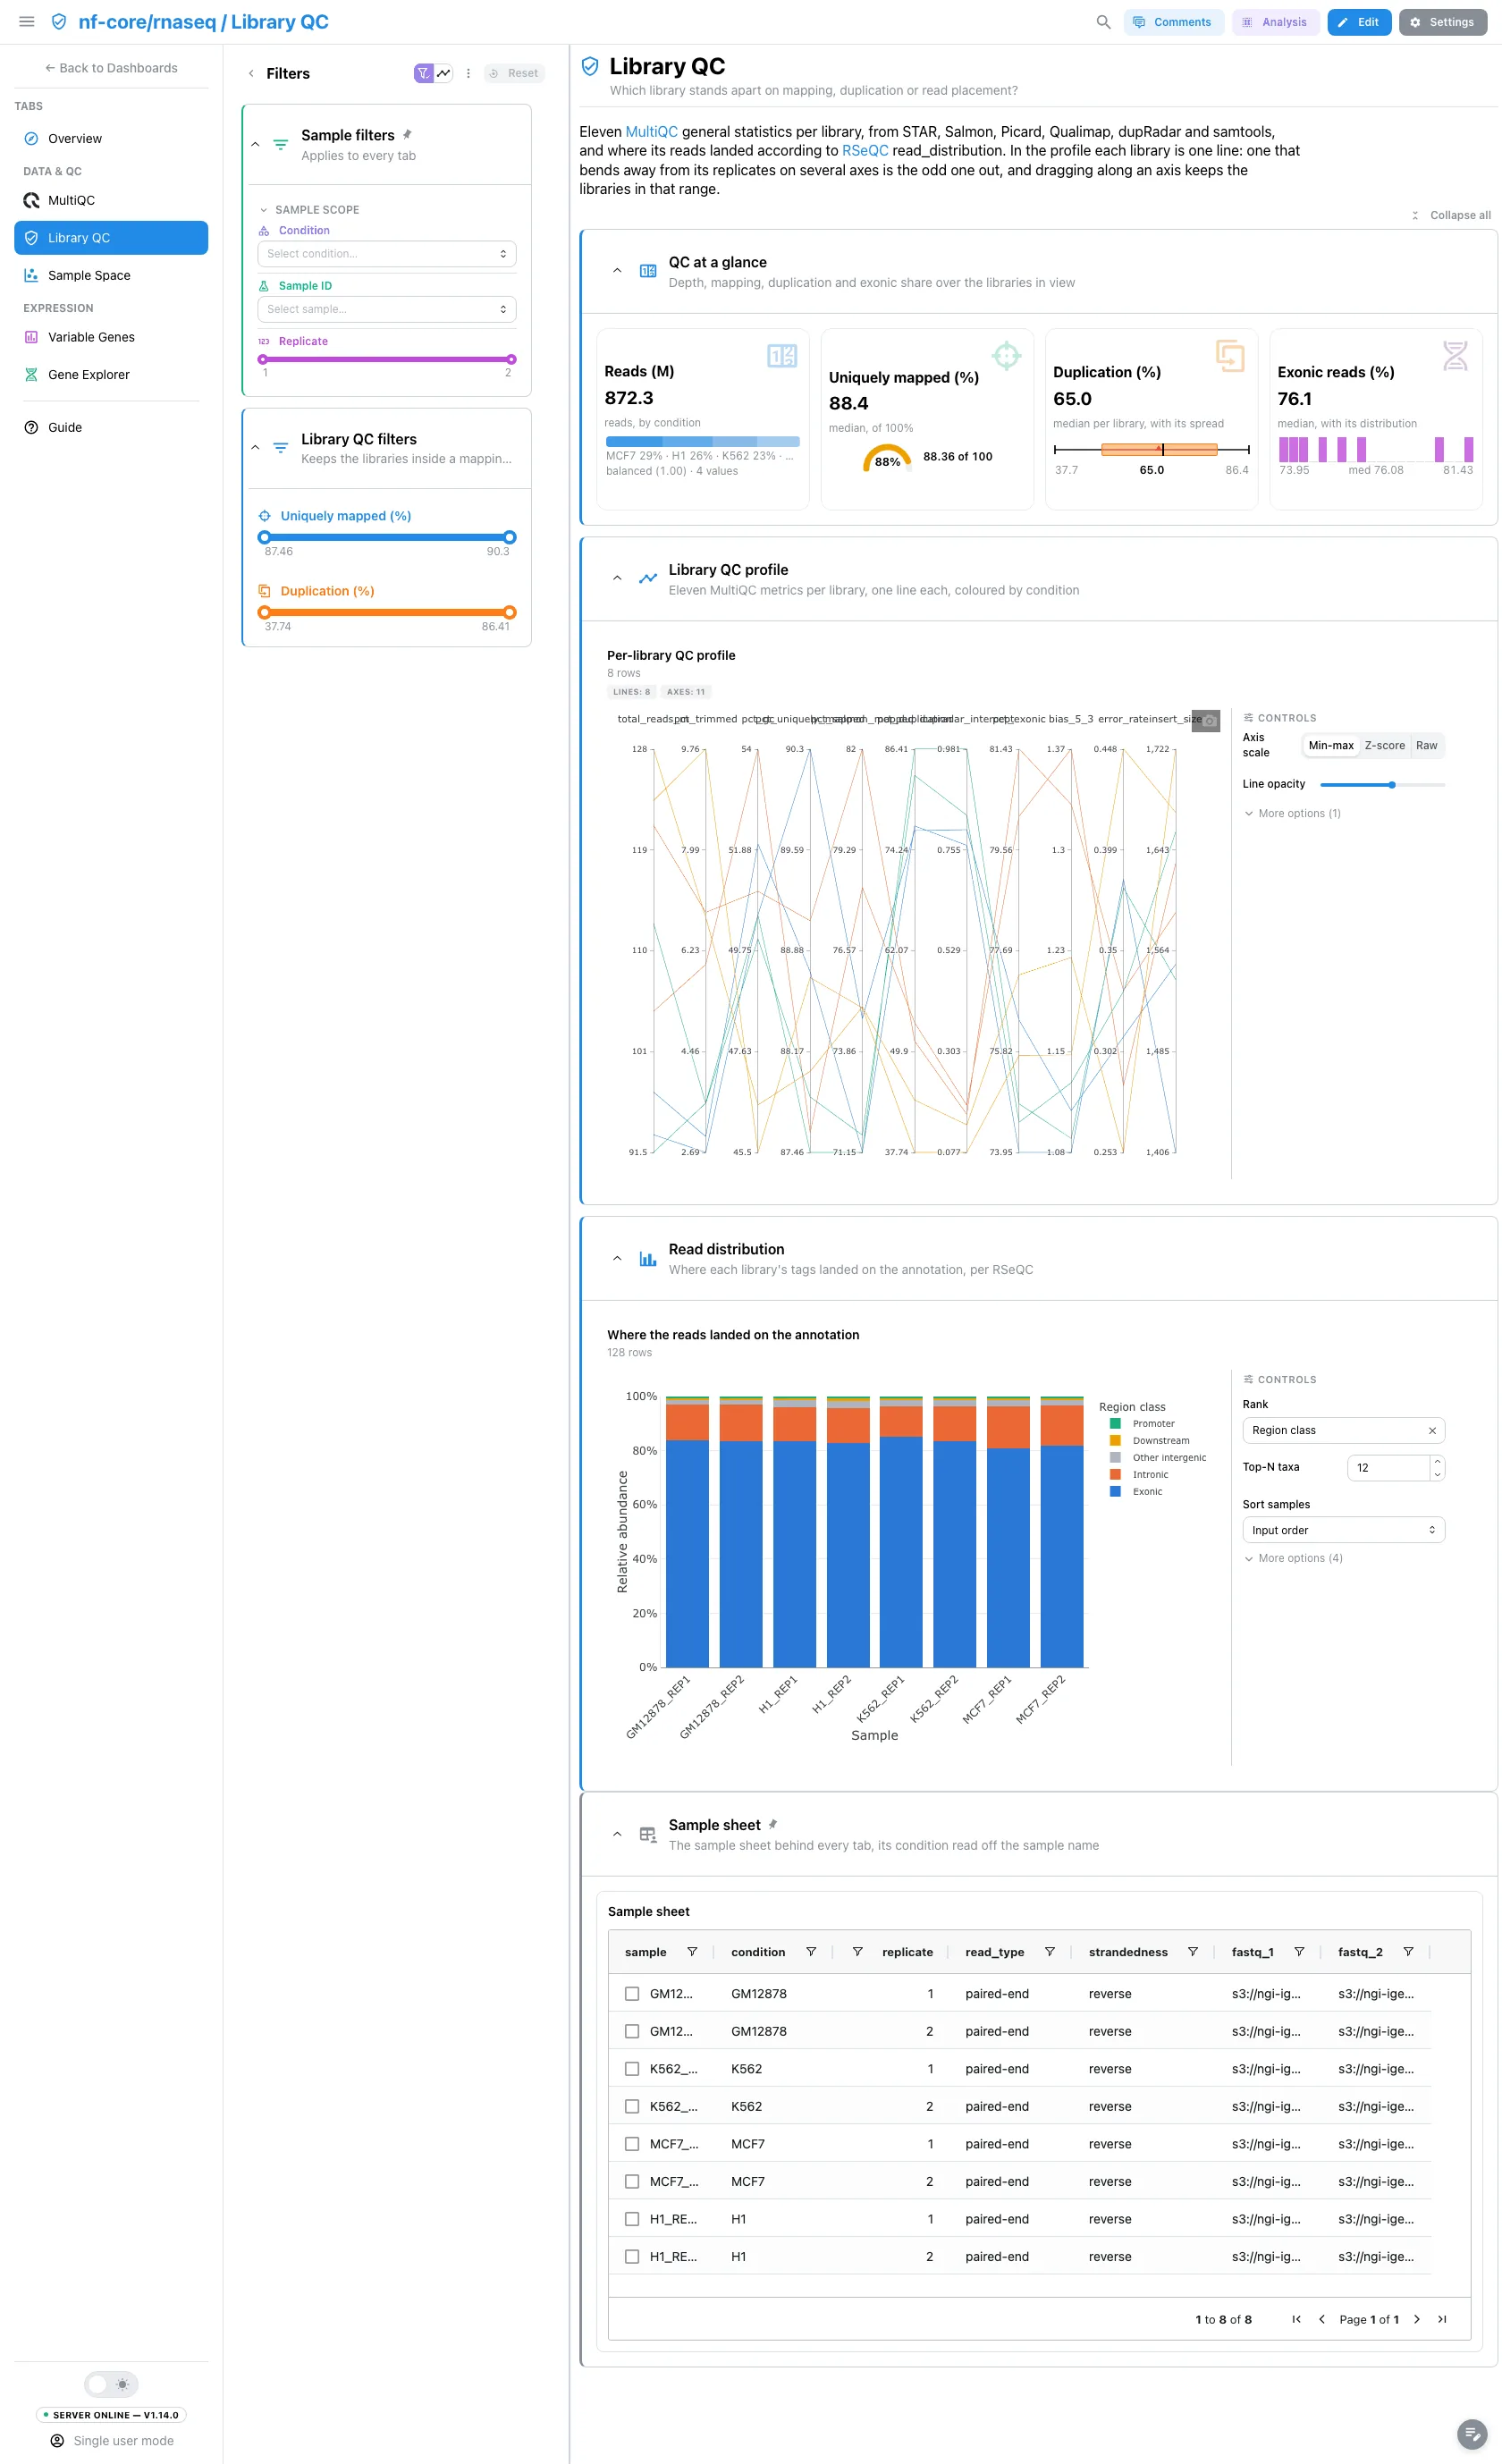
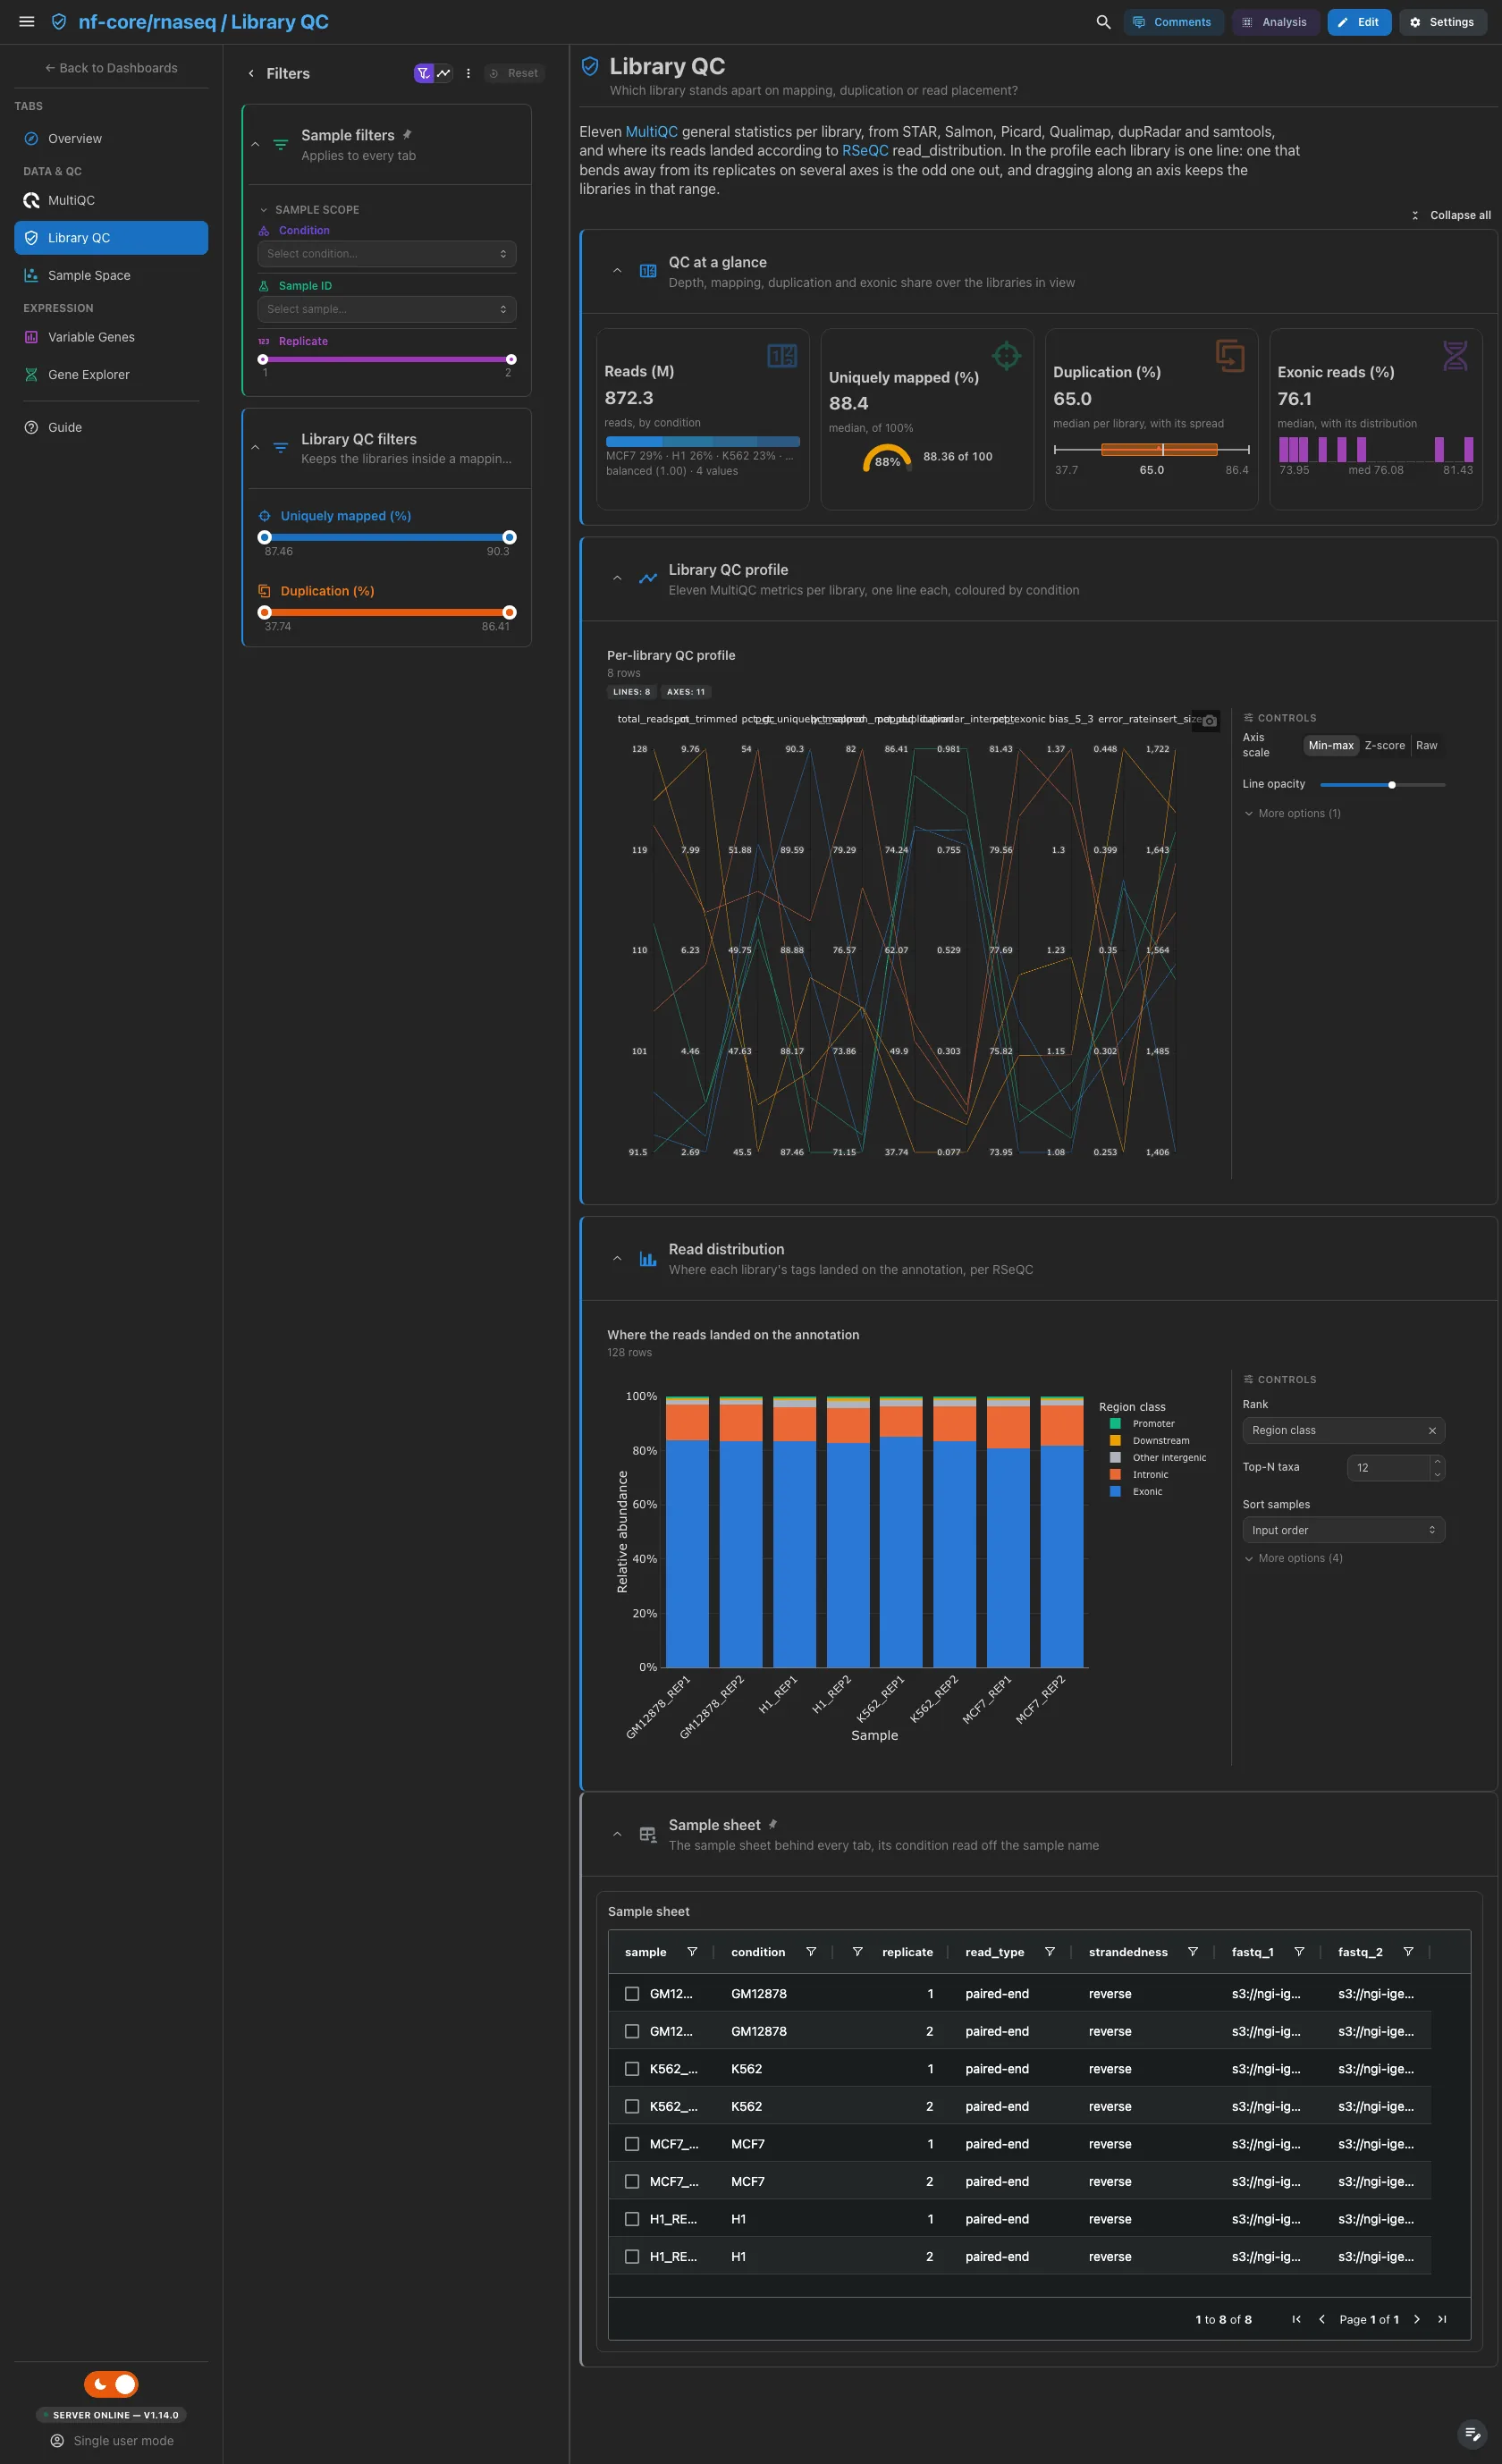
Reads received by STAR, the uniquely mapped share on a gauge, the duplication share and the exonic share. Then eleven MultiQC general statistics as parallel coordinates, one line per library coloured by condition, and the RSeQC read distribution per library. A library that bends away from its replicates on several axes is the odd one out.
Filters and components
Filters · Uniquely mapped (%) and Duplication (%) ranges on
general_stats.
| Section | What it holds |
|---|---|
| QC at a glance | 4 cards |
| Library QC profile | 1 advanced visualization |
| Read distribution | 1 advanced visualization |
Data & QC · Do the replicates of each condition sit together?
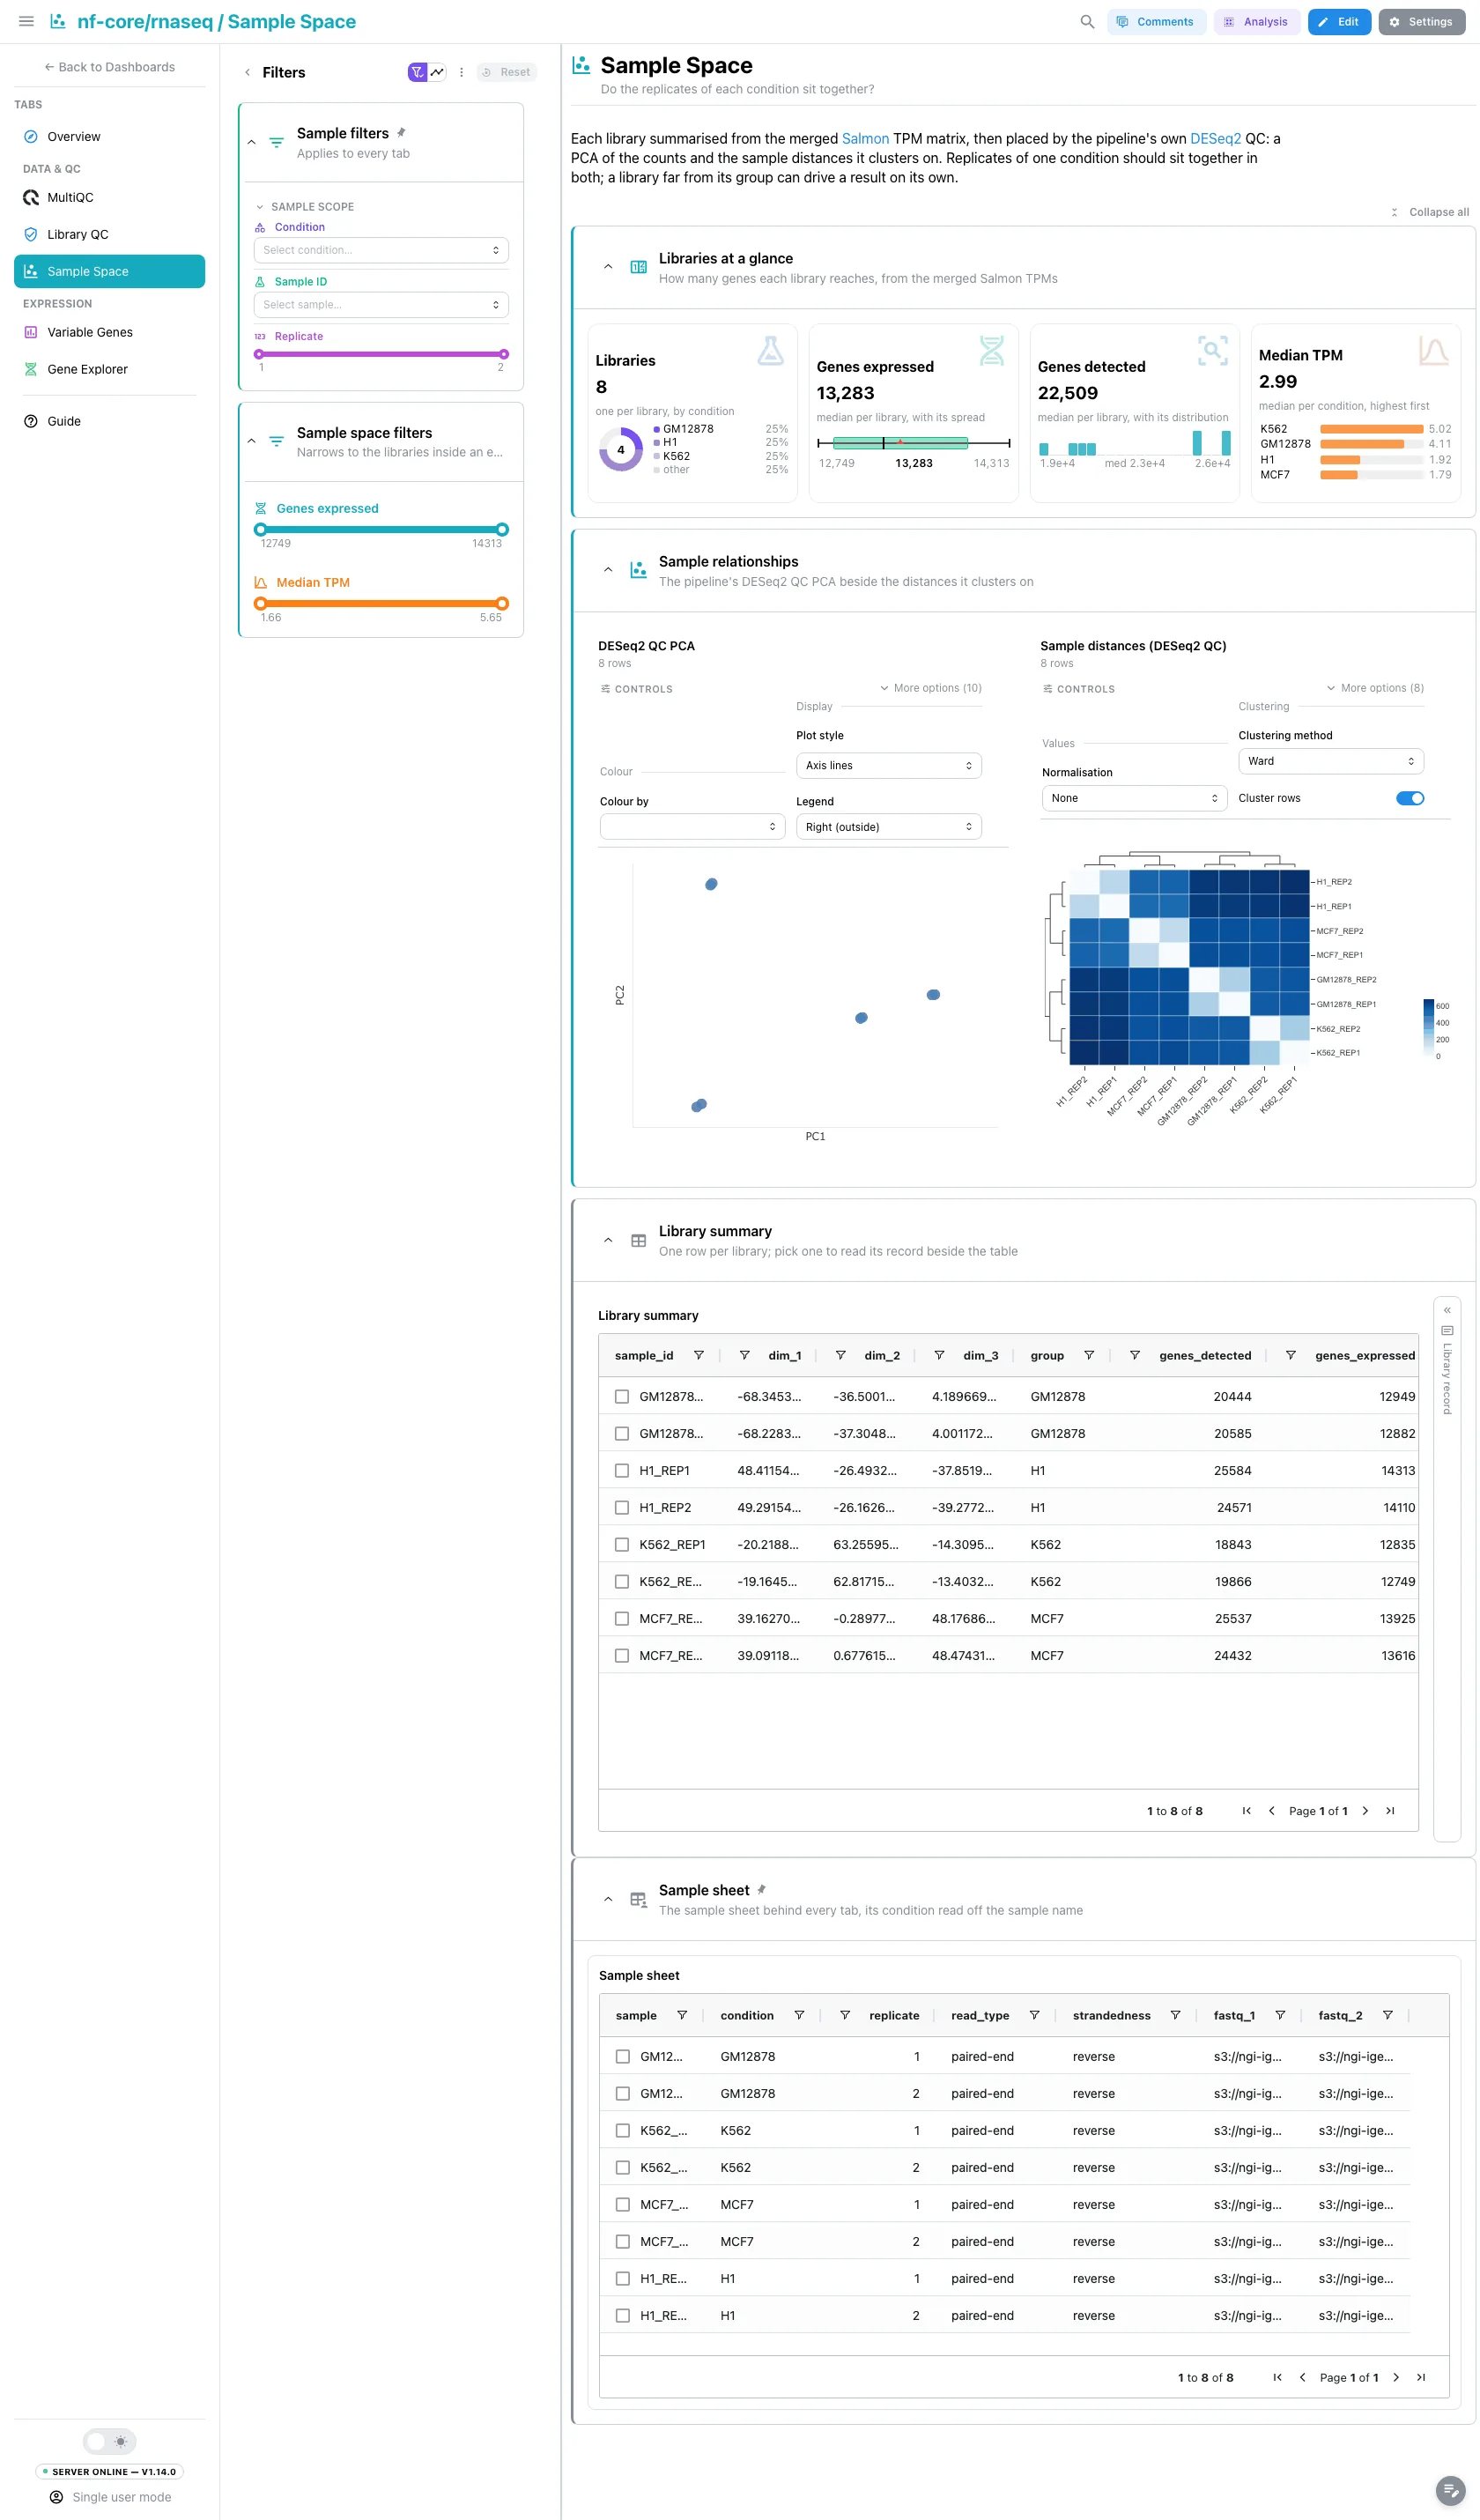
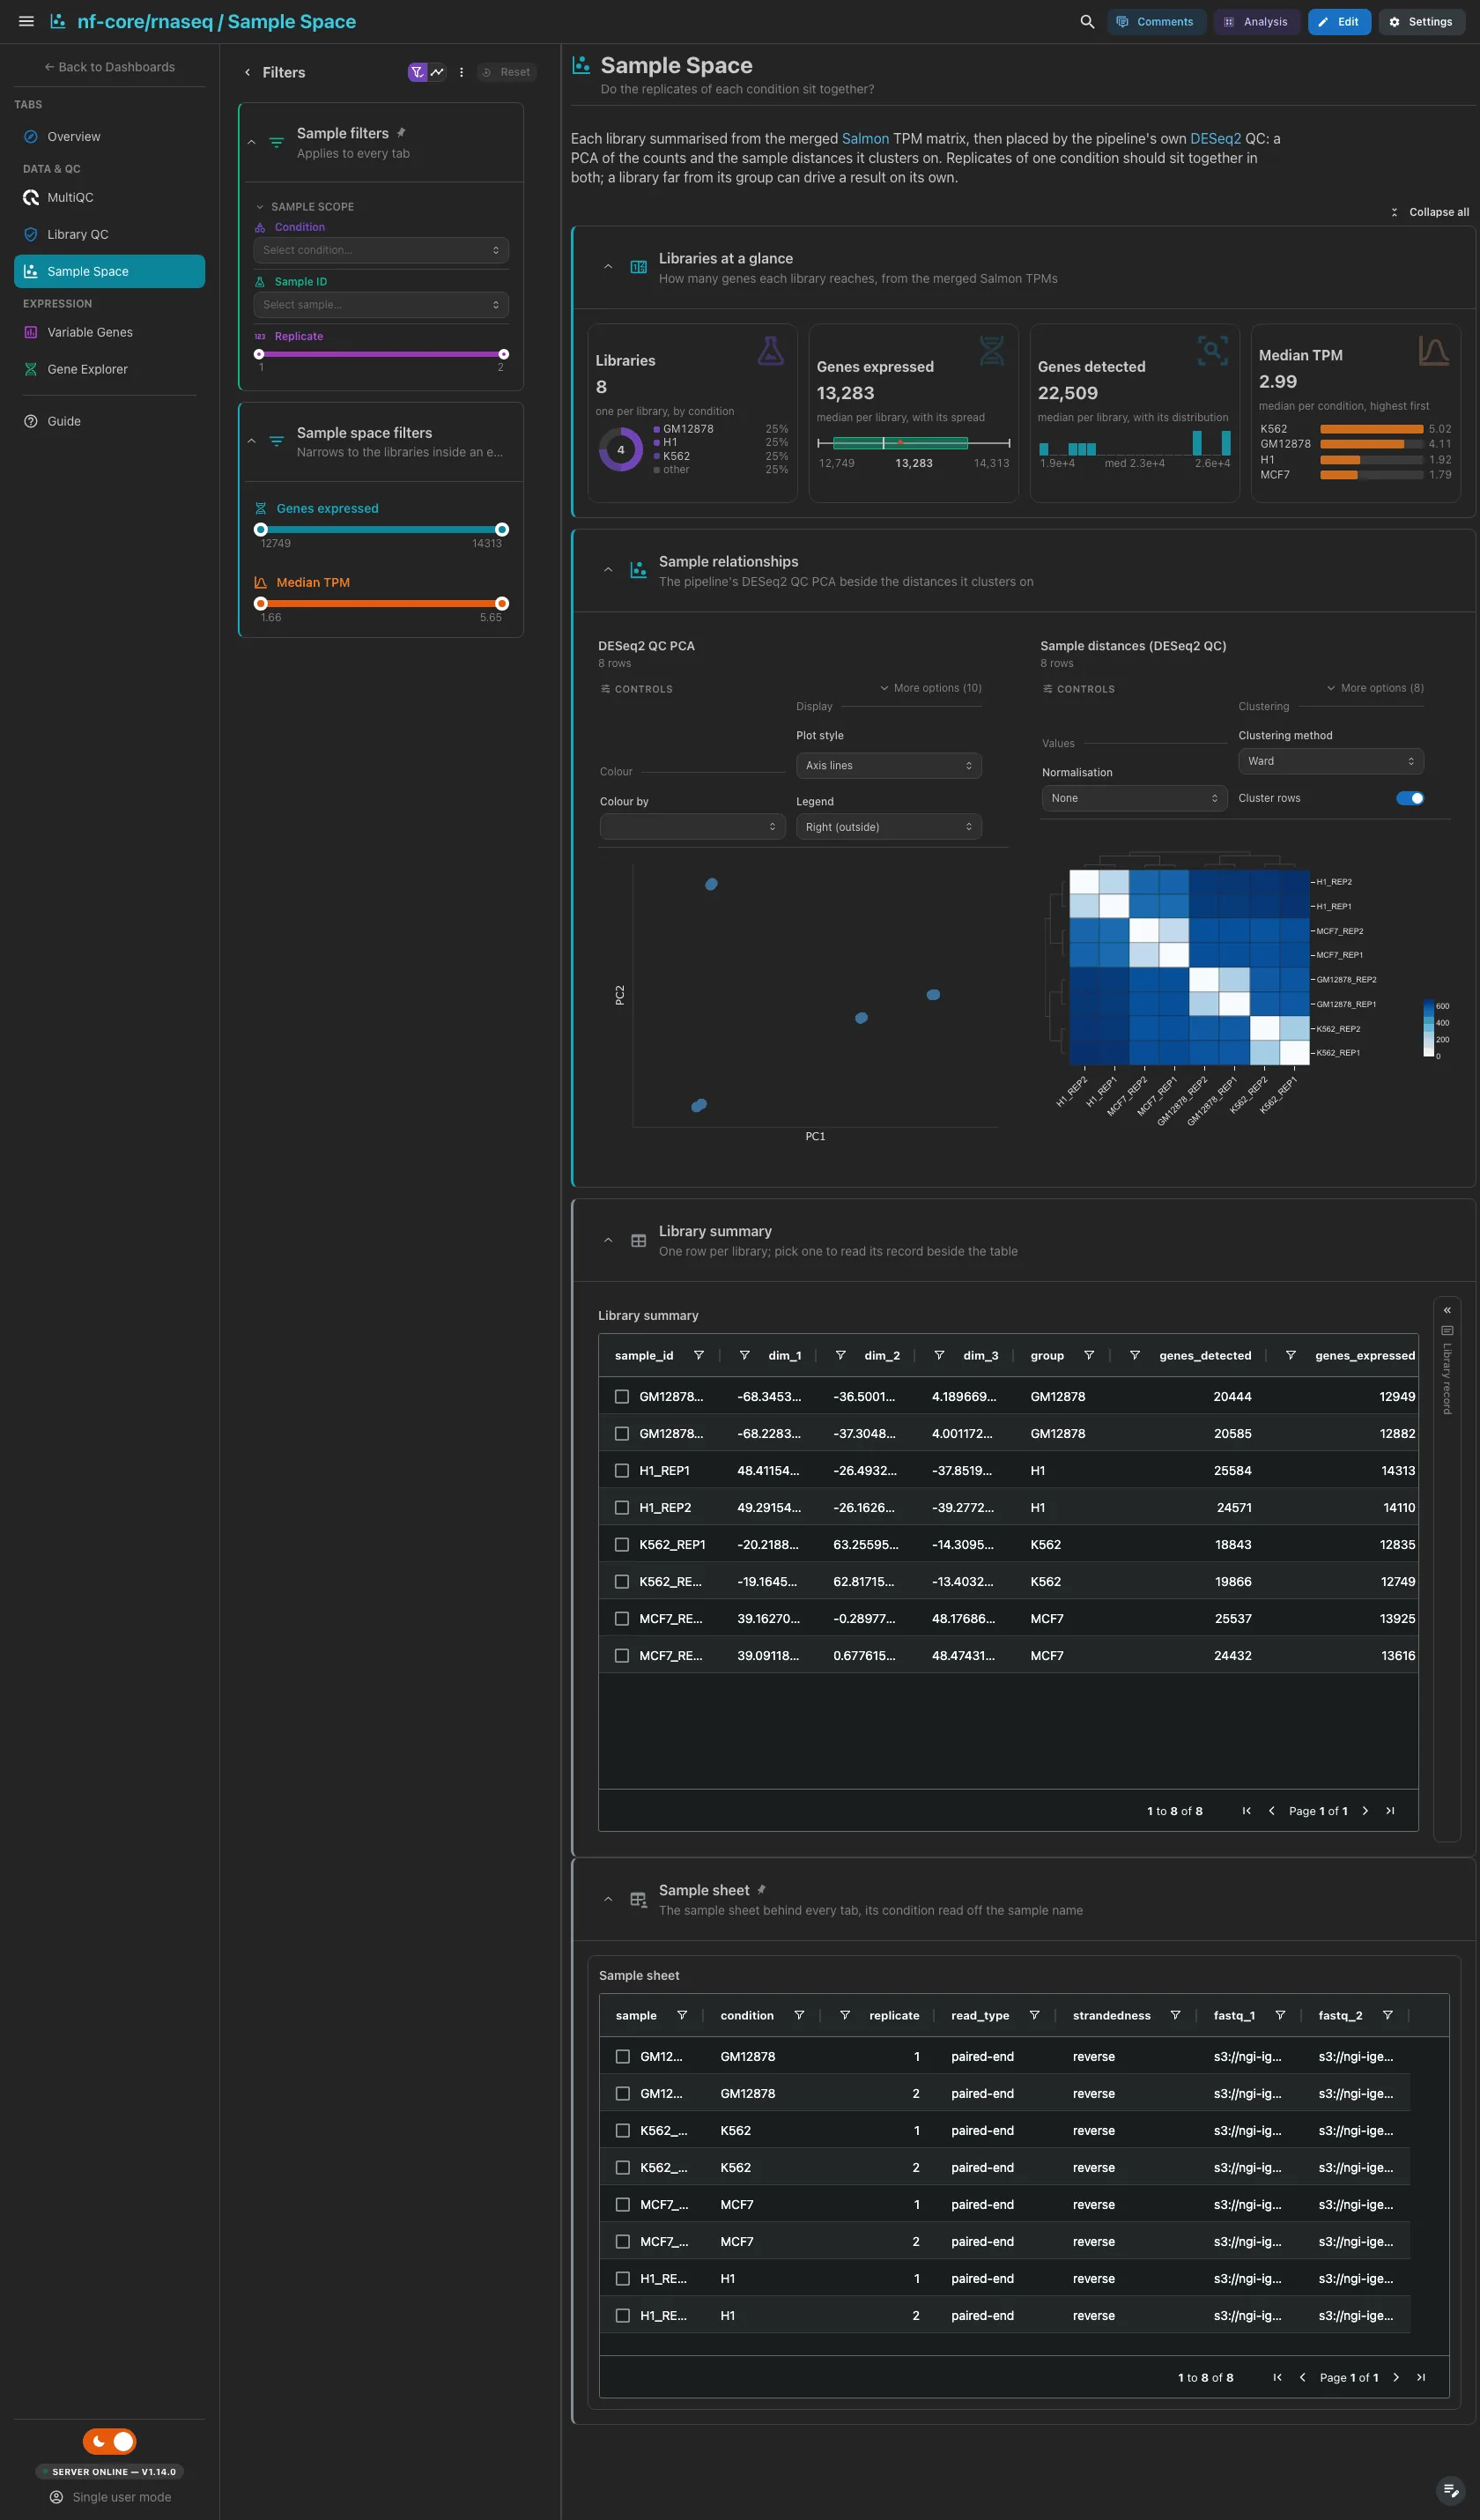
Libraries by condition, genes expressed, genes detected and the median TPM, from the merged Salmon TPM matrix. Then the pipeline's own DESeq2 QC PCA beside the sample distances it clusters on. Replicates of one condition should sit together in both. The collapsed library summary has a record card for the row you pick.
Filters and components
Filters · Genes expressed and Median TPM ranges on
sample_overview.
| Section | What it holds |
|---|---|
| Libraries at a glance | 4 cards |
| Sample relationships | 2 advanced visualizations |
| Library summary (collapsed) | Library summary + a library record card |
Expression · Which genes vary most between the libraries and conditions?
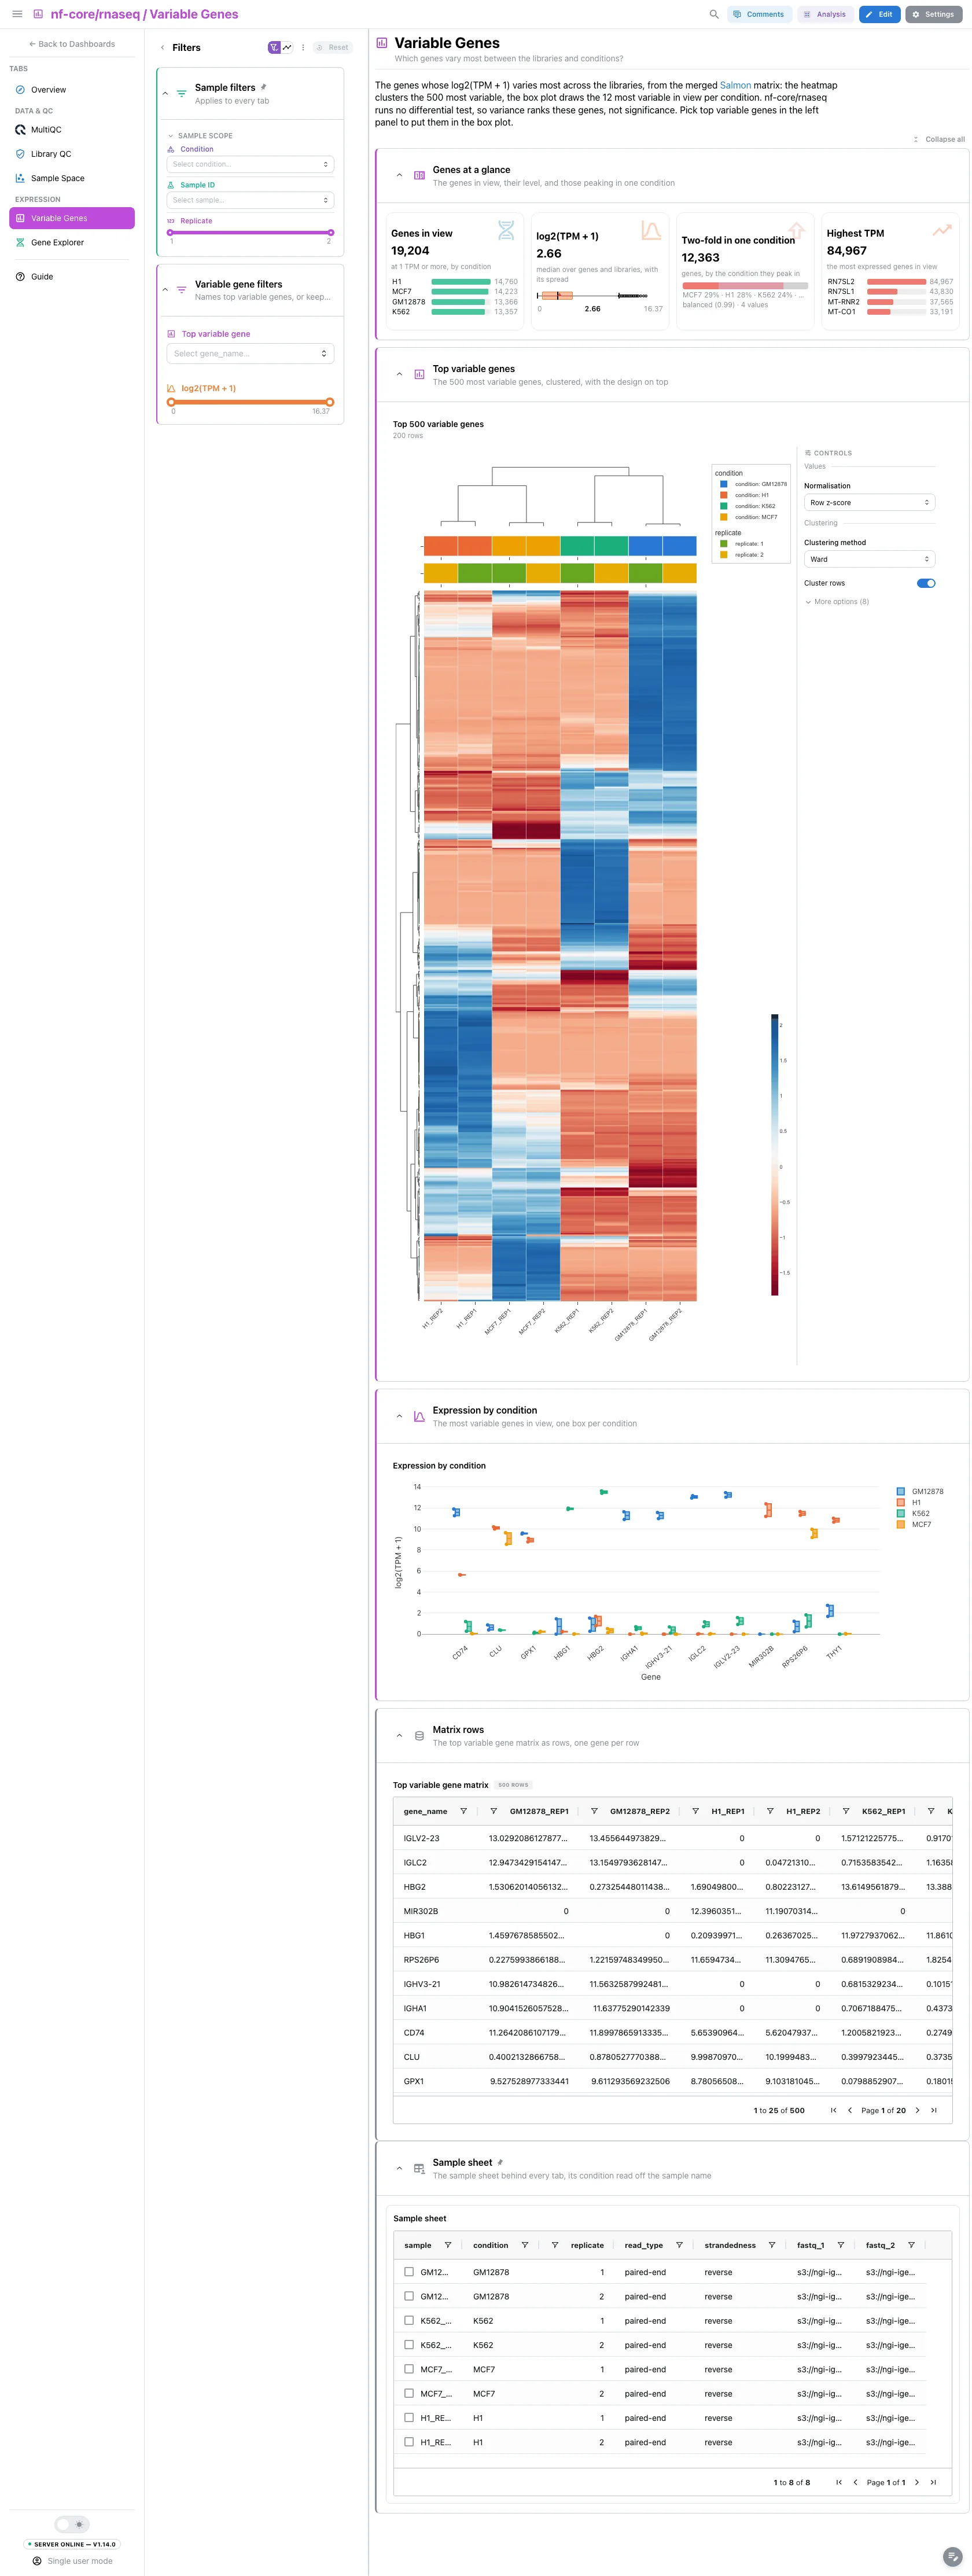
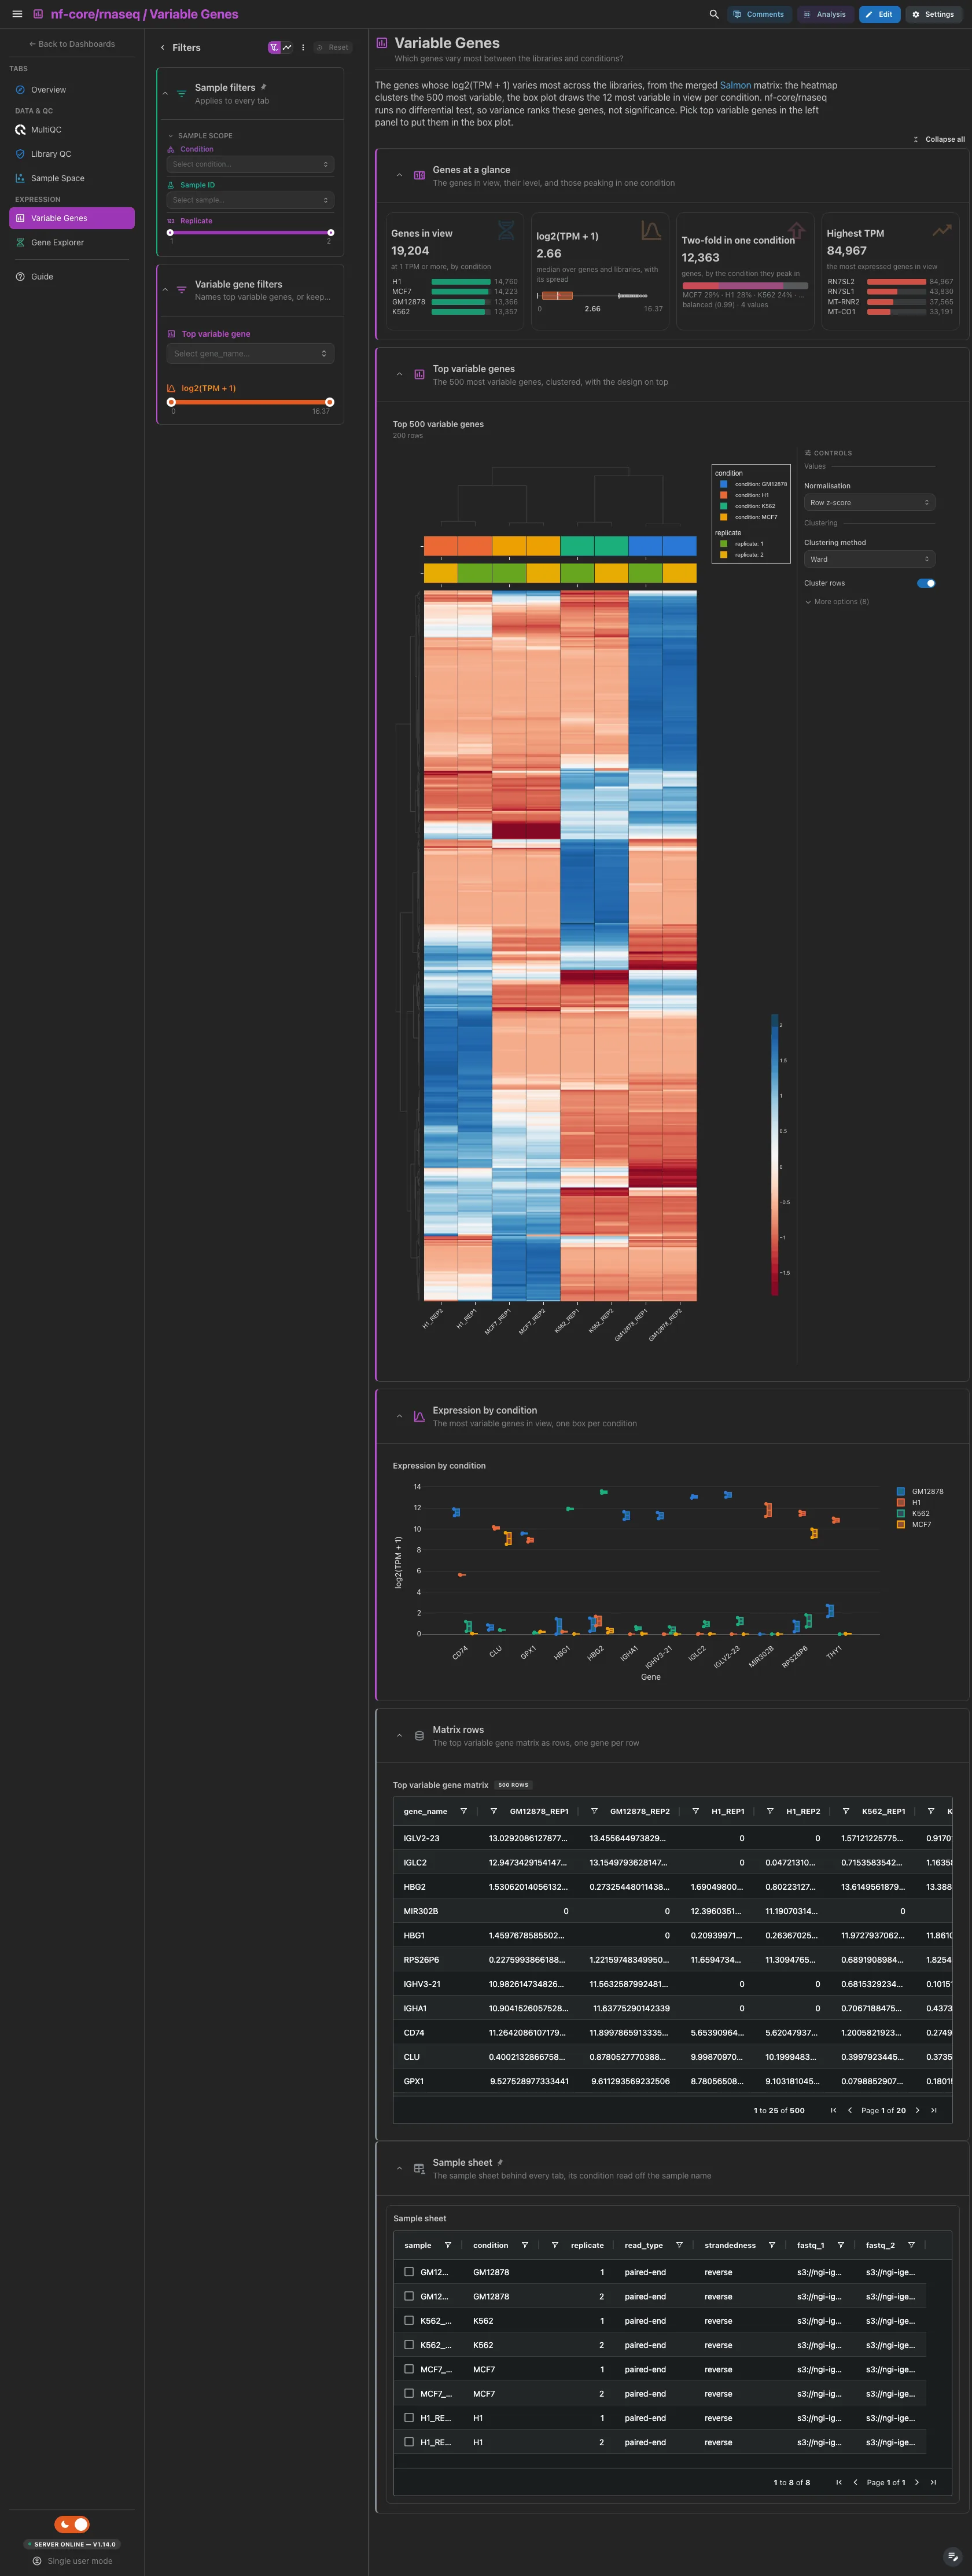
The genes in view, their median log2(TPM + 1), the genes two-fold higher in one condition and the highest TPM. Then the 500 most variable genes as a clustered heatmap with the design on top, and the most variable genes in view as one box per condition. Variance ranks these genes, not significance.
Filters and components
Filters · a Top variable gene picker on expression_heatmap and a
log2(TPM + 1) range on gene_expression.
| Section | What it holds |
|---|---|
| Genes at a glance | 4 cards |
| Top variable genes | 1 advanced visualization |
| Expression by condition | Expression by condition |
| Matrix rows (collapsed) | Top variable gene matrix |
Expression · Where does a gene sit, and which condition does it peak in?
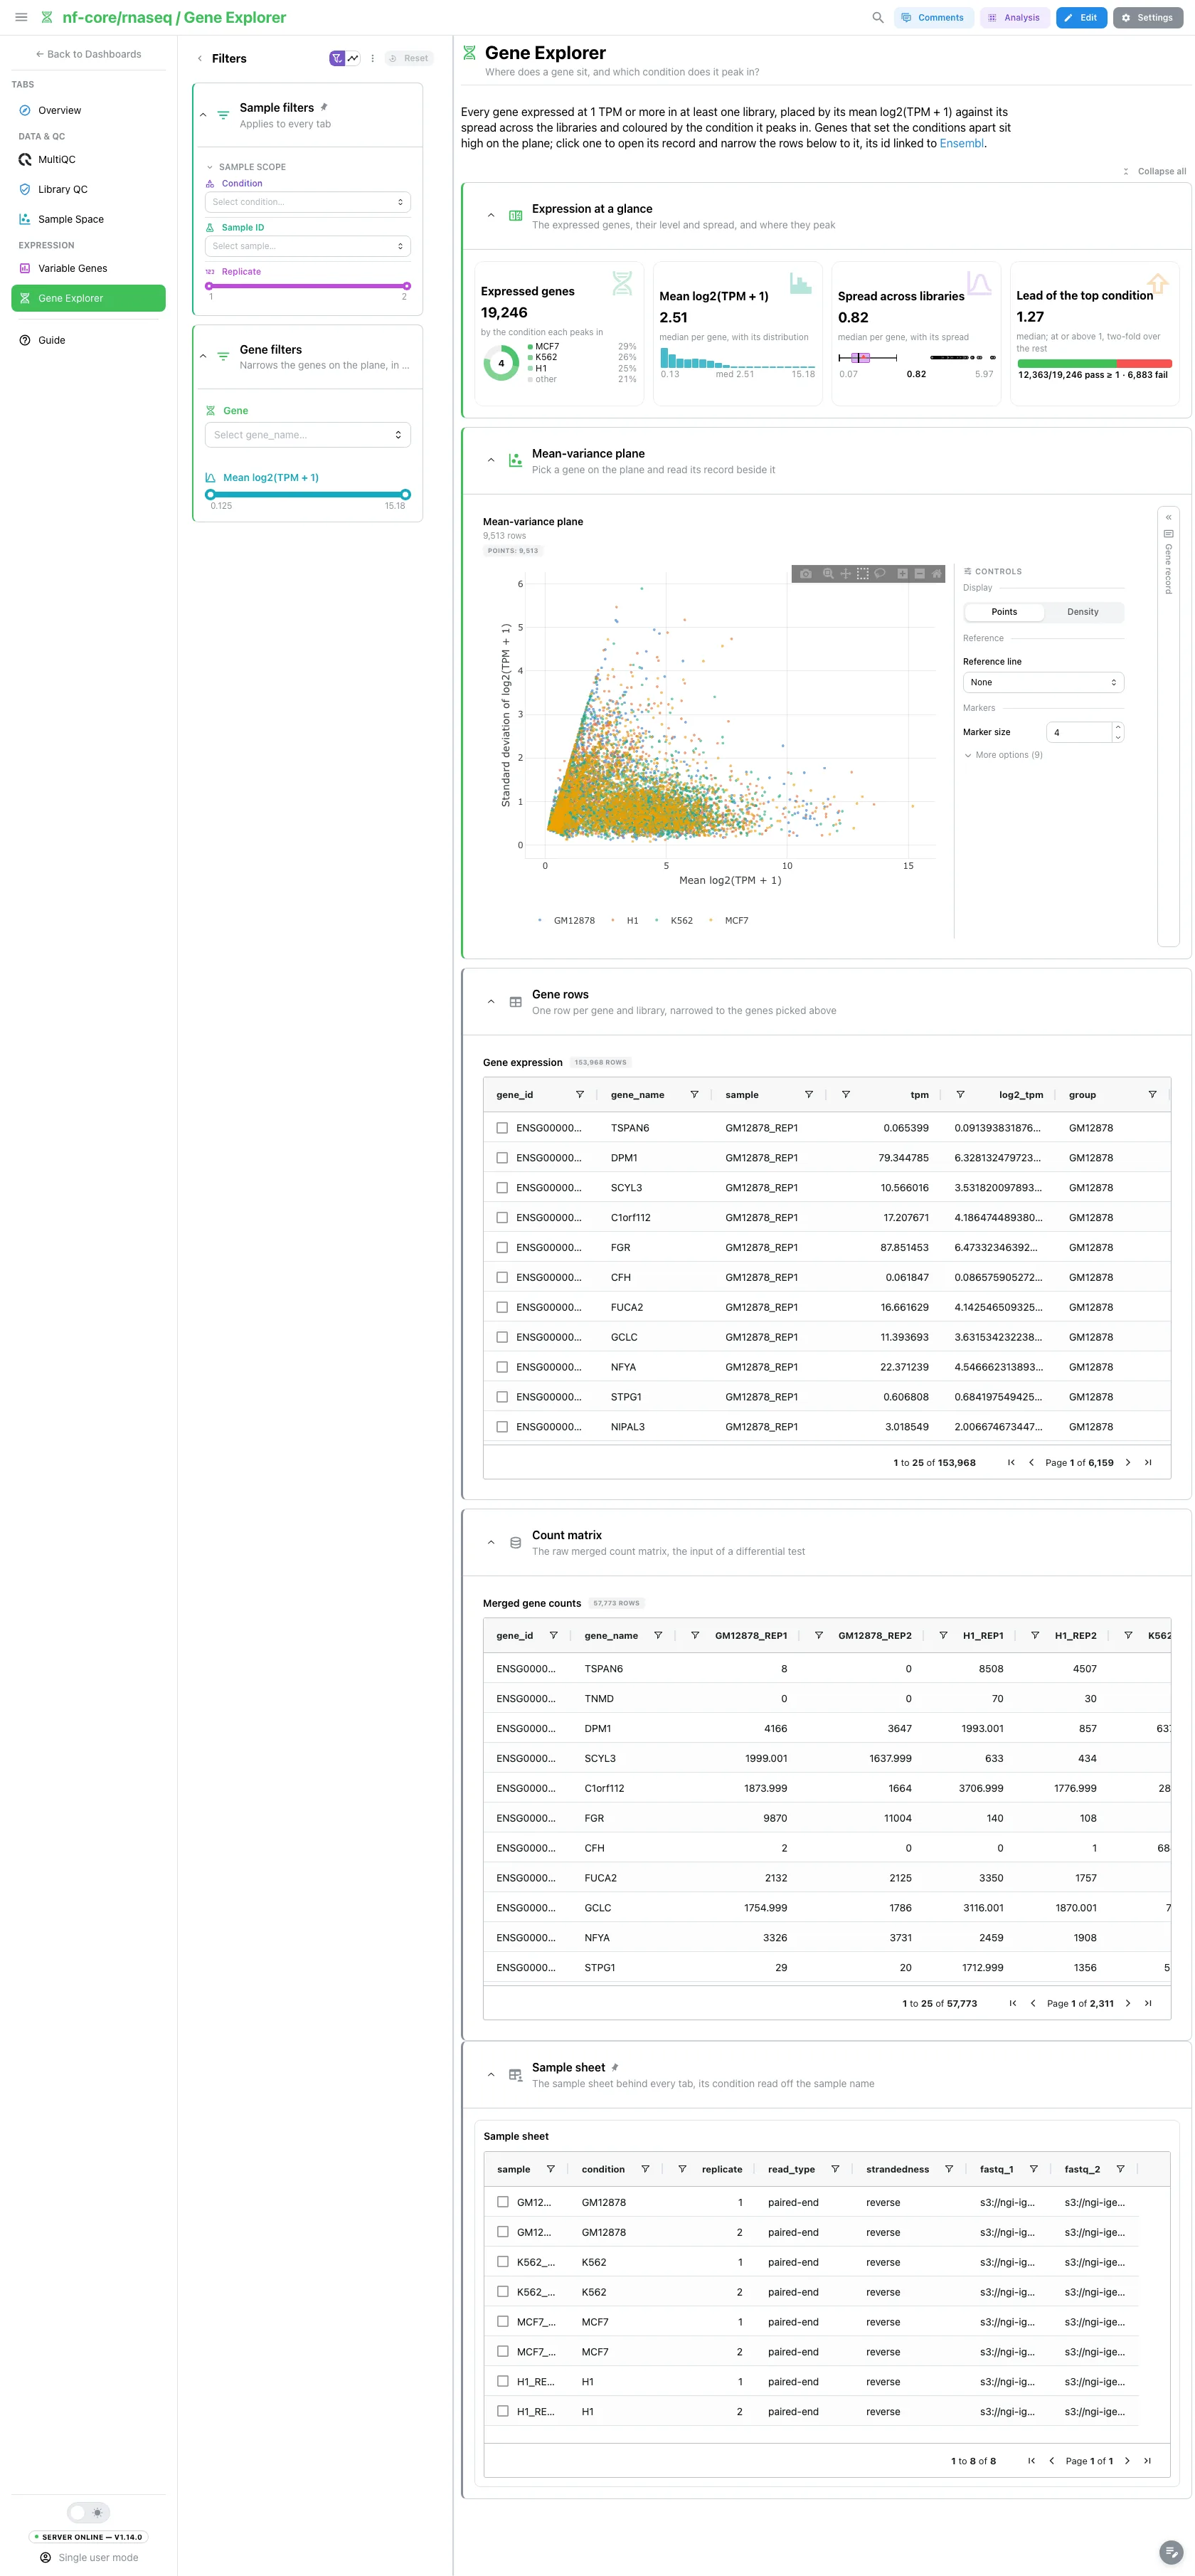
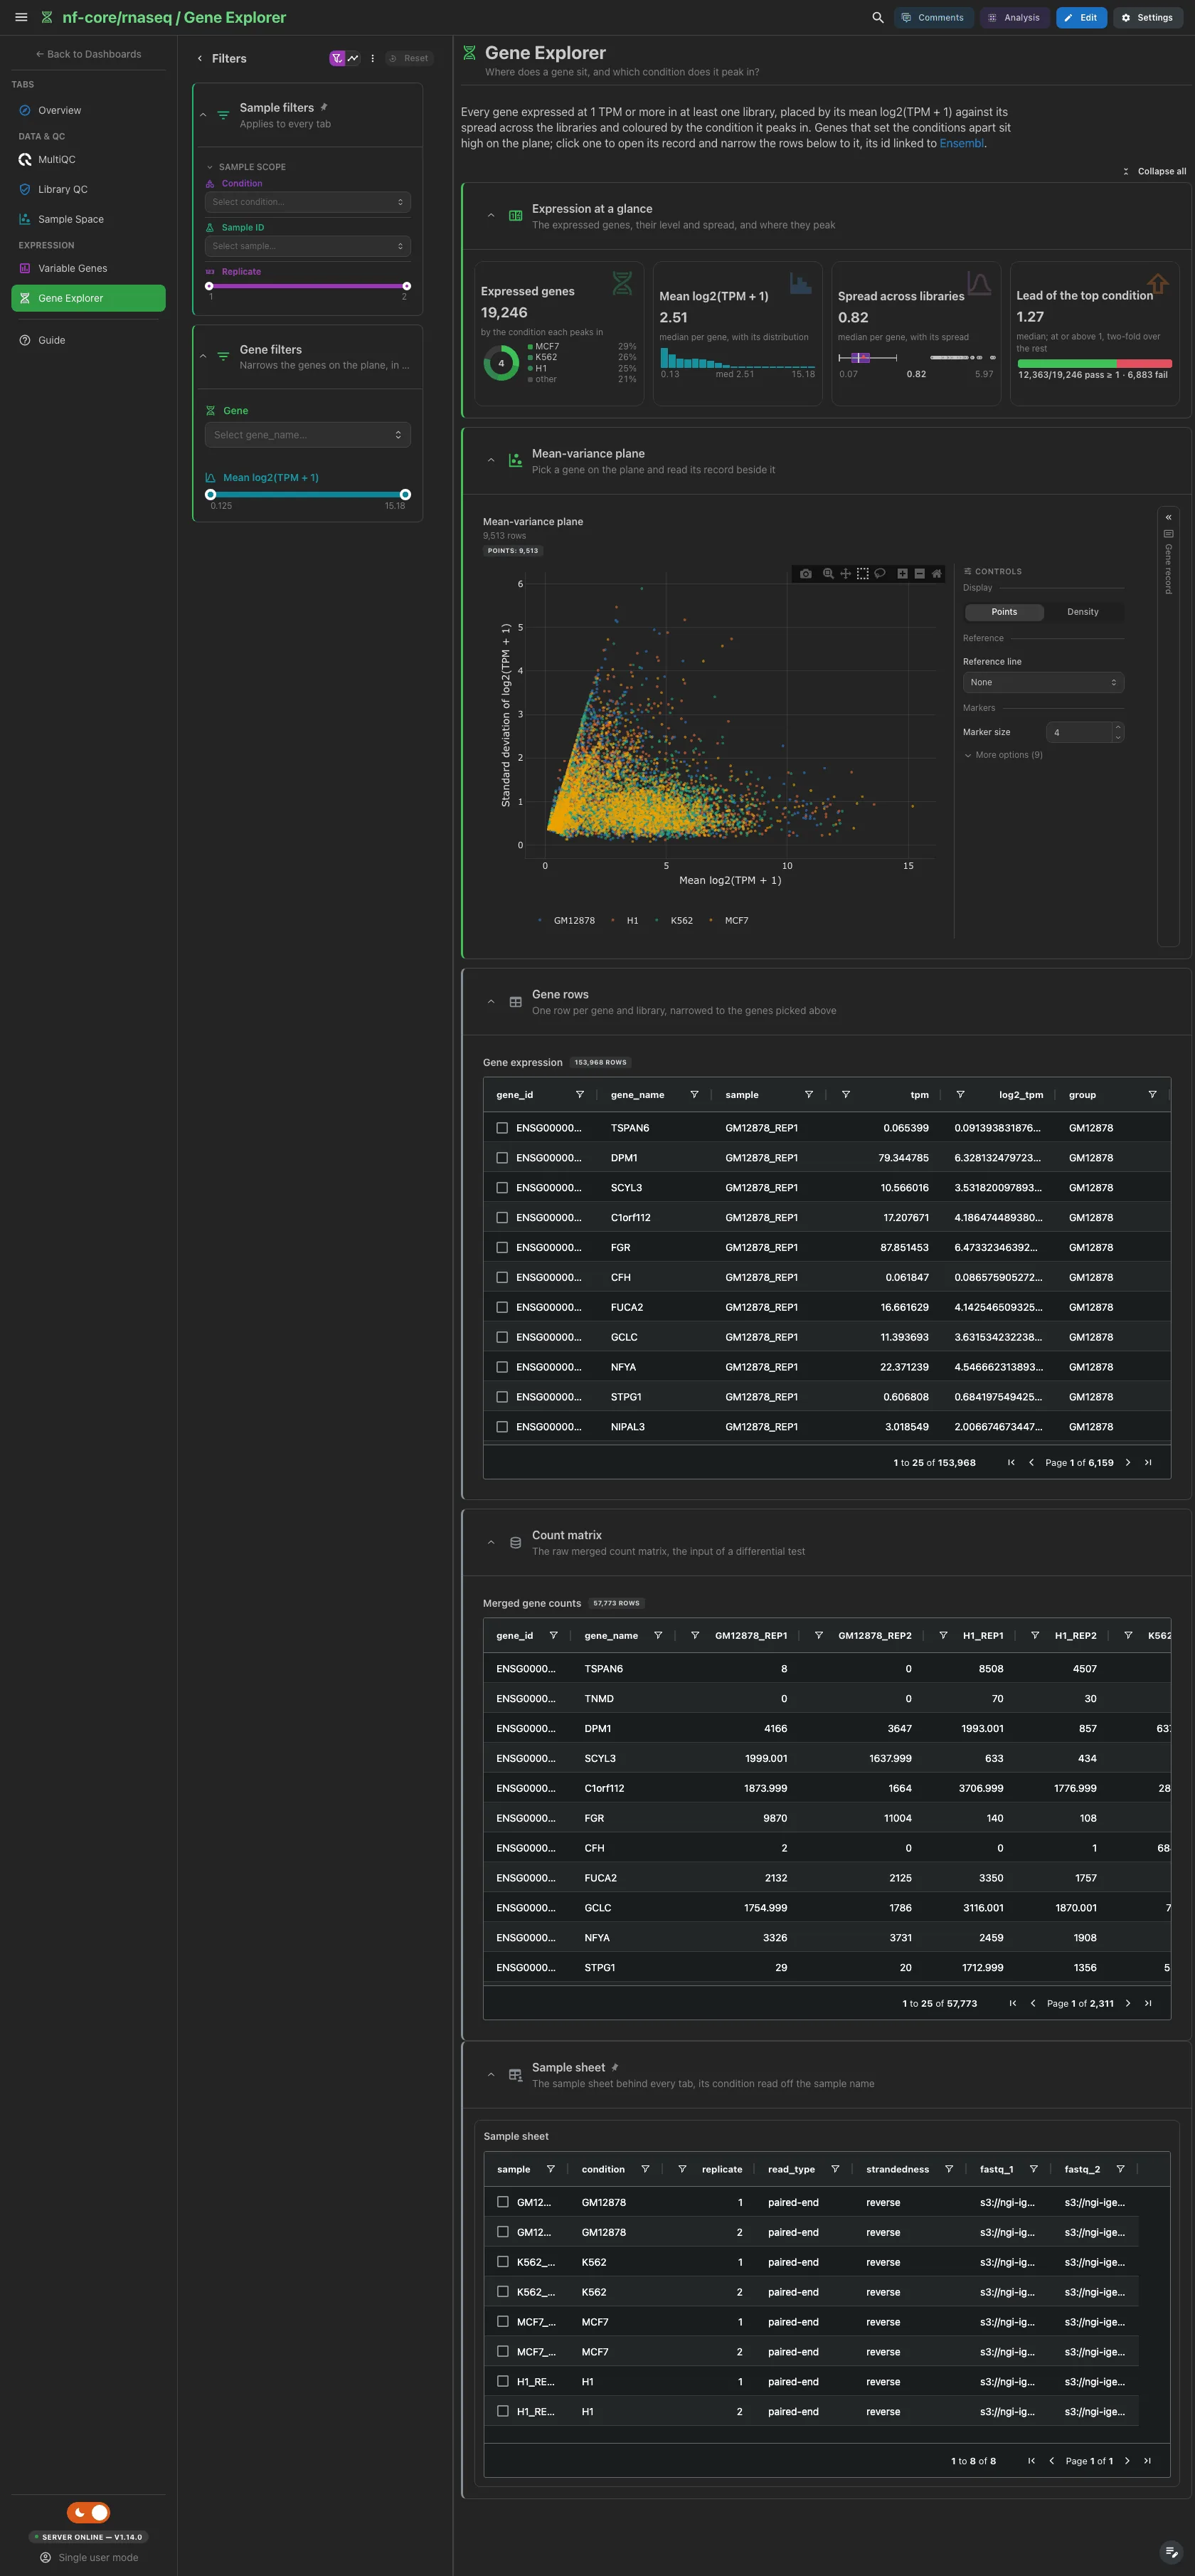
The expressed genes by the condition they peak in, their mean level, their spread and the lead of the top condition. Then the mean-variance plane, one point per expressed gene coloured by the condition it peaks in, beside the record card of the gene you click; its id links to Ensembl. The gene rows and the merged count matrix are collapsed below.
Filters and components
Filters · a Gene picker and a Mean log2(TPM + 1) range on
gene_summary.
| Section | What it holds |
|---|---|
| Expression at a glance | 4 cards |
| Mean-variance plane | 1 advanced visualization + a gene record card |
| Gene rows (collapsed) | Gene expression |
| Count matrix (collapsed) | Merged gene counts |
Optional sections
The DESeq2 QC files, the RSeQC read distribution reports and the MultiQC general statistics are optional collections. A run that skipped one of them ingests without it, and the panels it fed (the Sample Space PCA and distances, the read distribution, the Library QC profile) disappear.
Tables and point views select on their entity column: the samplesheet on
sample; the DESeq2 QC PCA and the library summary on sample_id; the
mean-variance plane on gene_id; the expression-by-condition figure and the
gene expression table on gene_name. A pick narrows the other tiles of its
collection and follows the project links to the collections they reach, and each
record card follows the tile beside it.
Running the pipeline
Depictio reads the output of nf-core/rnaseq, it does not run the pipeline. Run the pipeline first:
nextflow run nf-core/rnaseq -r 3.26.0 \
  --input samplesheet.csv \
  --genome GRCh38 \
  --outdir results \
  -profile docker
Then point Depictio at the results:
Non-default routes need their flag by hand, since the CLI does not yet read
rnaseq's own params.json for them: --var PSEUDOALIGNER_ONLY=true for
--skip_alignment, --var SKIP_MULTIQC=true for --skip_multiqc or
--skip_qc, --var SKIP_QUANTIFICATION_MERGE=true for the merge.
See nf-co.re/rnaseq/usage for full pipeline documentation.
Required data structure
Point depictio ingest at one aligner route directory. Depictio scans recursively
and matches on file name, except for the MultiQC report, whose scan pattern is
path-qualified.
<DATA_ROOT>/                                    # one aligner route, e.g. aligner_star_salmon/
├── input/
│   └── samplesheet.csv                         # --var SAMPLESHEET_FILE (auto-detected)
├── pipeline_info/
│   ├── params.json
│   └── software_versions.yml
├── multiqc/
│   └── star_salmon/
│       └── multiqc_report_data/
│           └── multiqc.parquet                 # or multiqc/multiqc_data/
├── star_salmon/
│   ├── salmon.merged.gene_tpm.tsv              # every expression panel
│   ├── salmon.merged.gene_counts.tsv           # Gene Explorer count matrix
│   ├── deseq2_qc/                              # *.pca.vals.txt, *.sample.dists.txt (optional)
│   ├── rseqc/read_distribution/                # *.read_distribution.txt (optional)
│   └── featurecounts/                          # biotype tables MultiQC renders
├── salmon/                                     # read instead with PSEUDOALIGNER_ONLY=true
│   ├── salmon.merged.gene_tpm.tsv
│   └── salmon.merged.gene_counts.tsv
└── trimgalore/
    └── *_trimming_report.txt
Validation runs
The repository ships
download_test_data.sh,
which fetches the subset of nf-core's AWS megatest run that the template needs:
The run is
s3://nf-core-awsmegatests/rnaseq/results-e7ca46272c8f9d5ceee3f71759f4ba551d3217a4/:
eight libraries from four ENCODE cell lines, two replicates each, human GRCh37,
Trim Galore then STAR + Salmon. The manifest fetches only the
aligner_star_salmon/ route and mirrors it below the destination, so the
directory the script writes is already the right one to ingest. The samplesheet
is not part of the published run; post_fetch_help in megatest.yaml next to
the script gives the curl that puts it under input/.
Then run Depictio against it:
Additional resources
- nf-co.re/rnaseq: official pipeline documentation
- nf-co.re/rnaseq/3.26.0/results: AWS test results
- Template System Reference: YAML format, variables, conditionals
- Recipes: how to read, test, and write recipes
Authorship
 weber8thomas
Reviewing a template on your own data, or taking over a role here, is a contribution in itself: the contributing guide says what each one involves.