

The mag template reads an nf-core/mag run as a funnel from assemblies to genomes, where the unit is the bin rather than the sample:
- Overview: the run in four key figures, live findings and four figures, each linked to the tab that explains it
- Data & QC: fastp, Bowtie 2 and NanoStat read QC from the MultiQC report, the only home of the read QC, with the QUAST, CheckM2 and GTDB-Tk panels behind it
- Assemblies: what each assembler made of the same samples, size against contiguity and the Nx curve, then the length and depth signal every binner is fed
- Genomes: CheckM2 completeness against contamination, the GTDB-Tk lineage, Prokka's genes and RNAs, and one bin read through all four tools with its locus map
Every assembler is crossed with every binner over every sample, so the filters
that matter are the assembler, the binner, the phylum and the quality thresholds.
The persistent Sample filters (assembler, binner, sample) sit in the left panel,
and a pick there reaches every per-assembly and per-bin collection through the
bin_summary links.
A MultiQC parquet is required
Depictio reads only multiqc.parquet (MultiQC 1.31 and later). When the run
published no parquet, or no multiqc/ directory at all, regenerate the
report from the run's raw tool outputs before ingesting:
The bin summary is rebuilt Depictio side
QUAST, CheckM2, Prokka and GTDB-Tk each score a different subset of the bins
(GTDB-Tk only places the ones that pass its own thresholds). The template
joins the four tool outputs into one outer-joined row per bin, with a
sources_present count, so a gap between tools is a readable number rather
than a silent row loss. Contig coverage stays per contig: without the
contig-to-bin tables it is never rolled up to a bin.
Quick start
The results directory is the only variable. The sample hub reads the samplesheet at
input/samplesheet.full.v4.csv under the data root; mag does not publish its
--input, so copy the sheet the run was launched with to that path.
depictio config nextflow --install     # once per machine
nextflow run nf-core/mag -r 5.5.0 -profile docker --outdir results
No depictio ingest, and no template named: the pipeline ingests its own
output directory when it finishes and resolves this template from its own
manifest. The samplesheet copy and the MultiQC parquet above still apply.
See Nextflow trigger.
Reference
The template reads the samplesheet, the MultiQC report, the QUAST assembly and bin
reports, the per-contig depth tables, CheckM2, GTDB-Tk and the Prokka summaries
and GFFs. 62 of its 66 tiles carry a use: catalog reference (quast/*, mag/*,
checkm2/*, gtdbtk/*, prokka/*, multiqc/*), so a tile says where its panel
comes from. The controls of an advanced visualization dock to the right of a
full-width tile and on top of a narrower one.
Self-adapting layout
The dashboard adapts to whatever the run actually produced: components bound to pruned or unparsed data collections are hidden, tabs left with no real visualizations are dropped entirely, and the remaining components are re-packed so there are no empty rows.
Template variables
Variables you provide when running the template: DATA_ROOT is the results directory given to depictio ingest, the others are set with --var NAME=value:
| Variable | Required | Description |
|---|---|---|
DATA_ROOT |
✓ | Root directory containing mag output (Assembly/, GenomeBinning/, Taxonomy/, Annotation/, QC_shortreads/, QC_longreads/, pipeline_info/) plus input/samplesheet.full.v4.csv and the reprocessed multiqc/multiqc_data/multiqc.parquet. |
Data collections
21 data collections — 2 required 19 optional · 9 direct 12 derived.
Origin tells you whether a collection is real pipeline data or a reshape of it: direct = a pipeline output (scanned, or a recipe that reads raw files); derived = a recipe that reshapes one or more direct collections into the layout a visualization needs (no new measurement). Reads shows what produces it: a recipe .py transform, whose name links to its source on GitHub, or a raw file scanned off disk. (A direct collection can still have a recipe — one that merely parses/cleans the raw file; derived means the recipe reshapes another collection.)
| Tag | Origin | Type | Reads | Status |
|---|---|---|---|---|
samples |
direct | Table | recipe nf-core/mag/samples.py |
required |
multiqc_data |
direct |  MultiQC MultiQC |
file (?:.*/)?multiqc(?:/[^/]+)?/multiqc_data/multiqc.parquet$ |
required |
quast_assembly_raw |
direct | Table | file (?:./)?Assembly/./QUAST/transposed_report.tsv$ |
optional |
assembly_report |
derived | Table | recipe quast/assembly_report.py |
optional |
length_ladder |
derived | Table | recipe quast/length_ladder.py |
optional |
mag_contig_depths_raw |
direct | Table | file .*-depth.txt(.gz)?$ |
optional |
contig_depths |
derived | Table | recipe mag/contig_depths.py |
optional |
assembly_nx |
derived | Table | recipe nf-core/mag/nx_curve.py |
optional |
assembly_recruitment |
derived | Table | recipe nf-core/mag/assembly_recruitment.py |
optional |
checkm2_quality_raw |
direct | Table | file .*_checkm2_report.tsv$ |
optional |
checkm2_quality_report |
derived | Table | recipe checkm2/quality_report.py |
optional |
quast_bins_raw |
direct | Table | file .*-quast_summary.tsv$ |
optional |
quast_bins_summary |
derived | Table | recipe quast/bins_summary.py |
optional |
gtdbtk_summary_raw |
direct | Table | file (?:./)?classify/..(?:bac|ar)\d+.summary.tsv$ |
optional |
gtdbtk_summary |
derived | Table | recipe gtdbtk/summary.py |
optional |
gtdbtk_rank_composition |
derived | Table | recipe gtdbtk/rank_composition.py |
optional |
prokka_summary_raw |
direct | Table | file (?:./)?[Pp]rokka/..txt$ |
optional |
prokka_summary |
derived | Table | recipe prokka/summary.py |
optional |
prokka_gff_raw |
direct | Table | file (?:./)?[Pp]rokka/..gff$ |
optional |
prokka_gene_track |
derived | Table | recipe prokka/gene_track.py |
optional |
bin_summary |
derived | Table | recipe mag/bin_summary.py |
optional |
Cross-DC links
33 links — selecting a value in the source collection filters the target. The join column is shown after the source.
| Source · column | Target | Filters | |
|---|---|---|---|
samples · sample_id |
→ | multiqc_data |
Filter the MultiQC panels by the samples picked in the left panel |
samples · sample_id |
→ | assembly_report |
Filter the assembly statistics by the samples picked in the left panel |
samples · sample_id |
→ | length_ladder |
Filter the contig-length ladder by the samples picked in the left panel |
samples · sample_id |
→ | contig_depths |
Filter the contig coverage by the samples picked in the left panel |
samples · sample_id |
→ | assembly_nx |
Filter the Nx curves by the samples picked in the left panel |
samples · sample_id |
→ | assembly_recruitment |
Filter the recruitment matrix by the samples picked in the left panel |
samples · sample_id |
→ | checkm2_quality_report |
Filter the CheckM2 bin quality by the samples picked in the left panel |
samples · sample_id |
→ | quast_bins_summary |
Filter the per-bin assembly statistics by the samples picked in the left panel |
samples · sample_id |
→ | gtdbtk_summary |
Filter the bin taxonomy by the samples picked in the left panel |
samples · sample_id |
→ | gtdbtk_rank_composition |
Filter the recovered community by the samples picked in the left panel |
samples · sample_id |
→ | prokka_summary |
Filter the annotation summary by the samples picked in the left panel |
samples · sample_id |
→ | prokka_gene_track |
Filter the per-bin locus map by the samples picked in the left panel |
samples · sample_id |
→ | bin_summary |
Filter the bin summary by the samples picked in the left panel |
bin_summary · assembler |
→ | checkm2_quality_report |
Carry the assembler picked in the left panel over to CheckM2 bin quality |
bin_summary · binner |
→ | checkm2_quality_report |
Carry the binner picked in the left panel over to CheckM2 bin quality |
bin_summary · assembler |
→ | quast_bins_summary |
Carry the assembler picked in the left panel over to the per-bin assembly statistics |
bin_summary · binner |
→ | quast_bins_summary |
Carry the binner picked in the left panel over to the per-bin assembly statistics |
bin_summary · assembler |
→ | gtdbtk_summary |
Carry the assembler picked in the left panel over to the bin taxonomy |
bin_summary · binner |
→ | gtdbtk_summary |
Carry the binner picked in the left panel over to the bin taxonomy |
bin_summary · assembler |
→ | gtdbtk_rank_composition |
Carry the assembler picked in the left panel over to the recovered community |
bin_summary · binner |
→ | gtdbtk_rank_composition |
Carry the binner picked in the left panel over to the recovered community |
bin_summary · assembler |
→ | prokka_summary |
Carry the assembler picked in the left panel over to the annotation summary |
bin_summary · binner |
→ | prokka_summary |
Carry the binner picked in the left panel over to the annotation summary |
bin_summary · binner |
→ | prokka_gene_track |
Carry the binner picked in the left panel over to the per-bin locus map |
bin_summary · assembler |
→ | assembly_report |
Carry the assembler picked in the left panel over to the assembly statistics |
bin_summary · assembler |
→ | length_ladder |
Carry the assembler picked in the left panel over to the contig-length ladder |
bin_summary · assembler |
→ | contig_depths |
Carry the assembler picked in the left panel over to the contig coverage |
bin_summary · assembler |
→ | assembly_nx |
Carry the assembler picked in the left panel over to the Nx curves |
bin_summary · assembler |
→ | assembly_recruitment |
Carry the assembler picked in the left panel over to the recruitment matrix |
checkm2_quality_report · bin_id |
→ | quast_bins_summary |
Narrow the per-bin assembly statistics to the bins the CheckM2 filters keep |
bin_summary · bin_id |
→ | prokka_gene_track |
Open the locus map of the bin picked on the bin summary |
bin_summary · bin_id |
→ | checkm2_quality_report |
Carry a bin picked on the bin summary over to its CheckM2 row |
bin_summary · phylum |
→ | gtdbtk_summary |
Carry the phylum picked on the Taxonomy tab over to the bin taxonomy table |
Recipes
Each recipe reshapes raw pipeline output into a tidy table. The name links to its source; Output lists the validated OUTPUT_SCHEMA columns.
| Recipe | Transforms | Output |
|---|---|---|
checkm2/quality_report.py |
One row per metagenome-assembled genome, with CheckM2's verdict on it. | bin_id, sample, assembler, binner, completeness, contamination, quality_score, quality_tier, coding_density, contig_n50, genome_size, gc_content, total_coding_sequences, total_contigs, max_contig_length, completeness_model |
gtdbtk/rank_composition.py |
How many bins each binning run recovered per taxon, one row per rank. | sample_id, sample, assembler, binner, rank, taxon, abundance |
gtdbtk/summary.py |
One row per classified bin, with its GTDB lineage split into ranks. | bin_id, sample, assembler, binner, marker_set, domain, phylum, class_name, order, family, genus, species, rank_assigned, classification, closest_reference, closest_ani, closest_af, classification_method, msa_percent, bin_count |
mag/bin_summary.py |
One row per bin, joining everything four tools know about it. | bin_id, sample, assembler, binner, completeness, contamination, quality_score, quality_tier, mimag_tier, total_length, n_contigs, n50, gc_percent, cds, trna, rrna, cds_per_mbp, meets_mimag_rna, domain, phylum, class_name, order, family, genus, species, rank_assigned, classified, sources_present |
mag/contig_depths.py |
Per-contig coverage, one row per contig and per sample mapped onto it. | assembly_id, assembler, sample, contig_id, contig_length, mean_depth, read_sample, depth, depth_variance |
nf-core/mag/assembly_recruitment.py |
Cross-sample read recruitment: one row per assembly, one column per read sample. | assembly_id, assembler, sample |
nf-core/mag/nx_curve.py |
Nx curve per assembly, from the contig lengths the depth tables carry. | assembly_id, assembler, sample, nx, contig_length, n_contigs, total_length |
nf-core/mag/samples.py |
One row per nf-core/mag sample, from the samplesheet the pipeline validated. | sample_id, group, short_reads_platform, long_reads_platform, has_long_reads |
prokka/gene_track.py |
One row per annotated feature, with the coordinates it sits at inside its bin. | bin_id, sample, assembler, binner, contig, feature_id, ftype, start, end, strand, length_bp, gene, product |
prokka/summary.py |
One row per annotated genome, from Prokka's .txt feature counts. |
bin_id, sample, assembler, binner, n_contigs, bases, cds, genes, trna, rrna, tmrna, repeat_regions, cds_per_mbp, meets_mimag_rna |
quast/assembly_report.py |
One row per assembly, from QUAST's transposed report. | assembly_id, assembler, sample, n_contigs, total_length, largest_contig, n50, n75, l50, l75, gc_percent, ns_per_100_kbp, predicted_rrna_genes, contigs_over_1kb, length_over_1kb |
quast/bins_summary.py |
One row per recovered bin, from the QUAST summary of a binning run. | bin_id, sample, assembler, binner, n_contigs, total_length, largest_contig, n50, l50, gc_percent, predicted_rrna_genes, contigs_over_10kb |
quast/length_ladder.py |
The contig-length ladder of each assembly, one row per length threshold. | assembly_id, assembler, sample, min_contig_length, n_contigs, total_length, length_fraction |
Dashboard tabs
One dashboard: the Overview, then seven child tabs in three groups, read as a funnel from the reads to one bin in full. Each tab below carries the same icon and colour the dashboard gives it, so the page and the app read alike.
| Group | Tabs |
|---|---|
| Data & QC | MultiQC |
| Assemblies | Assembly, Contigs |
| Genomes | Bins, Taxonomy, Annotation, Bin detail |
Each child tab opens with a short intro and a strip of four cards, then at most
three open sections; tables and details follow, collapsed. The unit is the bin,
not the sample, and the template has no group column: mag's own vocabularies
(assembler, binner, MIMAG tier) take the place of a design column. The persistent
Sample filters (assembler, binner, then sample) sit in the left panel and narrow
every tab: the assembler and binner reach every per-assembly and per-bin
collection through the bin_summary links, the sample every collection through
the sample sheet. The Sample sheet is pinned, collapsed, to the bottom of every
child tab.
Metagenome assembly and binning, from reads to named, annotated genomes.
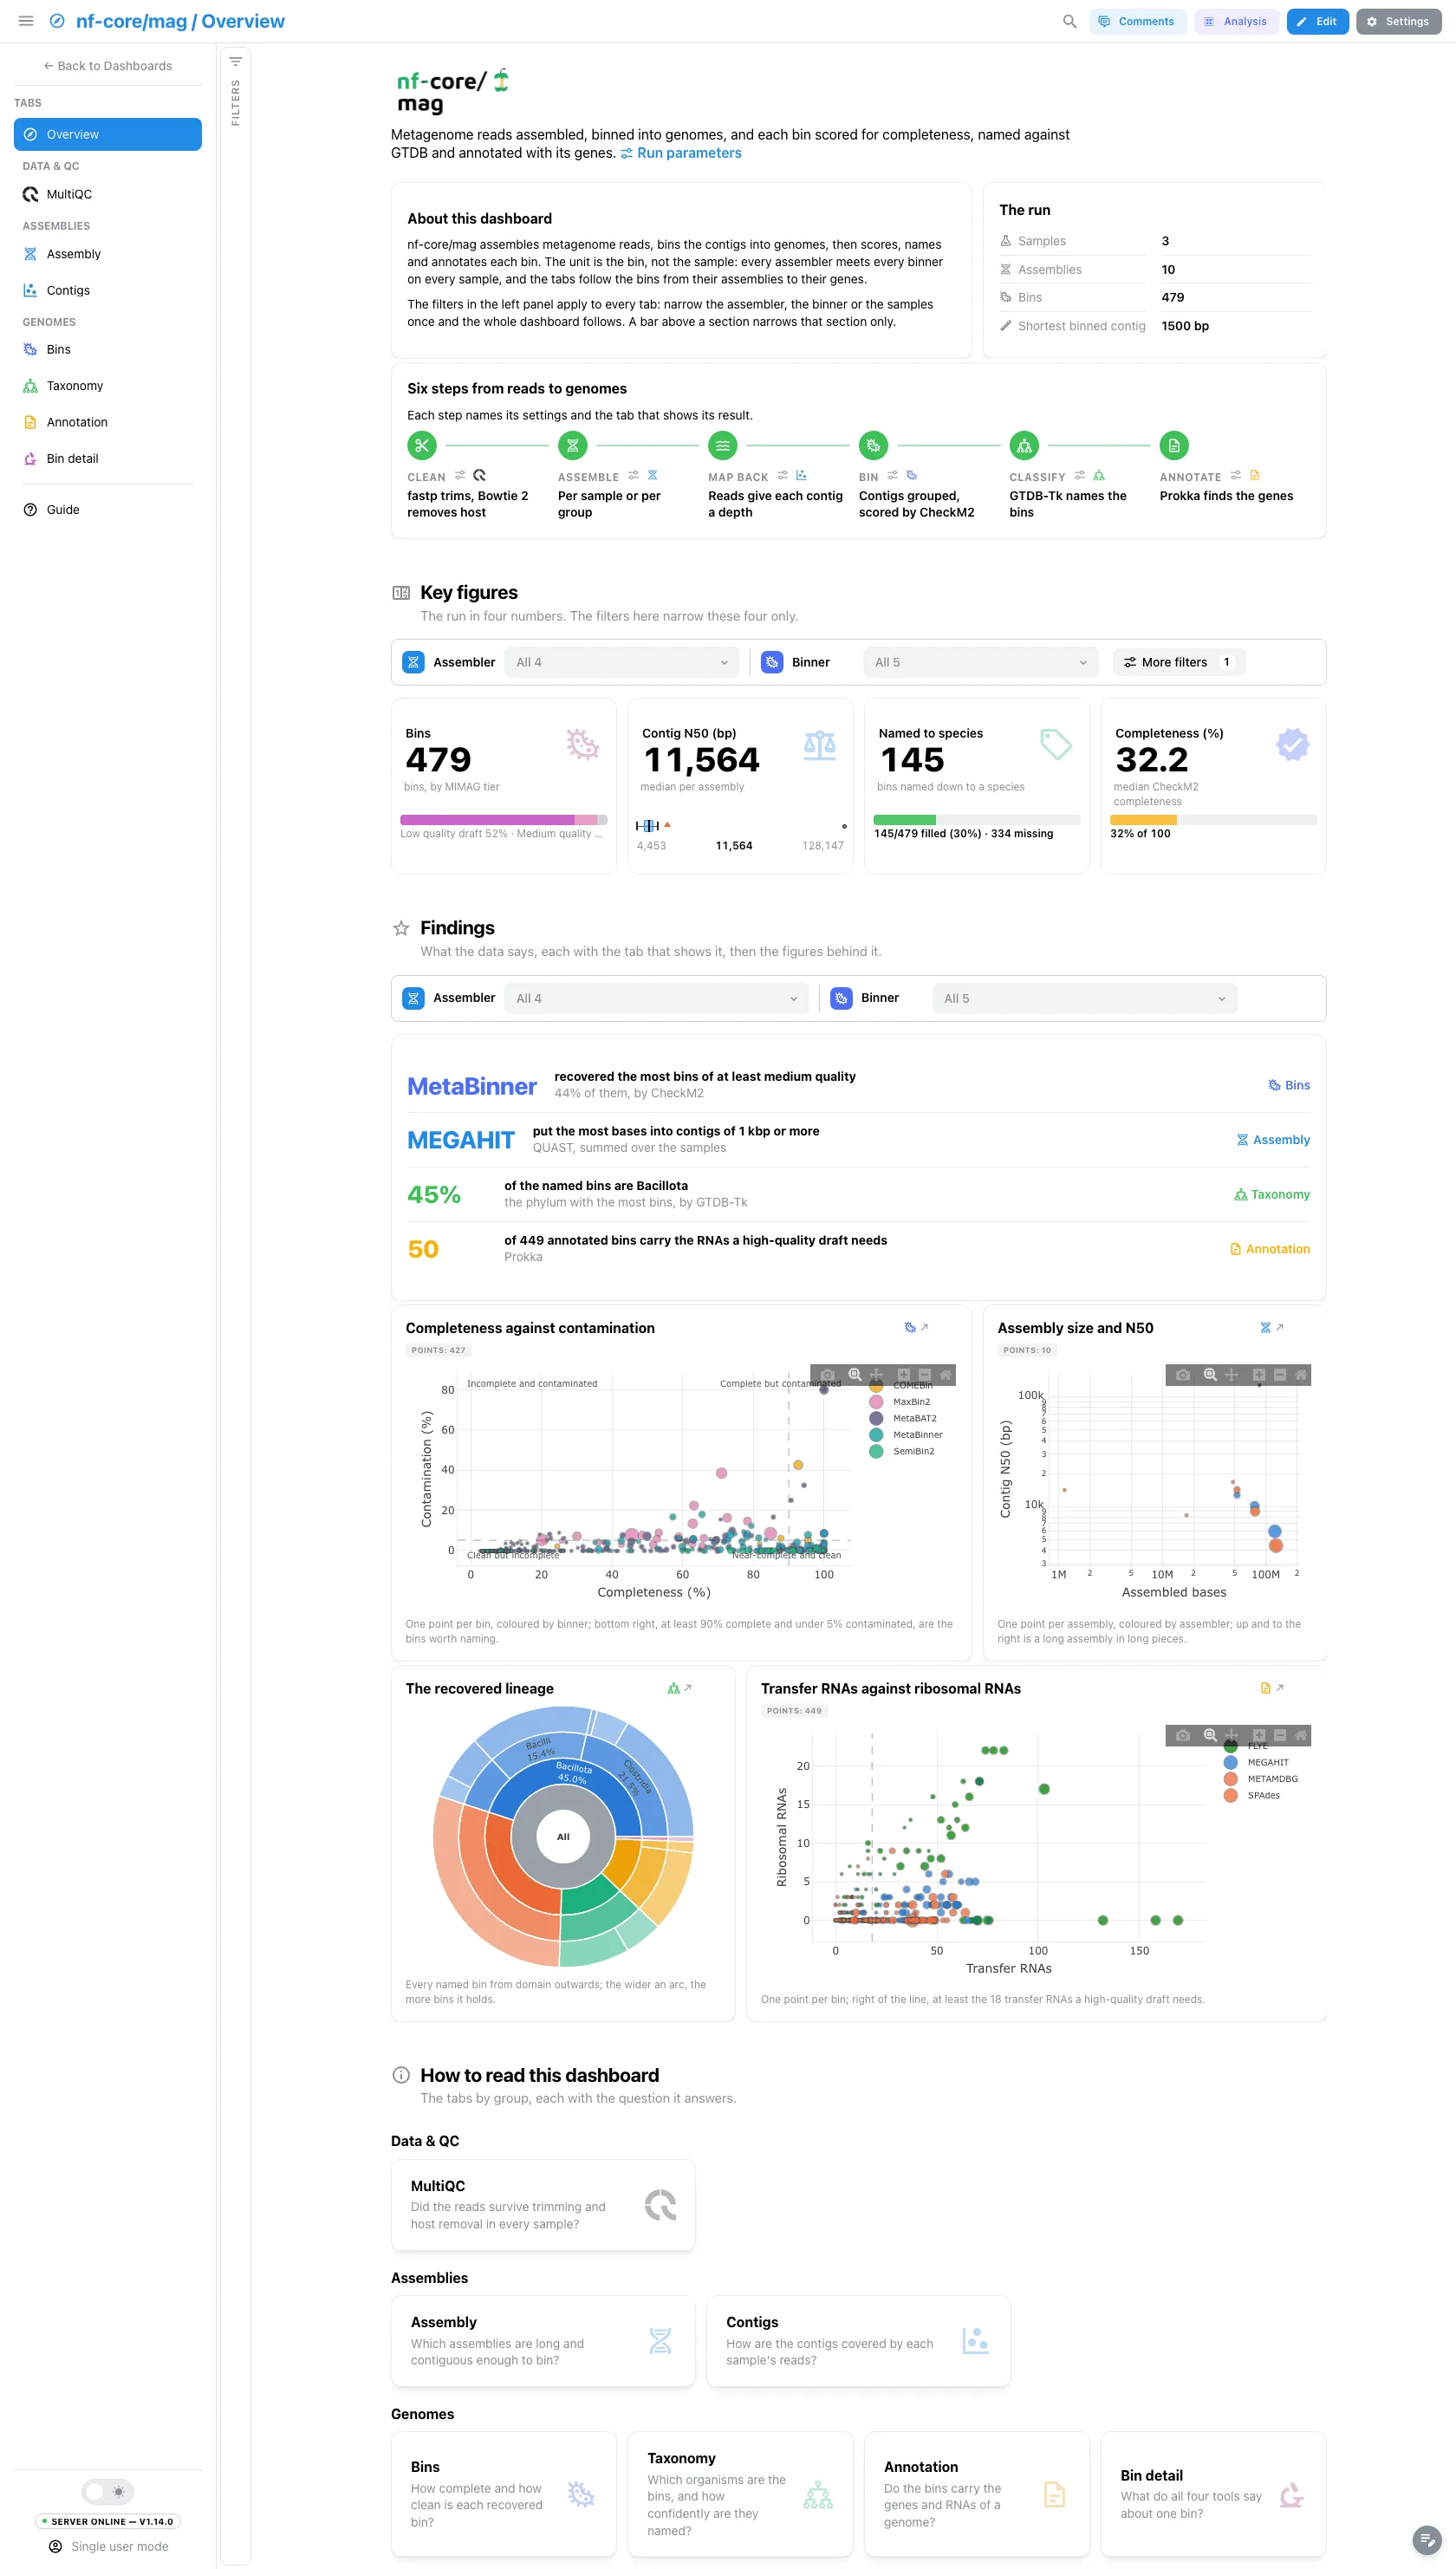
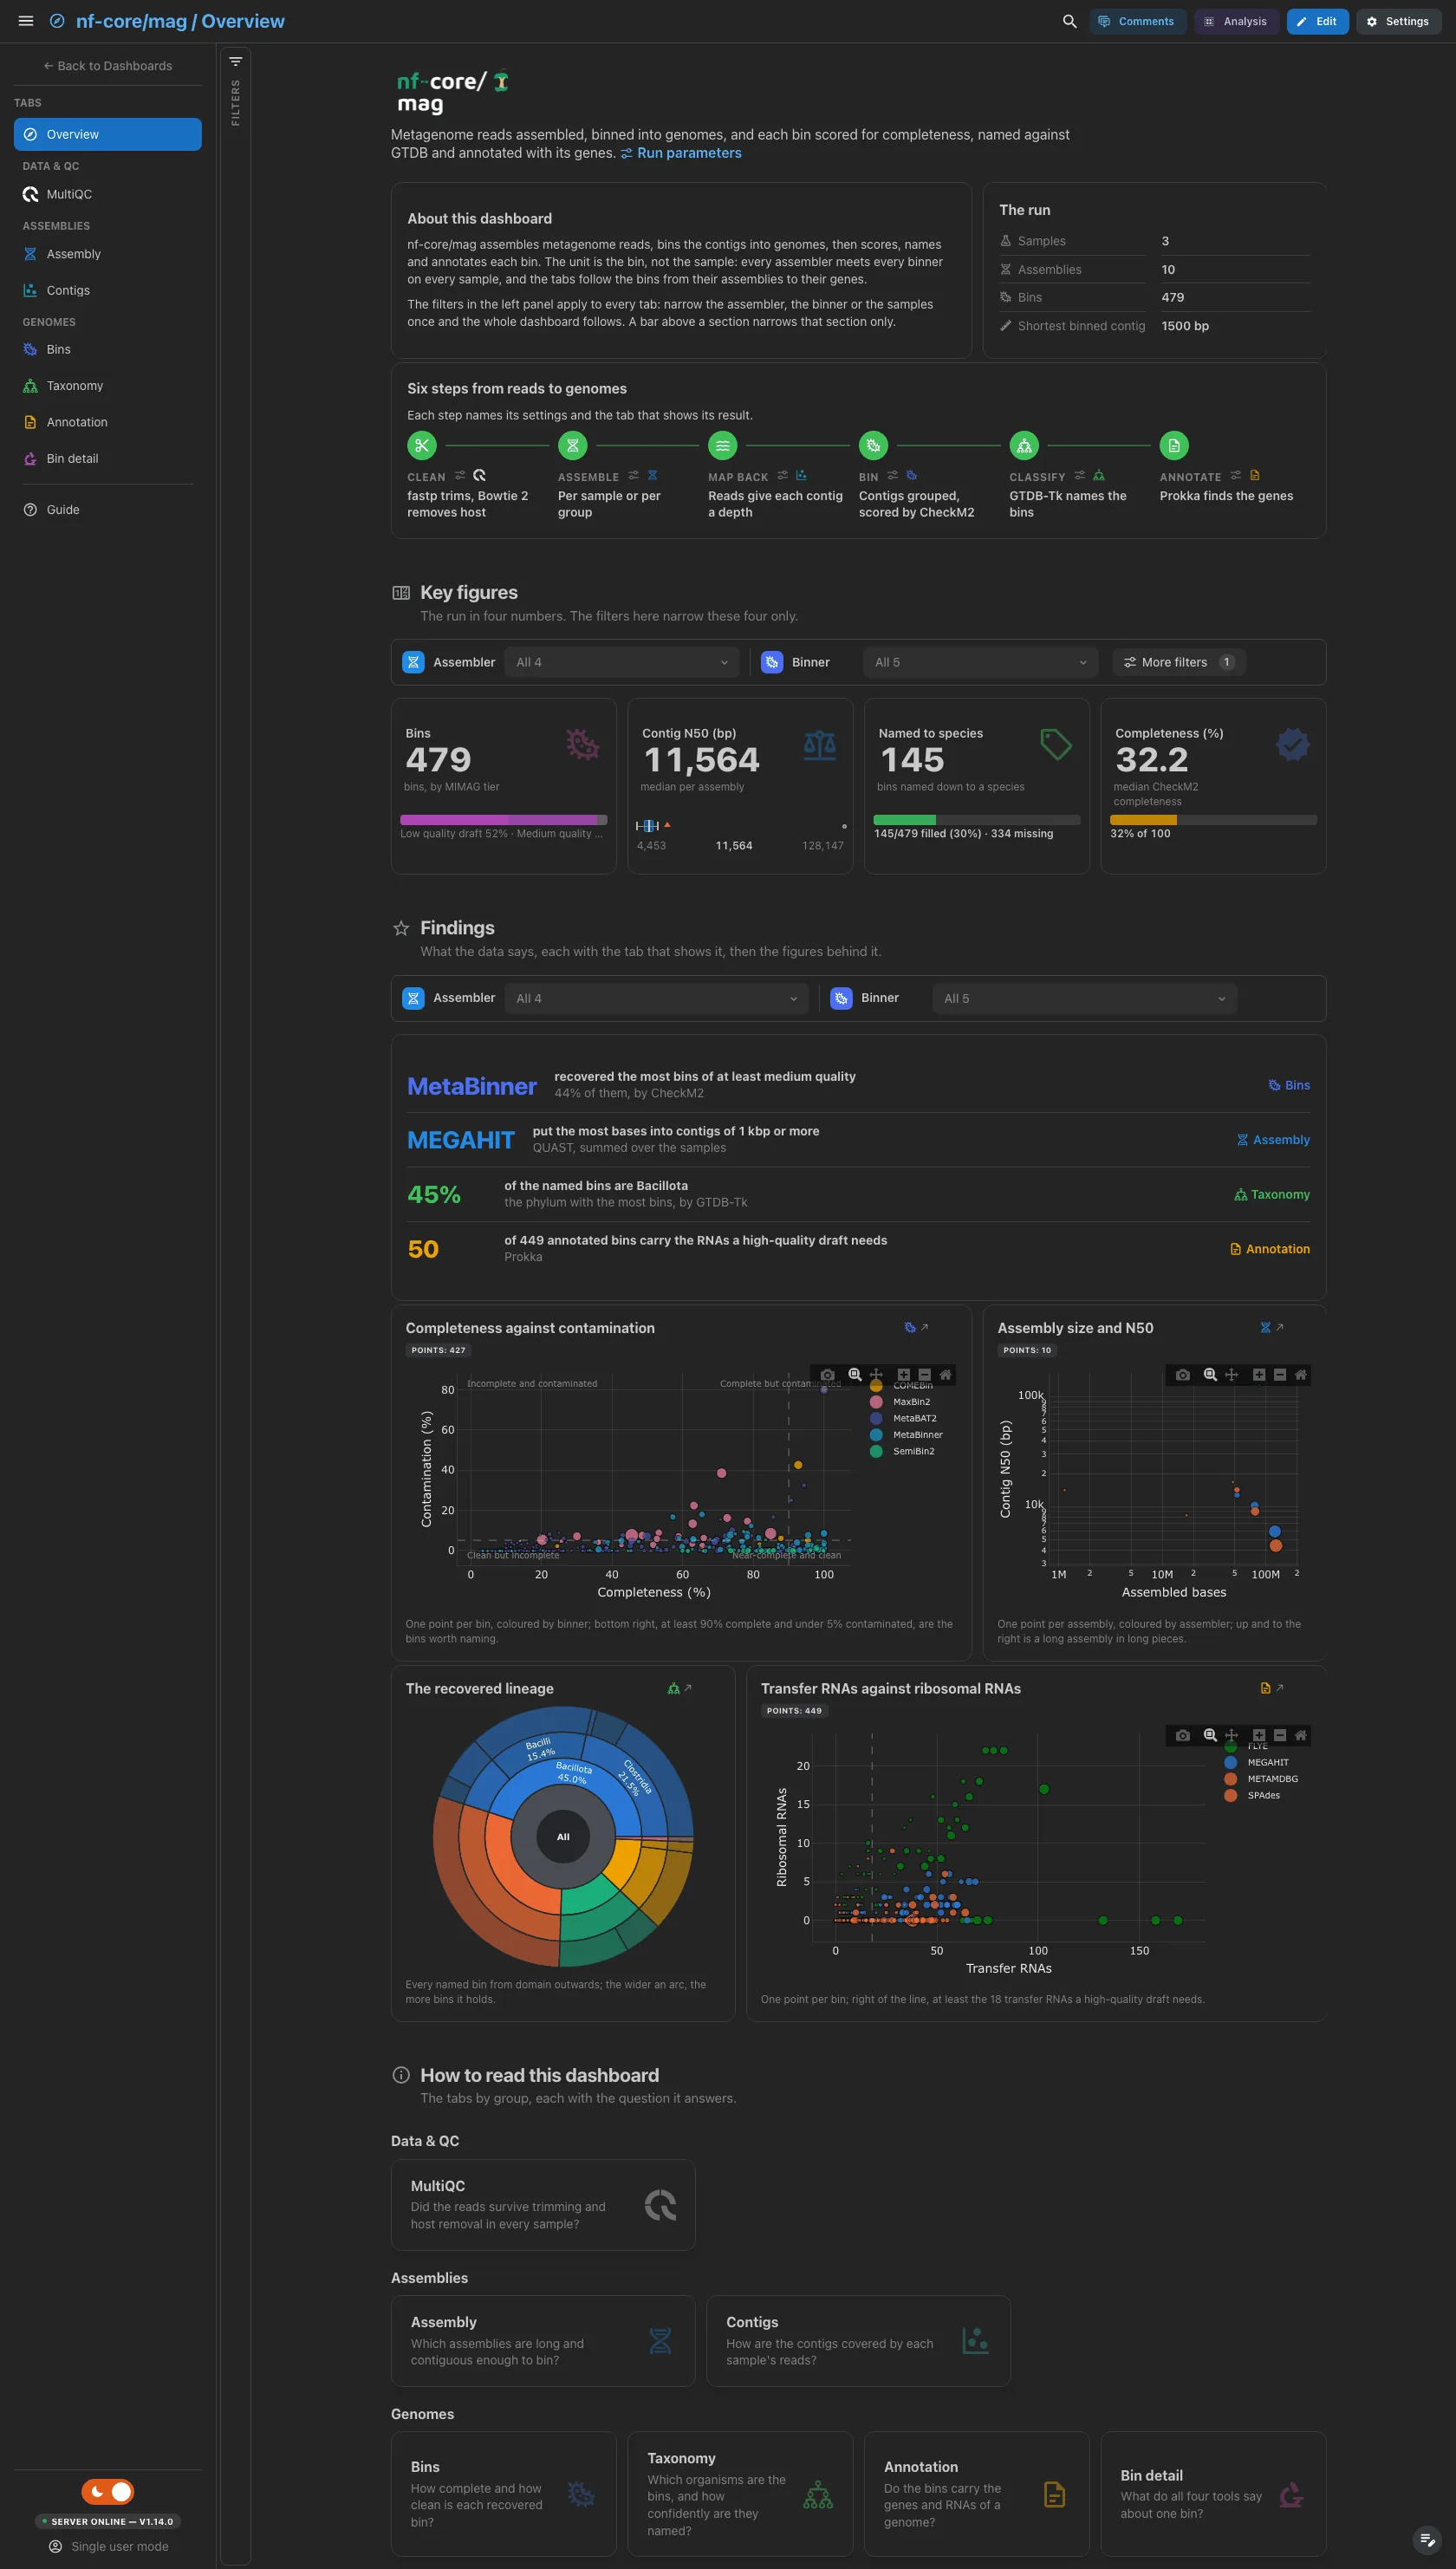
A short hero links the run parameters. About this dashboard says the unit is
the bin and how the two filter levels work, The run lists the samples,
assemblies and bins and the shortest contig the binners were given
(min_contig_size), and Pipeline walks the six steps from cleaning to
annotation, each linked to the parameters that drive it and its tab. The
findings are live values: they follow the filters, and a route that lacks
their data drops them.
Filters and components
Filters · the left panel starts collapsed. Key figures has its own filter bar (assembler, binner and sample), and so does Findings (assembler and binner): each narrows its own section only.
| Section | What it holds |
|---|---|
| Top | Hero, About this dashboard, The run, Pipeline |
| Key figures | 4 headline cards: bins by MIMAG tier, contig N50, bins named to species, CheckM2 completeness |
| Findings | Live result rows, then 4 figures: completeness against contamination, assembled length against contig N50, the GTDB lineage sunburst and transfer against ribosomal RNAs |
| How to read this dashboard | The tabs by group, each with its question |
Data & QC · Did the reads survive trimming and host removal in every sample?
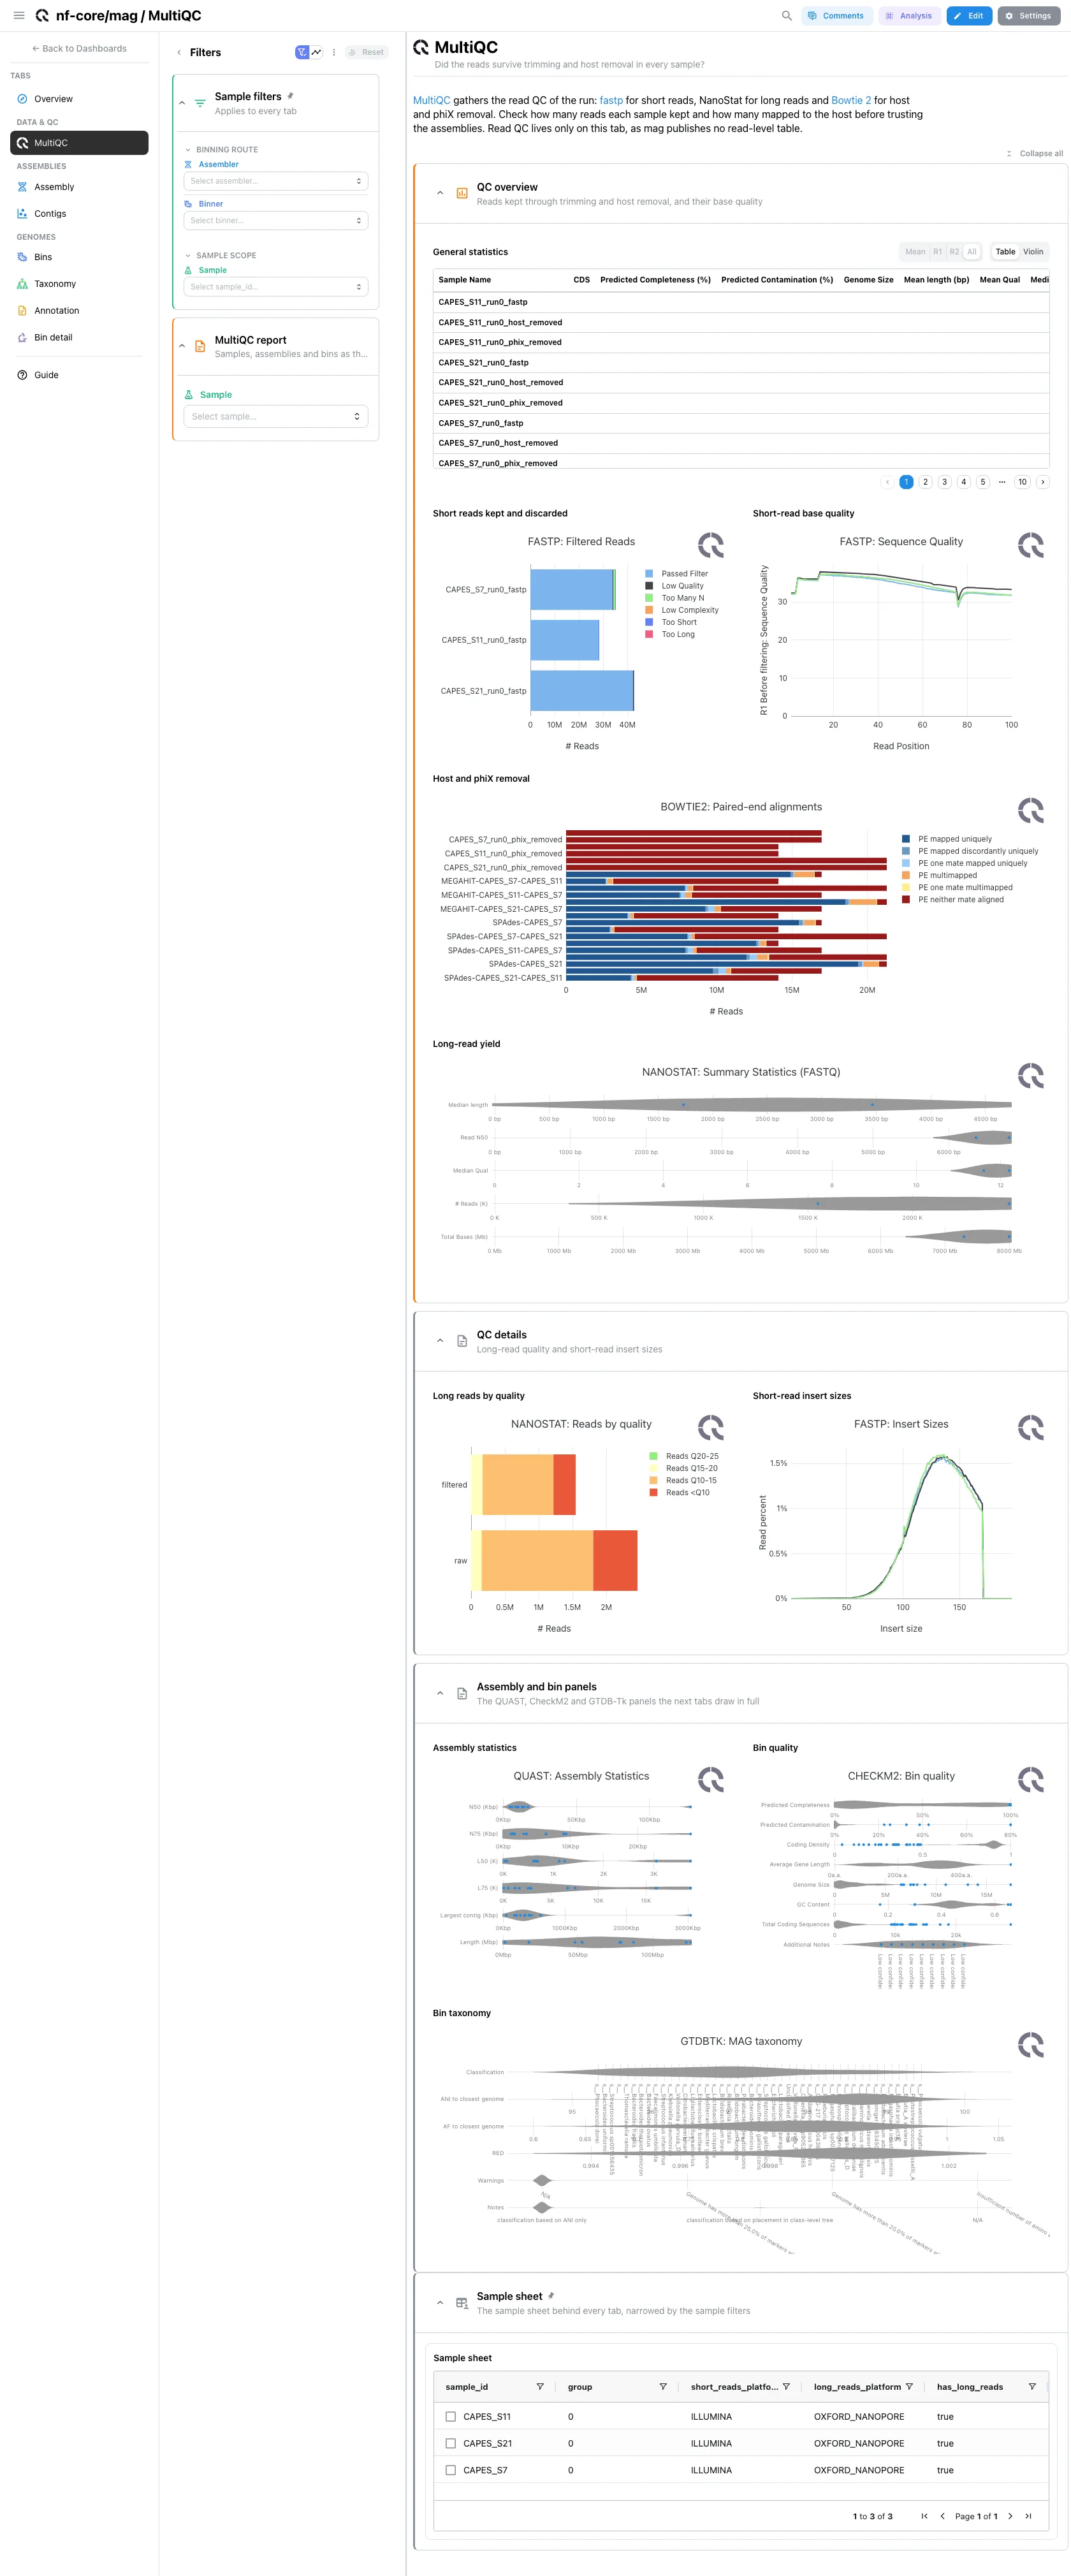
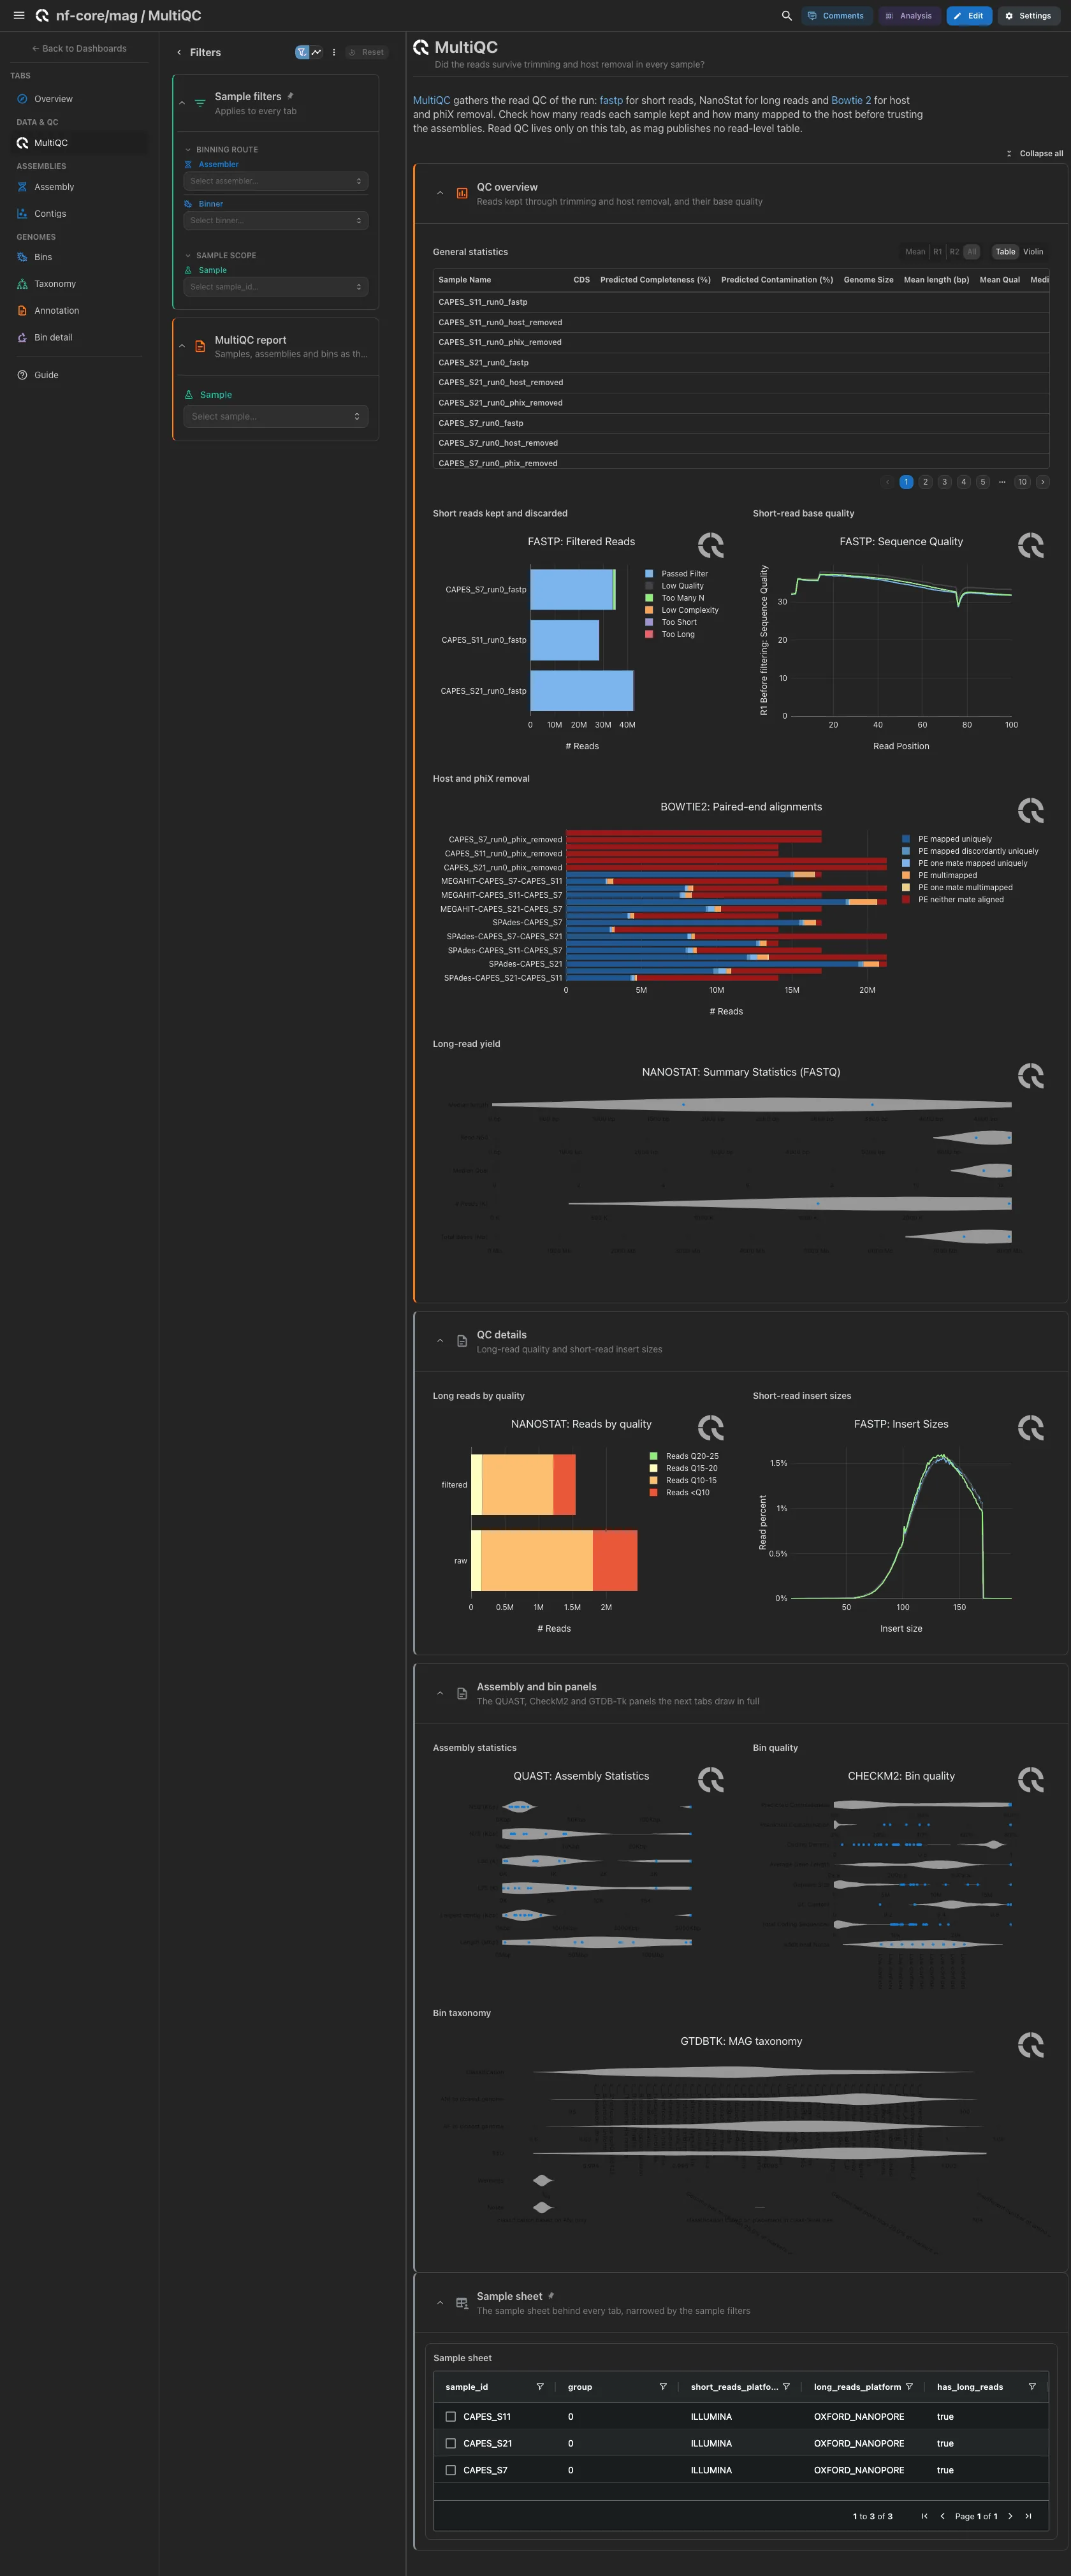
MultiQC panels only, and the only home of the read QC: fastp writes JSON and NanoPlot free text, neither of which a table collection reads. Open: general statistics, fastp reads kept and base quality side by side, then Bowtie 2 host and phiX removal and the NanoStat long-read yield at full width, one bar per library. Long reads by quality and short-read insert sizes are collapsed, and so are the QUAST, CheckM2 and GTDB-Tk panels the next tabs draw in full.
Filters and components
Filters · Sample, read from the MultiQC report.
| Section | What it holds |
|---|---|
| QC overview | 5 MultiQC panels |
| QC details (collapsed) | 2 MultiQC panels |
| Assembly and bin panels (collapsed) | 3 MultiQC panels |
Assemblies · Which assemblies are long and contiguous enough to bin?
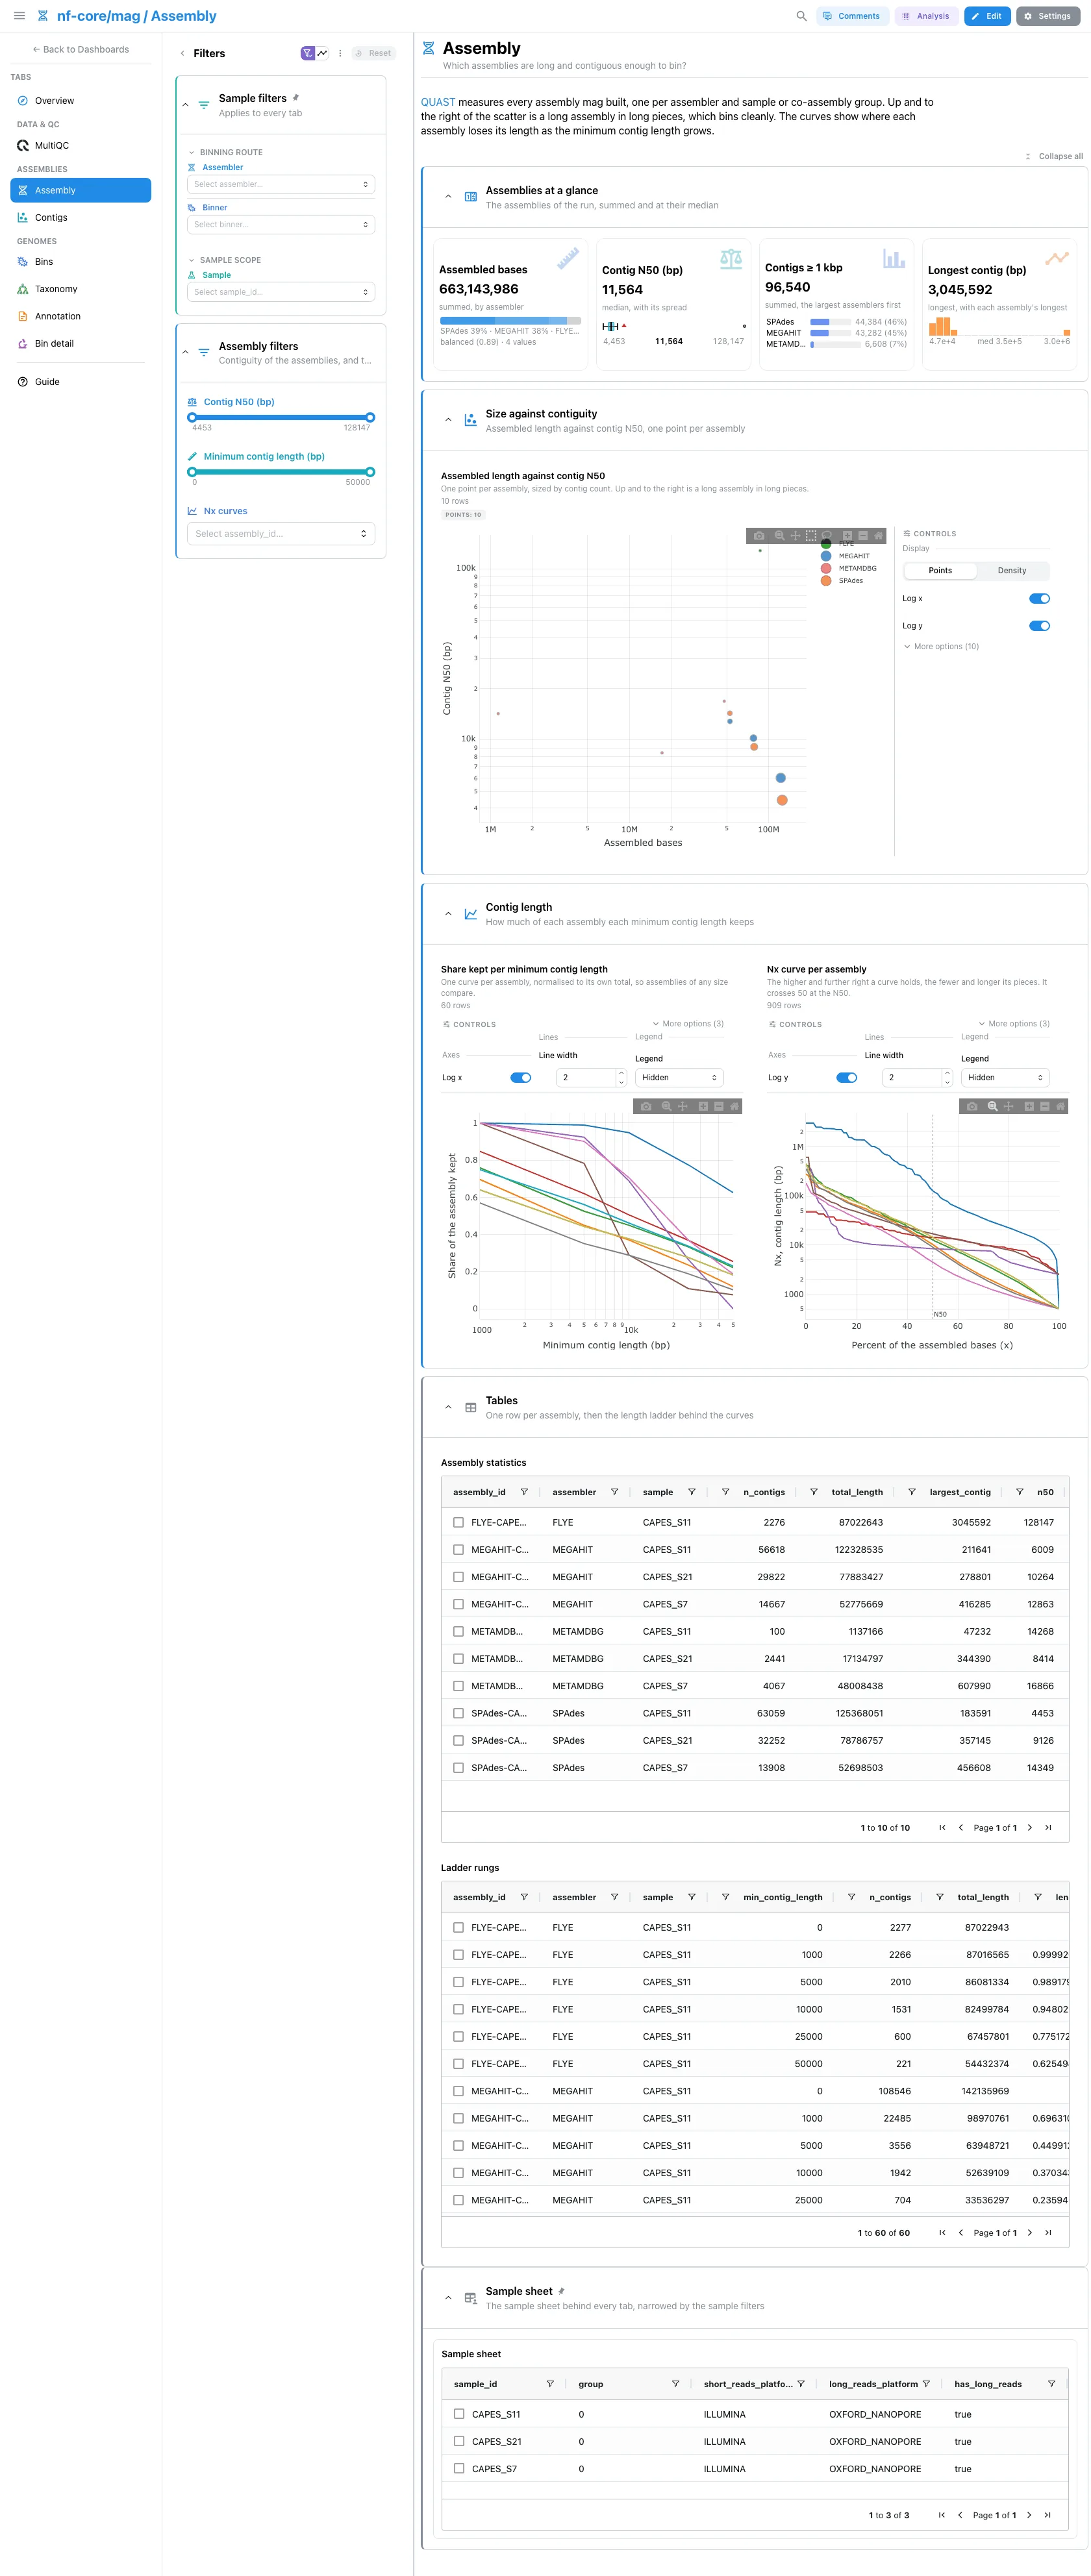
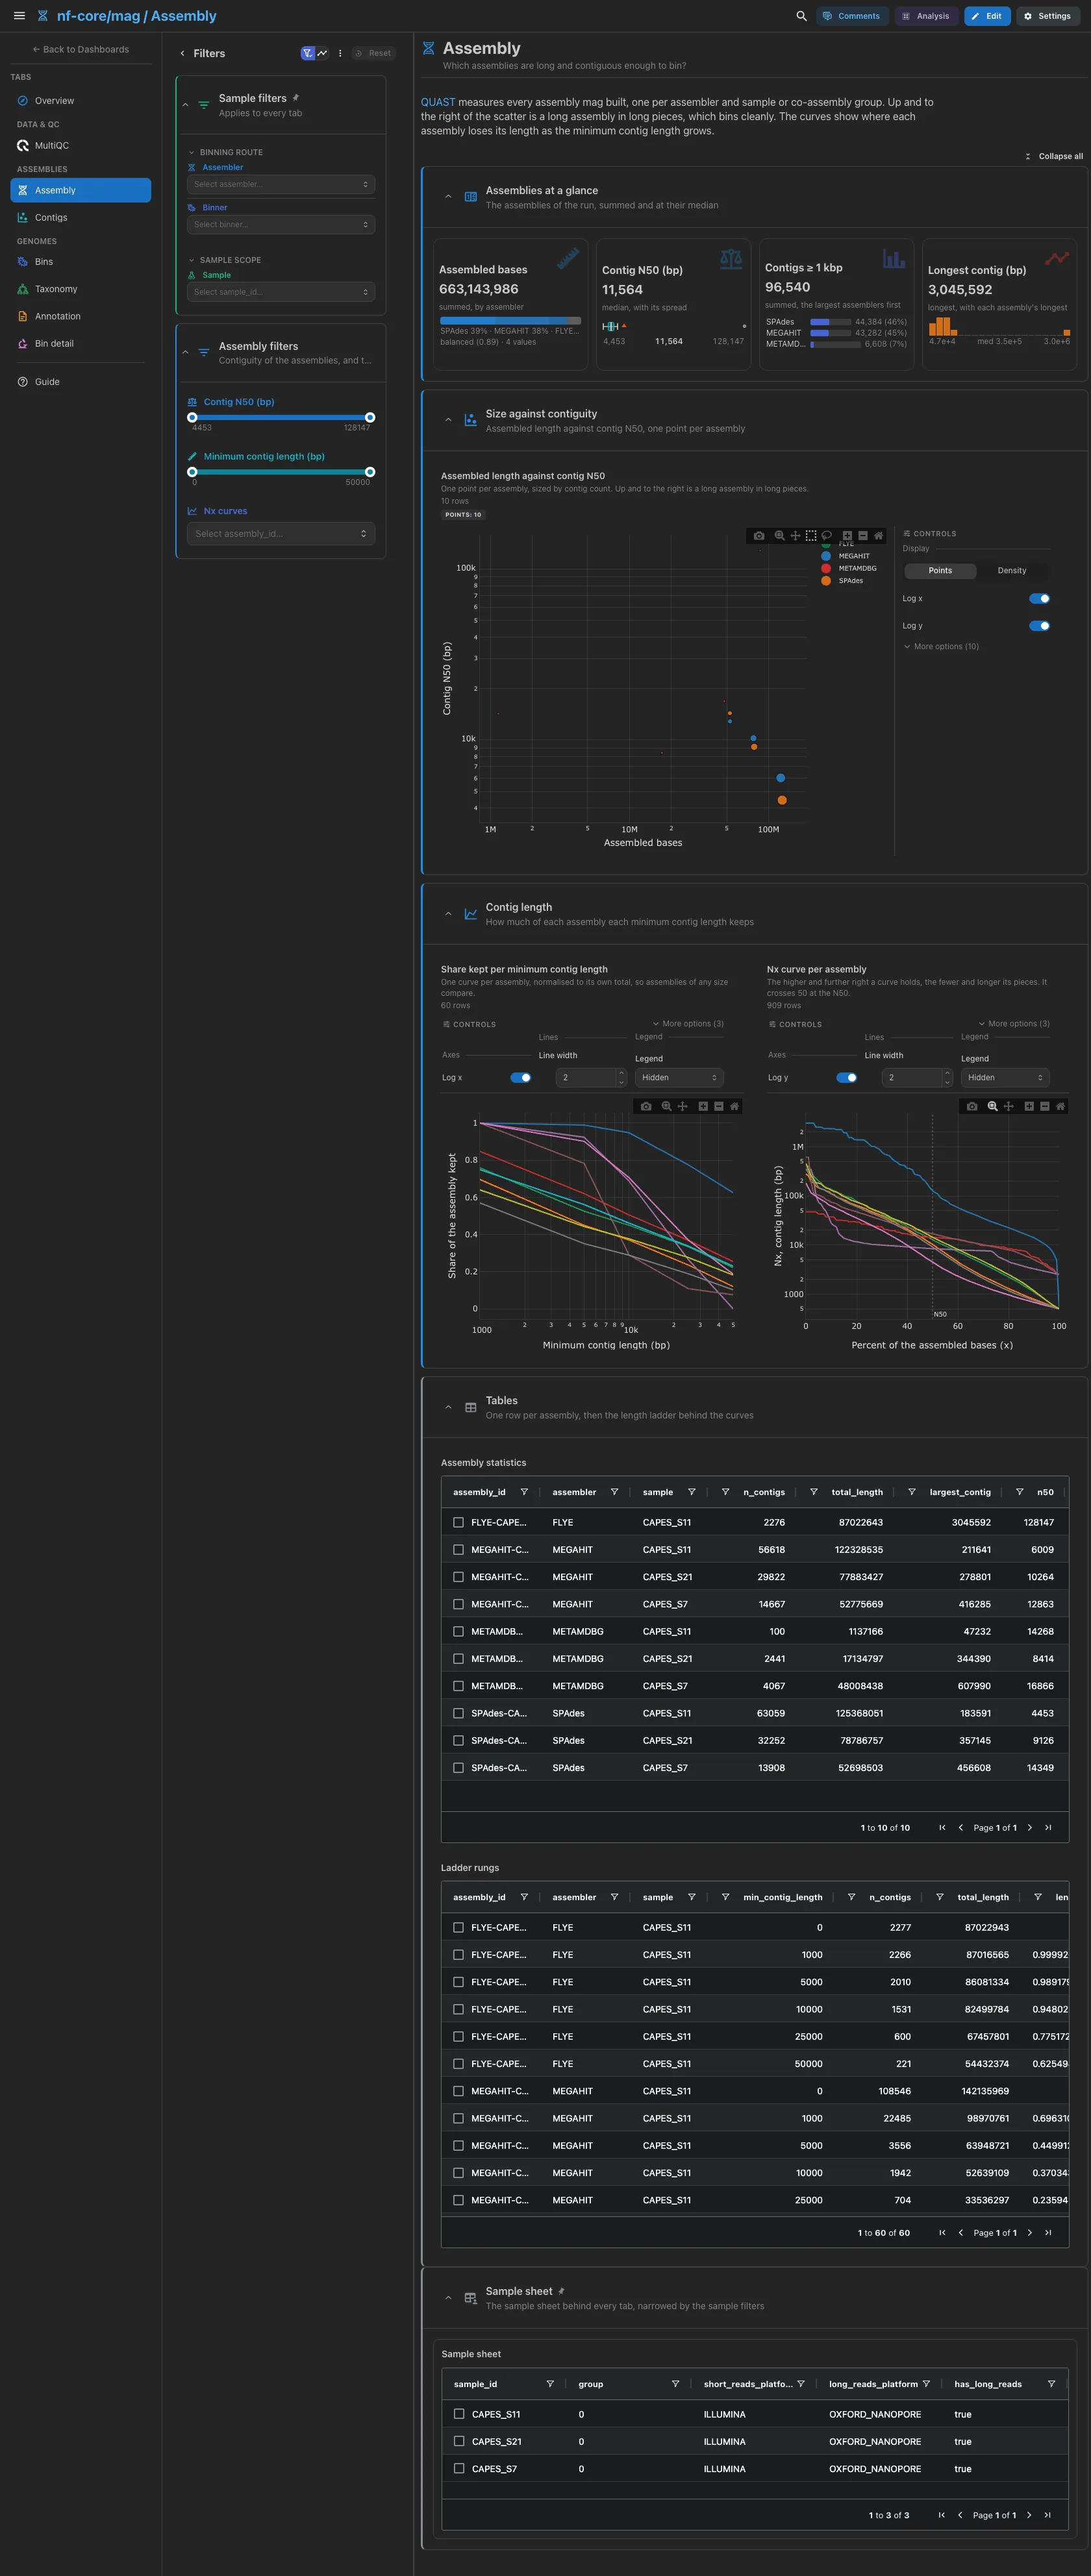
QUAST measures every assembly mag built, one per assembler and sample or co-assembly group. Assembled bases by assembler, the median contig N50, the contigs of at least 1 kbp and the longest contig. Then assembled length against contig N50, one point per assembly: up and to the right is a long assembly in long pieces, which bins cleanly. The share of each assembly kept per QUAST minimum contig length sits beside the Nx curve, built with QUAST's 500 bp floor so it crosses 50 at the QUAST N50; an assembly without a depth table has no curve. The assembly statistics and the ladder rungs are collapsed.
Filters and components
Filters · a Contig N50 (bp) range on assembly_report, a Minimum
contig length (bp) range on length_ladder that keeps each curve whole
inside the window, and Nx curves on assembly_nx, the assemblies the
Nx curve draws.
| Section | What it holds |
|---|---|
| Assemblies at a glance | 4 cards |
| Size against contiguity | 1 advanced visualization |
| Contig length | 2 advanced visualizations: the share kept per minimum contig length and the Nx curve |
| Tables (collapsed) | Assembly statistics, Ladder rungs |
Assemblies · How are the contigs covered by each sample's reads?
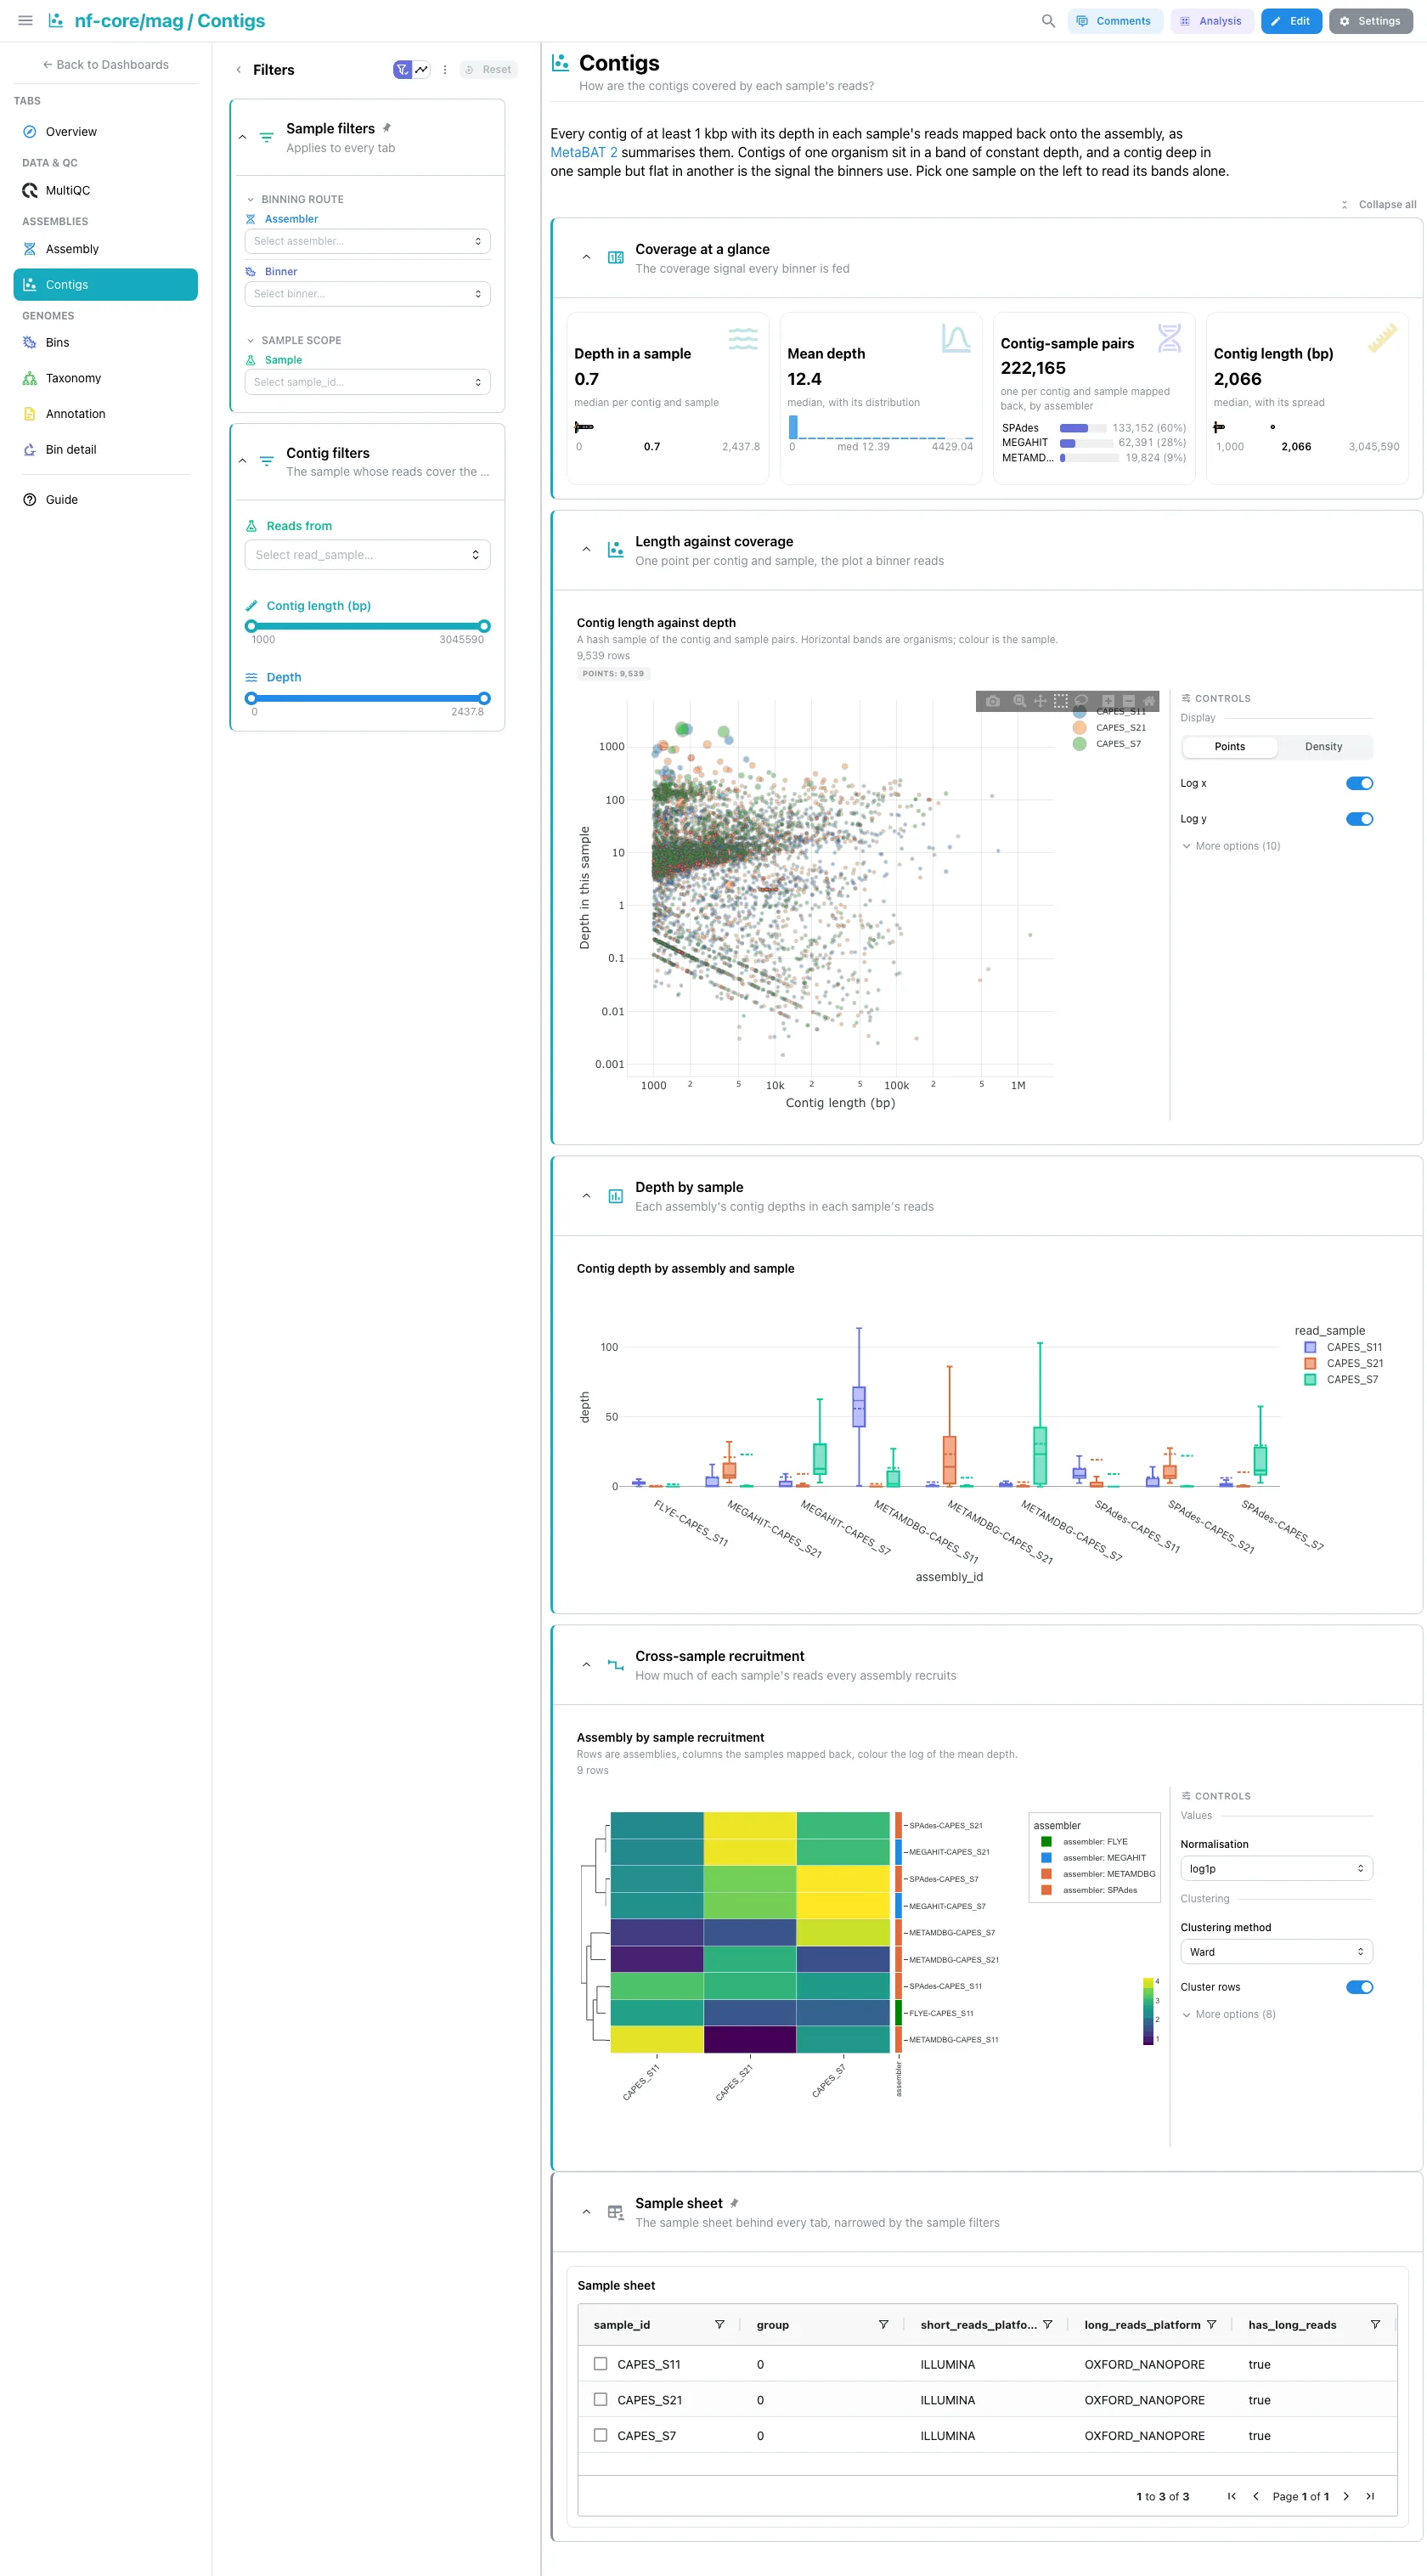
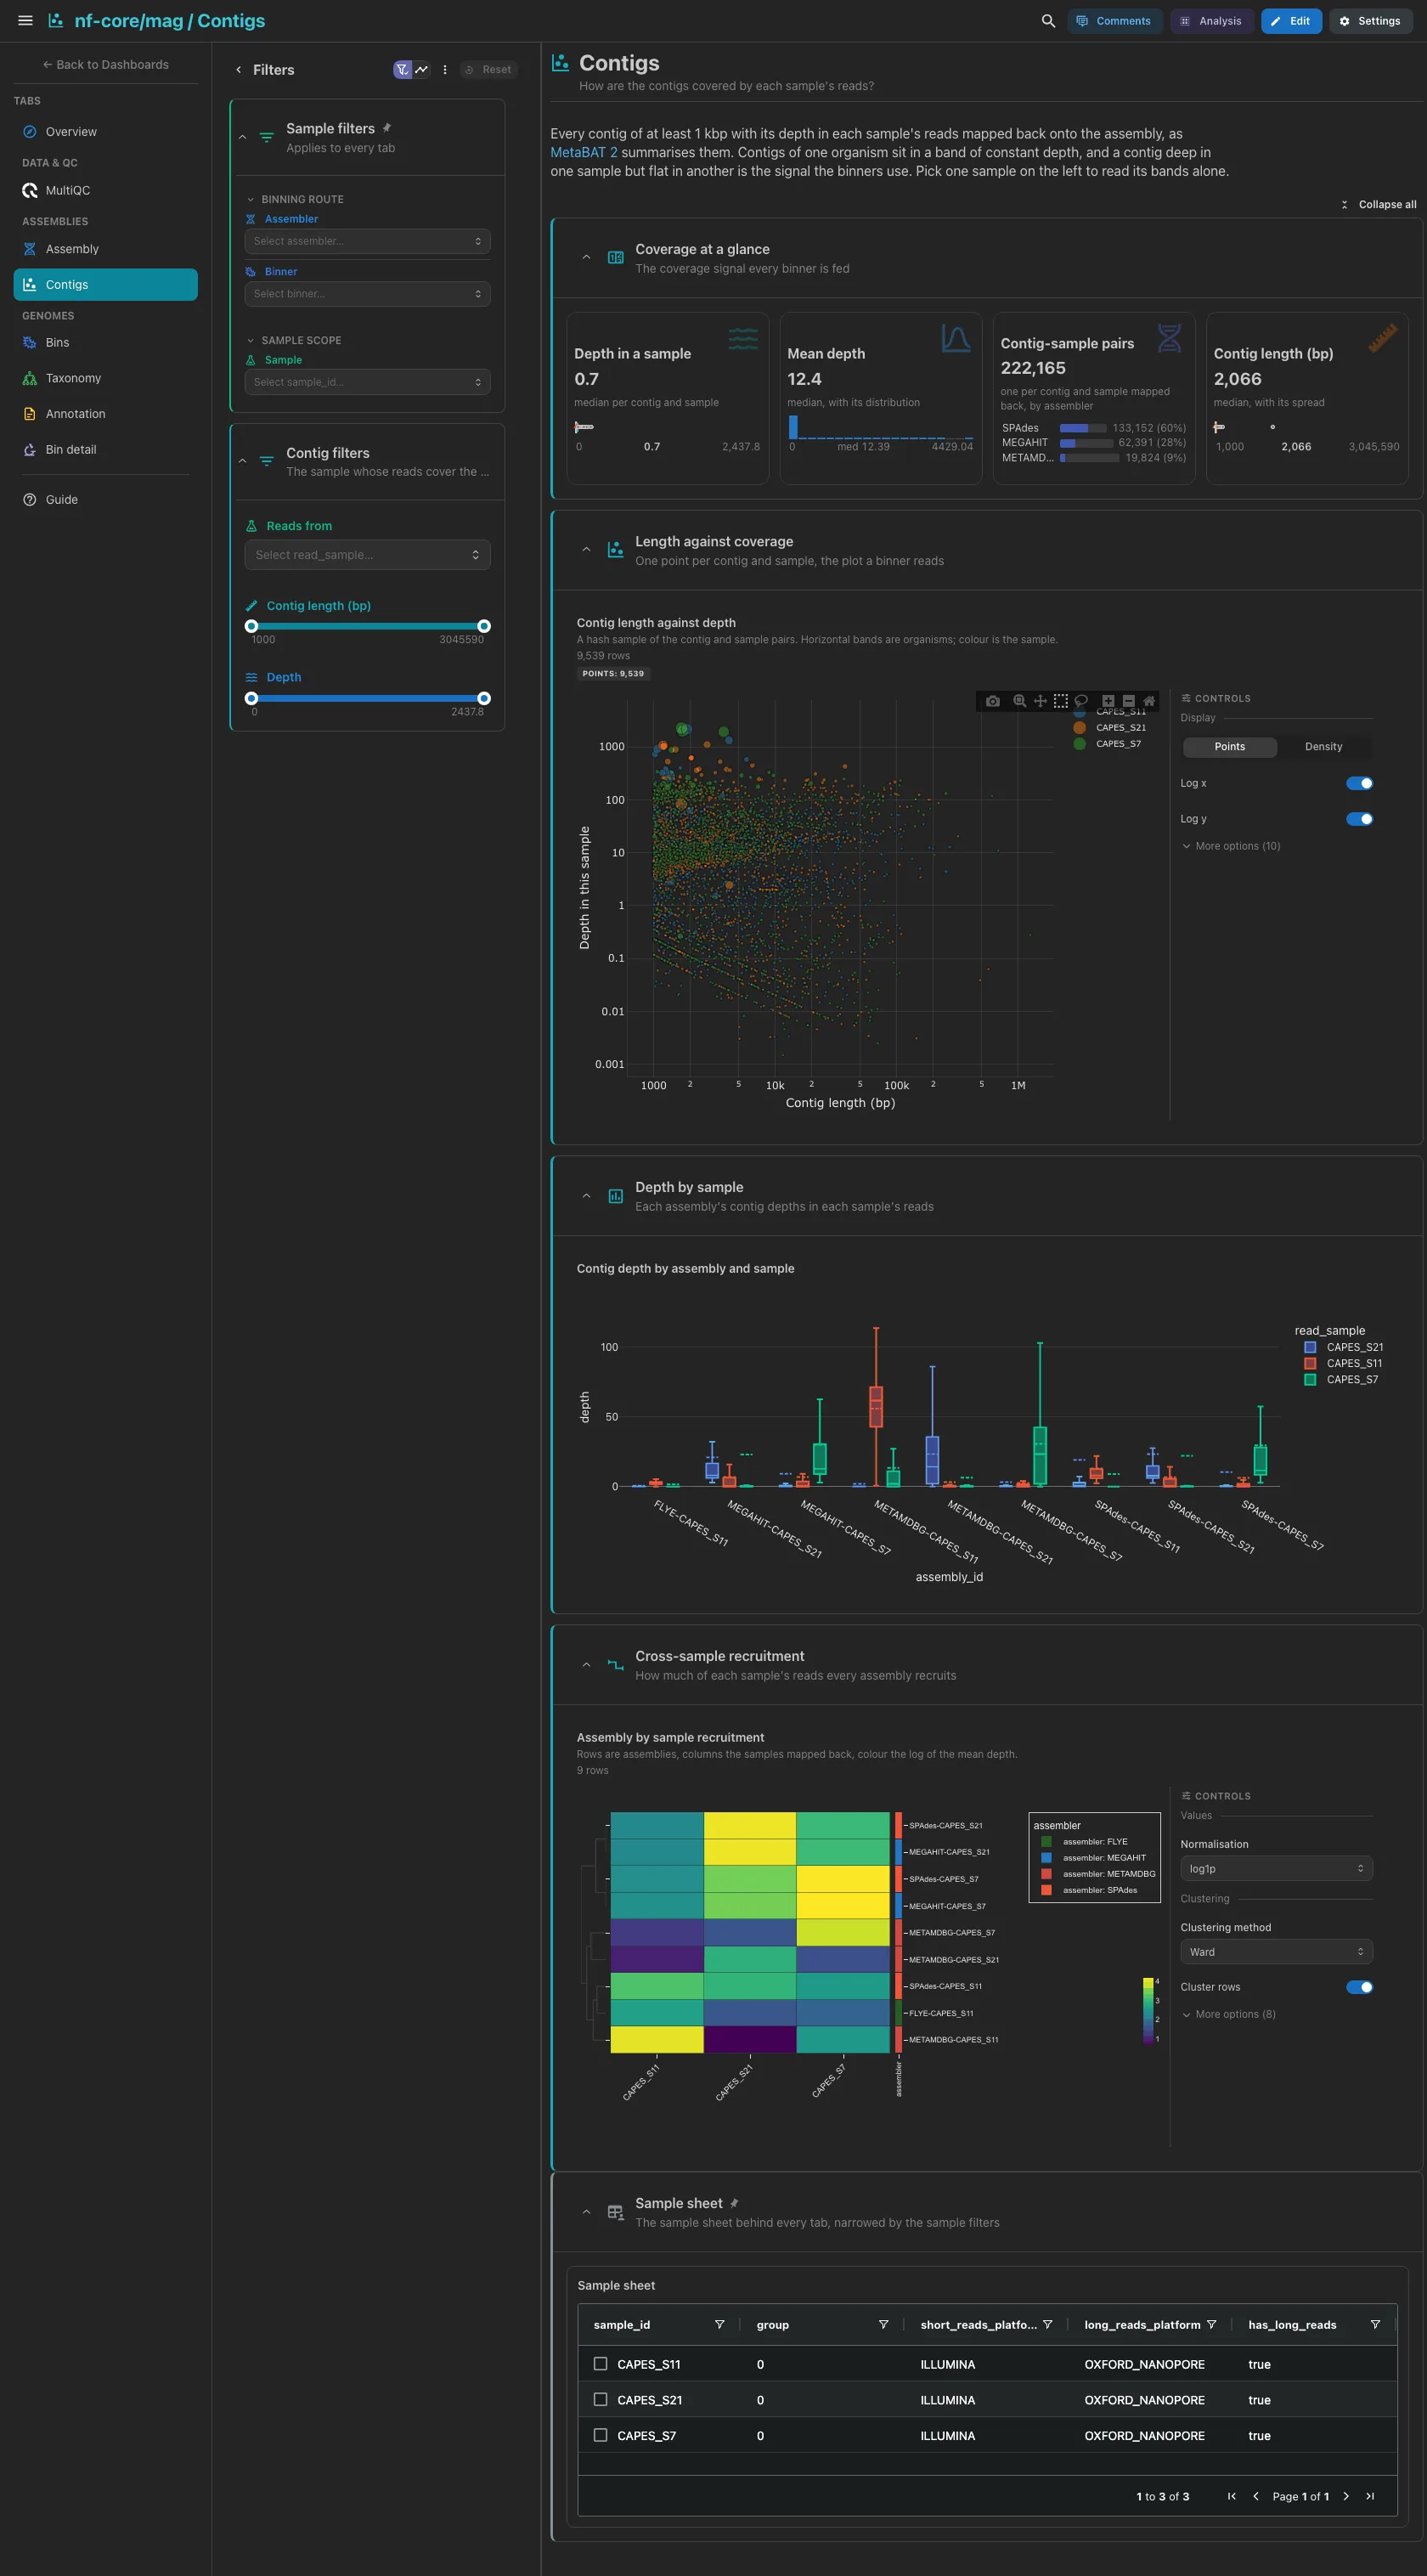
Every contig of at least 1 kbp, once per sample whose reads were mapped back onto its assembly. The median depth of a contig in a sample, the median mean depth, the contig and sample pairs by assembler (contig names repeat across assemblies, so the rows are counted) and the median contig length. Then length against depth, the plot a binner reads, drawn from a server-side hash sample and coloured by sample: the contigs of one organism sit in a band of constant depth. The depth of each assembly in each sample's reads follows as boxes, then the recruitment heatmap, one row per assembly and one column per sample.
Filters and components
Filters · Reads from, and Contig length (bp) and Depth ranges,
all on contig_depths. Pick one sample to read its bands alone.
| Section | What it holds |
|---|---|
| Coverage at a glance | 4 cards |
| Length against coverage | 1 advanced visualization |
| Depth by sample | Contig depth by assembly and sample |
| Cross-sample recruitment | 1 advanced visualization (heatmap) |
Genomes · How complete and how clean is each recovered bin?
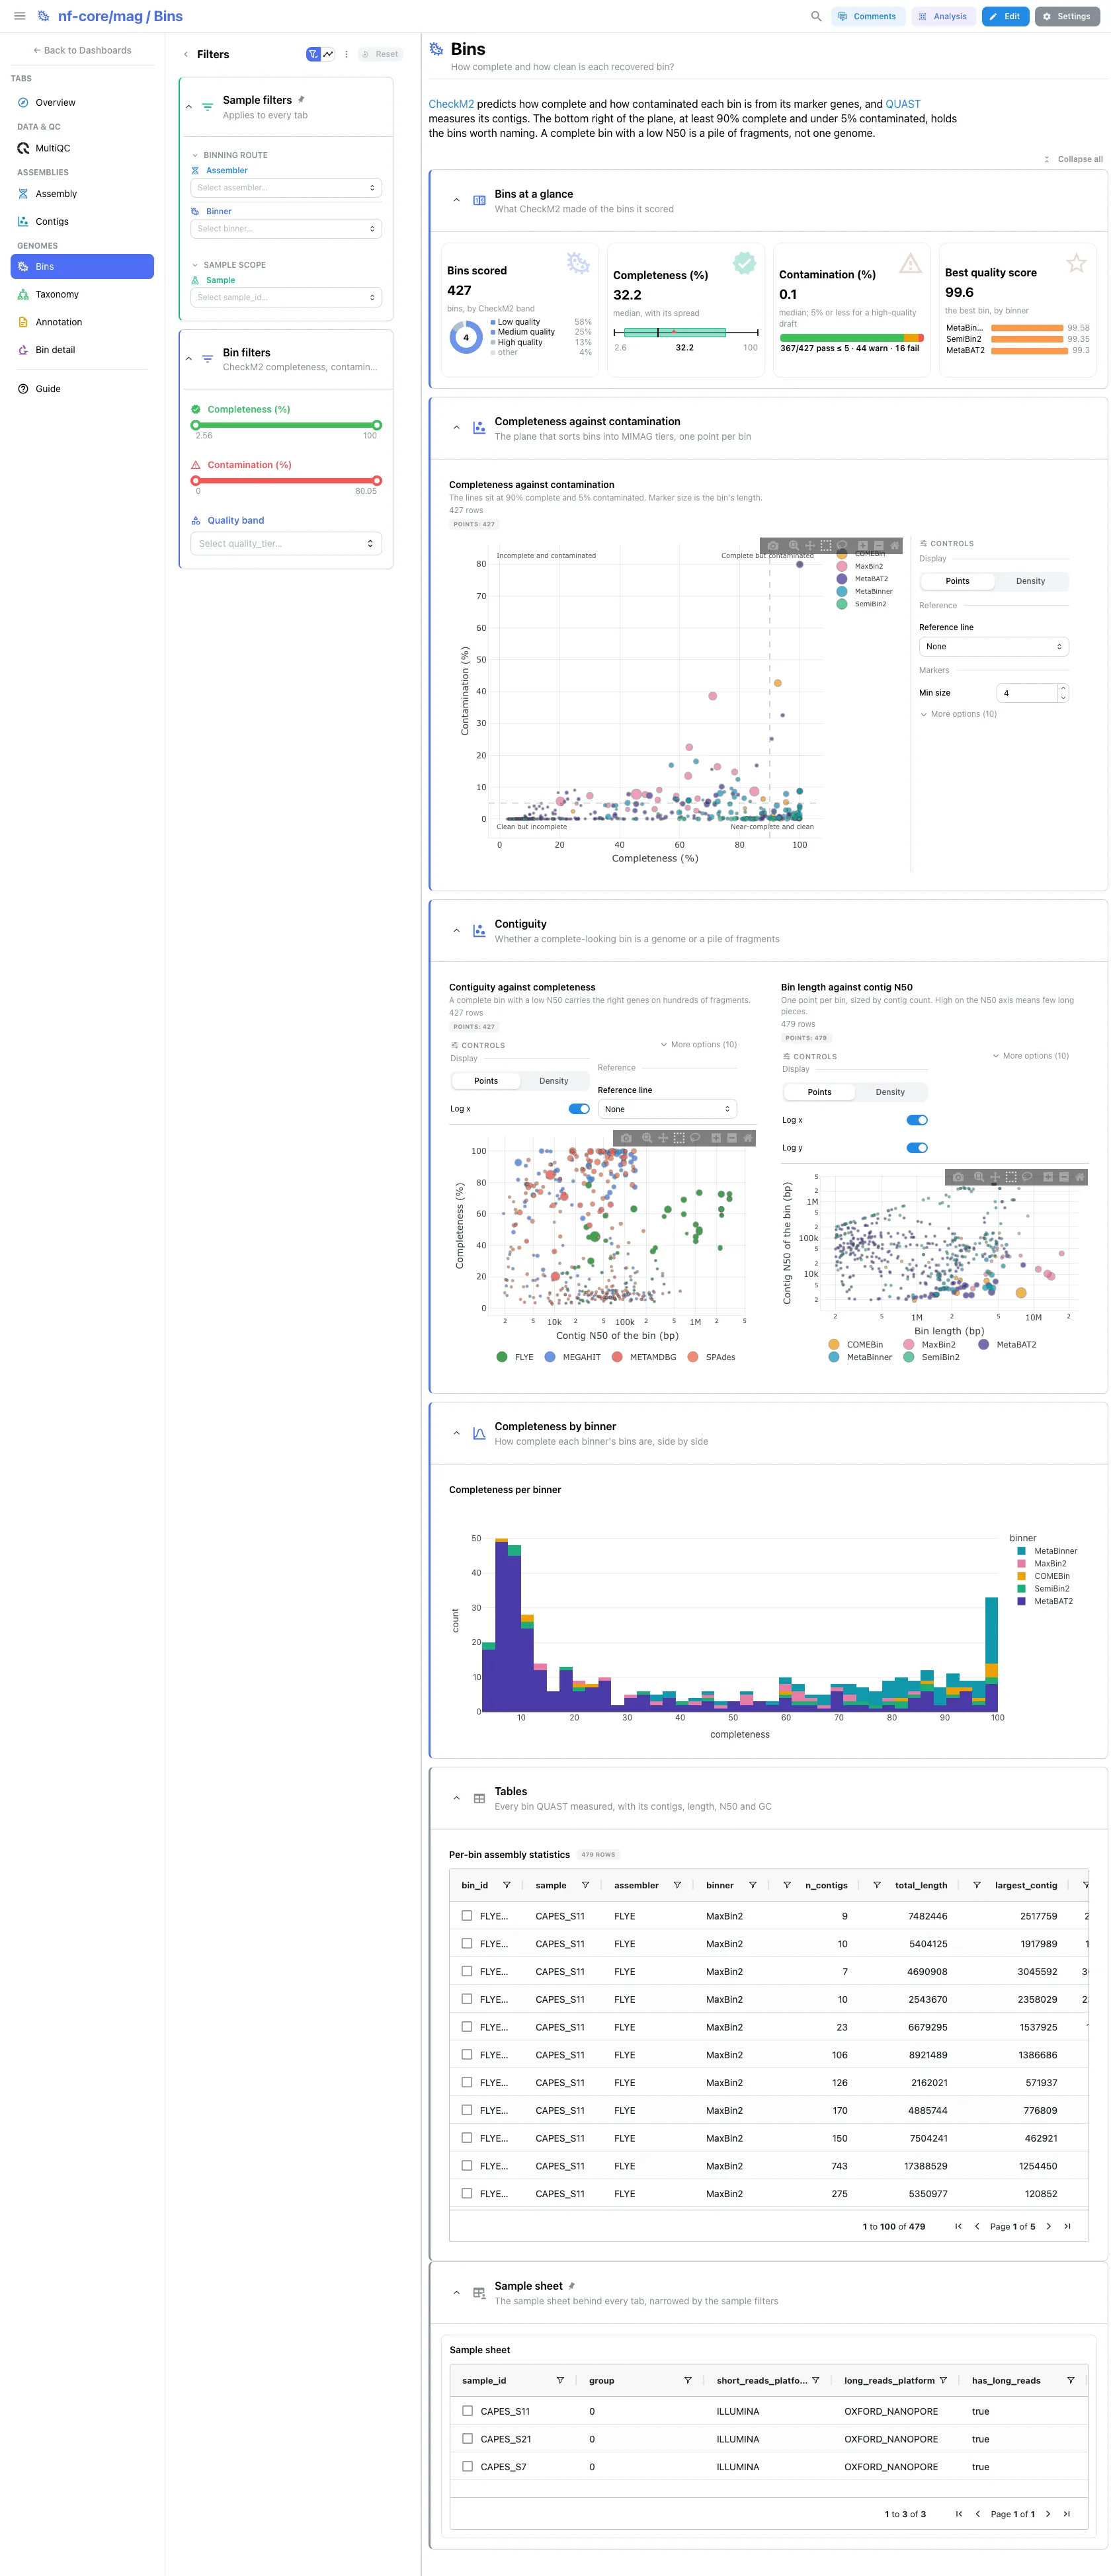
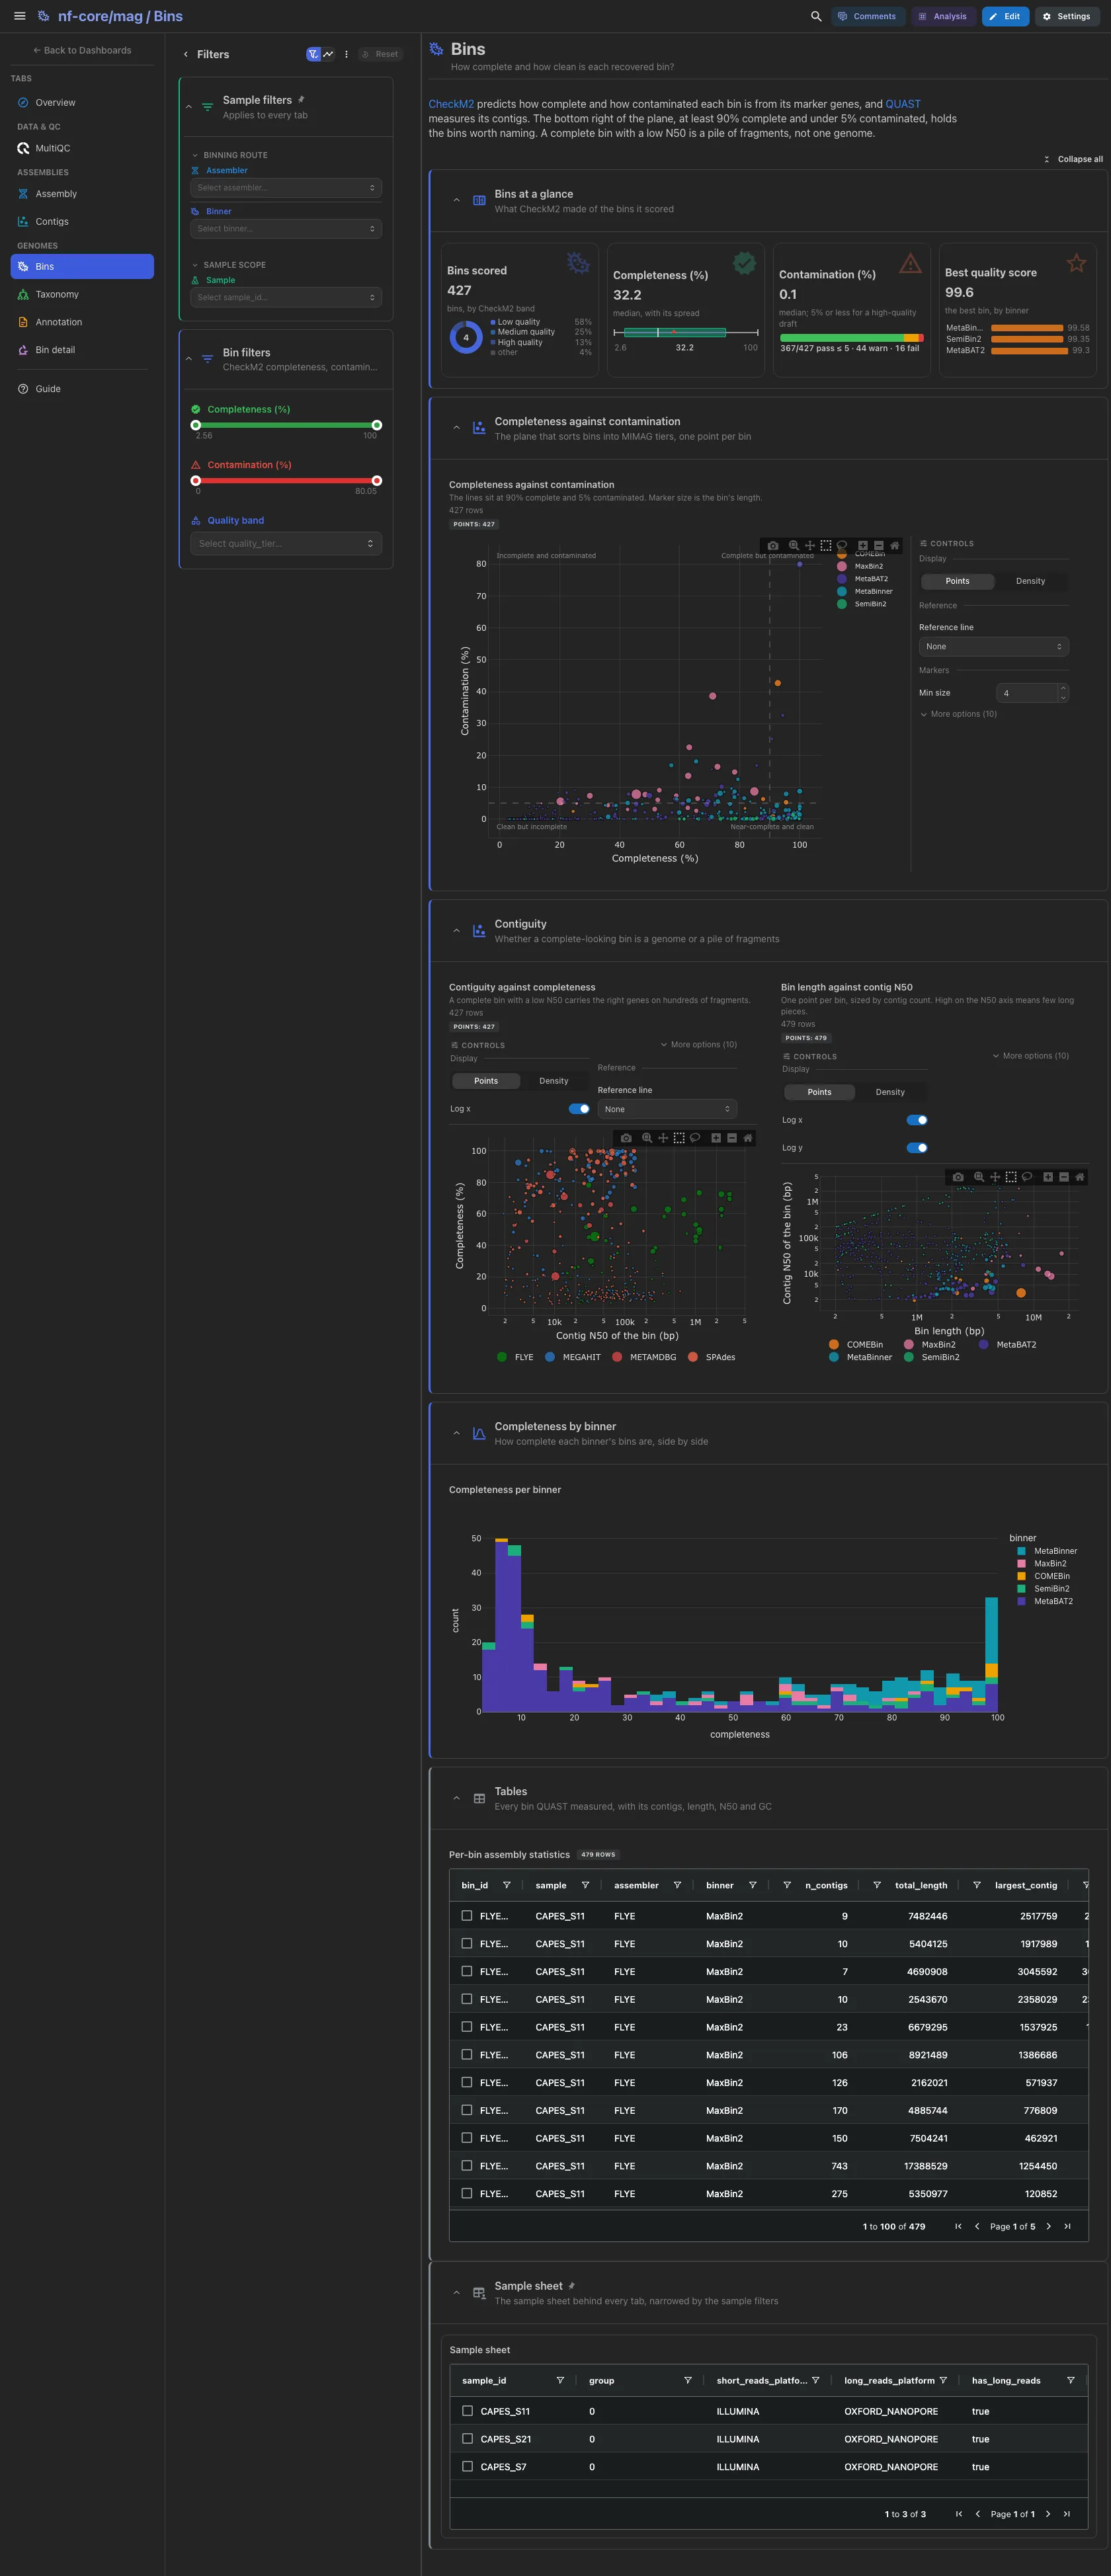
CheckM2 predicts completeness and contamination from marker genes, and QUAST
measures the contigs. The bins scored by CheckM2 band, the median completeness,
the median contamination against the 5% high-quality cut and the best quality
score by binner. Then completeness against contamination, cut into quadrants
at 90% complete and 5% contaminated and coloured by binner, CheckM2 contig N50
against completeness beside QUAST bin length against N50 (a complete bin with
a low N50 is a pile of fragments), and completeness per binner. The QUAST
collection is linked to CheckM2 by bin_id, so the quality filters reach it.
The QUAST per-bin table is collapsed.
Filters and components
Filters · Completeness (%) and Contamination (%) ranges and a
Quality band picker on checkm2_quality_report.
| Section | What it holds |
|---|---|
| Bins at a glance | 4 cards |
| Completeness against contamination | 1 advanced visualization |
| Contiguity | 2 advanced visualizations: contiguity against completeness and bin length against contig N50 |
| Completeness by binner | Completeness per binner |
| Tables (collapsed) | Per-bin assembly statistics |
Genomes · Which organisms are the bins, and how confidently are they named?
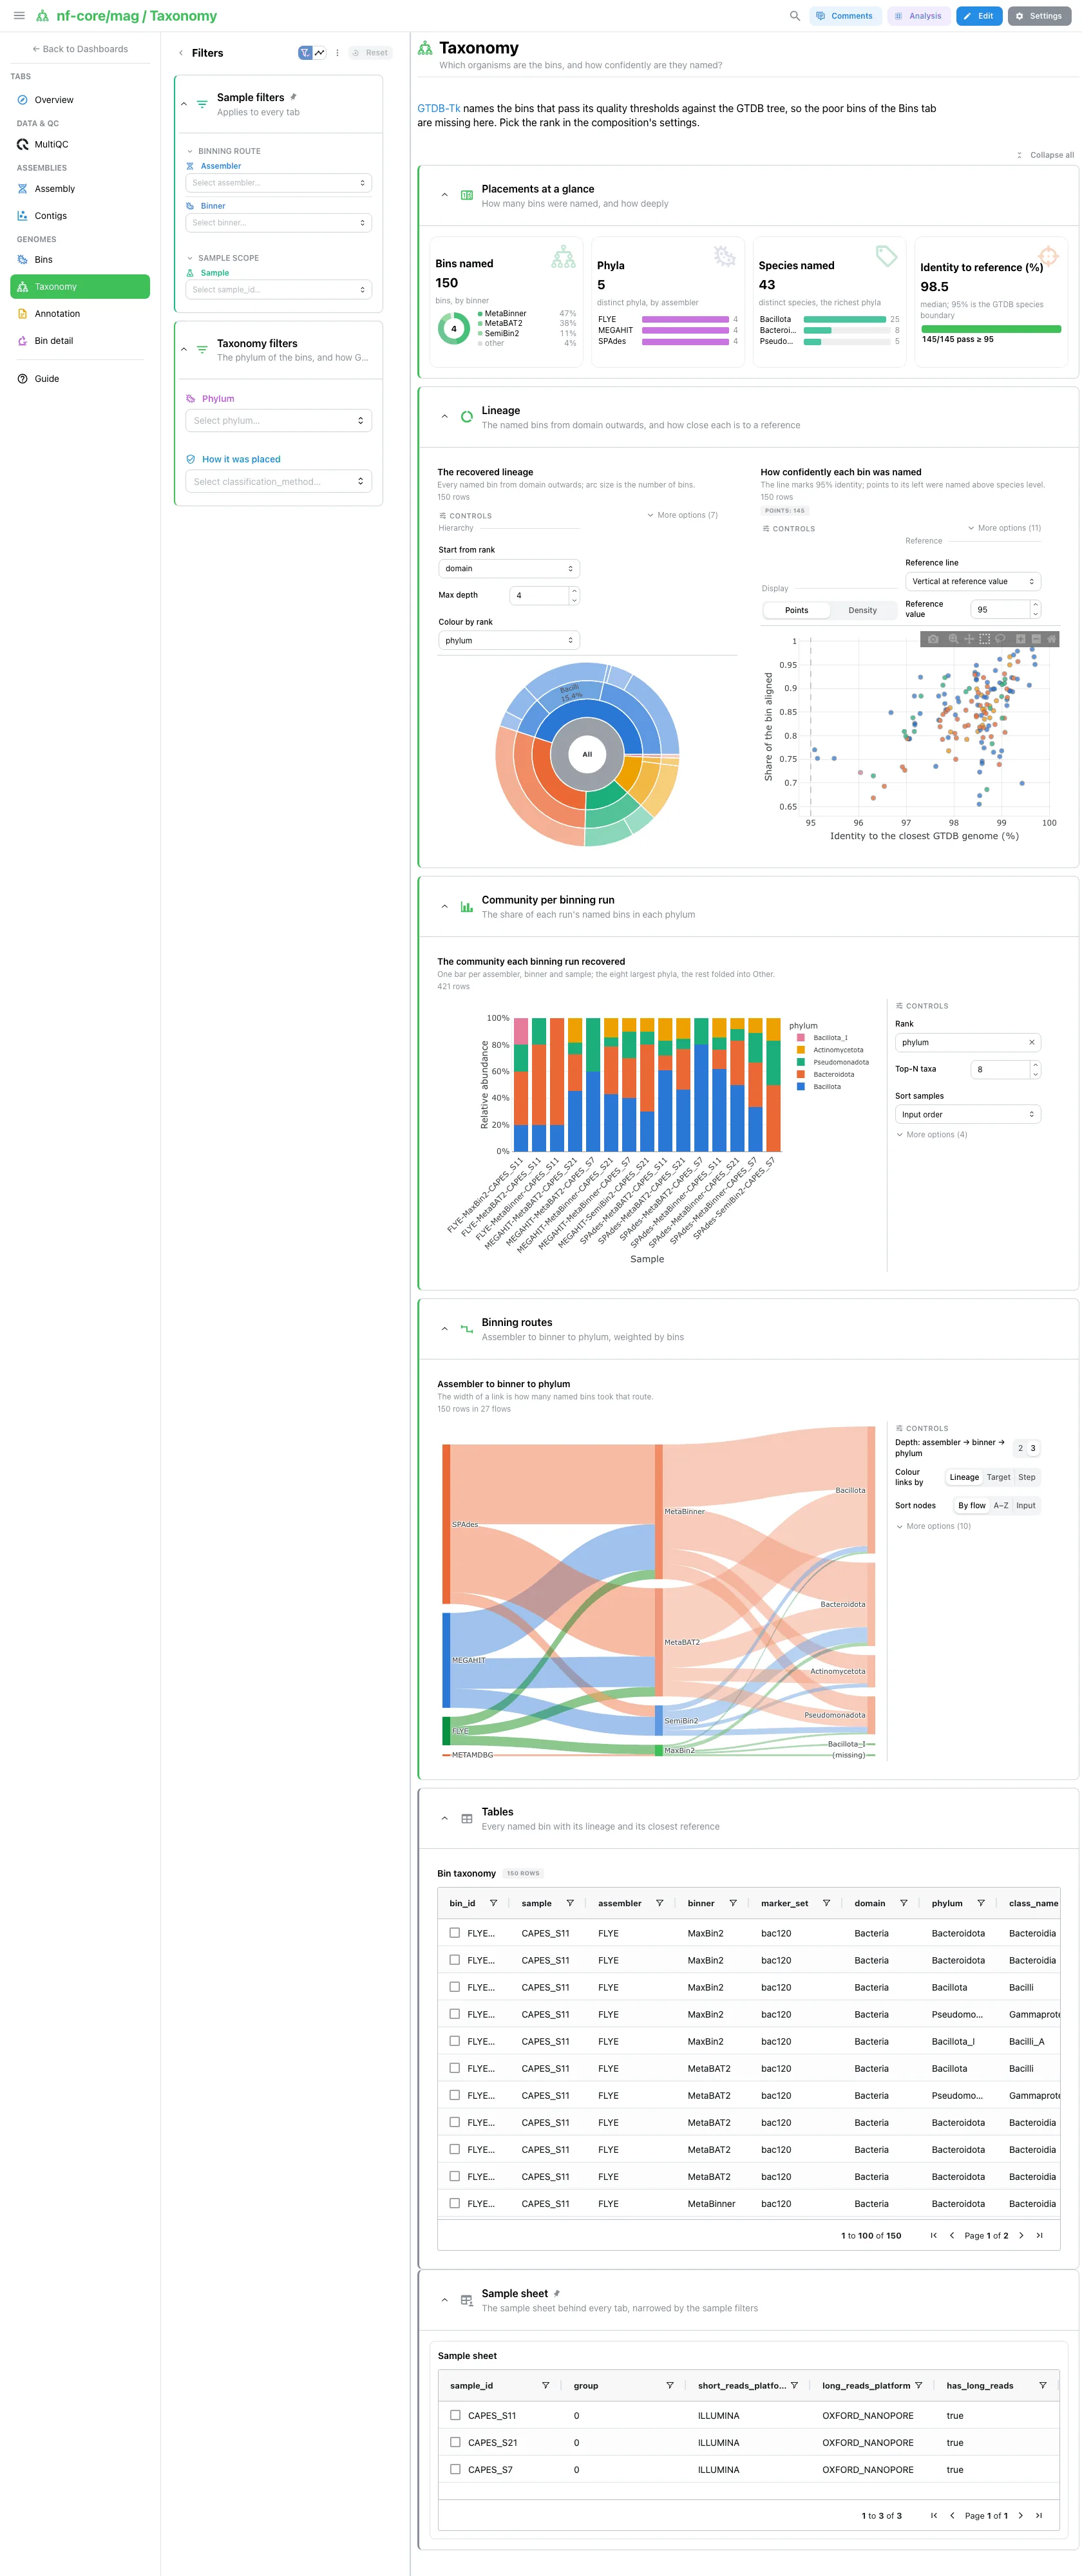
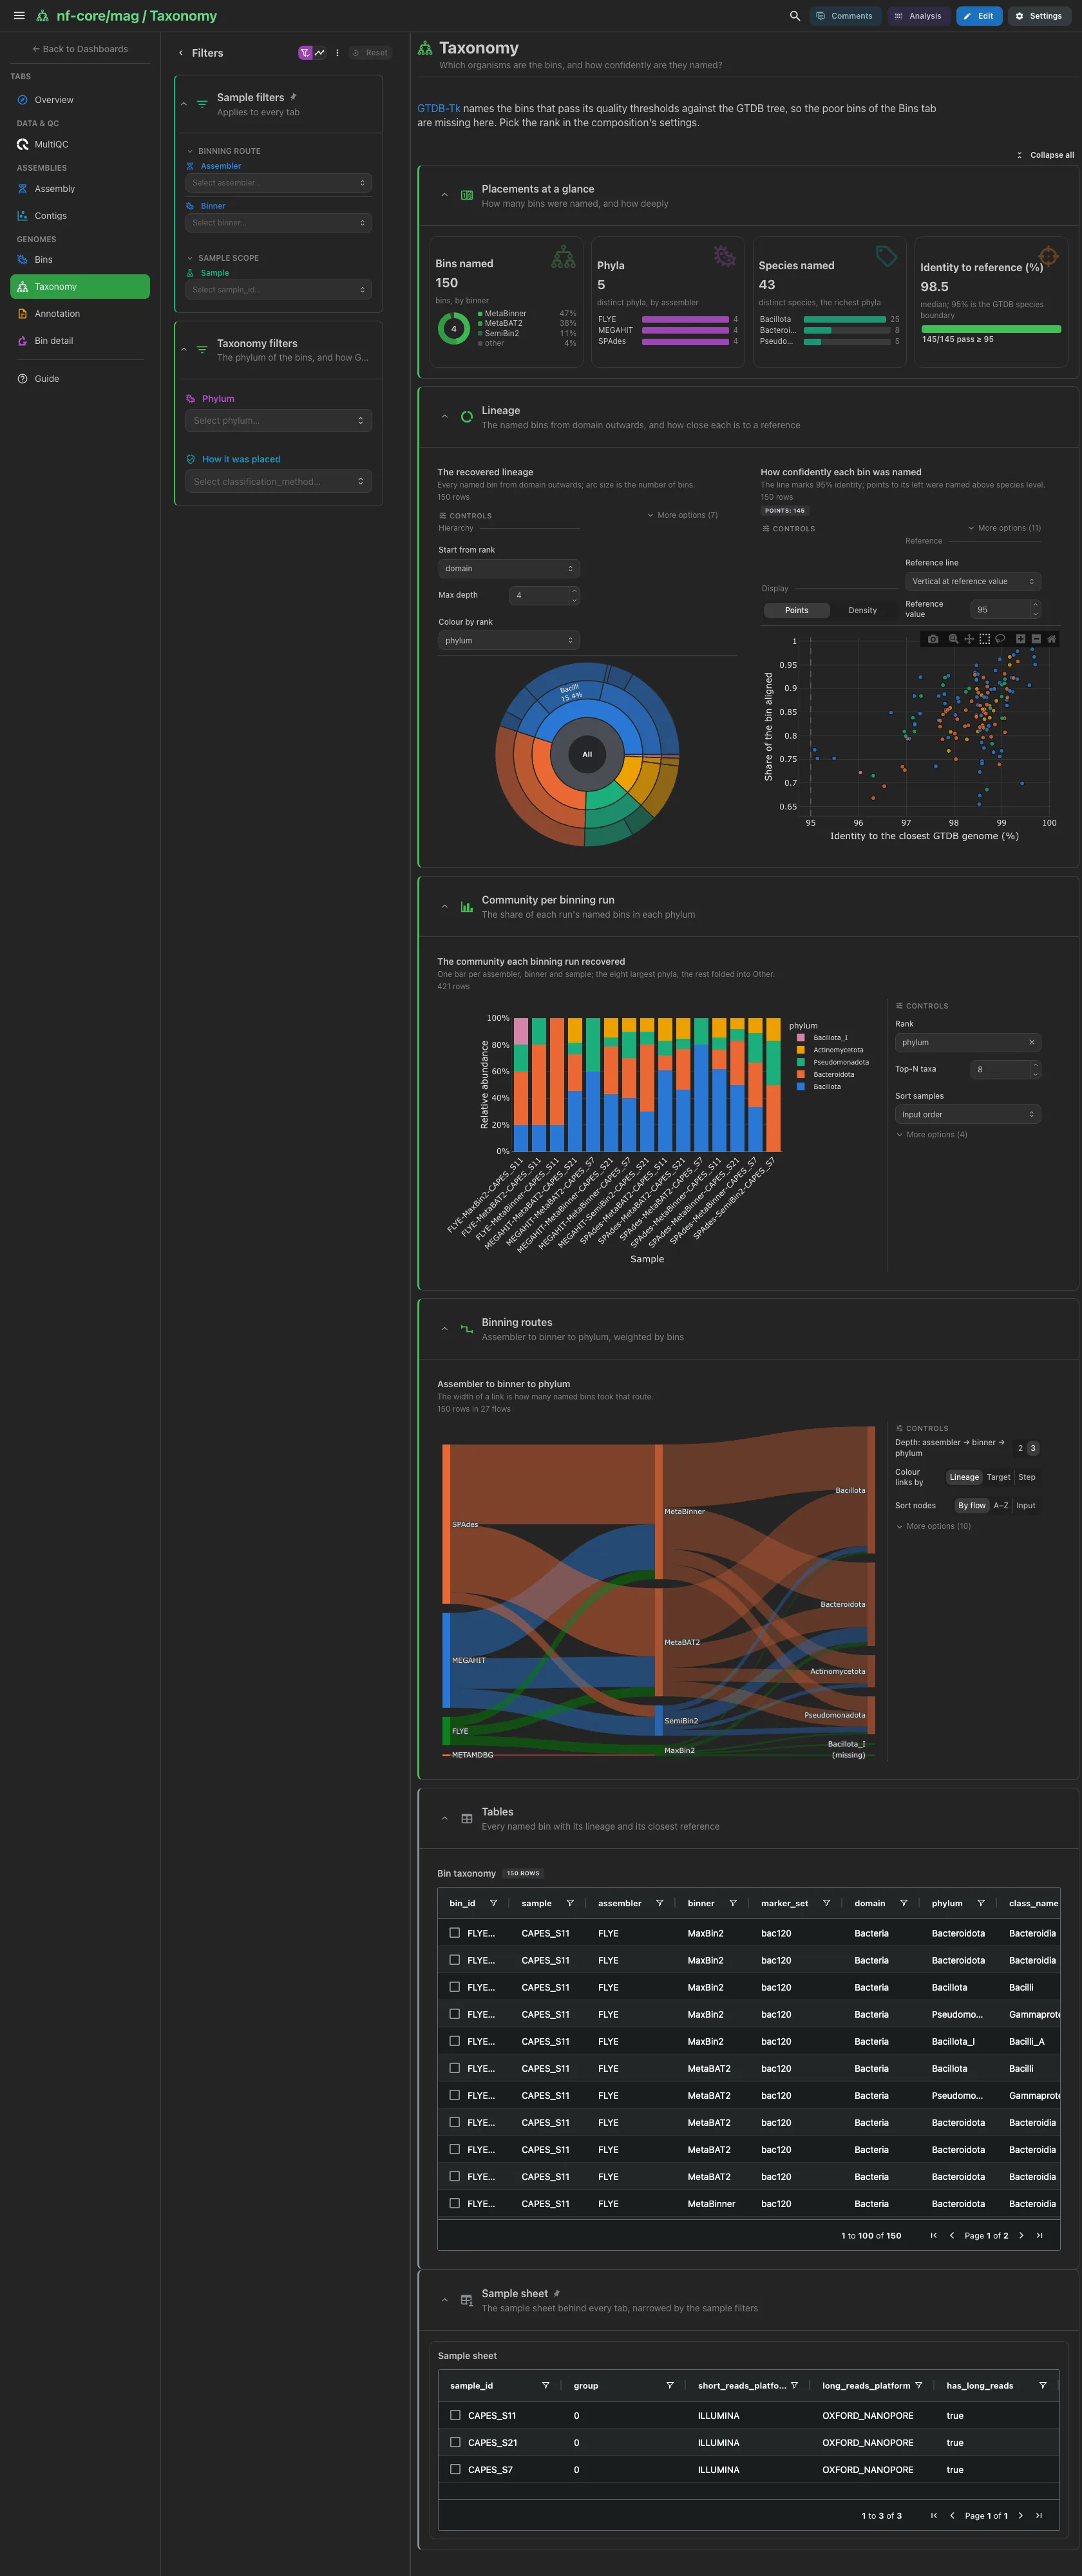
GTDB-Tk names only the bins that pass its own thresholds, so the poor bins of the Bins tab are missing here. The bins named by binner, the distinct phyla by assembler, the distinct species and the median identity to the closest reference against the 95% species boundary. Then the lineage sunburst beside identity against alignment fraction, the community each binning run recovered (the eight largest phyla and Other, one bar per assembler, binner and sample, the rank picked in the tile's settings) and the Sankey of assembler to binner to phylum, weighted by bins. The taxonomy table is collapsed.
Filters and components
Filters · Phylum and How it was placed on gtdbtk_summary.
| Section | What it holds |
|---|---|
| Placements at a glance | 4 cards |
| Lineage | 2 advanced visualizations: the sunburst and identity against alignment fraction |
| Community per binning run | 1 advanced visualization |
| Binning routes | 1 advanced visualization (Sankey) |
| Tables (collapsed) | Bin taxonomy |
Genomes · Do the bins carry the genes and RNAs of a genome?
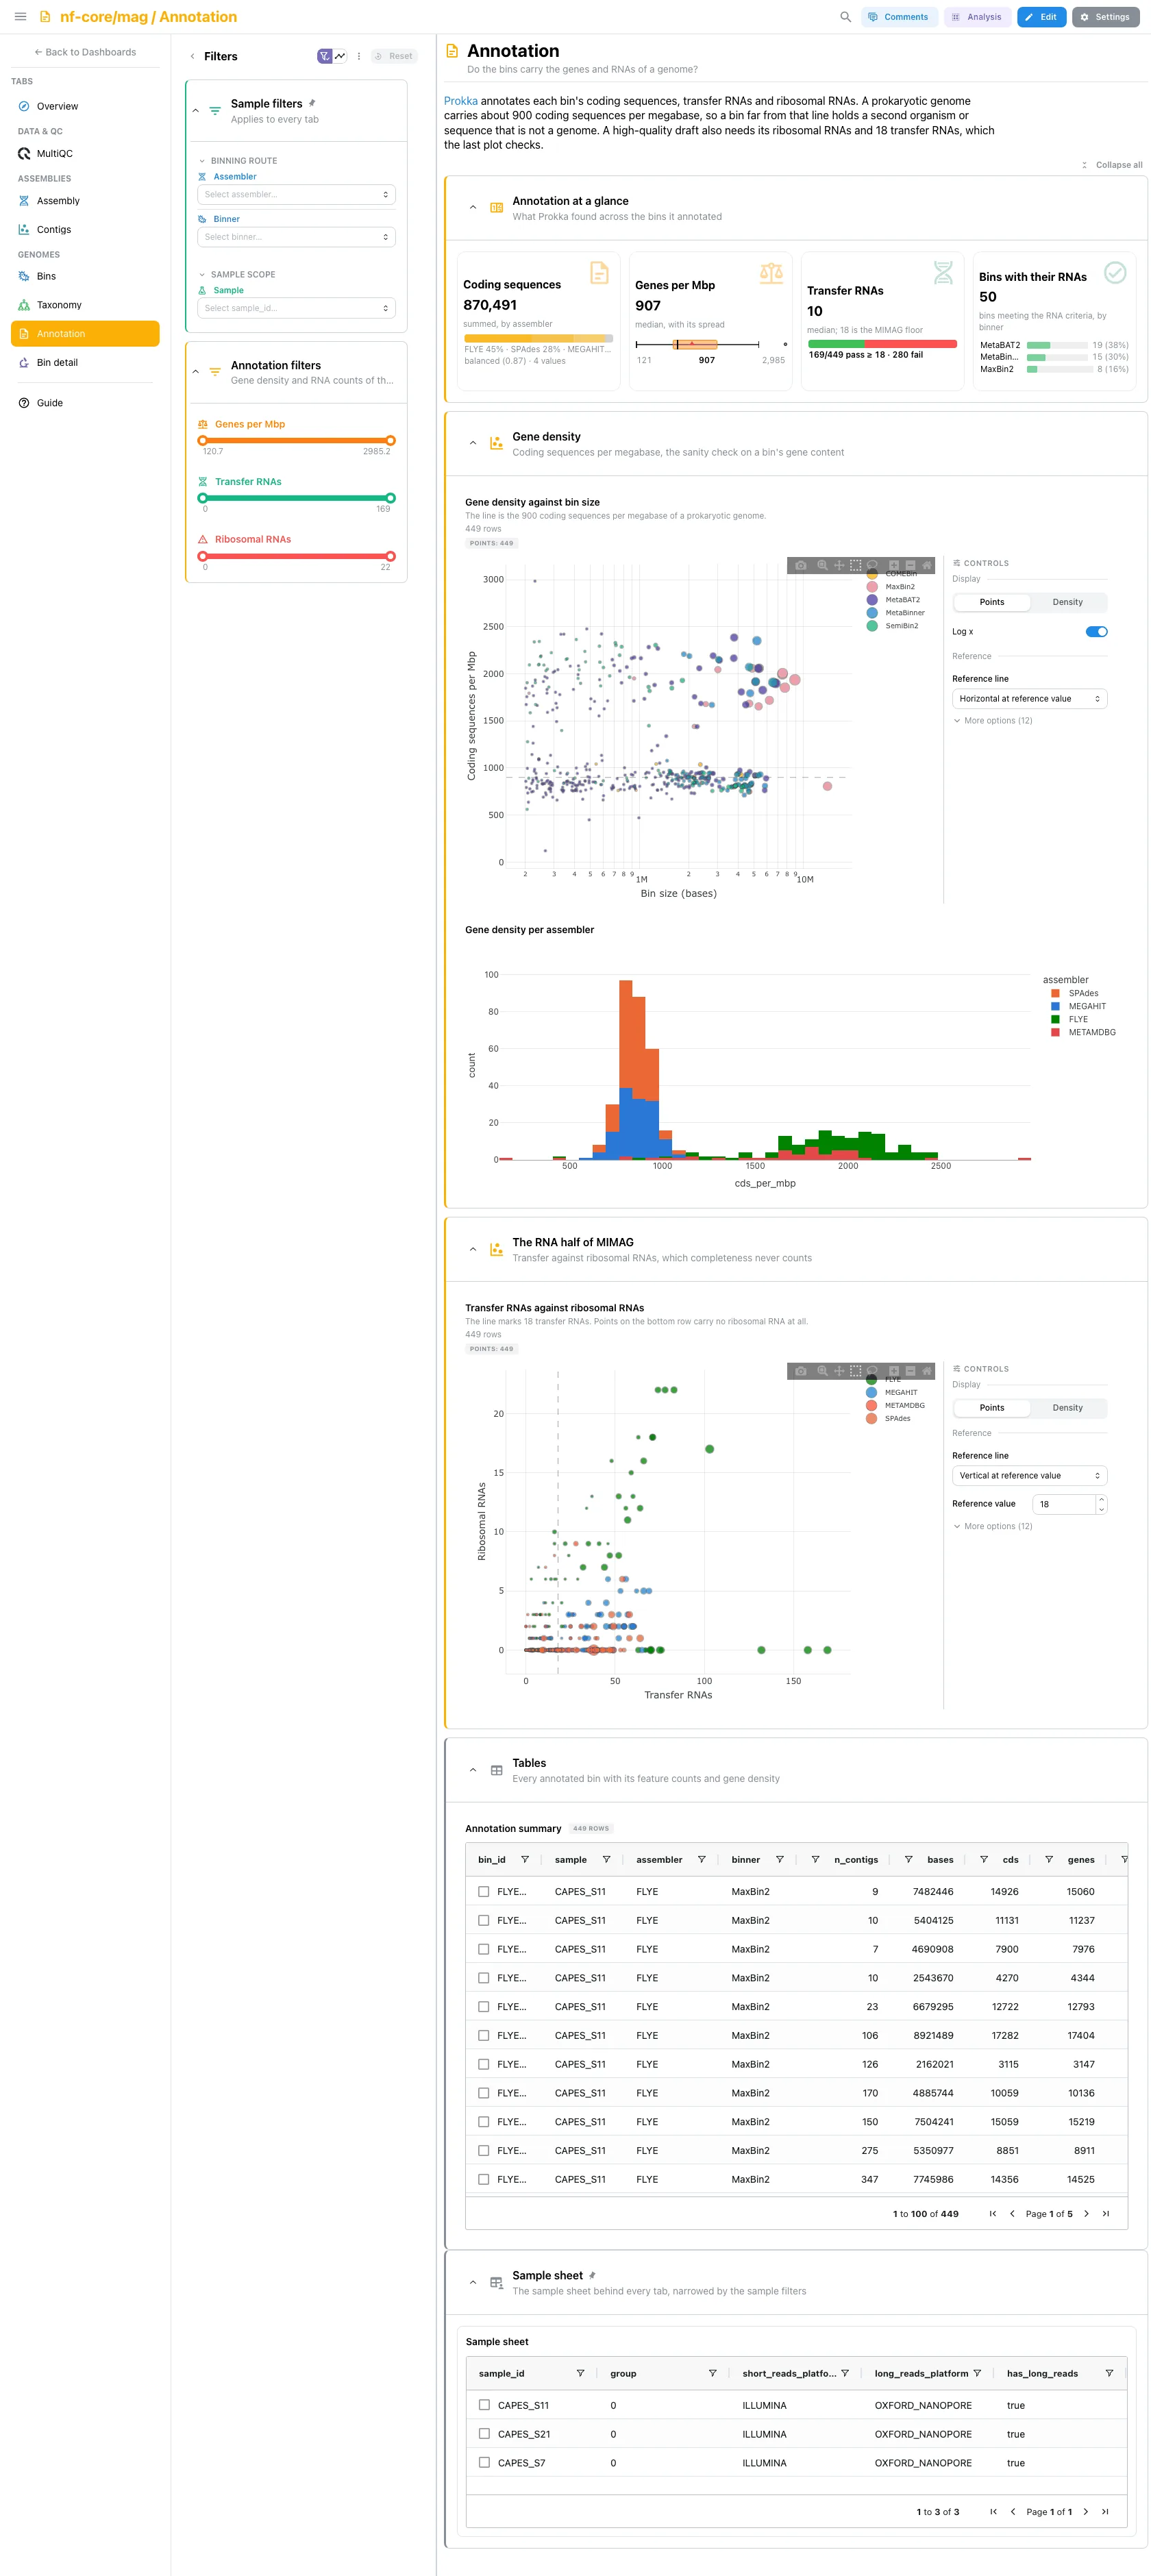
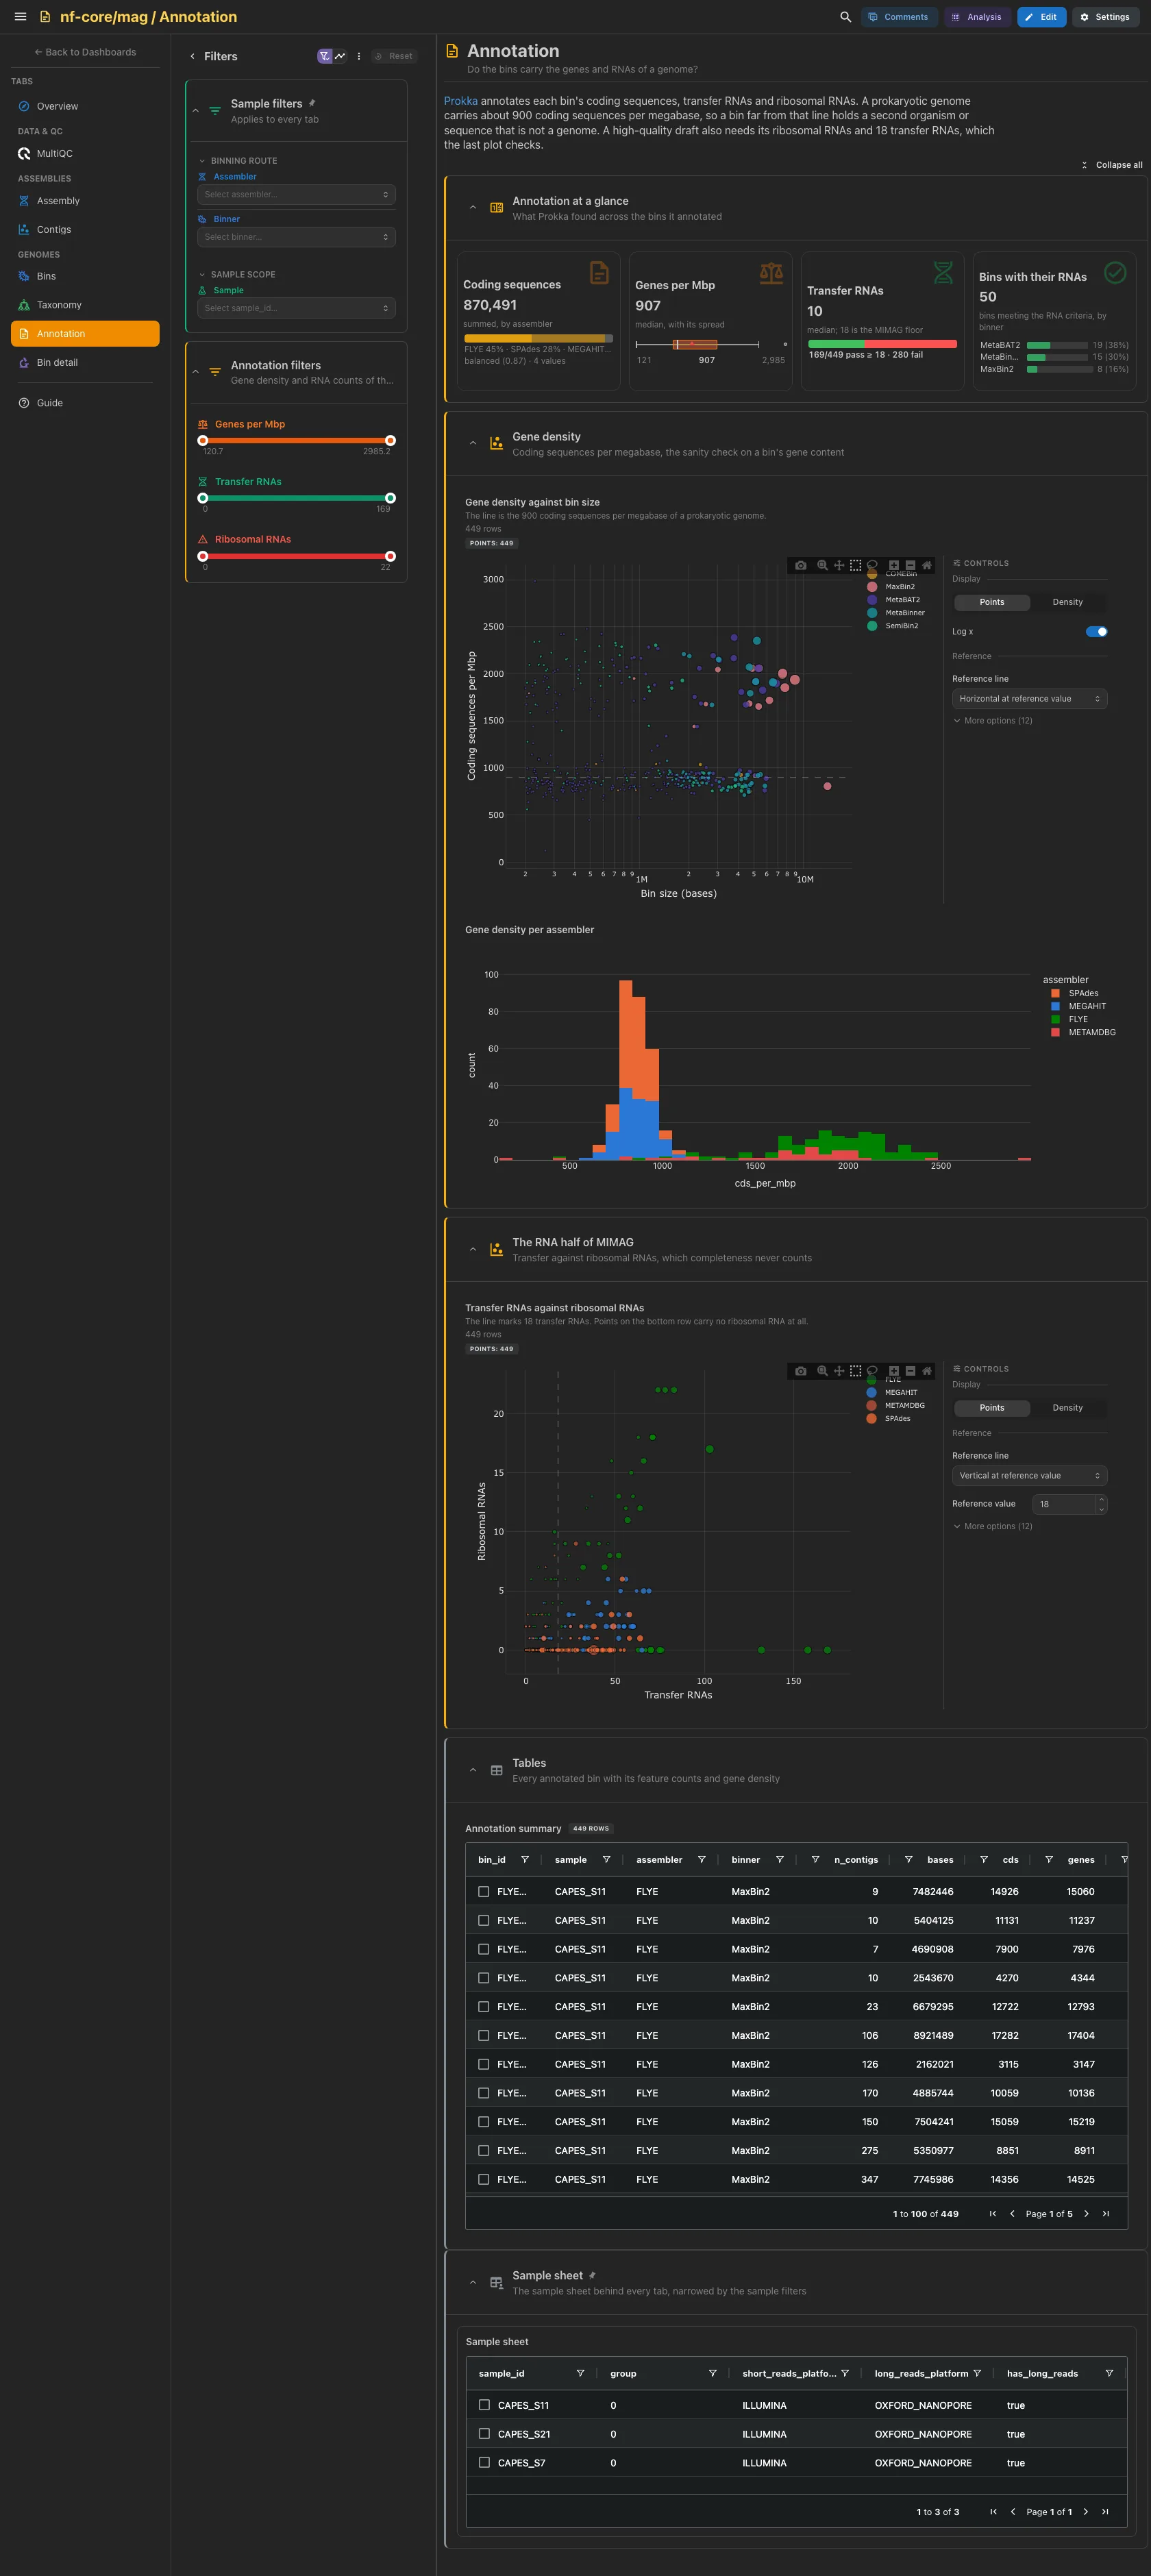
Prokka's per-bin feature counts. Coding sequences by assembler, the median genes per Mbp, the median transfer RNAs against the MIMAG floor of 18, and the bins carrying the MIMAG RNAs by binner. Then gene density against bin size, with the roughly 900 coding sequences per megabase of a prokaryotic genome as a line: a bin far from it holds a second organism or sequence that is not a genome. Gene density per assembler follows, then transfer against ribosomal RNAs, the half of the MIMAG standard a completeness estimate cannot see. The annotation table is collapsed.
Filters and components
Filters · Genes per Mbp, Transfer RNAs and Ribosomal RNAs
ranges on prokka_summary.
| Section | What it holds |
|---|---|
| Annotation at a glance | 4 cards |
| Gene density | 1 advanced visualization, Gene density per assembler |
| The RNA half of MIMAG | 1 advanced visualization |
| Tables (collapsed) | Annotation summary |
Genomes · What do all four tools say about one bin?
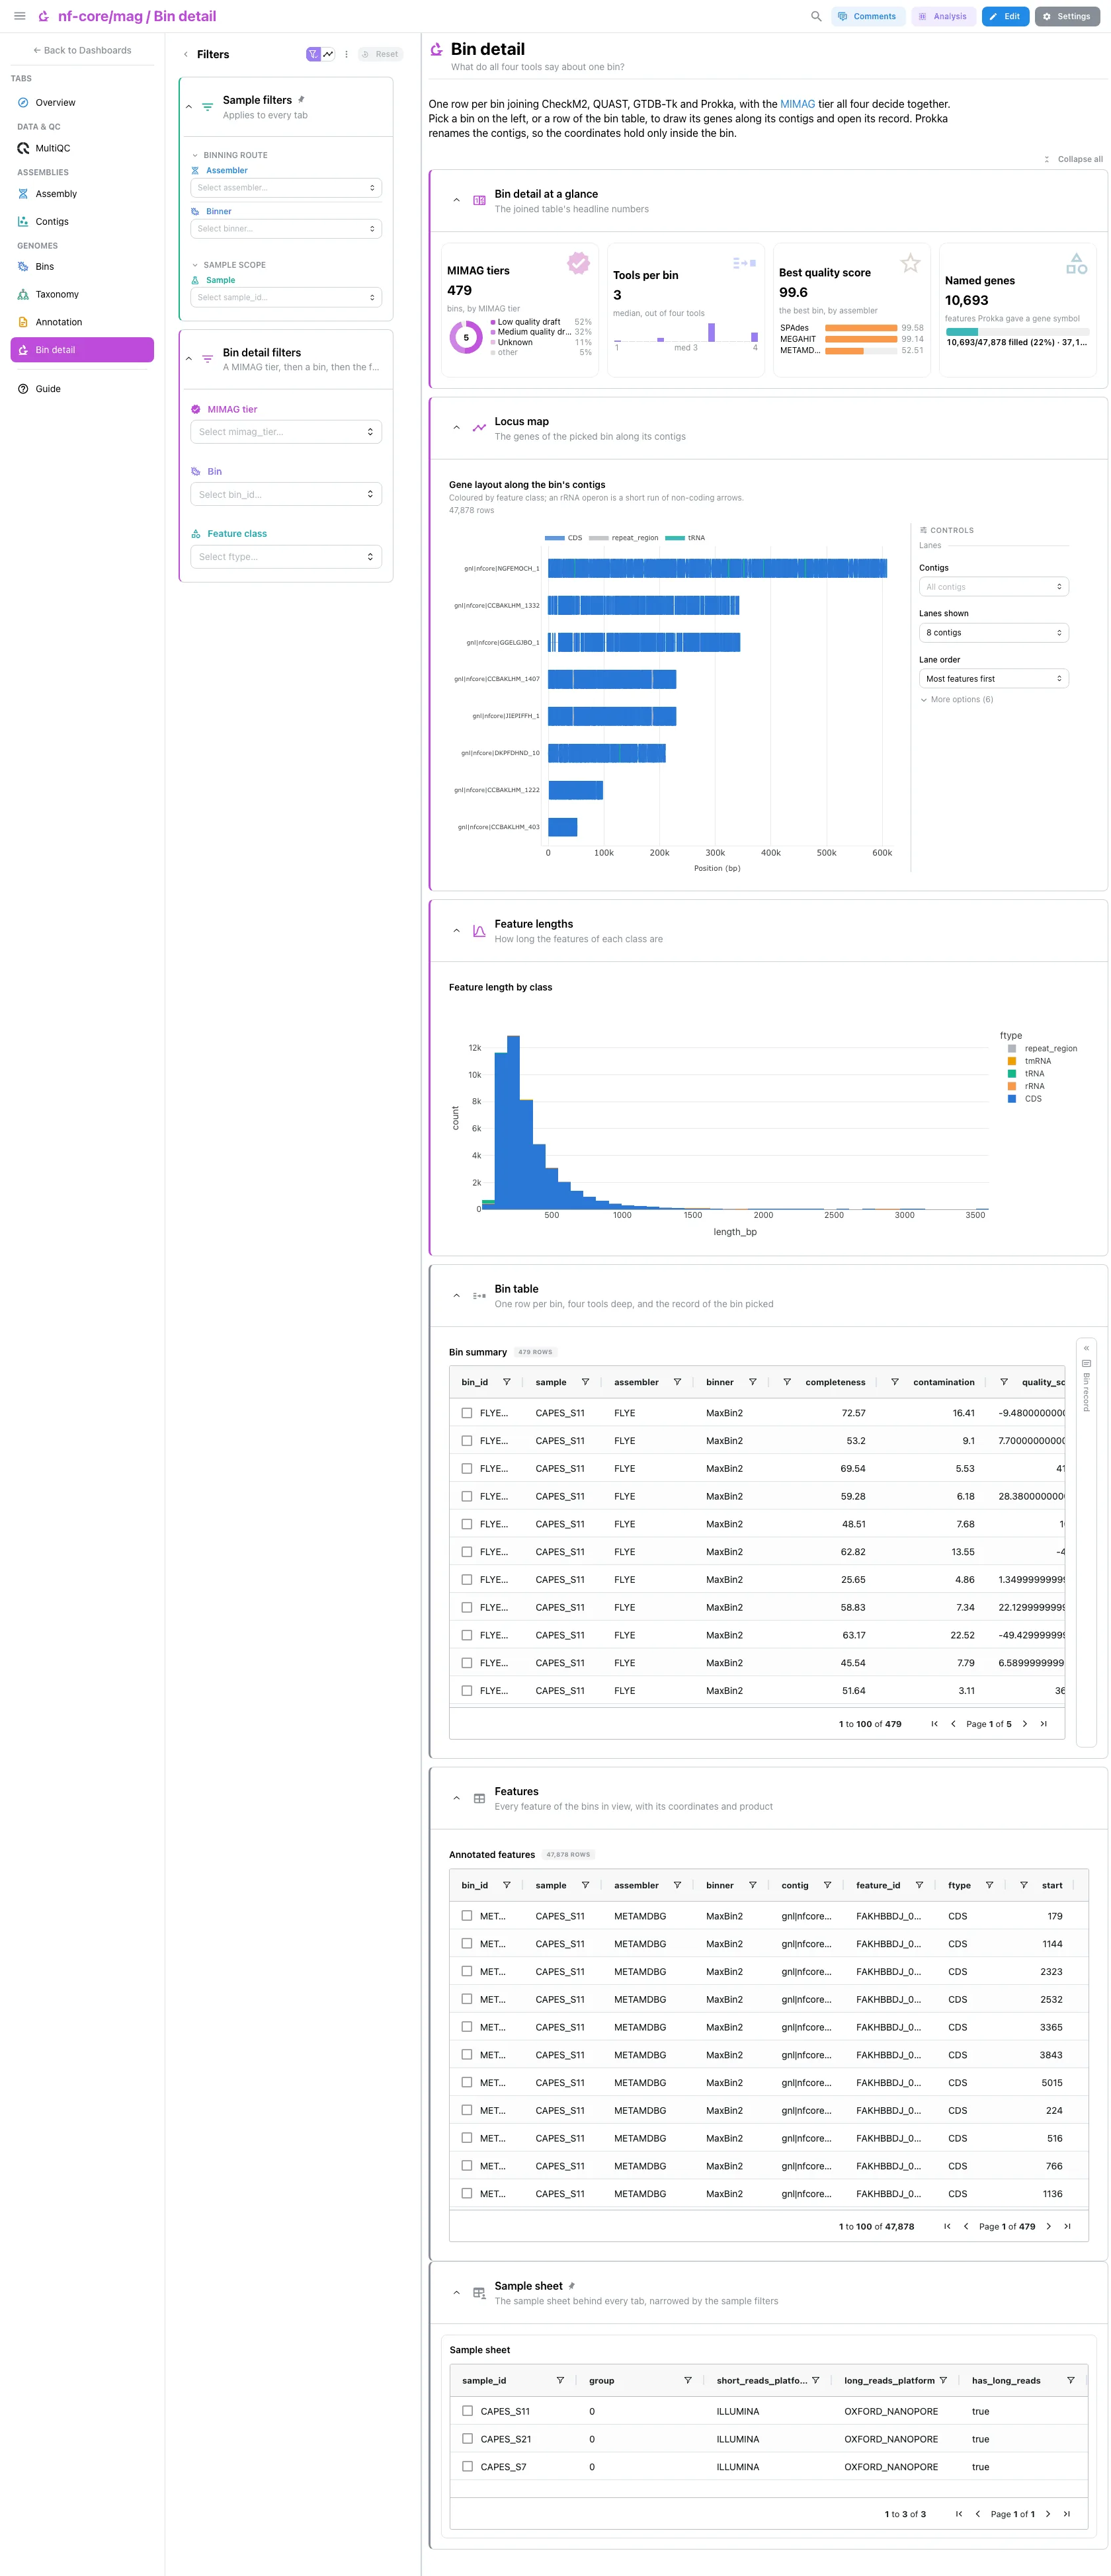
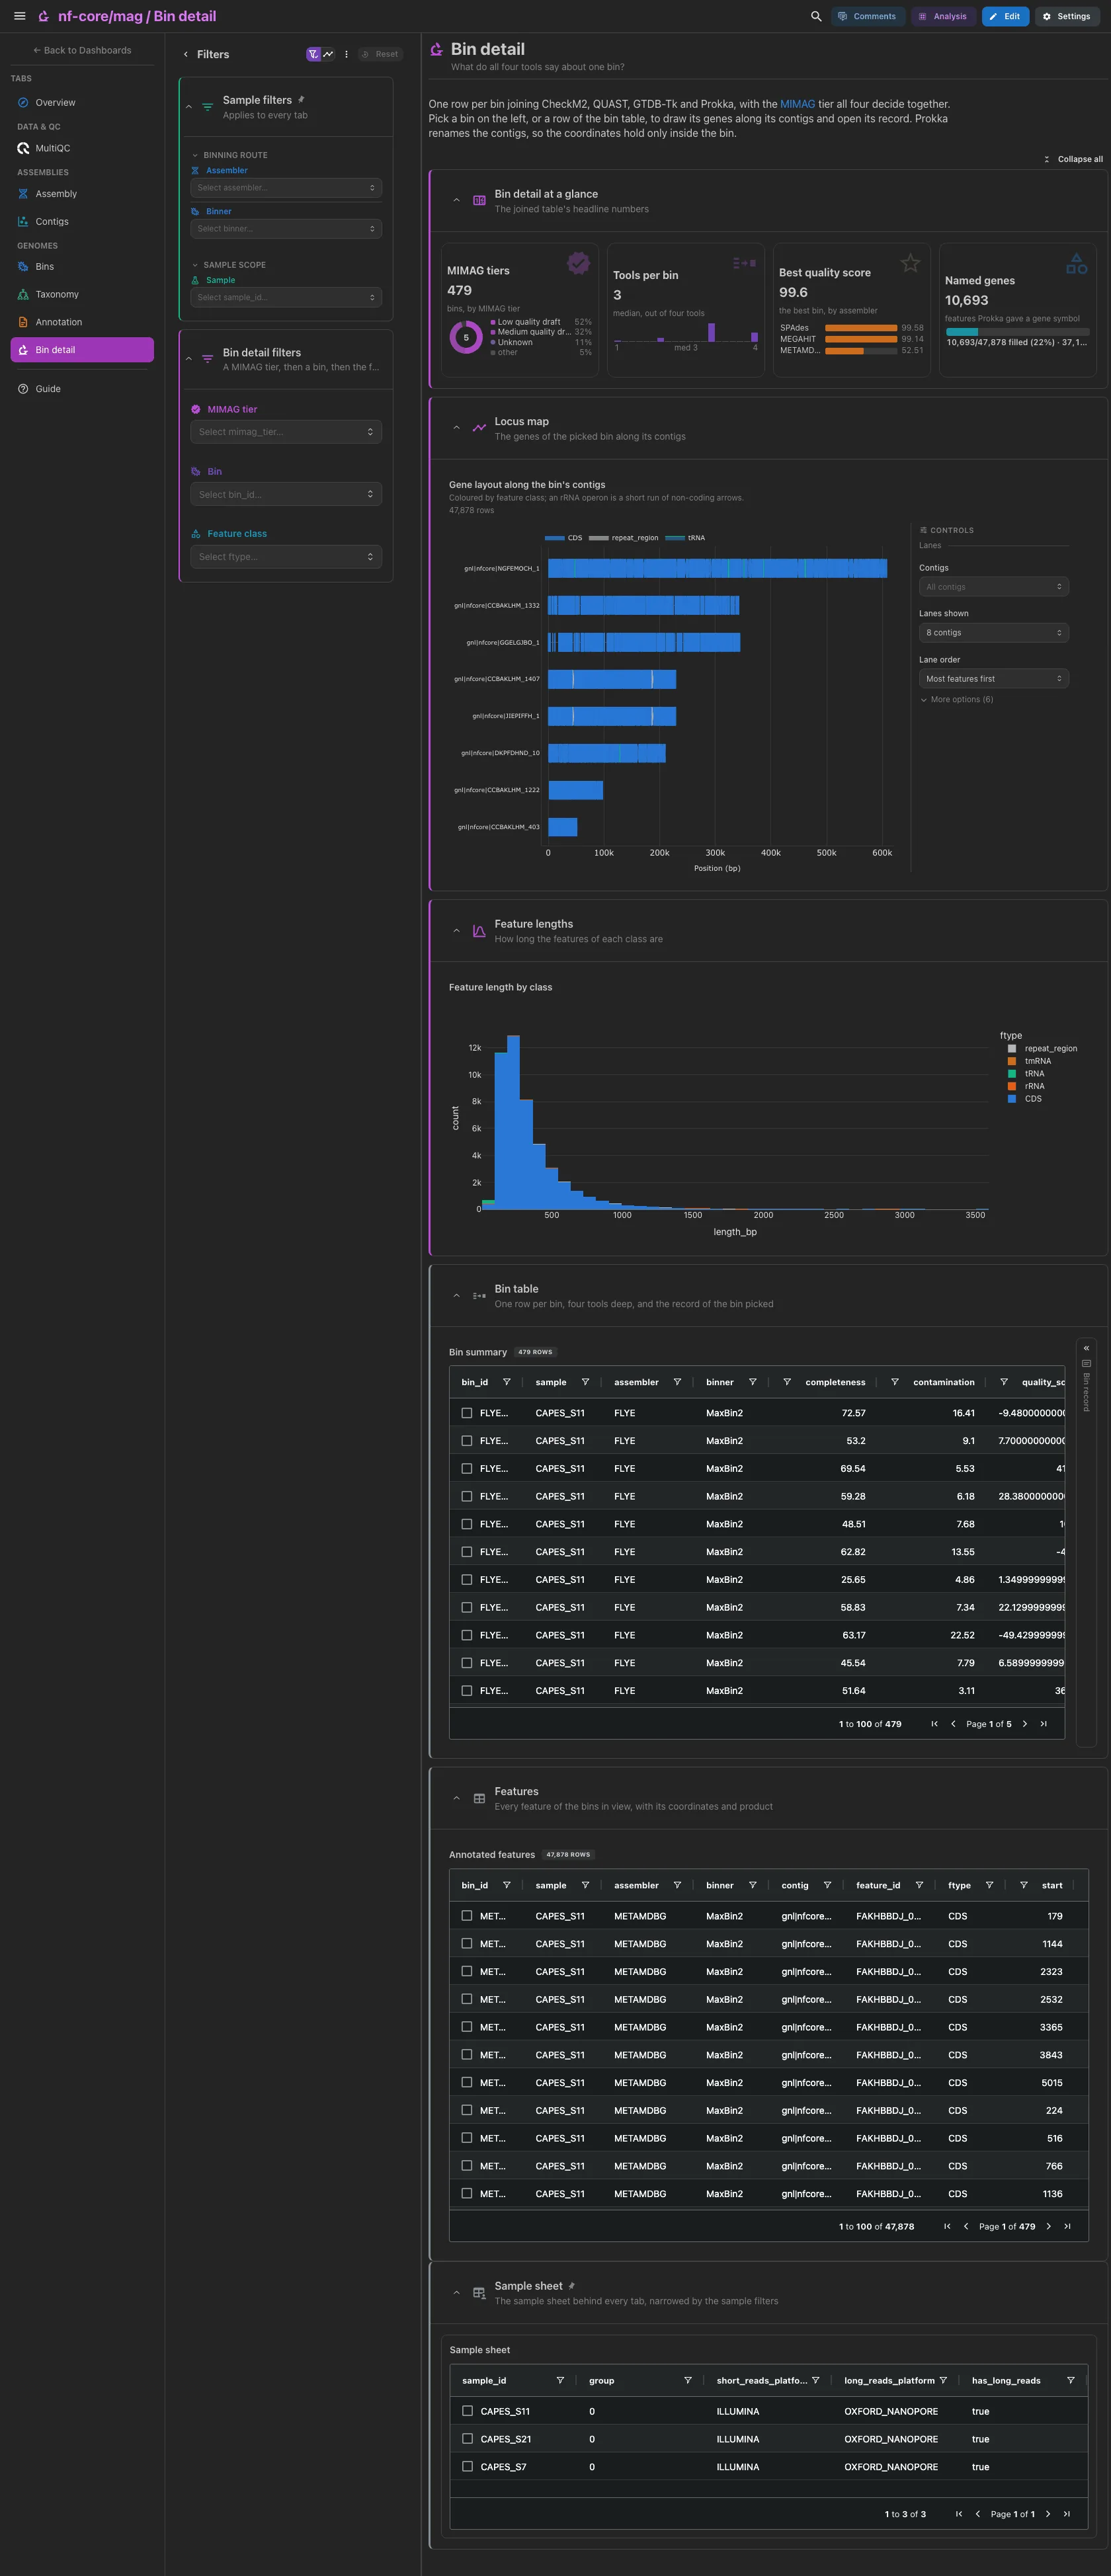
One row per bin joining CheckM2, QUAST, GTDB-Tk and Prokka, with the MIMAG
tier all four decide together. The bins by MIMAG tier, the tools per bin, the
best quality score by assembler and the features Prokka gave a gene symbol.
Then the locus map of the bin picked on the left or in the bin table, its
genes along its contigs coloured by feature class, and the feature lengths by
class. The collapsed Bin table holds the four-way outer join
(sources_present counts the tools that reported on a bin) beside the record
card of the bin picked in it, which waits for a row. The collapsed Features
section lists every annotated feature.
Filters and components
Filters · MIMAG tier on bin_summary, then Bin and Feature
class on prokka_gene_track, which choose the bin and the classes the
map draws.
| Section | What it holds |
|---|---|
| Bin detail at a glance | 4 cards |
| Locus map | 1 advanced visualization |
| Feature lengths | Feature length by class |
| Bin table (collapsed) | Bin summary and the linked Bin record card |
| Features (collapsed) | Annotated features |
The locus map needs Prokka
A run without Prokka has no locus map or features here, and no Annotation tab. Prokka renames the contigs, so the map's coordinates hold only inside the bin.
A picked row or point narrows the other tiles of its collection and follows the
project links to the collections they reach. The sample sheet selects on
sample_id; the assembly table, the ladder rungs and the share-kept curves on
assembly_id; the length against N50 scatter on assembler; the length against
depth scatter on read_sample; the MIMAG plane on binner; every other per-bin
scatter and table on bin_id; the features table on feature_id. The Nx curve
does not select: its collection has no outgoing link.
Running the pipeline
Depictio reads the output of nf-core/mag, it does not run the pipeline. Run the pipeline first, with bin QC, GTDB-Tk and Prokka enabled:
nextflow run nf-core/mag -r 5.5.0 \
  --input samplesheet.full.v4.csv \
  --run_checkm2 \
  -profile docker --outdir results
Then copy the samplesheet beside the results, regenerate the MultiQC report if the run wrote no parquet, and point Depictio at them:
mkdir -p results/input && cp samplesheet.full.v4.csv results/input/
python -m depictio.dev_scripts.multiqc_reprocess --src results/ --dest results/
depictio ingest results/ --template nf-core/mag/latest
See nf-co.re/mag/usage for full pipeline documentation.
Required data structure
Point depictio ingest at the directory holding the pipeline output. Depictio scans
recursively and matches on file name. Every tool collection is optional, so a
run that skipped a step ingests and the tabs it would feed are dropped.
<DATA_ROOT>/
├── input/samplesheet.full.v4.csv              # the hub (required, copied by hand)
├── pipeline_info/{software_versions.yml,params*.json}
├── multiqc/multiqc_data/multiqc.parquet       # published or regenerated
├── QC_shortreads/{fastp,remove_host,remove_phix}/
├── QC_longreads/NanoPlot/*NanoStats.txt
├── Assembly/<assembler>/QC/<sample>/QUAST/transposed_report.tsv
├── GenomeBinning/
│   ├── depths/contigs/*-depth.txt.gz          # per-contig depth per sample
│   └── QC/
│       ├── CheckM2/*_checkm2_report.tsv
│       └── QUAST/*-quast_summary.tsv
├── Taxonomy/GTDB-Tk/<run>/classify/*.{bac120,ar53}.summary.tsv
└── Annotation/Prokka/<assembler>/<bin>/
    ├── *.txt                                  # per-bin feature counts
    └── *.gff                                  # the locus map
Validation runs
The template was validated on the nf-core AWS megatest of the 5.5.0 release
candidate, s3://nf-core-awsmegatests/mag/results-171cf36971499cea4c9bccac4536cccbfc540e14/,
a hybrid short- and long-read run over three samples with four assemblers and
five binners, and the screenshots above come from that run. It publishes no
multiqc/ directory and no samplesheet: the report is regenerated and the
template ships the sheet, which the download script copies in. Only a subset of
the Prokka GFFs is fetched, so the locus map covers those bins only.
DEST=/tmp/mag_test
bash depictio/projects/nf-core/mag/5.5.0/download_test_data.sh "$DEST"
python -m depictio.dev_scripts.multiqc_reprocess --src "$DEST" --dest "$DEST"
depictio ingest "$DEST" --template nf-core/mag/latest
Do not pass --project when ingesting: the dashboard is attached to the
project by name, so renaming it breaks a later depictio dashboard import.
Re-ingesting accumulates dashboards, so delete the project before repeating a run.
Additional resources
- nf-co.re/mag: official pipeline documentation
- nf-co.re/mag/5.5.0/results: AWS test results
- Template System Reference: YAML format, variables, conditionals
- Recipes: how to read, test, and write recipes
Authorship
 weber8thomas
Reviewing a template on your own data, or taking over a role here, is a contribution in itself: the contributing guide says what each one involves.