

The demultiplex template reads an nf-core/demultiplex run in the order a sequencing facility signs a run off:
- Overview: the run in four key figures, live findings and four figures, each linked to the tab that explains it
- Data & QC: what CheckQC and the Falco and fastp read QC flagged in the MultiQC report, and whether the instrument delivered on every lane, read and cycle
- Demultiplexing: how evenly each lane's reads were shared between the libraries, what no index matched and whether it is an index swap, and which libraries stand out on read QC within their group
The persistent Sample filters (the design group, then the library) sit in the
left panel and narrow every library tab through the project links; Run health
reads lanes, so it keeps its own lane, read and cycle filters instead.
bcl2fastq by default, BCL Convert on request
The two demultiplexers write different reports: bcl2fastq a
Stats/Stats.json, BCL Convert Reports/Demultiplex_Stats.csv,
Quality_Metrics.csv and Top_Unknown_Barcodes.csv. The template reads
bcl2fastq by default; --var IS_BCLCONVERT=true repoints the same four
collections at BCL Convert recipes that write the same columns, so every tile
renders unchanged. BCL Convert reports no raw cluster count, so the
pass-filter rate stays empty on that route.
Lanes and reads are rows, design comes from a file
Every run-level collection is one row per lane (and per read), so a one-lane
benchtop run and a multi-lane production flowcell ingest through the same
template. Design factors are never parsed out of library names: they come
from an optional METADATA_FILE, and without it every library falls in a
single group and every tile still renders.
Quick start
The results directory is the only thing you have to pass. To group libraries by a design factor, add a metadata TSV whose first column is the library name as written in the sample sheet:
depictio config nextflow --install     # once per machine
nextflow run nf-core/demultiplex -r 1.8.0 -profile docker --outdir results
No depictio ingest, and no template named: the pipeline ingests its own
output directory when it finishes and resolves this template from its own
manifest. See Nextflow trigger.
Reference
The template reads the MultiQC report, the demultiplexer statistics of every
flowcell and lane, the CheckQC report, the fastp JSON of every library and,
when present, an Illumina InterOp summary table. A pipeline-local libraries
recipe joins them into one row per library, the hub of the sample filters.
47 of its 60 tiles carry a use: catalog reference, so a tile says where its
panel comes from.
Self-adapting layout
The dashboard adapts to whatever the run actually produced: components bound to pruned or unparsed data collections are hidden, tabs left with no real visualizations are dropped entirely, and the remaining components are re-packed so there are no empty rows.
Template variables
Variables you provide when running the template: DATA_ROOT is the results directory given to depictio ingest, the others are set with --var NAME=value:
| Variable | Required | Description |
|---|---|---|
DATA_ROOT |
✓ | Root directory of one nf-core/demultiplex run (the flowcell folders, multiqc/, pipeline_info/) |
METADATA_FILE |
— | Optional library metadata TSV. First column: the library name as written in the sample sheet; every other column (organism, input amount, project, ...) becomes a design column of the library hub. |
METADATA_ID_COL |
— | Metadata library-name column. Auto-detected as the first metadata column; defaults to 'sample'. |
GROUP_COL |
— | Metadata column the dashboards group and colour libraries by. Auto-detected as the first annotation column of METADATA_FILE; without metadata it falls back to a single group. |
IS_BCLCONVERT |
— | Set (--var IS_BCLCONVERT=true) for a run demultiplexed with --demultiplexer bclconvert: the run-level collections read the BCL Convert Reports/*.csv instead of the bcl2fastq Stats.json. Matches the run's params.json demultiplexer. |
Auto-detected (set from the run's metadata / params.json; the route flags drive Conditional routes below): GROUP_COL_DISPLAY
Data collections
18 data collections — 5 required 13 optional · 9 direct 9 derived.
Origin tells you whether a collection is real pipeline data or a reshape of it: direct = a pipeline output (scanned, or a recipe that reads raw files); derived = a recipe that reshapes one or more direct collections into the layout a visualization needs (no new measurement). Reads shows what produces it: a recipe .py transform, whose name links to its source on GitHub, or a raw file scanned off disk. (A direct collection can still have a recipe — one that merely parses/cleans the raw file; derived means the recipe reshapes another collection.)
| Tag | Origin | Type | Reads | Status |
|---|---|---|---|---|
multiqc_data |
direct |  MultiQC MultiQC |
file (?:.*/)?multiqc/multiqc(?:_report)?_data/multiqc.parquet$ |
required |
metadata |
direct | Table | file {METADATA_FILE} |
optional |
bcl2fastq_stats_raw |
direct | Table | file Stats.json$ |
optional |
bclconvert_demux_raw |
direct | Table | file Demultiplex_Stats.csv$ |
optional |
bclconvert_quality_raw |
direct | Table | file Quality_Metrics.csv$ |
optional |
bclconvert_unknown_raw |
direct | Table | file Top_Unknown_Barcodes.csv$ |
optional |
demux_stats |
derived | Table | recipe bcl2fastq/demux_stats.py |
required |
lane_summary |
derived | Table | recipe bcl2fastq/lane_summary.py |
required |
read_quality |
derived | Table | recipe bcl2fastq/read_quality.py |
required |
unknown_barcodes |
derived | Table | recipe bcl2fastq/unknown_barcodes.py |
optional |
interop_summary_raw |
direct | Table | file .interop_summary..csv$ |
optional |
interop_summary |
derived | Table | recipe interop/summary.py |
optional |
fastp_json_raw |
direct | Table | file .*.fastp.json$ |
optional |
fastp_library_qc |
derived | Table | recipe nf-core/demultiplex/fastp_library_qc.py |
optional |
cycle_quality |
derived | Table | recipe nf-core/demultiplex/cycle_quality.py |
optional |
checkqc_raw |
direct | Table | file checkqc_report.json$ |
optional |
checkqc_verdicts |
derived | Table | recipe nf-core/demultiplex/checkqc_verdicts.py |
optional |
libraries |
derived | Table | recipe nf-core/demultiplex/libraries.py |
required |
Conditional routes
Rows are data collections; columns are the variables you set or params.json flags auto-detected from the run. Each filled cell is the effect of setting that variable; an empty cell means that variable leaves the collection unchanged. (9 collections are unaffected by any variable — present on every run.)
+ included− removed⇄ repointed
| Data collection | METADATA_FILE |
IS_BCLCONVERT |
|---|---|---|
metadata |
+ | |
bcl2fastq_stats_raw |
− | |
bclconvert_demux_raw |
+ | |
bclconvert_quality_raw |
+ | |
bclconvert_unknown_raw |
+ | |
demux_stats |
⇄ | |
lane_summary |
⇄ | |
read_quality |
⇄ | |
unknown_barcodes |
⇄ |
Cross-DC links
11 links — selecting a value in the source collection filters the target. The join column is shown after the source.
| Source · column | Target | Filters | |
|---|---|---|---|
libraries · sample |
→ | multiqc_data |
Narrow the CheckQC and bcl2fastq MultiQC panels to the selected libraries |
libraries · fastq_id |
→ | multiqc_data |
Narrow the fastp and Falco MultiQC panels to the selected libraries |
libraries · sample |
→ | demux_stats |
Narrow the per-lane library counts to the selected libraries |
libraries · sample |
→ | fastp_library_qc |
Narrow the fastp read QC to the selected libraries |
demux_stats · sample |
→ | libraries |
Narrow the library hub to the libraries picked on the demultiplexing tiles |
lane_summary · lane_label |
→ | demux_stats |
Narrow the per-lane library counts to the selected lanes |
lane_summary · lane_label |
→ | read_quality |
Narrow the lane by read quality to the selected lanes |
lane_summary · lane_label |
→ | unknown_barcodes |
Narrow the unknown barcodes to the selected lanes |
lane_summary · lane_label |
→ | cycle_quality |
Narrow the per-cycle quality curves to the selected lanes |
lane_summary · lane_label |
→ | fastp_library_qc |
Narrow the fastp read QC to the selected lanes |
lane_summary · lane_label |
→ | checkqc_verdicts |
Narrow the CheckQC verdicts to the selected lanes |
Recipes
Each recipe reshapes raw pipeline output into a tidy table. The name links to its source; Output lists the validated OUTPUT_SCHEMA columns.
| Recipe | Transforms | Output |
|---|---|---|
bcl2fastq/demux_stats.py |
Reads per library and lane, with the undetermined reads, from bcl2fastq Stats.json. |
flowcell, lane, lane_label, sample, index, is_undetermined, level, reads, pct_of_lane, yield_mb, pct_q30, mean_quality, pct_perfect_index, pct_one_mismatch_index |
bcl2fastq/lane_summary.py |
Run health per lane from bcl2fastq Stats.json: clusters, yield, quality, balance. |
flowcell, lane, lane_label, clusters_raw, clusters_pf, pct_pf, yield_gb, pct_q30, mean_quality, n_libraries, library_reads, undetermined_reads, pct_undetermined, library_reads_cv, lowest_library_pct_of_mean |
bcl2fastq/read_quality.py |
Base quality per lane and read from bcl2fastq Stats.json. |
flowcell, lane, lane_label, read, read_label, yield_gb, pct_q30, frac_q30, mean_quality |
bcl2fastq/unknown_barcodes.py |
Top unknown barcodes per lane, classed as likely index swaps, from bcl2fastq Stats.json. |
flowcell, lane, lane_label, barcode, index1, index2, reads, rank, pct_of_lane, pct_of_undetermined, i7_in_use, i5_in_use, swap_class |
bclconvert/demux_stats.py |
Reads per library and lane, with the undetermined reads, from BCL Convert reports. | flowcell, lane, lane_label, sample, index, is_undetermined, level, reads, pct_of_lane, yield_mb, pct_q30, mean_quality, pct_perfect_index, pct_one_mismatch_index |
bclconvert/lane_summary.py |
Run health per lane from BCL Convert reports: reads, yield, quality, balance. | flowcell, lane, lane_label, clusters_raw, clusters_pf, pct_pf, yield_gb, pct_q30, mean_quality, n_libraries, library_reads, undetermined_reads, pct_undetermined, library_reads_cv, lowest_library_pct_of_mean |
bclconvert/read_quality.py |
Base quality per lane and read from BCL Convert Reports/Quality_Metrics.csv. |
flowcell, lane, lane_label, read, read_label, yield_gb, pct_q30, frac_q30, mean_quality |
bclconvert/unknown_barcodes.py |
Top unknown barcodes per lane, classed as likely index swaps, from BCL Convert reports. | flowcell, lane, lane_label, barcode, index1, index2, reads, rank, pct_of_lane, pct_of_undetermined, i7_in_use, i5_in_use, swap_class |
interop/summary.py |
Run metrics per lane and read from interop_summary --csv=1: SAV's summary table. |
run_id, lane, lane_label, read, read_label, is_index_read, tiles, density_k_mm2, pct_cluster_pf, pct_cluster_pf_sd, phasing, prephasing, reads_m, reads_pf_m, pct_q30, frac_q30, yield_gb, pct_aligned, error_rate, error_rate_sd |
nf-core/demultiplex/checkqc_verdicts.py |
CheckQC verdicts per lane: which run-level thresholds the run failed, and by how much. | report, handler, severity, lane, sample, index, value, threshold, message, instrument |
nf-core/demultiplex/cycle_quality.py |
Mean base quality per sequencing cycle, per lane and read, pooled over libraries. | series, lane, lane_label, read, cycle, median_quality, p10_quality, p90_quality, n_libraries |
nf-core/demultiplex/fastp_library_qc.py |
Per-library read QC after demultiplexing, from the fastp JSON reports. | sample, lane, lane_label, fastq_id, reads_before, reads_after, pct_passed, pct_low_quality, pct_too_many_n, pct_too_short, pct_duplication, pct_adapter_trimmed, gc_pct, pct_q30_before, pct_q30_after, mean_length_after, insert_size_peak |
nf-core/demultiplex/libraries.py |
The library hub: one row per demultiplexed library, the key every tab filters on. | sample, flowcell, lanes, n_lanes, index, fastq_id, reads, pct_of_run, pct_of_expected, yield_mb, pct_q30, mean_quality, pct_perfect_index, reads_after_filter, pct_passed, pct_duplication, pct_adapter_trimmed, gc_pct, pct_q30_after, insert_size_peak |
Dashboard tabs
One dashboard: the Overview, then five child tabs in two groups, read as a funnel from what the checks flagged to how each library reads, in the order a facility signs a run off. Each tab below carries the same icon and colour the dashboard gives it, so the page and the app read alike.
| Group | Tabs |
|---|---|
| Data & QC | MultiQC, Run health |
| Demultiplexing | Library balance, Undetermined reads, Library QC |
Each child tab opens with a short intro and, except on MultiQC, a strip of four
cards, then at most three open sections; tables and conditional detail follow,
collapsed. The design comes from the optional METADATA_FILE: without it the
libraries hub carries one group, "All libraries", and every tile still renders.
The persistent Sample filters (the group, then the library, both on the hub)
sit in the left panel and narrow every library tab through the project links.
Run health reads lanes, which no library link reaches, so they are kept off that
tab. The Sample sheet is pinned, collapsed, to the bottom of every child tab
except Run health.
A sequencing run split into its libraries, from lanes to per-library read QC.
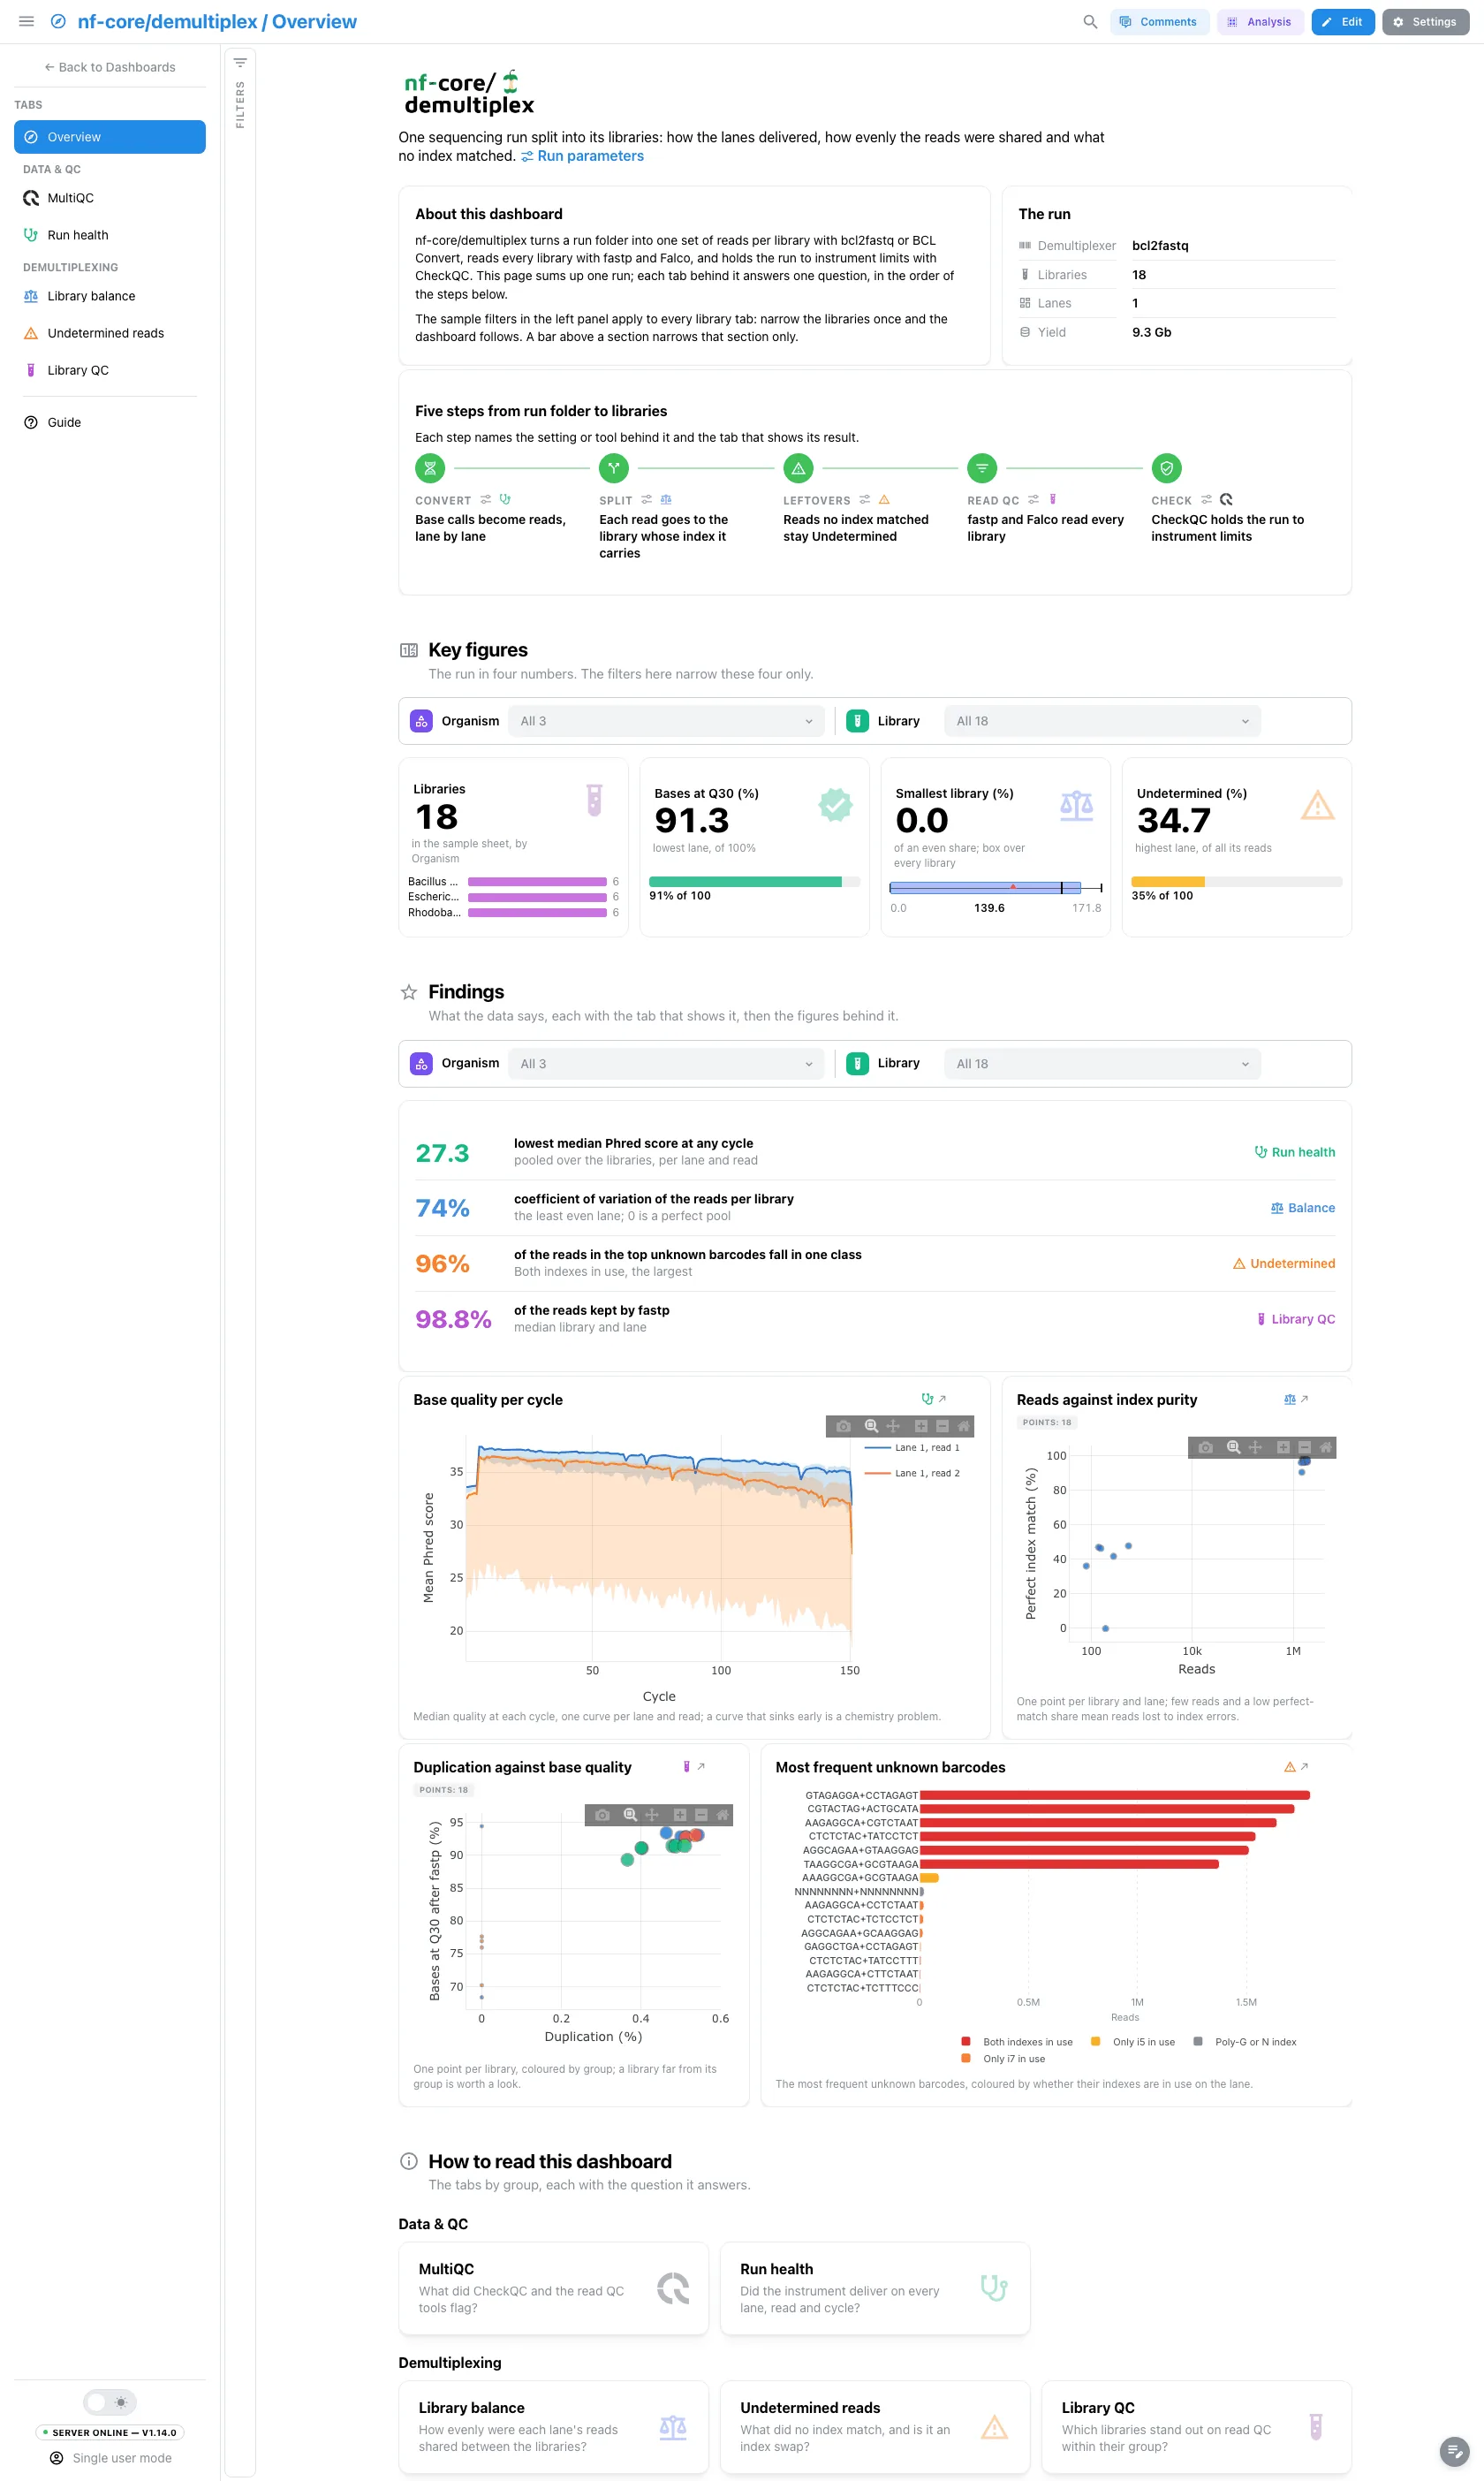
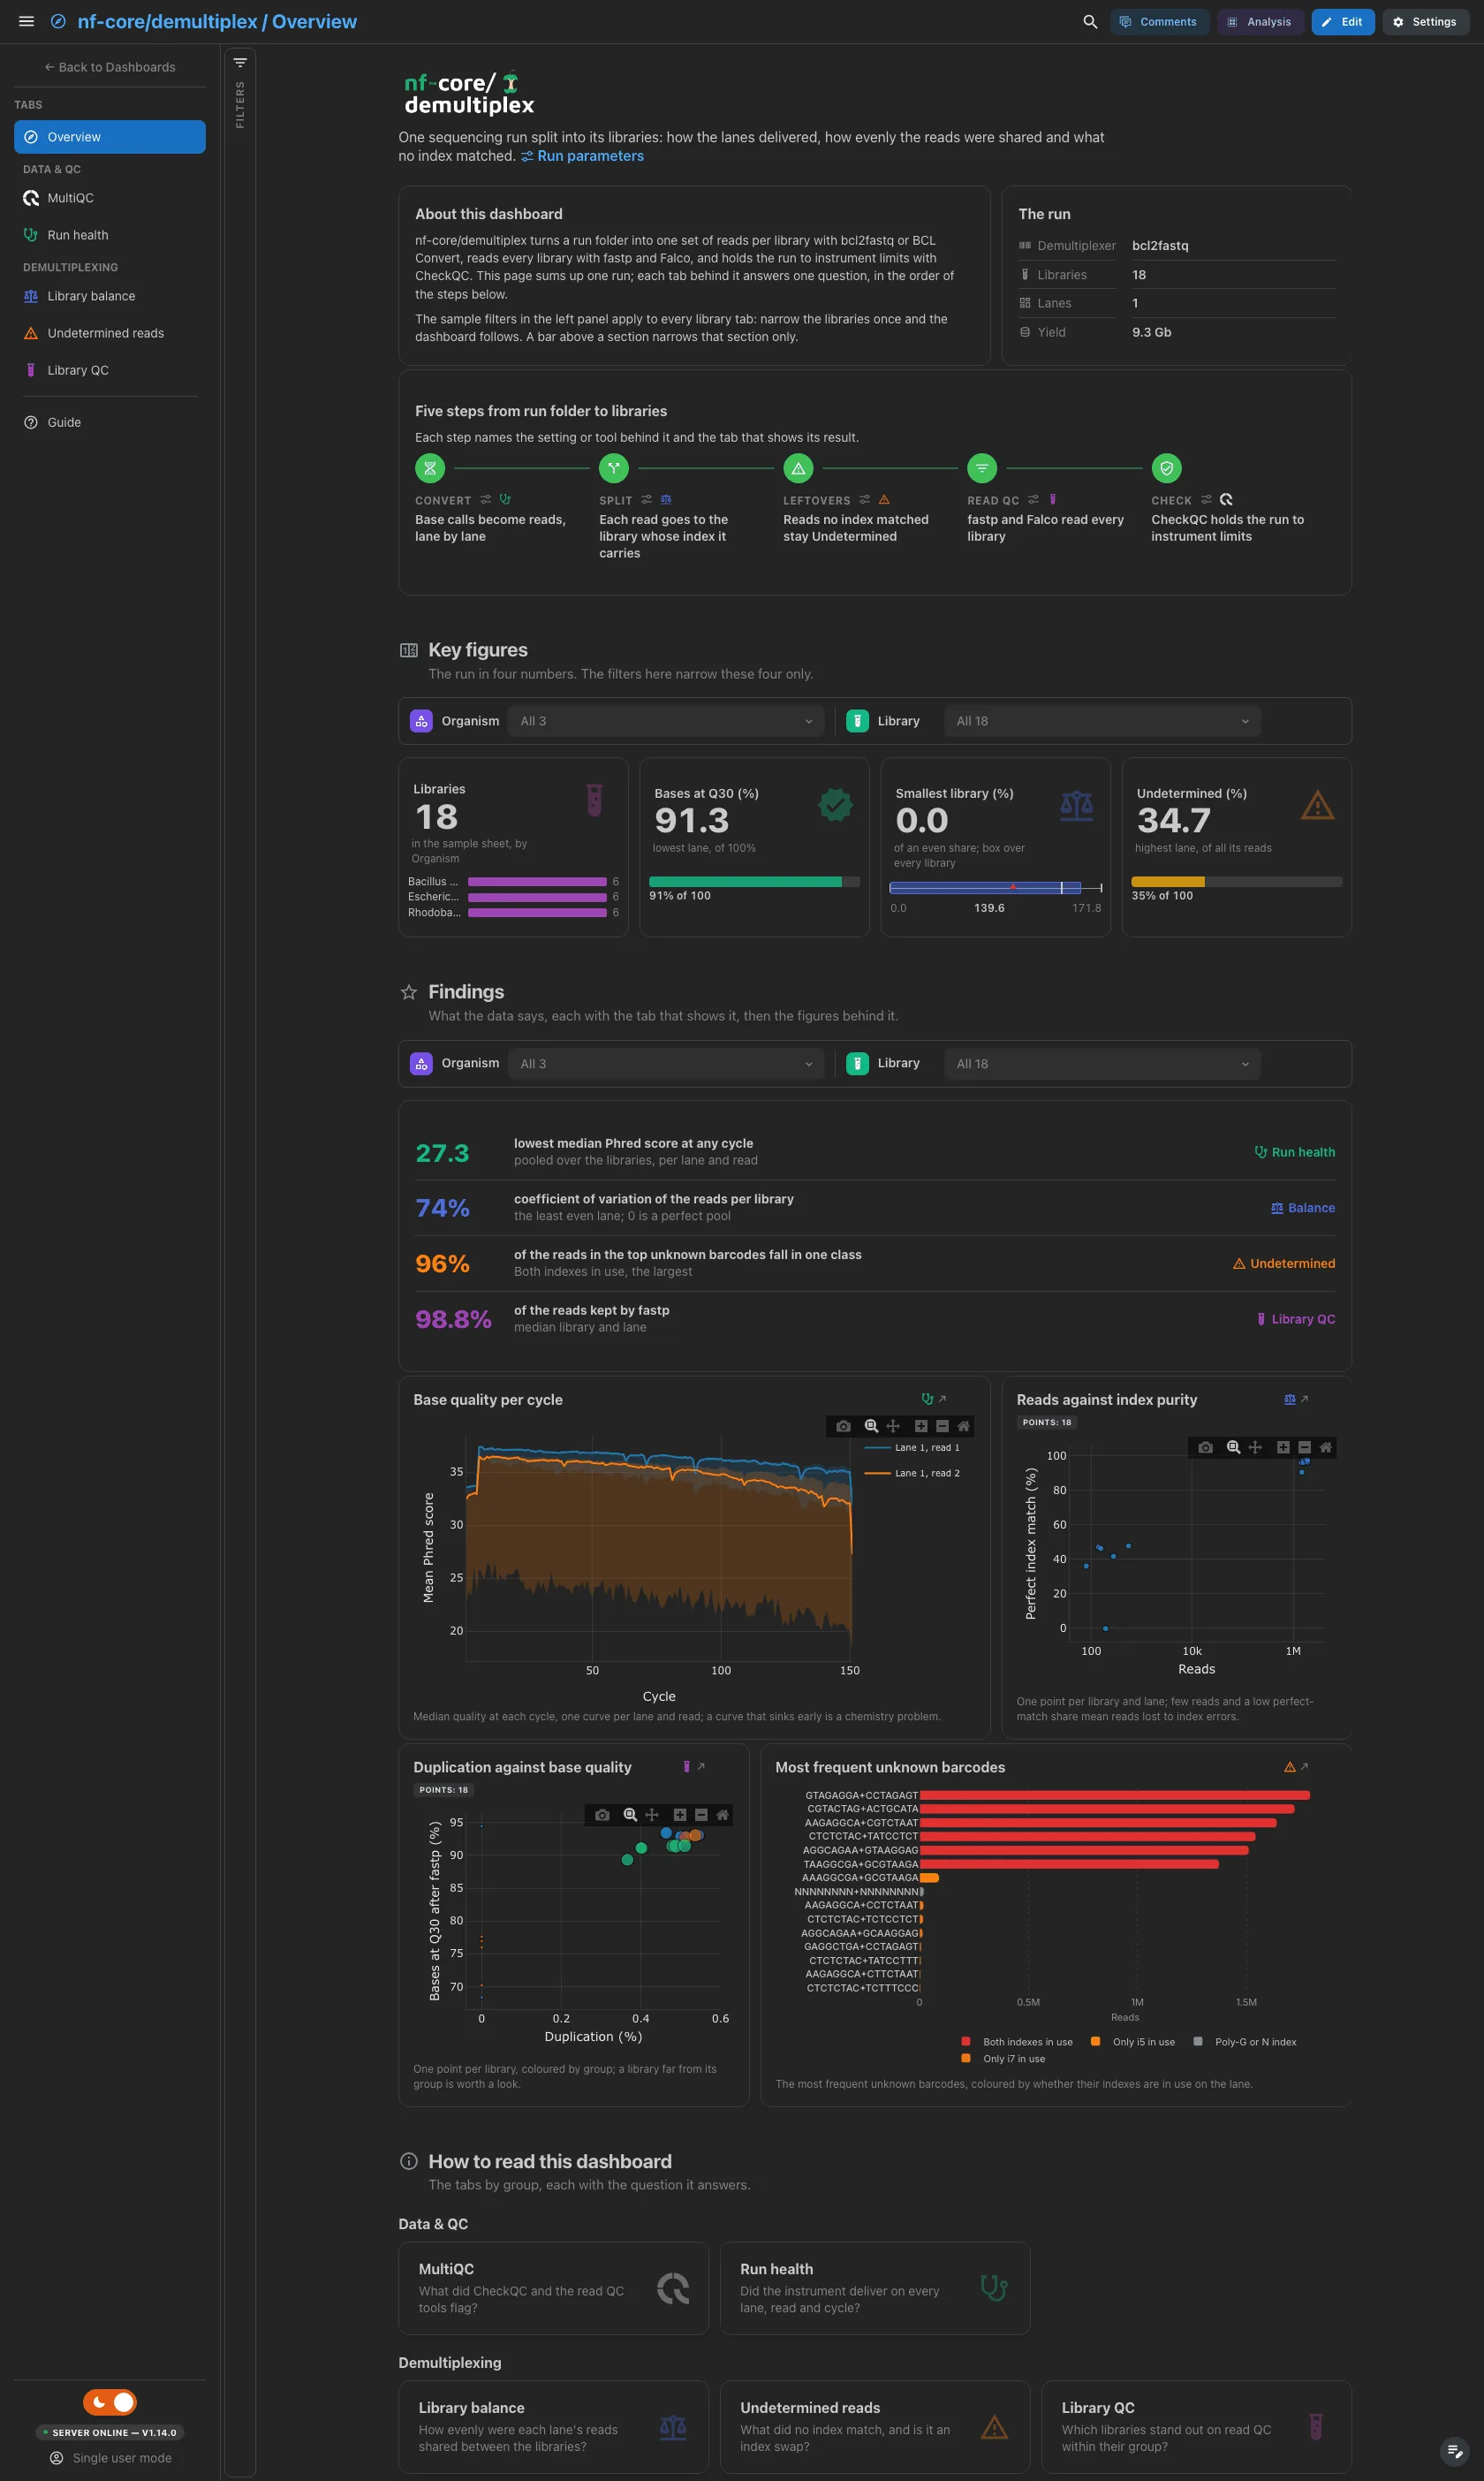
A short hero links the run parameters. About this dashboard says how the two
filter levels work, The run lists the demultiplexer (from params.json), the
libraries, the lanes and the yield, and Pipeline walks the five steps from
run folder to libraries (convert, split, leftovers, read QC, check), each
linked to the setting or tool version behind it and to its tab. The findings
are live values: they follow the filters, and a route that lacks their data
drops them.
Filters and components
Filters · the left panel starts collapsed. Key figures and Findings each have their own filter bar (the group and the library): each narrows its own section only.
| Section | What it holds |
|---|---|
| Top | Hero, About this dashboard, The run, Pipeline |
| Key figures | 4 headline cards: libraries by group, bases at Q30 on the weakest lane, the smallest library against an even share, the Undetermined share of the worst lane |
| Findings | Live result rows, then 4 figures: the base quality per cycle, reads against index purity, the library QC scatter and the most frequent unknown barcodes |
| How to read this dashboard | The tabs by group, each with its question |
Data & QC · What did CheckQC and the read QC tools flag?
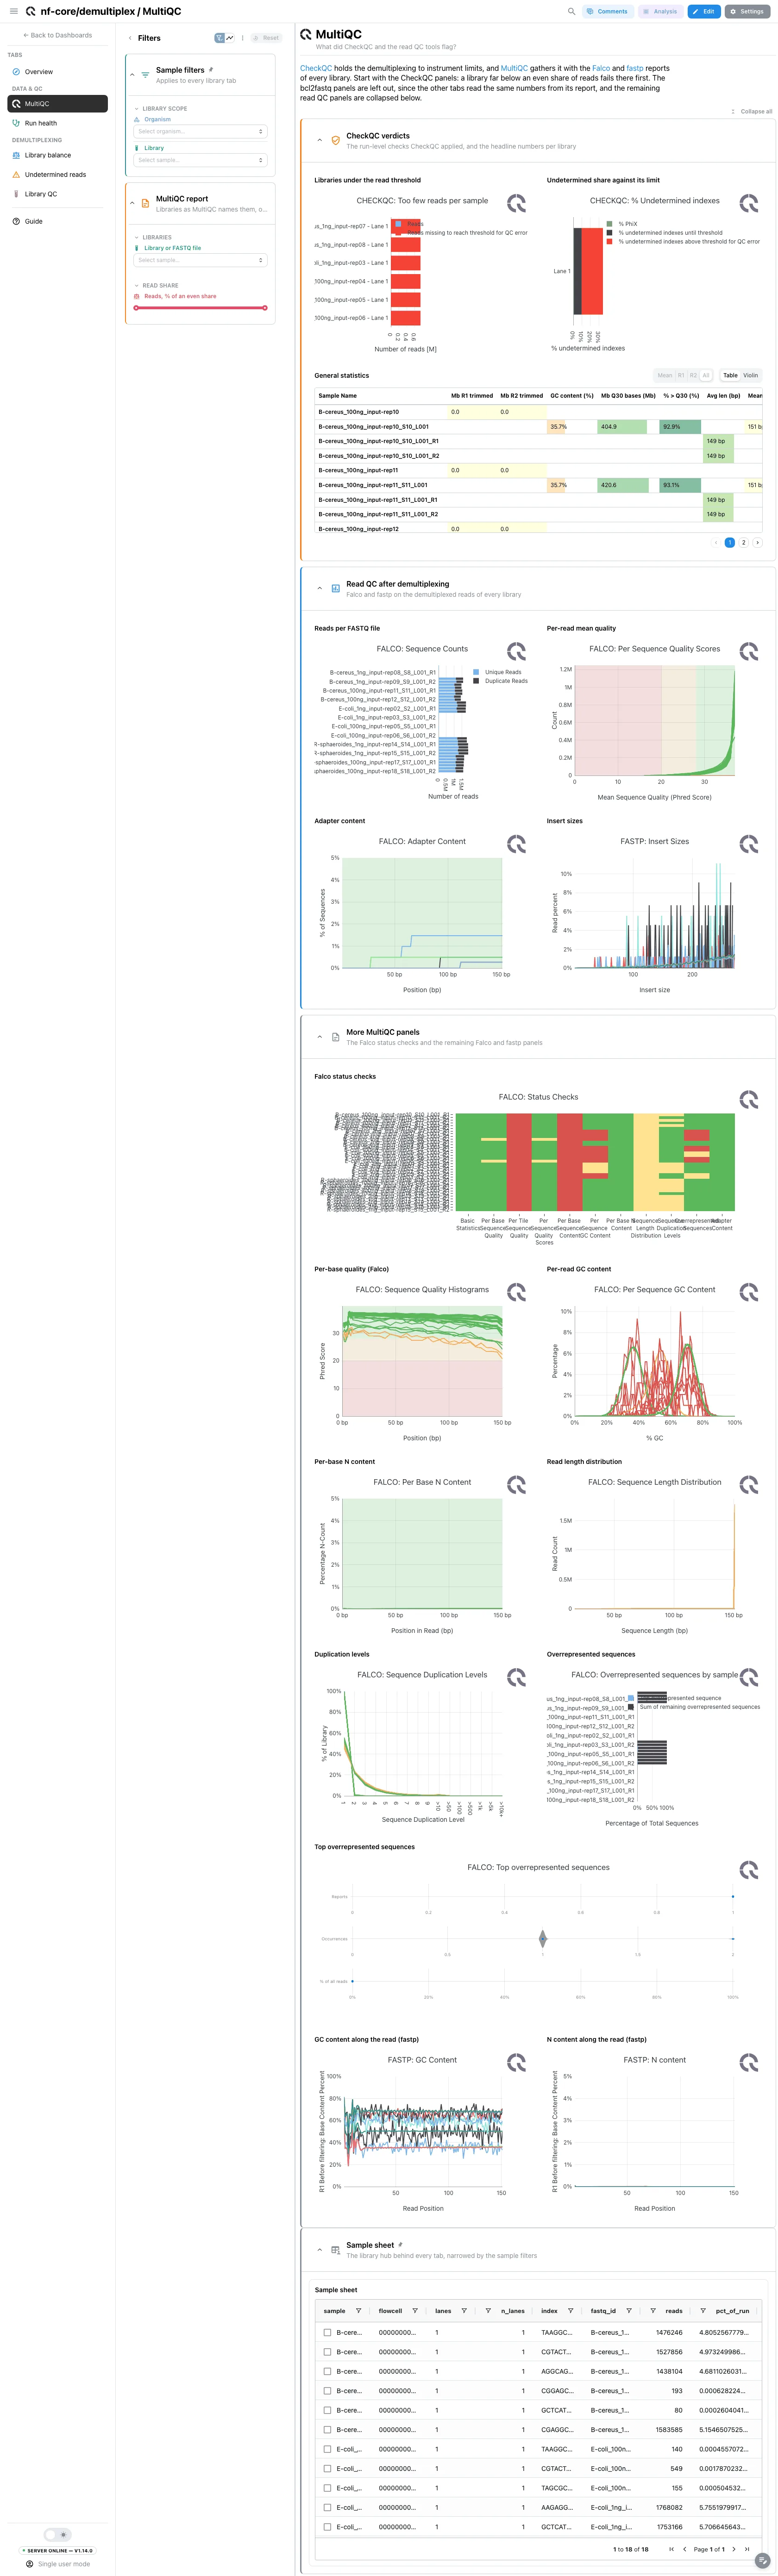
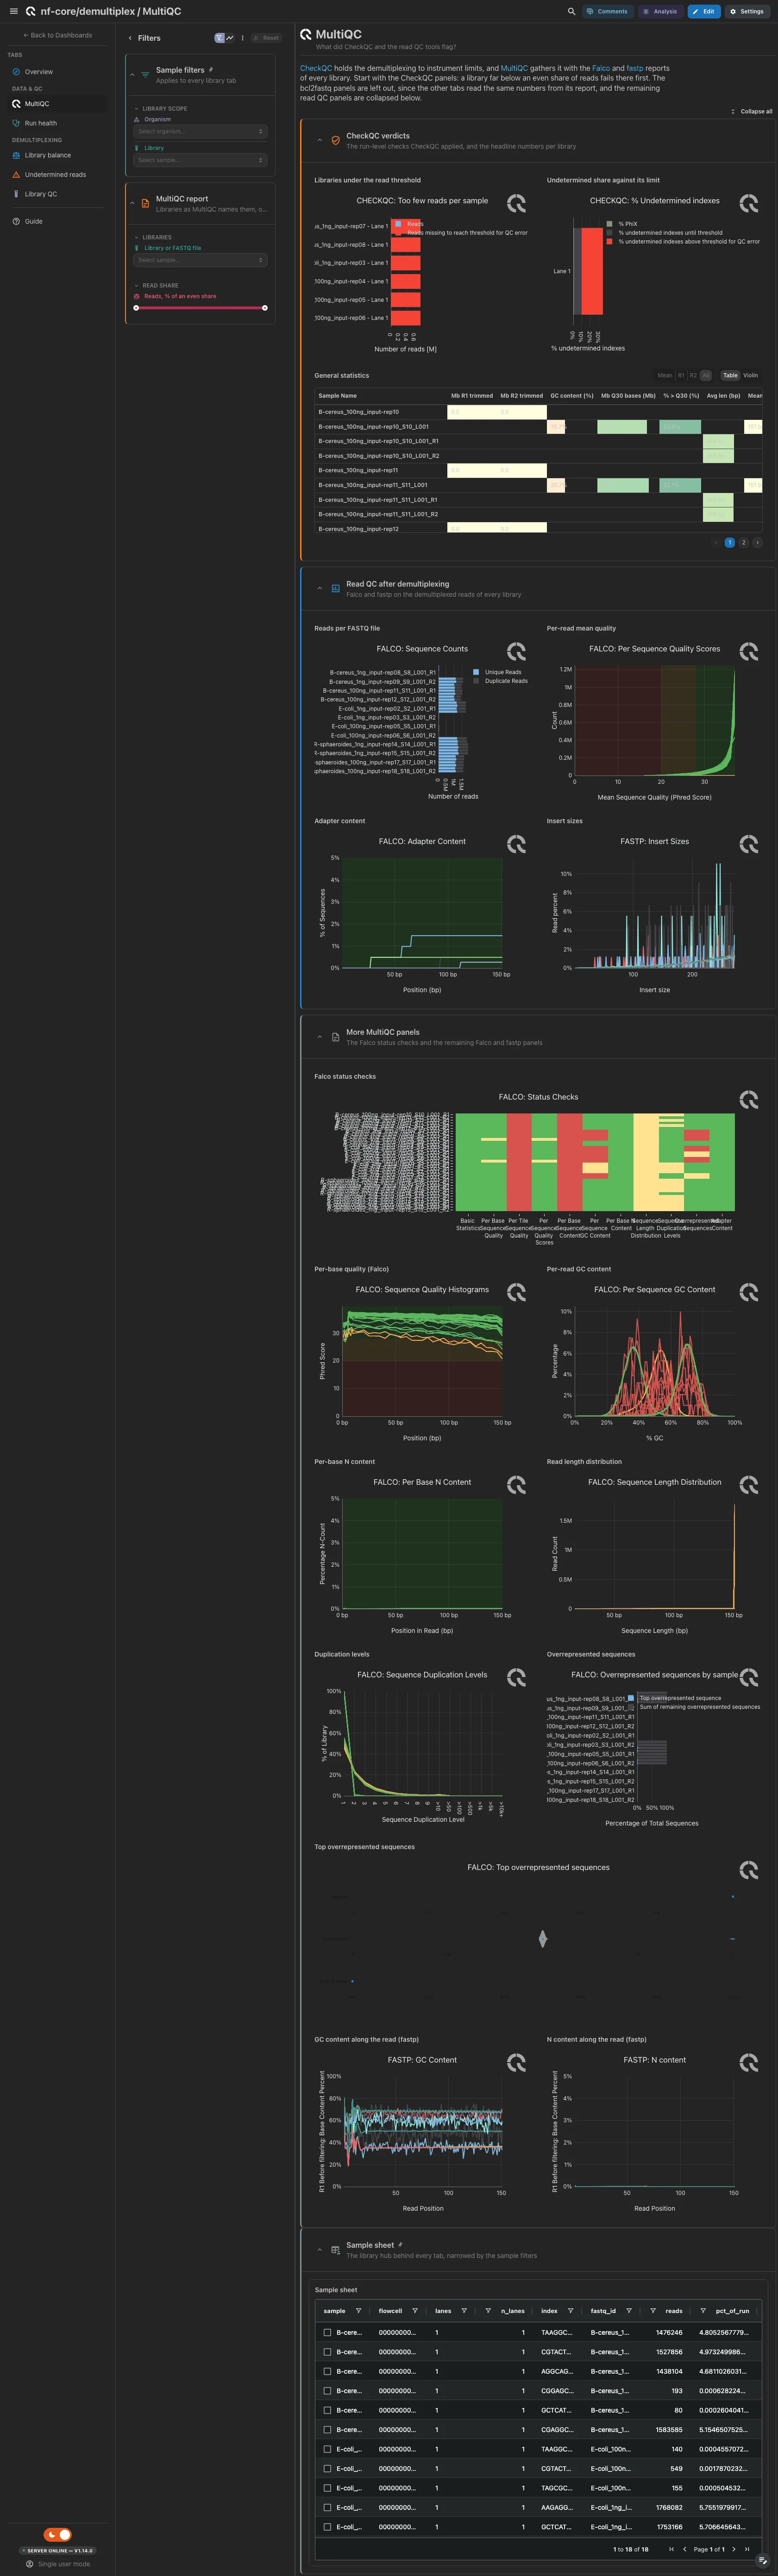
MultiQC panels only. Open: the two CheckQC panels (libraries under the read threshold, the Undetermined share against its limit) and the general statistics, then Falco read counts, per-read quality and adapter content with the fastp insert sizes. Start with CheckQC: a library far below an even share of reads fails there first. The Falco status checks and the remaining Falco and fastp panels are collapsed. The bcl2fastq panels, fastp Filtered Reads and fastp Sequence Quality are left out: the other tabs read the same numbers from the reports themselves.
Filters and components
Filters · Library or FASTQ file on multiqc_data, as MultiQC names
it, and a Reads, % of an even share range on the libraries hub, which
links into the report.
| Section | What it holds |
|---|---|
| CheckQC verdicts | 3 MultiQC panels |
| Read QC after demultiplexing | 4 MultiQC panels |
| More MultiQC panels (collapsed) | 10 MultiQC panels |
Data & QC · Did the instrument deliver on every lane, read and cycle?
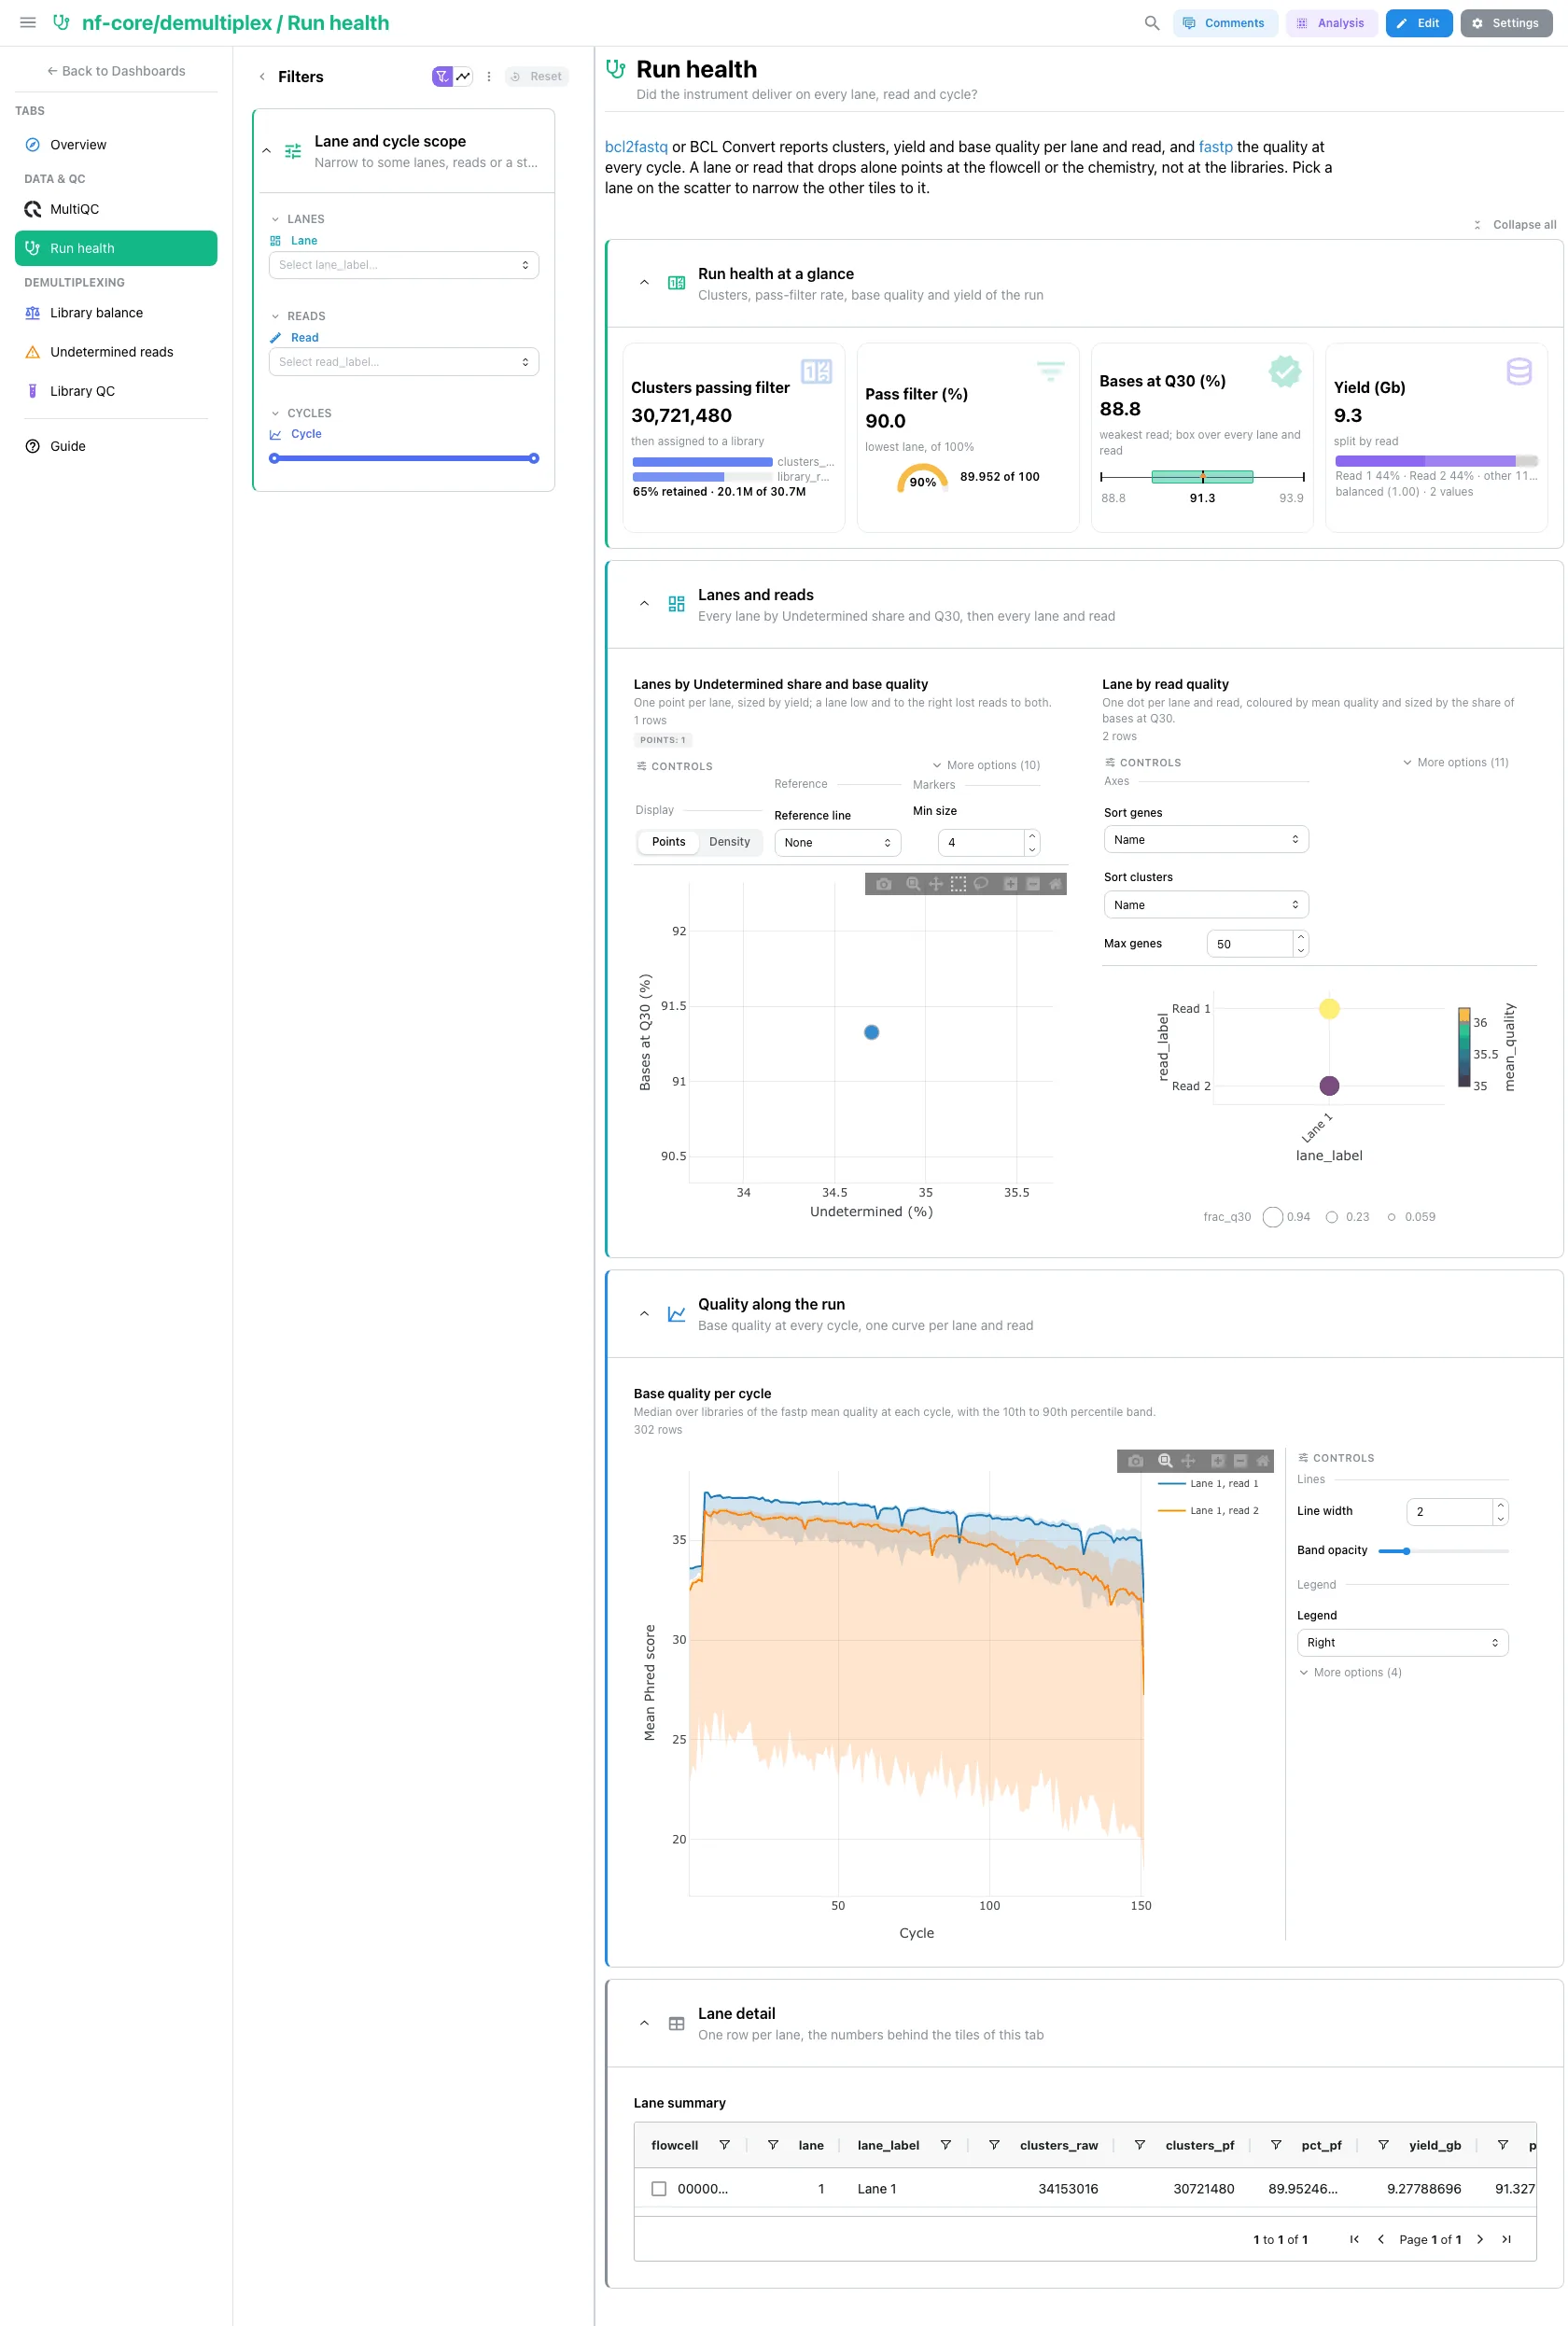
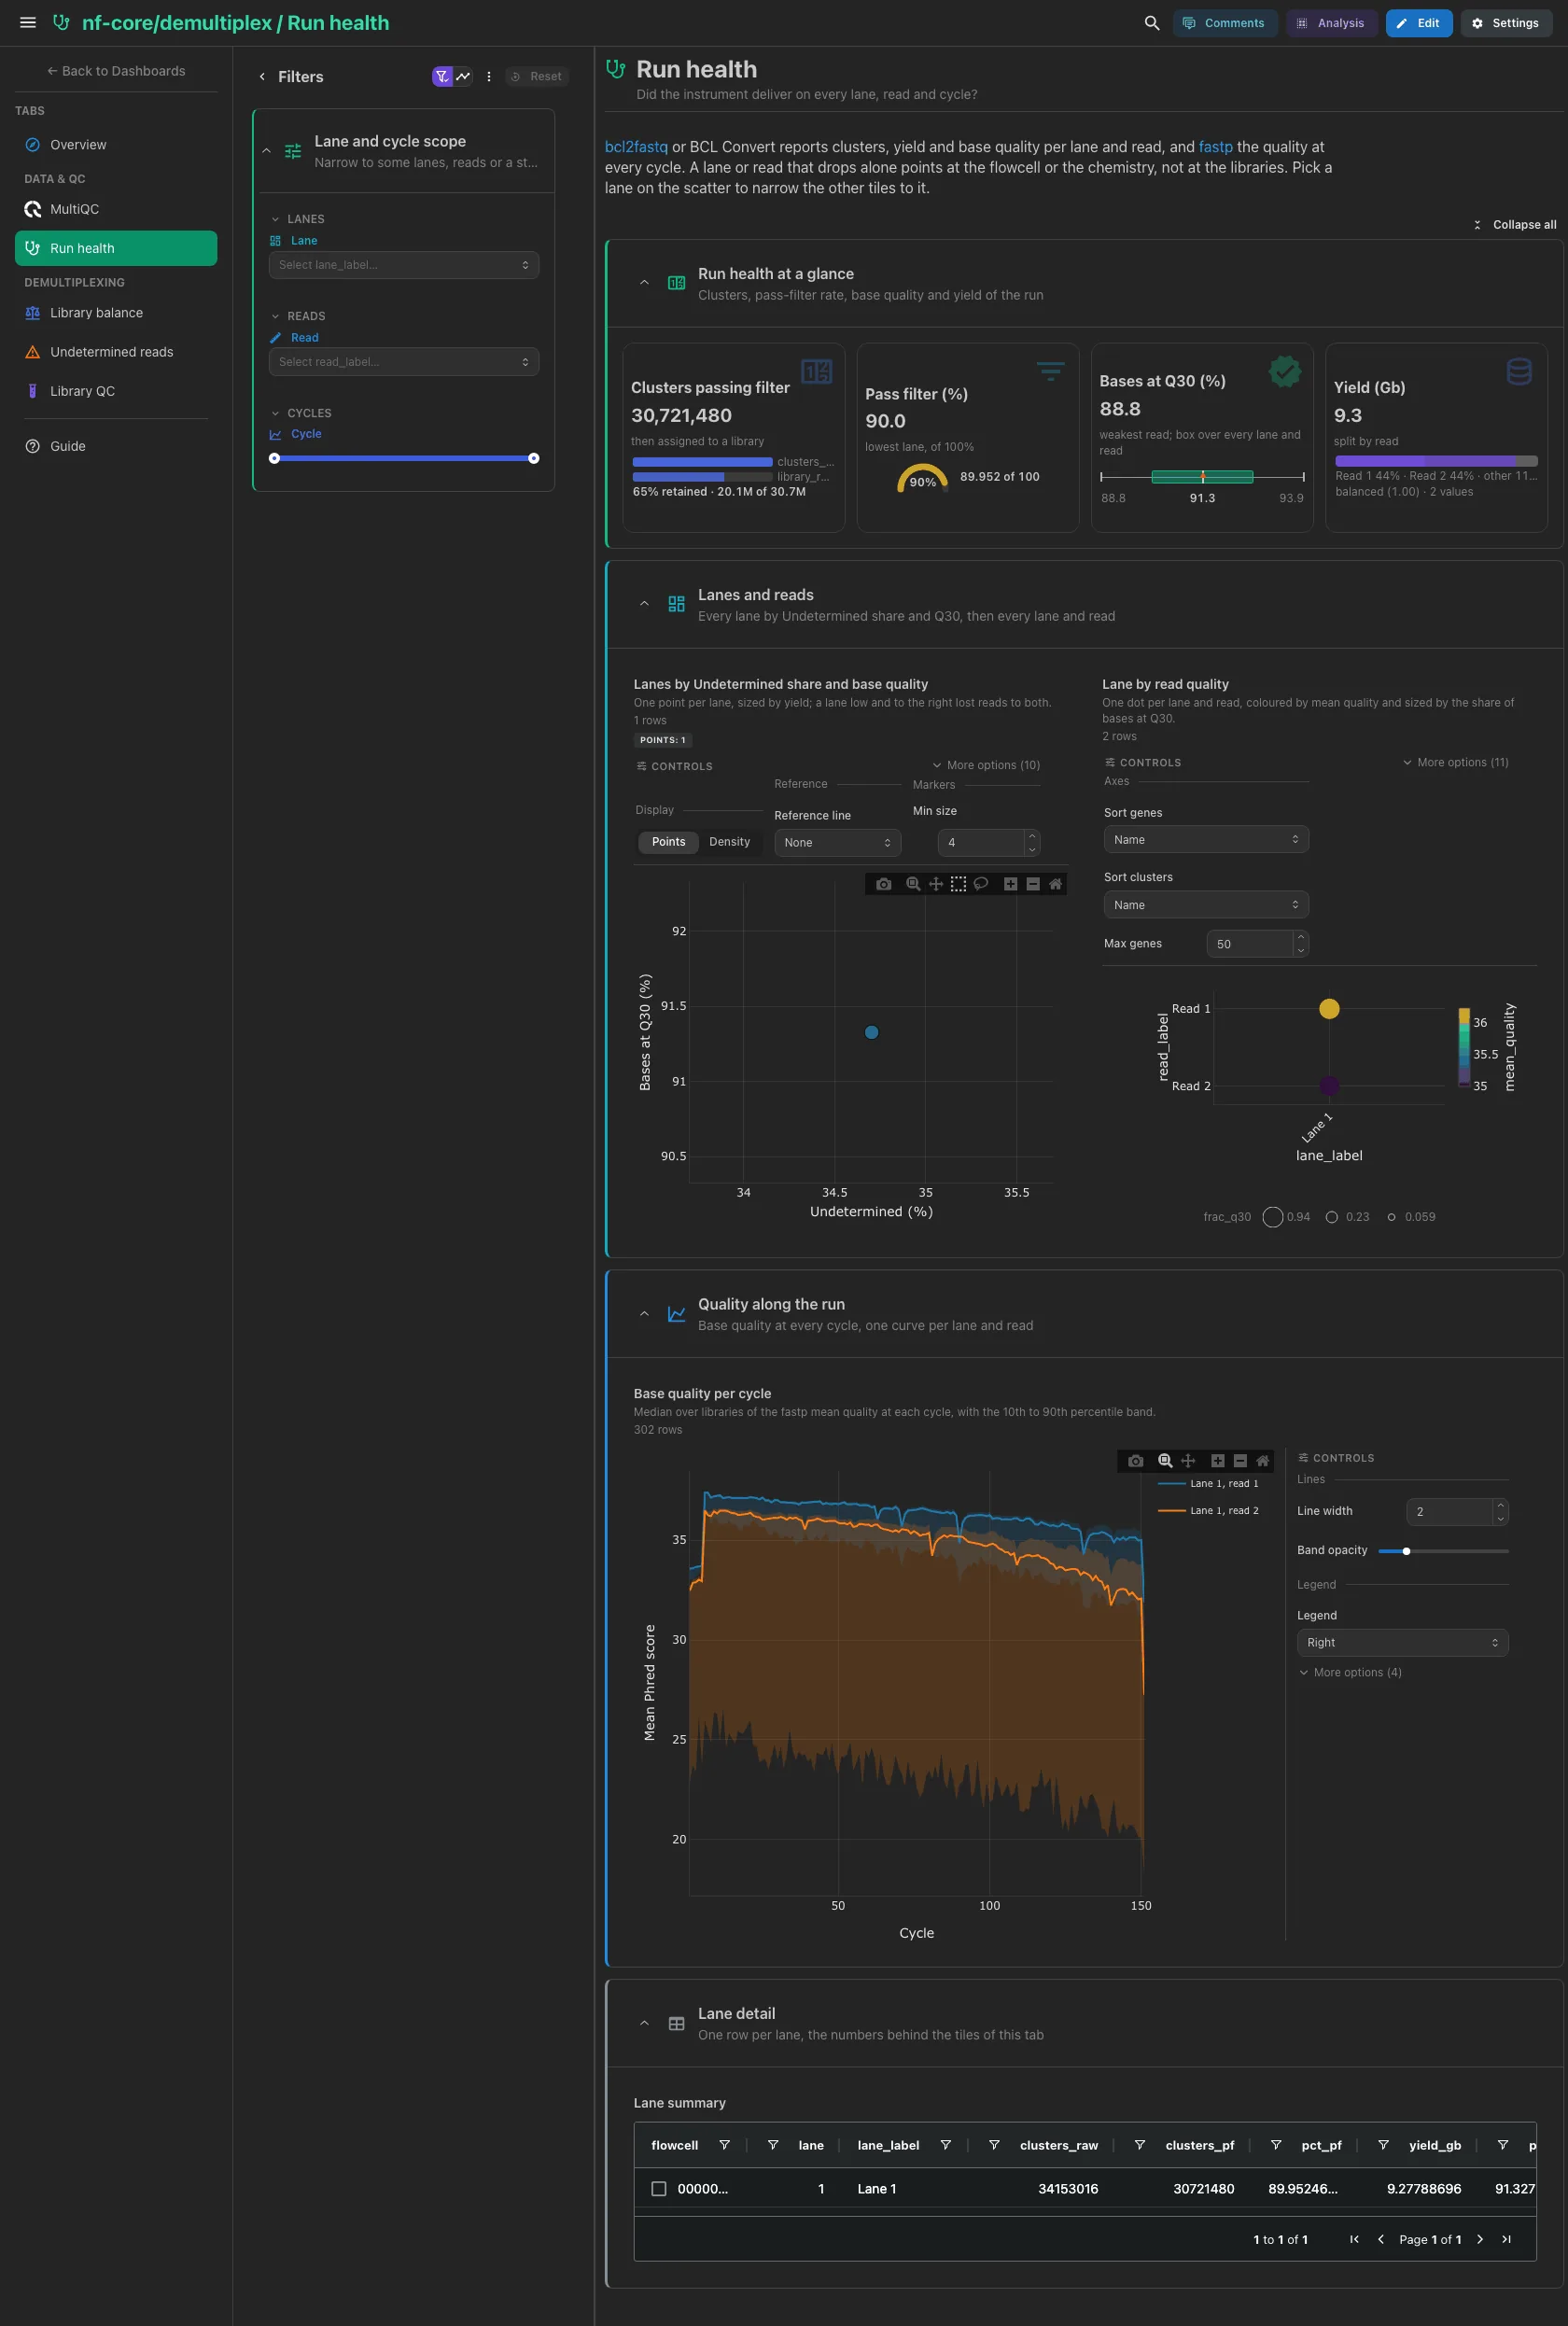
Clusters passing filter (then those assigned to a library), the lowest pass-filter rate on a gauge, the share of bases at Q30 in the weakest read and the yield split by read. Then every lane by Undetermined share and Q30, sized by yield (a lane low and to the right lost reads to both), beside the lane by read quality dot plot, and the base quality at every cycle, one curve per lane and read with its 10th to 90th percentile band. A lane or read that drops alone points at the flowcell or the chemistry, not at the libraries. The Sequencing Analysis Viewer metrics and the lane table are collapsed.
Filters and components
Filters · Lane on lane_summary, Read on read_quality and a
Cycle range on cycle_quality. The sample filters do not reach this tab.
| Section | What it holds |
|---|---|
| Run health at a glance | 4 cards |
| Lanes and reads | 2 advanced visualizations: the lane scatter and the lane by read dot plot |
| Quality along the run | 1 advanced visualization |
| Sequencing Analysis Viewer metrics (collapsed) | 4 cards, 2 advanced visualizations: the PhiX error rate per lane and read, phasing against prephasing |
| Lane detail (collapsed) | Lane summary |
The SAV section needs an InterOp summary table
Error rate, phasing and cluster density live in the InterOp binaries,
which Depictio does not parse. demultiplex 1.8.0 does not run
interop_summary, so on a stock run the collapsed section stays empty.
Run interop_summary --csv=1 <run folder> and drop the output anywhere
under the run (any .csv whose name contains interop_summary): the
section then shows the worst PhiX error rate, the lowest share of clusters
passing filter, the densest lane and the worst phasing, then the error
rate per lane and read and phasing against prephasing.
Demultiplexing · How evenly were each lane's reads shared between the libraries?
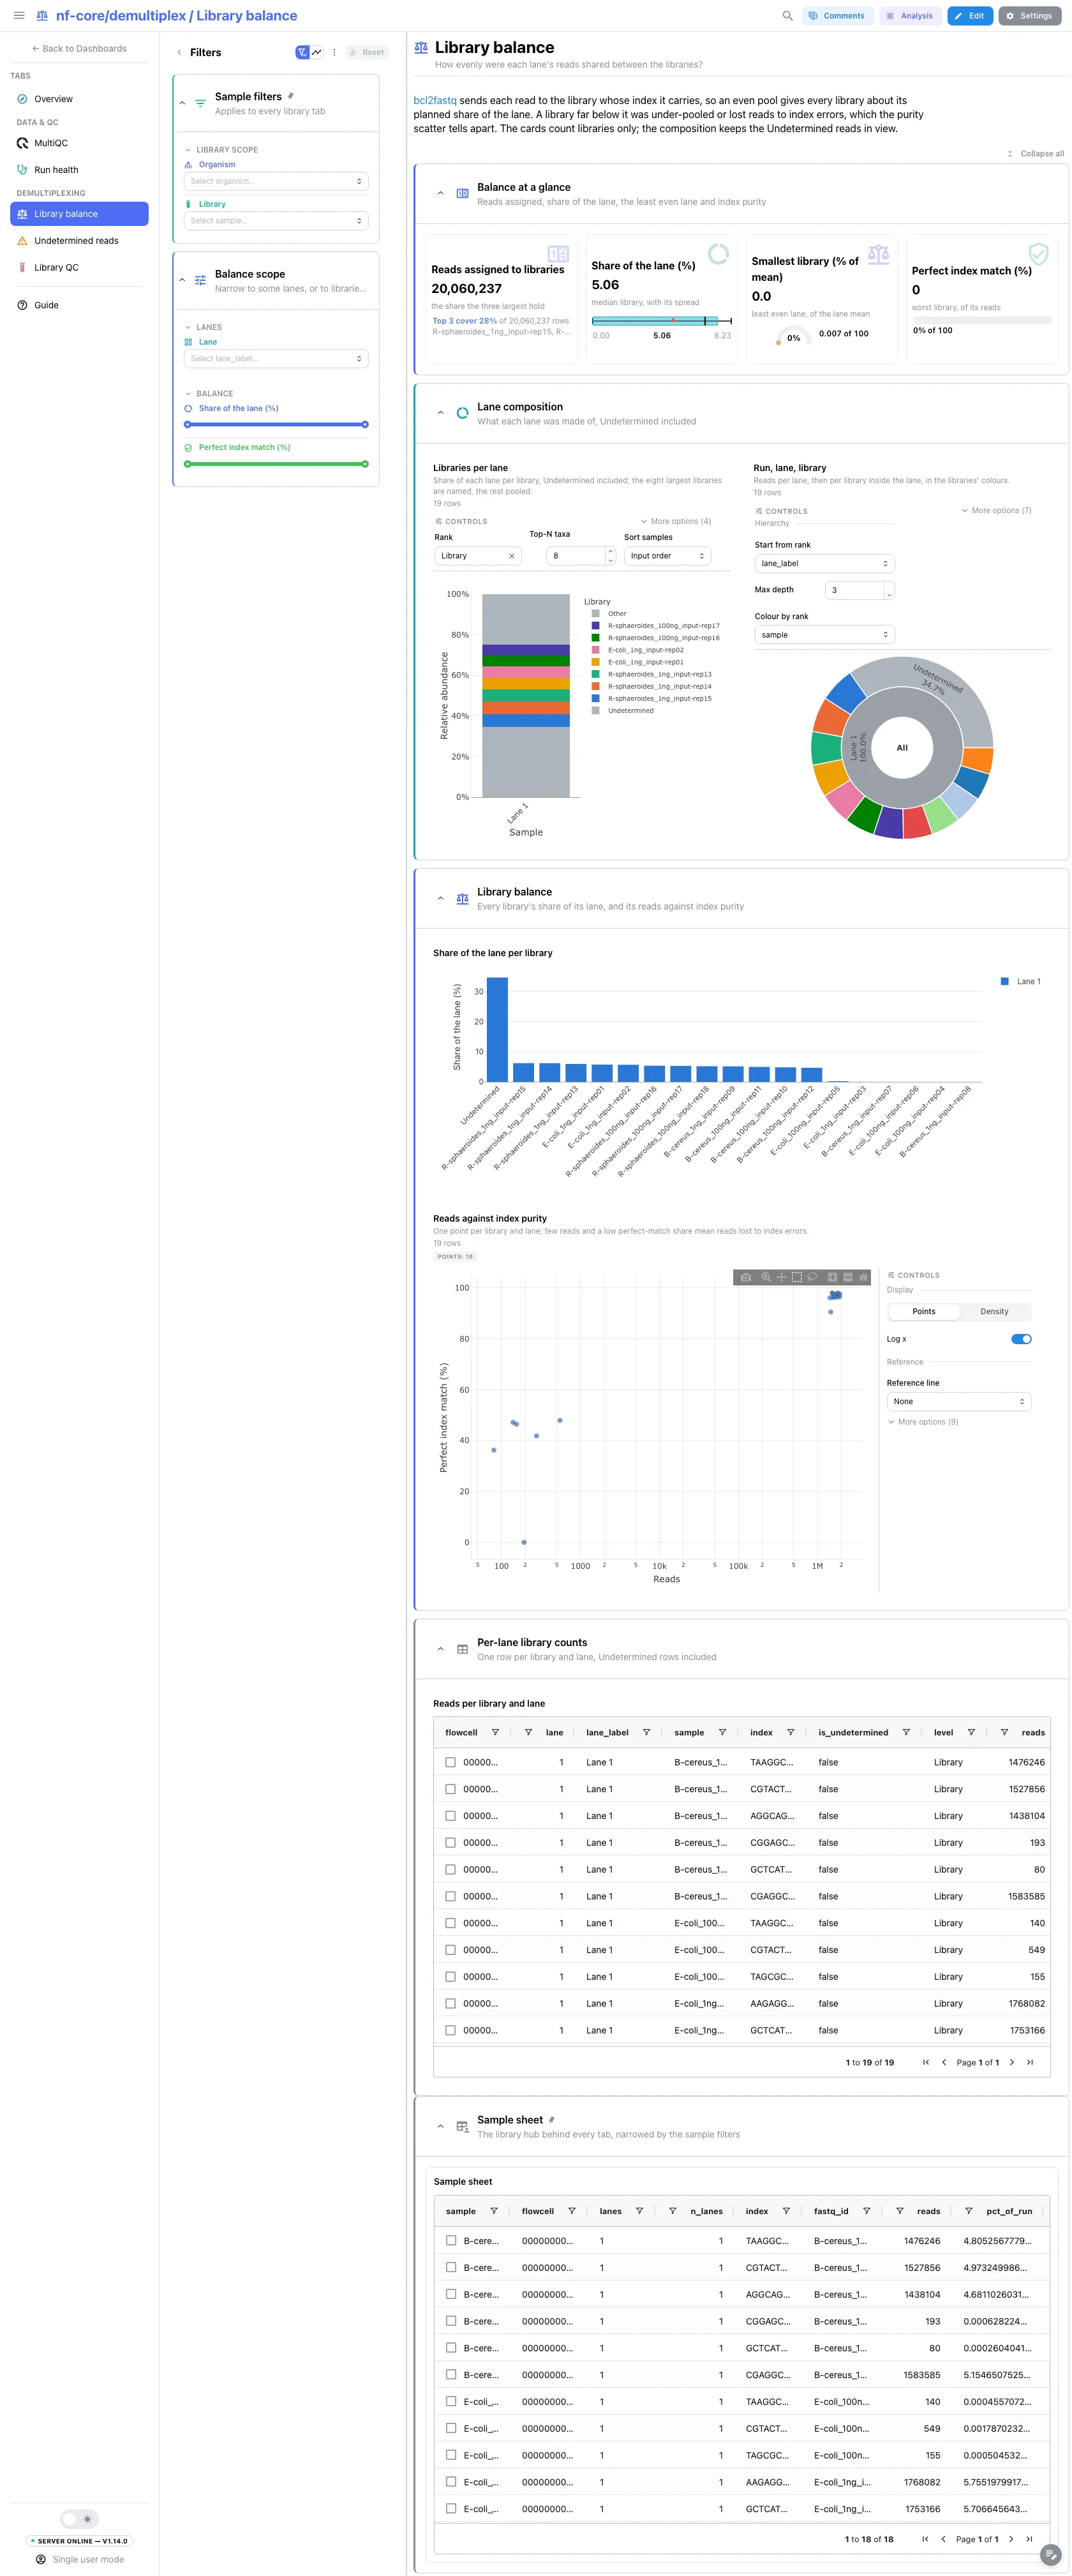
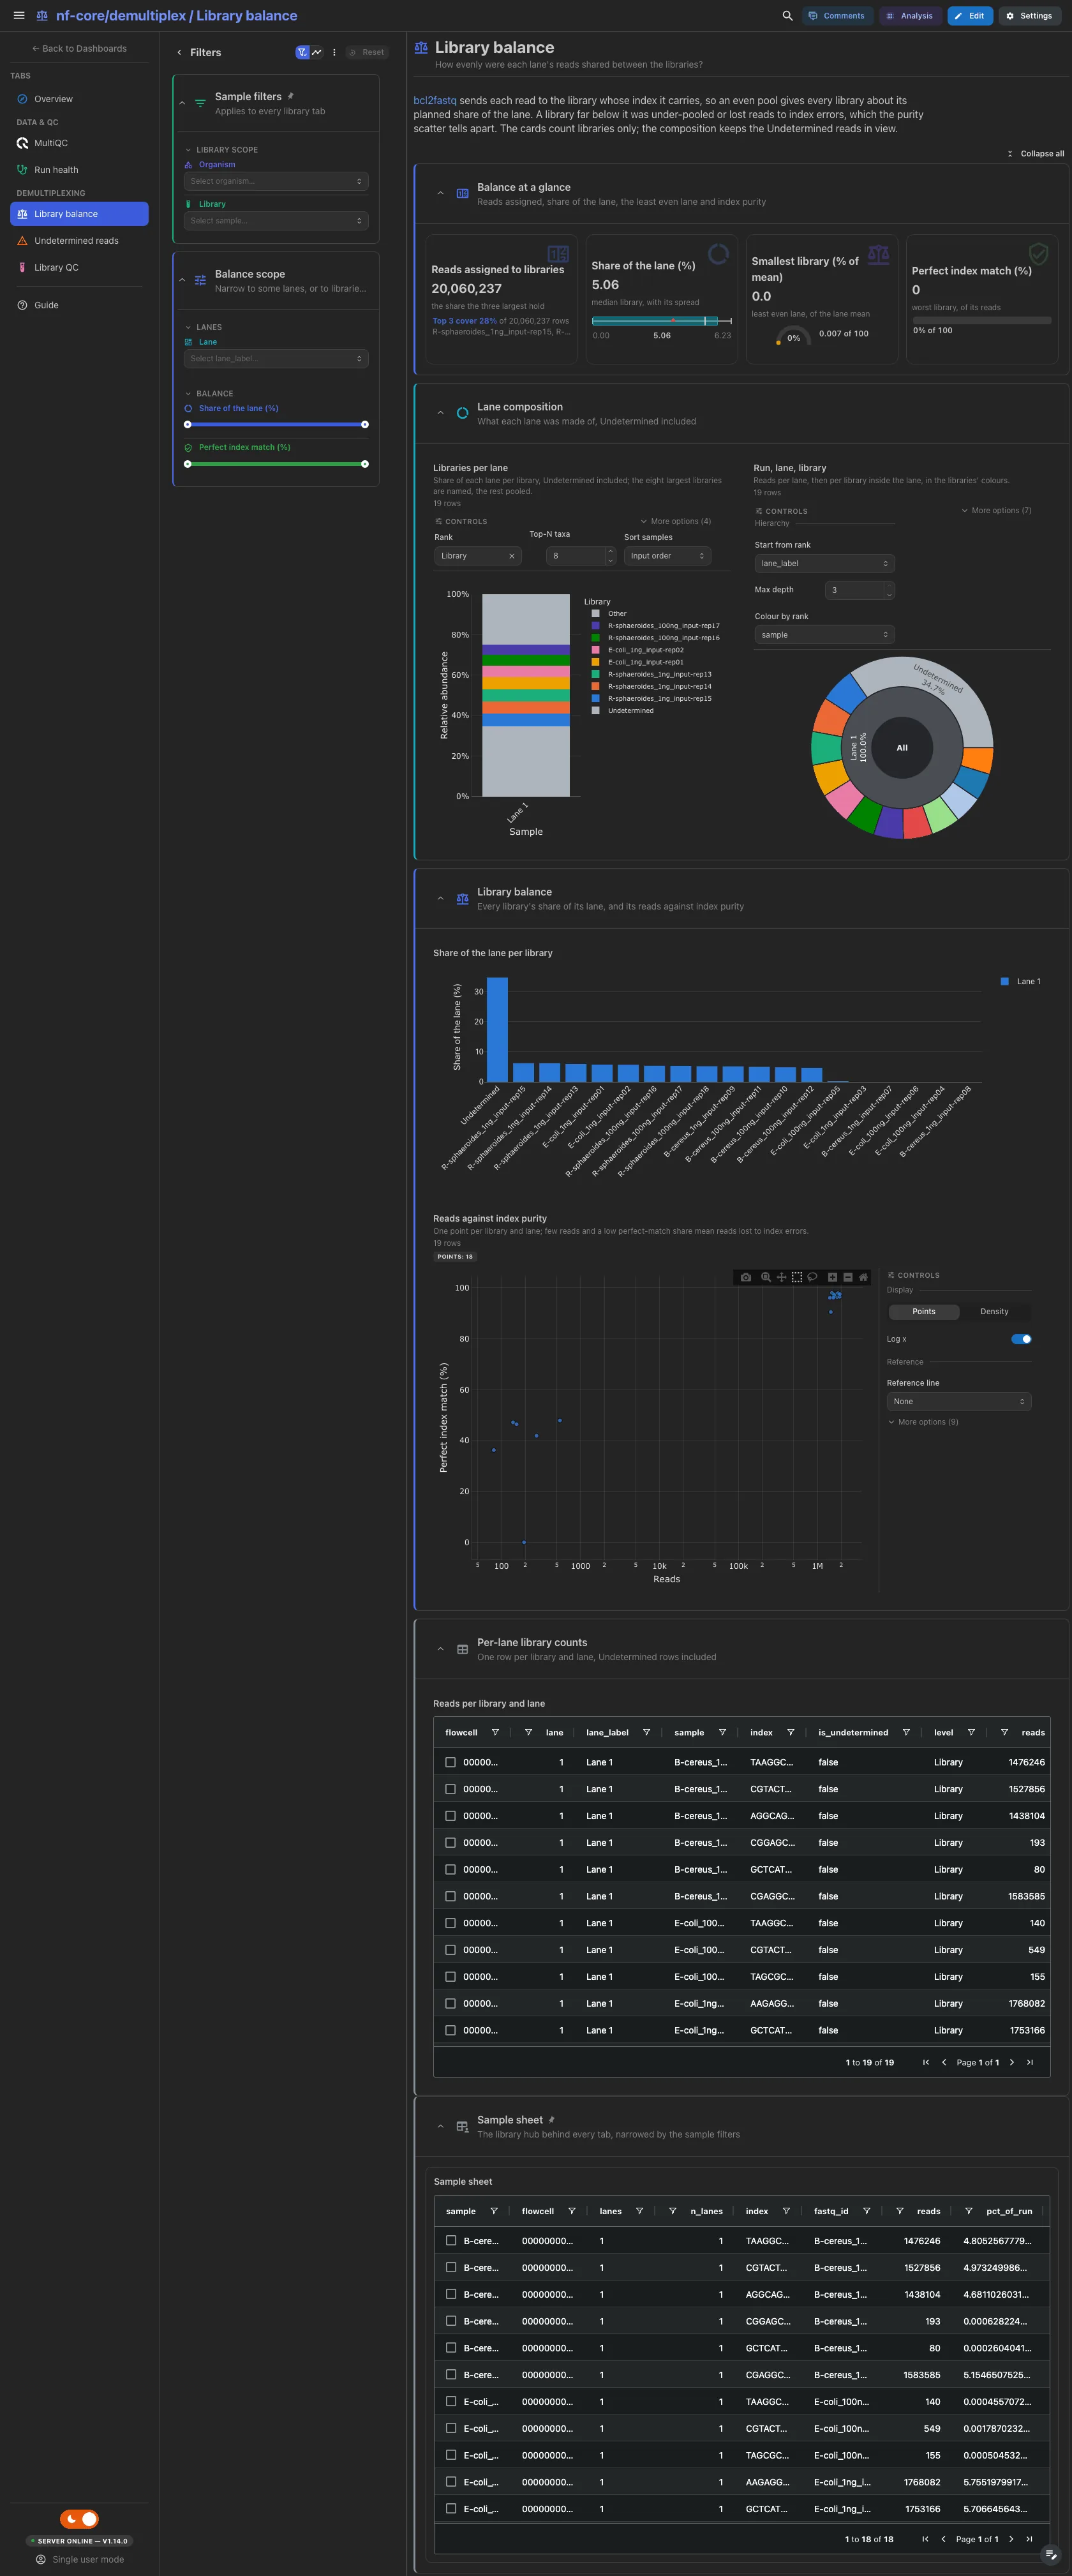
Reads assigned to libraries (with the share the three largest hold), the median share of the lane per library, the smallest library against the mean library of the least even lane (a gauge, 100 is the mean) and the worst perfect index match. Then the composition of each lane (the eight largest libraries named, the rest pooled, Undetermined kept) beside the run, lane, library sunburst, then every library's share of its lane and its reads against index purity. A library with few reads and a high perfect-match share was under-pooled; one with few reads and a low perfect-match share lost reads to index errors. The reads per library and lane, Undetermined rows included, are collapsed.
Filters and components
Filters · Lane on lane_summary, and Share of the lane (%) and
Perfect index match (%) ranges on demux_stats.
| Section | What it holds |
|---|---|
| Balance at a glance | 4 cards |
| Lane composition | 2 advanced visualizations: the libraries per lane and the run, lane, library sunburst |
| Library balance | Share of the lane per library, 1 advanced visualization (reads against index purity) |
| Per-lane library counts (collapsed) | Reads per library and lane |
Demultiplexing · What did no index match, and is it an index swap?
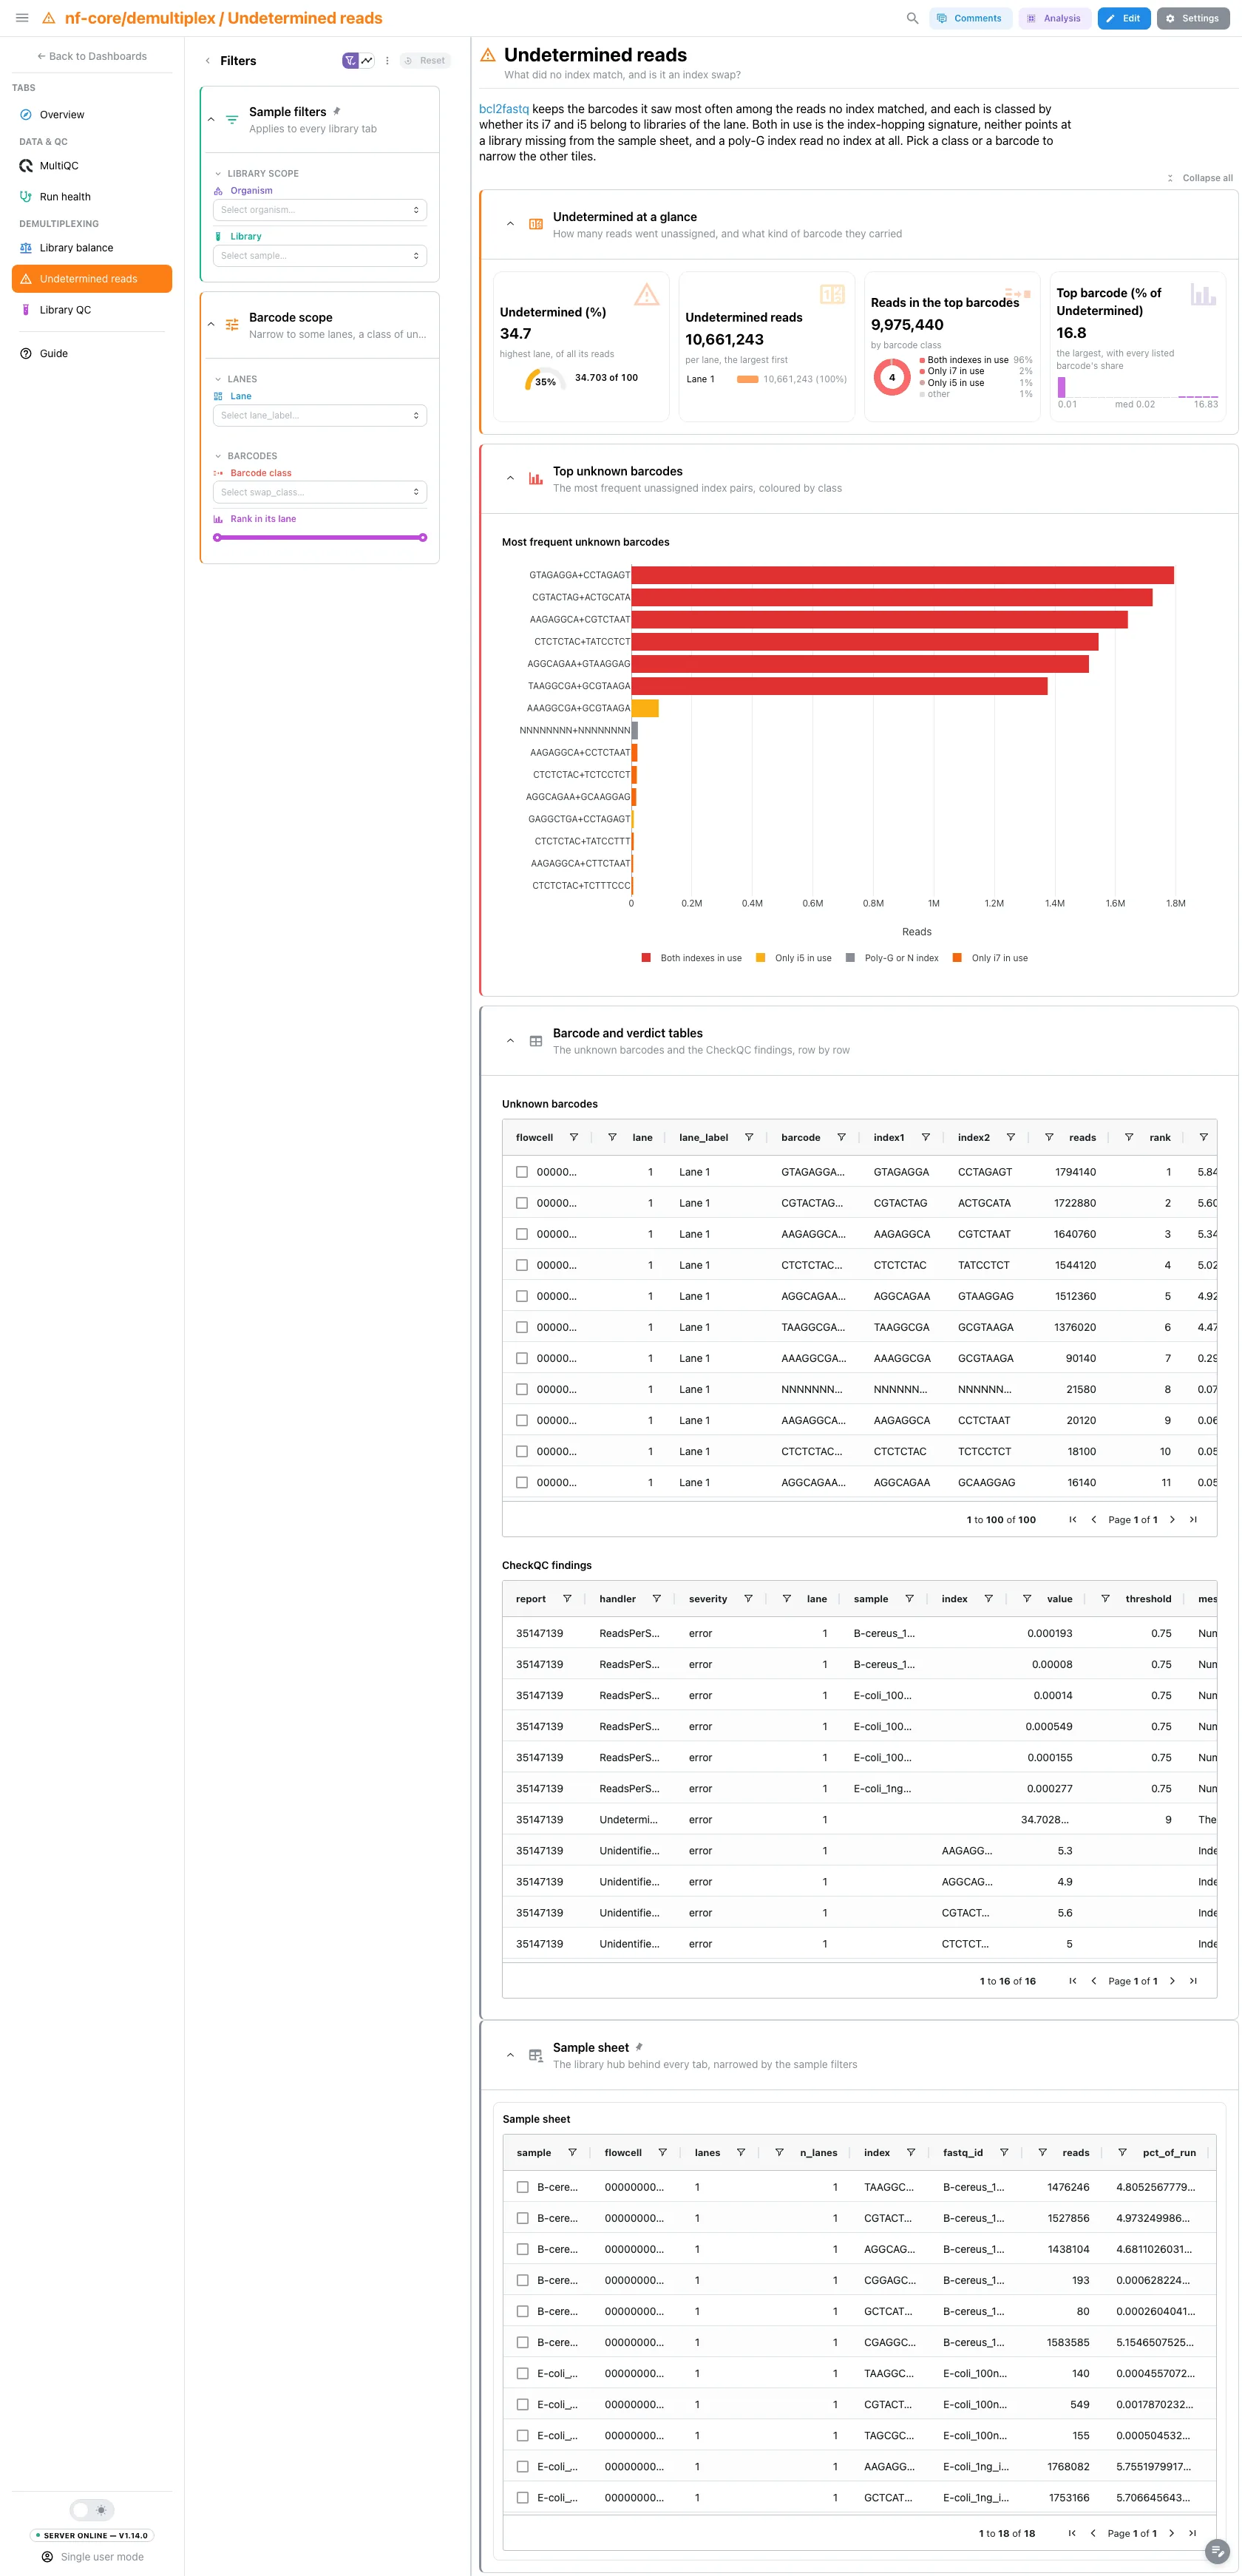
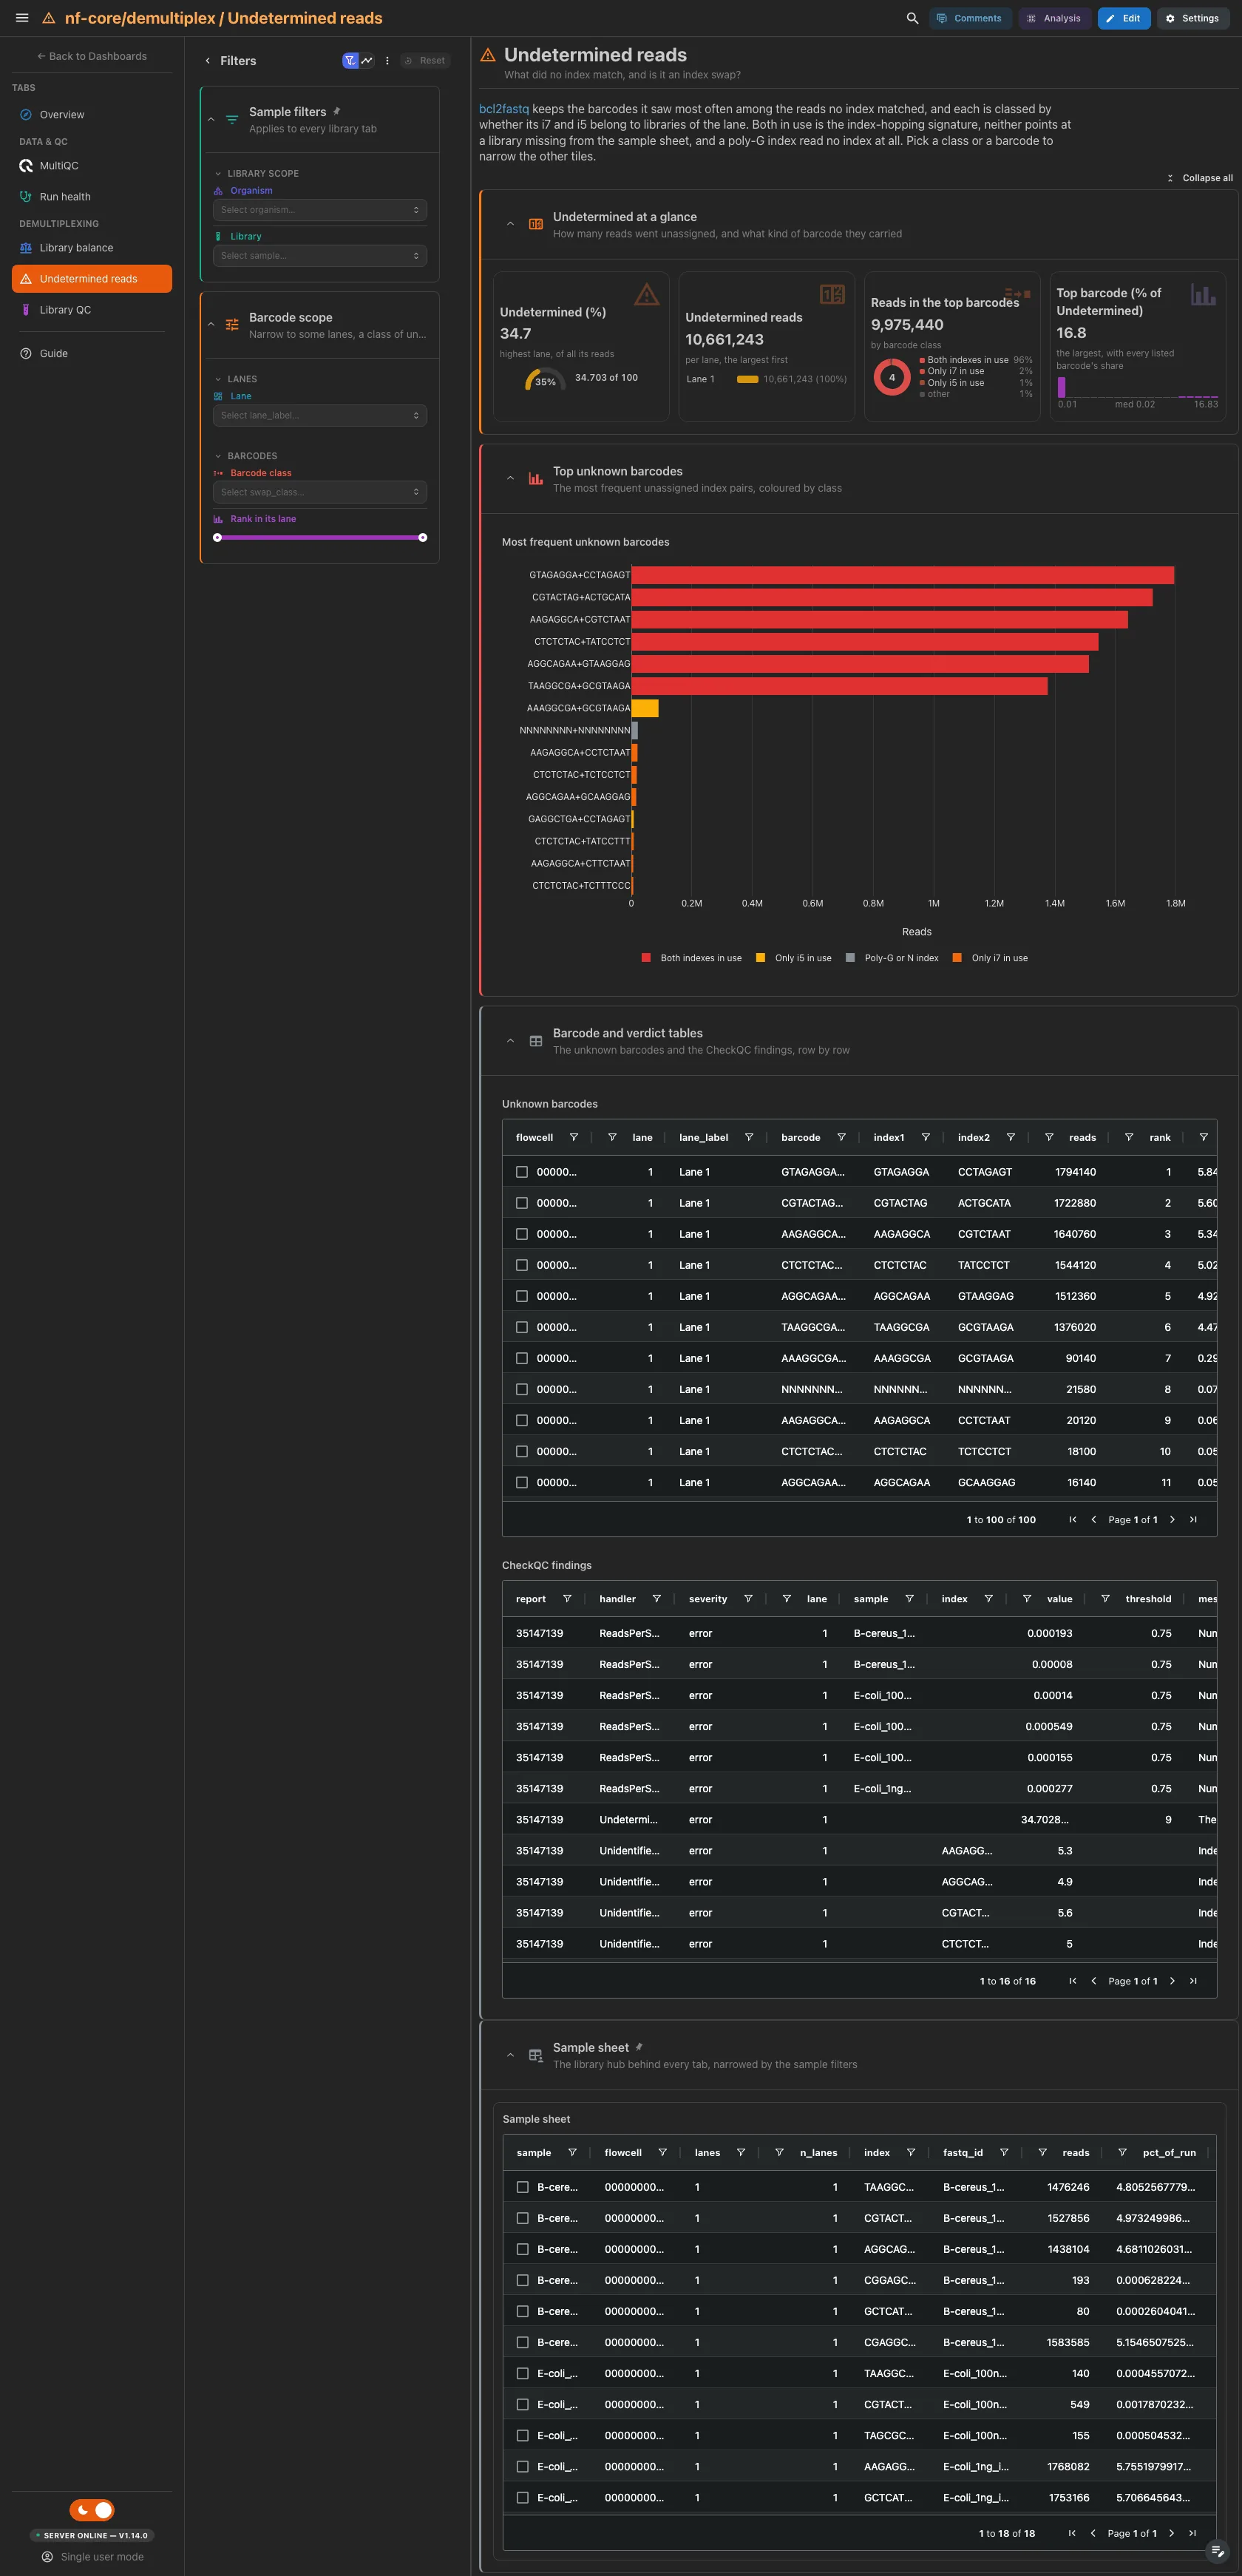
The Undetermined share of the worst lane on a gauge, the Undetermined reads ranked by lane, the reads in the top unknown barcodes split by class and the share of a lane's Undetermined reads carried by its most frequent barcode. Then the fifteen most frequent unknown barcodes over the lanes in view, coloured by class. Each unassigned index pair is split into its i7 and i5 and checked against the libraries of the same lane: Both indexes in use is the index-hopping or swap signature, Only i7 in use or Only i5 in use often a mistyped index, Neither index in use a library missing from the sample sheet or a contamination, Poly-G or N index a failed index read. The unknown barcode table and the CheckQC findings (one row per finding, a pass row for each silent check) are collapsed.
Filters and components
Filters · Lane on lane_summary, and Barcode class and a Rank in
its lane range on unknown_barcodes.
| Section | What it holds |
|---|---|
| Undetermined at a glance | 4 cards |
| Top unknown barcodes | Most frequent unknown barcodes |
| Barcode and verdict tables (collapsed) | Unknown barcodes, CheckQC findings |
No unknown barcodes, no barcode tiles
bcl2fastq keeps the top unknown barcodes of each lane, and the recipes keep
the 100 most frequent per lane. A report without them skips
unknown_barcodes: its cards, figure, table and filters go, and the lane
cards of the tab remain.
Demultiplexing · Which libraries stand out on read QC within their group?
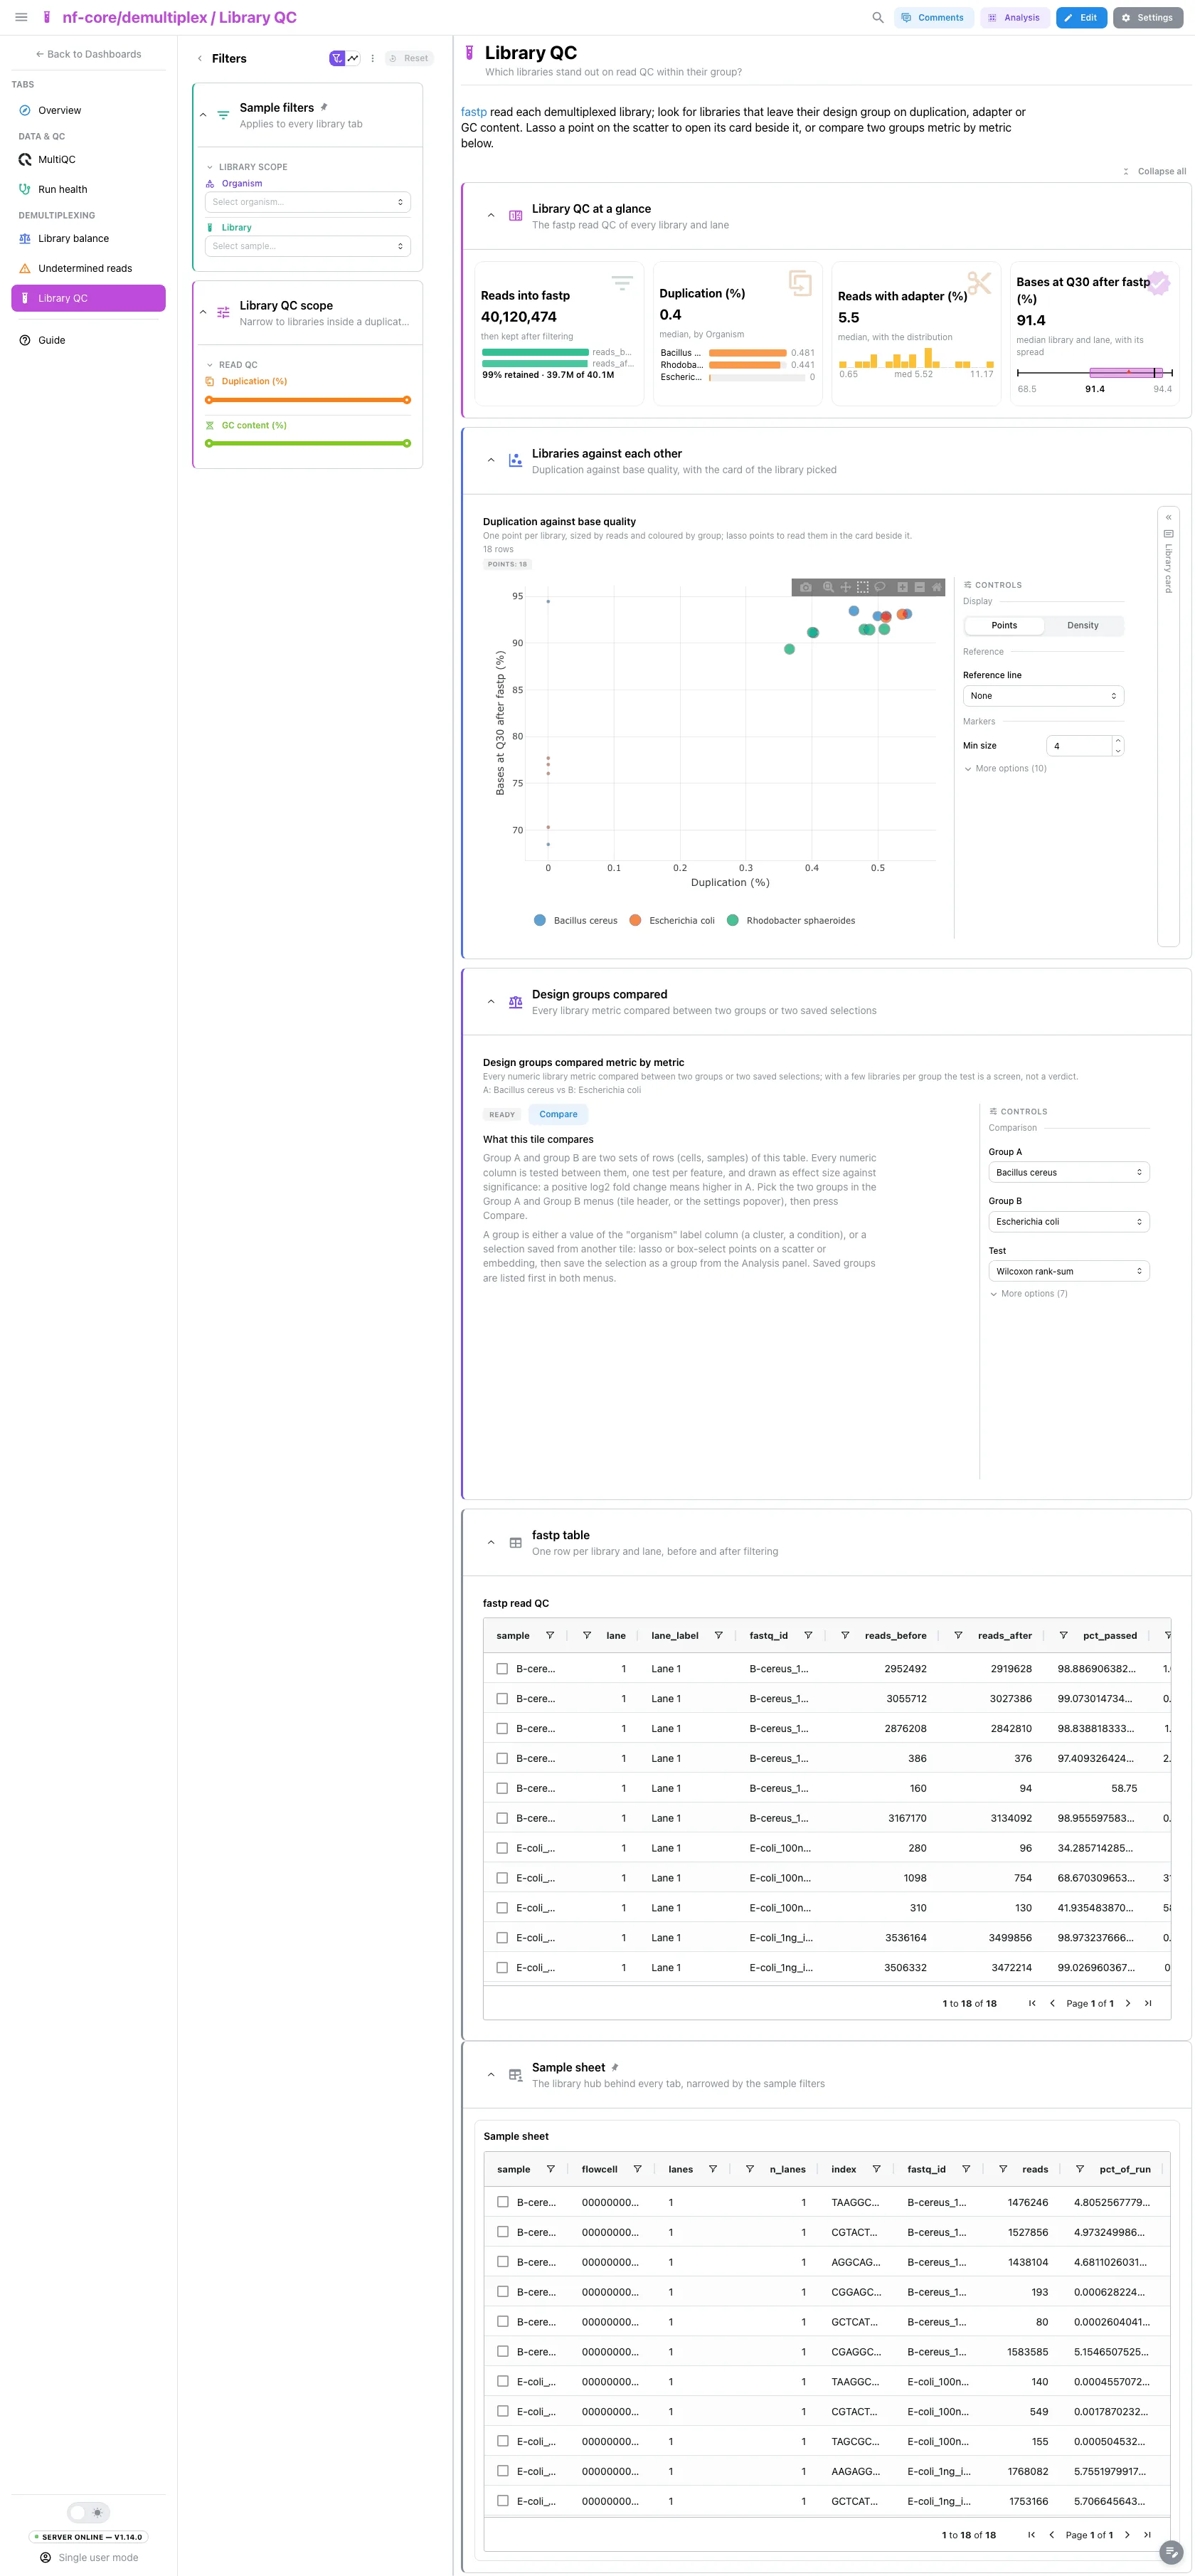
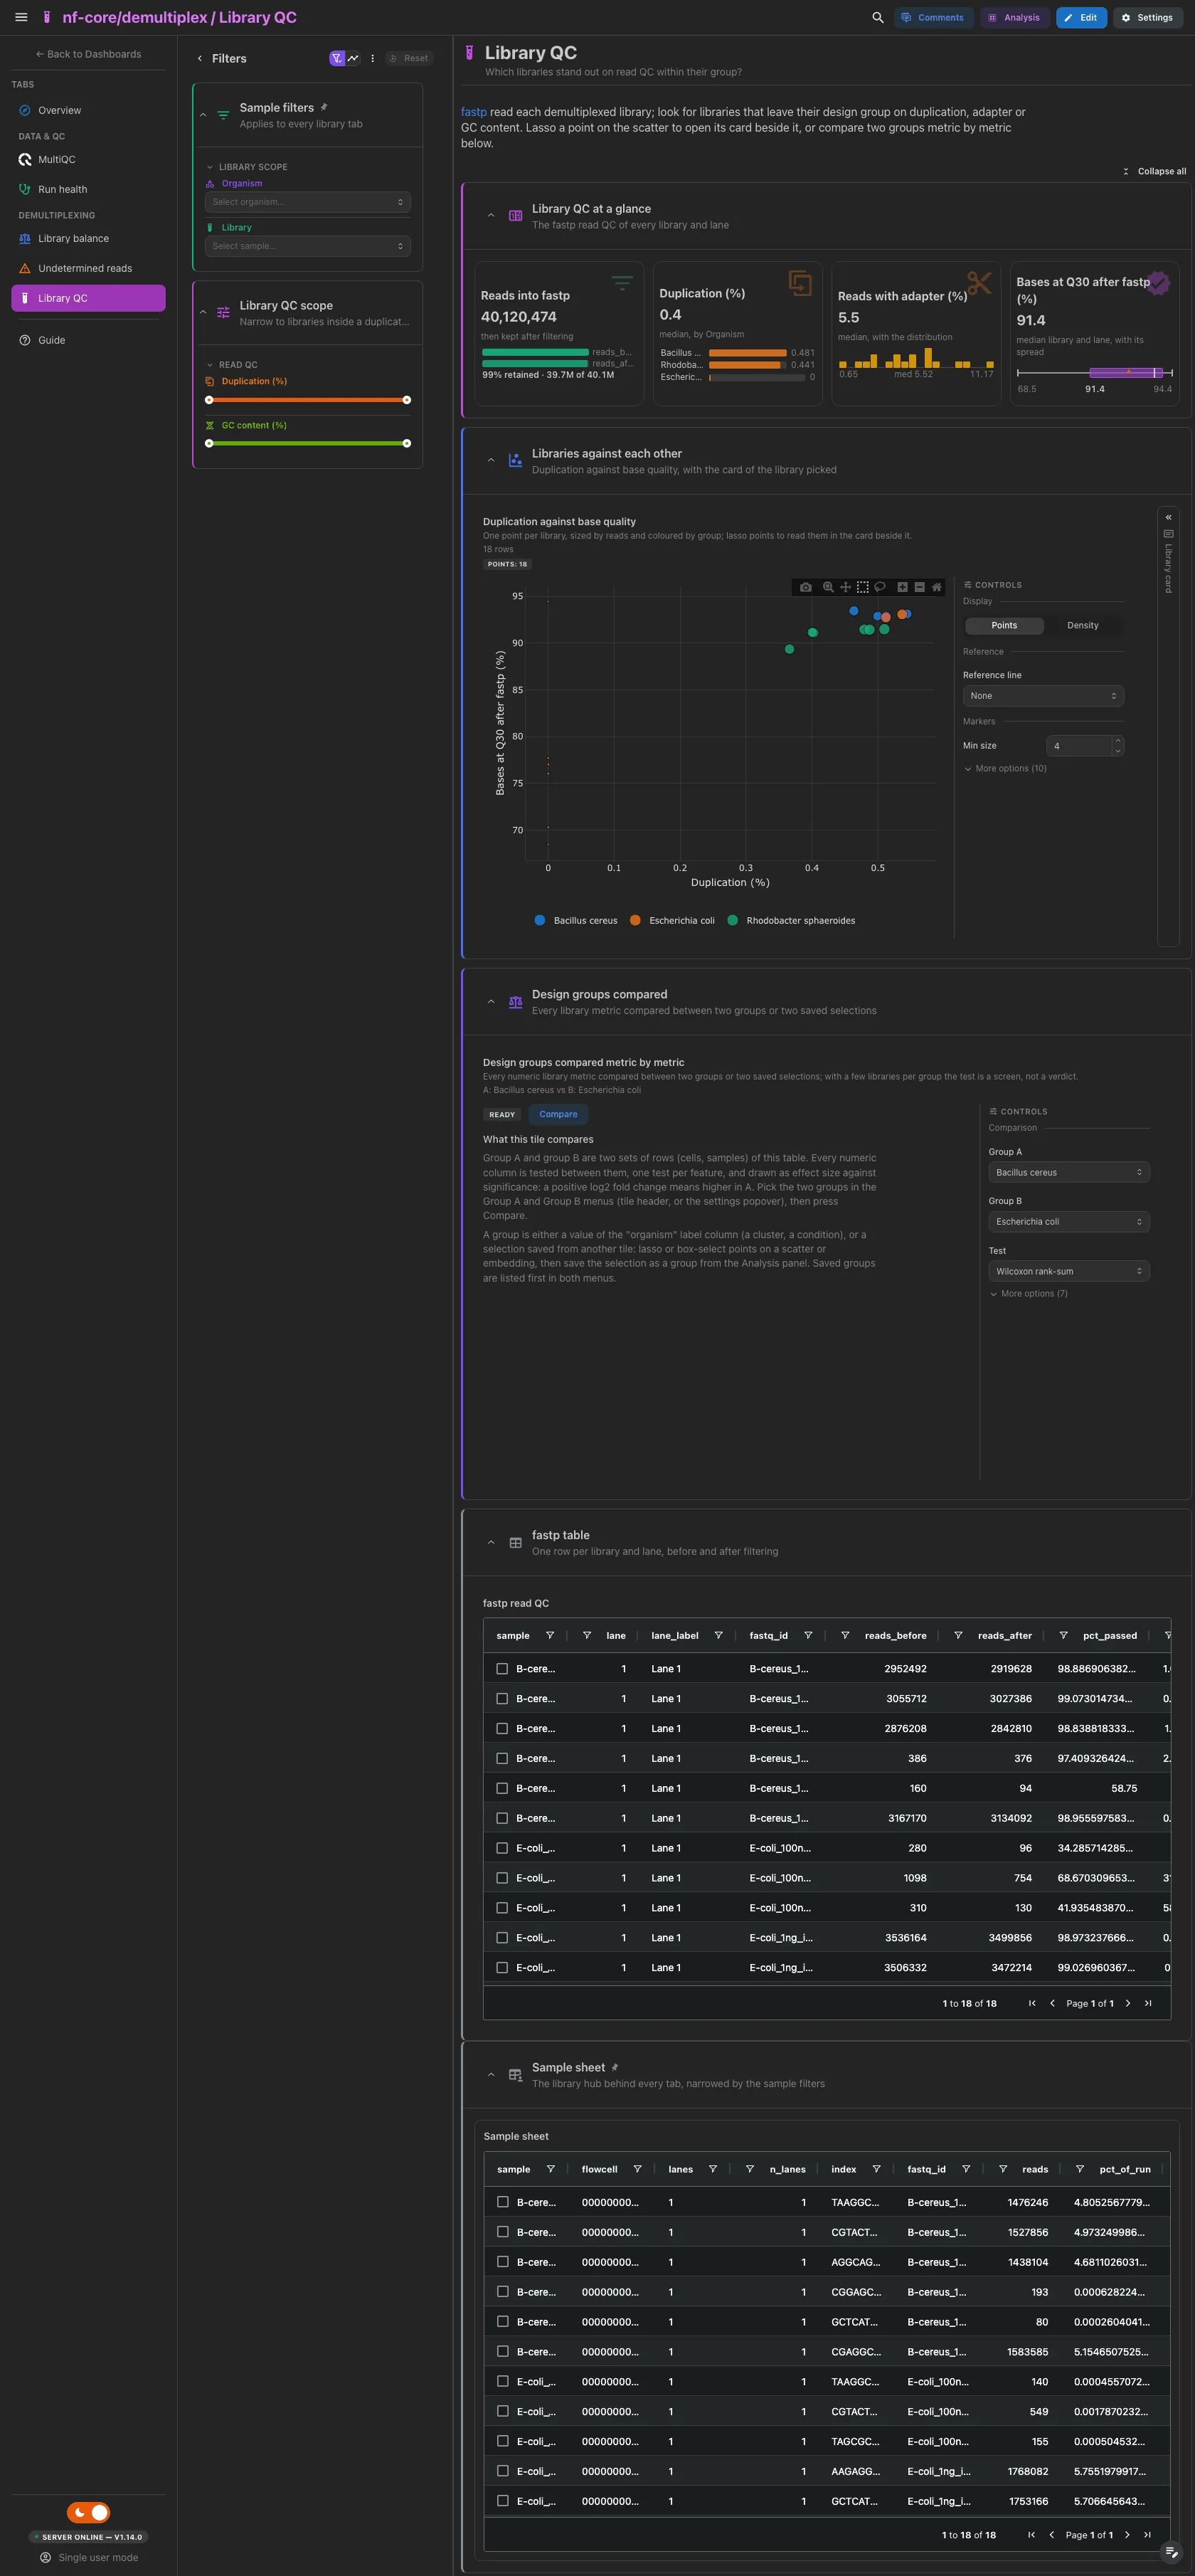
The reads fastp was given (then those it kept), the median duplication ranked by group, the median share of reads with an adapter and the median share of bases at Q30 after filtering. Then duplication against base quality, one point per library sized by reads and coloured by group, beside the library card, which stays a thin rail until a library is lassoed in the scatter or picked in the fastp table. Below, every numeric library metric compared between two groups or two saved selections: with a few libraries per group the test is a screen, not a verdict. The fastp table is collapsed.
Filters and components
Filters · Duplication (%) and GC content (%) ranges on the
libraries hub.
| Section | What it holds |
|---|---|
| Library QC at a glance | 4 cards |
| Libraries against each other | 2 advanced visualizations: the duplication against base quality scatter and the library card |
| Design groups compared | 1 advanced visualization |
| fastp table (collapsed) | fastp read QC |
One group without a metadata file
Without METADATA_FILE the hub carries a single group, "All libraries":
the group breakdowns show one bar, and the comparison has nothing to
compare until two selections are saved.
Tables and points select on their entity column: the lane table and the lane
health and phasing scatters on lane_label; the sample sheet, the per-lane
library table, the index purity and library QC scatters and the fastp table on
sample; the unknown barcode table on barcode. A pick narrows the other tiles
of its collection and follows the project links to the collections they reach.
The library card on Library QC follows the scatter beside it. The per-cycle
quality profile and the CheckQC findings table do not select: their collections
have no outgoing link. The SAV collection has no incoming link either, so the
lane filters do not narrow it.
Running the pipeline
Depictio reads the output of nf-core/demultiplex, it does not run the pipeline. Run the pipeline first:
nextflow run nf-core/demultiplex -r 1.8.0 \
  --input samplesheet.csv \
  --demultiplexer bcl2fastq \
  --outdir results -profile docker
Then point Depictio at the results, adding --var IS_BCLCONVERT=true for a
--demultiplexer bclconvert run:
See nf-co.re/demultiplex/usage for full pipeline documentation.
Required data structure
Point depictio ingest at the directory of one pipeline run. Depictio scans
recursively and matches on file name, so the flowcell and lane folder names can
differ from the tree below.
<DATA_ROOT>/
├── <flowcell>/
│   ├── L<lane>/
│   │   ├── Stats/Stats.json                   # bcl2fastq statistics (default route)
│   │   ├── Reports/                           # or BCL Convert: Demultiplex_Stats.csv, Quality_Metrics.csv,
│   │   │                                      #   Top_Unknown_Barcodes.csv (IS_BCLCONVERT)
│   │   ├── checkqc_report.json                # CheckQC verdicts (optional)
│   │   └── *.fastp.json                       # fastp read QC, one per library (optional)
│   └── *interop_summary*.csv                  # optional, from interop_summary --csv=1
├── multiqc/multiqc_data/
│   └── multiqc.parquet                        # bcl2fastq, CheckQC, fastp, Falco
└── pipeline_info/
    ├── params_*.json
    └── *software*versions*.yml
METADATA_FILE is optional and can live anywhere: a TSV whose first column is
the library name, every other column a design factor. GROUP_COL picks the one
the tiles group by, the first annotation column otherwise.
Validation runs
The template was validated against the AWS megatest of the 1.8.0 release
(results-daade37c4a75a4c1709ccf12434deb3424141319, test_full profile: one
MiSeq flowcell, one lane, paired-end dual-index, demultiplexed with bcl2fastq),
and the screenshots above come from it, with the vendored
input/library_metadata.tsv grouping the libraries by organism. That run is a
useful stress case: several libraries got almost no reads and a large share of
the lane went to Undetermined, mostly swapped combinations of indexes in use.
The BCL Convert route and the SAV section were checked on MultiQC test-data
reports only. megatest.yaml lists the tables-only subset the template needs:
bash depictio/projects/nf-core/demultiplex/1.8.0/download_test_data.sh /tmp/demultiplex_test
depictio ingest /tmp/demultiplex_test --template nf-core/demultiplex/latest \
  --var METADATA_FILE=depictio/projects/nf-core/demultiplex/1.8.0/input/library_metadata.tsv
Do not pass --project when ingesting: the dashboard is attached to the
project by name, so renaming it breaks a later depictio dashboard import.
Re-ingesting accumulates dashboards, so delete the project before repeating a run.
Additional resources
- nf-co.re/demultiplex: official pipeline documentation
- nf-co.re/demultiplex/1.8.0/results: AWS test results
- Template System Reference: YAML format, variables, conditionals
- Recipes: how to read, test, and write recipes
Authorship
 weber8thomas
Reviewing a template on your own data, or taking over a role here, is a contribution in itself: the contributing guide says what each one involves.