

The quantms template reads the DIA route of an nf-core/quantms run and follows it from the spectra to the proteins that change between conditions:
- Overview: the run in four key figures, live findings and four figures, each linked to the tab that explains it
- Acquisition: whether the runs were acquired alike, from the mzML spectrum statistics
- Identification: the precursors each run identified and their quality, from DIA-NN
- Proteins: the protein groups quantified, how completely, and how much they vary between runs
- Reproducibility: whether the runs of a condition agree and the conditions separate
- Differential abundance: the MSstats contrasts, with the volcano and the calibration of the test
The persistent Sample filters (condition, run) sit in the left panel and narrow
every tab: the links carry a pick to every run-level table by run_id and to the
per-condition tables by condition.
DIA only
quantms quantifies proteins in three modes: data-dependent acquisition with label-free quantification, isobaric labelling and data-independent acquisition (DIA). This template reads the DIA route (DIA-NN and MSstats). The other two write other tables and need their own template.
Quick start
The directory to pass is the one holding diannsummary/, msstats/,
mzmlstatistics/, sdrfparsing/ and pipeline_info/: that of one mode, which
is mode_dia/ for the nf-core megatest. The design is read from
sdrfparsing/, so no SDRF is needed; the SDRF only adds its characteristics
columns (organism, instrument and so on):
depictio ingest /path/to/quantms_results/mode_dia \
--template nf-core/quantms/latest \
--var METADATA_FILE=/path/to/sdrf.tsv
| Variable | Default | Role |
|---|---|---|
METADATA_FILE |
{DATA_ROOT}/input/sdrf.tsv |
the SDRF the run was started with (optional) |
GROUP_COL |
condition |
column the dashboard groups and filters runs by; leave it at the MSstats condition |
GROUP_COL_DISPLAY |
Condition |
reader-facing label of GROUP_COL in filters and cards |
depictio config nextflow --install     # once per machine
nextflow run nf-core/quantms -r 1.1.1 -profile docker --outdir results
No depictio ingest, and no template named: the pipeline ingests its own
output directory when it finishes and resolves this template from its own
manifest. See Nextflow trigger.
Reference
The template reads the design quantms parsed from the SDRF, the mzML spectrum
statistics, the DIA-NN precursor report and protein-group matrix, and the MSstats
comparisons. Derived collections (the run summary, the protein summary, the
per-condition statistics, the run projection and the replicate pairs) are recipes
over those tables. There is no MultiQC tab: quantms 1.1.1 reports through pmultiqc
custom content, which has no multiqc.parquet, so the plots of that report are
rebuilt from the result tables.
A call is an Up or Down protein at an adjusted p-value below 0.05 and an absolute log2 fold change of at least one, the dashboard's cut-offs (MSstats reports the adjusted p-value only). The coefficient of variation is taken over the runs of a condition that quantified the group, and needs at least two. The DIA-NN version of this release reports no mass error, so Identification has no mass-accuracy view.
Self-adapting layout
The dashboard adapts to whatever the run actually produced: components bound to pruned or unparsed data collections are hidden, tabs left with no real visualizations are dropped entirely, and the remaining components are re-packed so there are no empty rows. With one condition there is no contrast, and Differential abundance shows empty panels.
Template variables
Variables you provide when running the template: DATA_ROOT is the results directory given to depictio ingest, the others are set with --var NAME=value:
| Variable | Required | Description |
|---|---|---|
DATA_ROOT |
✓ | quantms output directory of one mode (the folder holding diannsummary/, msstats/, mzmlstatistics/, sdrfparsing/ and pipeline_info/). For the megatest this is the mode_dia/ folder. |
METADATA_FILE |
— | The SDRF the run was started with (--input). Optional: the design is already in sdrfparsing/, the SDRF adds its characteristics columns. Defaults to input/sdrf.tsv under DATA_ROOT. |
METADATA_ID_COL |
— | Hub id column. The quantms hub is keyed on run_id, the raw file name without its extension; this only records that value. |
GROUP_COL |
— | Hub column the dashboard groups and filters runs by. Defaults to condition, the MSstats condition of the design. |
GROUP_COL_DISPLAY |
— | Reader-facing label of GROUP_COL, used in filter and card titles. |
Data collections
13 data collections — 13 required 0 optional · 1 direct 12 derived.
Origin tells you whether a collection is real pipeline data or a reshape of it: direct = a pipeline output (scanned, or a recipe that reads raw files); derived = a recipe that reshapes one or more direct collections into the layout a visualization needs (no new measurement). Reads shows what produces it: a recipe .py transform, or a raw file scanned off disk. (A direct collection can still have a recipe — one that merely parses/cleans the raw file; derived means the recipe reshapes another collection.)
| Tag | Origin | Type | Reads | Status |
|---|---|---|---|---|
samples |
direct | Table | recipe |
required |
quantms_precursors |
derived | Table | recipe |
required |
quantms_proteins |
derived | Table | recipe |
required |
quantms_acquisition |
derived | Table | recipe |
required |
quantms_acquisition_profile |
derived | Table | recipe |
required |
quantms_ms2_peak_bins |
derived | Table | recipe |
required |
quantms_run_summary |
derived | Table | recipe |
required |
quantms_protein_summary |
derived | Table | recipe |
required |
quantms_protein_conditions |
derived | Table | recipe |
required |
quantms_sample_embedding |
derived | Table | recipe |
required |
quantms_sample_correlation |
derived | Table | recipe |
required |
quantms_replicate_pairs |
derived | Table | recipe |
required |
quantms_comparisons |
derived | Table | recipe |
required |
Cross-DC links
11 links — selecting a value in the source collection filters the target. The join column is shown after the source.
| Source · column | Target | Filters | |
|---|---|---|---|
samples · run_id |
→ | quantms_run_summary |
Filter the run summary by design runs |
samples · run_id |
→ | quantms_acquisition |
Filter the acquisition summary by design runs |
samples · run_id |
→ | quantms_acquisition_profile |
Filter the acquisition profile by design runs |
samples · run_id |
→ | quantms_ms2_peak_bins |
Filter the MS2 peak bins by design runs |
samples · run_id |
→ | quantms_precursors |
Filter the precursors by design runs |
samples · run_id |
→ | quantms_proteins |
Filter the protein quantities by design runs |
samples · run_id |
→ | quantms_sample_embedding |
Filter the sample embedding by design runs |
samples · run_id |
→ | quantms_sample_correlation |
Filter the sample correlation by design runs |
samples · {GROUP_COL} |
→ | quantms_protein_conditions |
Filter the protein conditions by design conditions |
samples · {GROUP_COL} |
→ | quantms_replicate_pairs |
Filter the replicate pairs by design conditions |
quantms_comparisons · protein_group |
→ | quantms_protein_summary |
Carry a protein selection from the comparisons to the protein summary |
Recipes
Each recipe reshapes raw pipeline output into a tidy table. The name links to its source; Output lists the validated OUTPUT_SCHEMA columns.
| Recipe | Transforms | Output |
|---|---|---|
nf-core/quantms/acquisition.py |
Spectra acquired per run: one row per mzML file. | run_id, ms1_spectra, ms2_spectra, ms2_per_ms1, median_ms2_peaks, median_base_peak_intensity, rt_start_min, rt_end_min, gradient_min, ms2_per_min |
nf-core/quantms/acquisition_profile.py |
Acquisition over the gradient: one row per run and minute of retention time. | run_id, rt_min, ms1_spectra, ms2_spectra, median_base_peak_intensity |
nf-core/quantms/comparisons.py |
MSstats group comparisons: one row per protein and contrast. | protein, protein_group, genes, contrast, condition_a, condition_b, log2fc, abs_log2fc, se, t_value, df, p_value, adj_p_value, missing_pct, imputed_pct, issue, mean_a, mean_b, avg_log2_intensity, direction |
nf-core/quantms/ms2_peak_bins.py |
How many peaks an MS2 spectrum holds, per run: one row per run and peak-count bin. | run_id, peaks, bin_start, spectra, fraction |
nf-core/quantms/precursors.py |
Identified precursors of a DIA-NN run: one row per precursor and run. | run_id, protein_group, protein_name, genes, peptide, peptidoform, charge, charge_state, length, missed_cleavages, n_variable_mods, modification_state, specificity, q_value, pg_q_value, cscore, evidence, spectrum_similarity, ms1_profile_corr, rt_min, predicted_rt_min, rt_error_min, peak_width_min, quantity_quality, log10_quantity |
nf-core/quantms/protein_conditions.py |
One row per protein group and condition: abundance and its spread over the condition's runs. | protein_group, protein_name, genes, runs, mean_log2_intensity, sd_log2_intensity, cv_pct |
nf-core/quantms/protein_summary.py |
One row per protein group: how many runs detected it, how strongly and with how many peptides. | protein_group, protein_name, genes, description, peptides, peptide_support, runs_detected, runs_total, detected_pct, detection, mean_log2_intensity, cv_pct, abundance_rank |
nf-core/quantms/proteins.py |
Protein-group quantities of a DIA-NN run: one row per protein group and run. | run_id, protein_group, protein_name, genes, description, intensity, log2_intensity, peptides, precursors |
nf-core/quantms/replicate_pairs.py |
Protein-group intensities in two runs of the same condition, for every pair of runs. | protein_group, protein_name, genes, pair, run_x, run_y, log2_x, log2_y |
nf-core/quantms/run_summary.py |
One row per run: what was identified and how clean the identifications are. | run_id, precursors, peptides, protein_groups, ms2_spectra, precursors_per_1000_ms2, modified_pct, missed_cleavage_pct, median_abs_rt_error_min, median_peak_width_min, median_log10_quantity, run_label |
nf-core/quantms/sample_correlation.py |
Run-to-run Pearson correlation of the protein-group intensities. | run_id |
nf-core/quantms/sample_embedding.py |
Principal components of the runs, from the protein-group intensities. | run_id, dim_1, dim_2, explained_1, explained_2, proteins_used |
nf-core/quantms/samples.py |
Run hub for nf-core/quantms: one row per MS raw file, from the experimental design. | run_id, sample, condition, condition_raw, replicate, run_label, bio_replicate, fraction, acquisition, label, enzyme, precursor_tolerance, fragment_tolerance, dissociation, fixed_mods, variable_mods |
Dashboard tabs
One dashboard: the Overview, then five child tabs in two groups, read as a funnel from the spectra to the proteins that change. Each tab below carries the same icon and colour the dashboard gives it, so the page and the app read alike.
| Group | Tabs |
|---|---|
| Data & QC | Acquisition, Identification |
| Quantification | Proteins, Reproducibility, Differential abundance |
Each child tab opens with a short intro and a strip of four cards, then at most three open sections; tables and record cards follow, collapsed. The Sample sheet and the Reference tables (the per-run summary) are pinned, collapsed, to the bottom of every child tab.
Label-free DIA proteomics, from the spectra to the proteins that change.
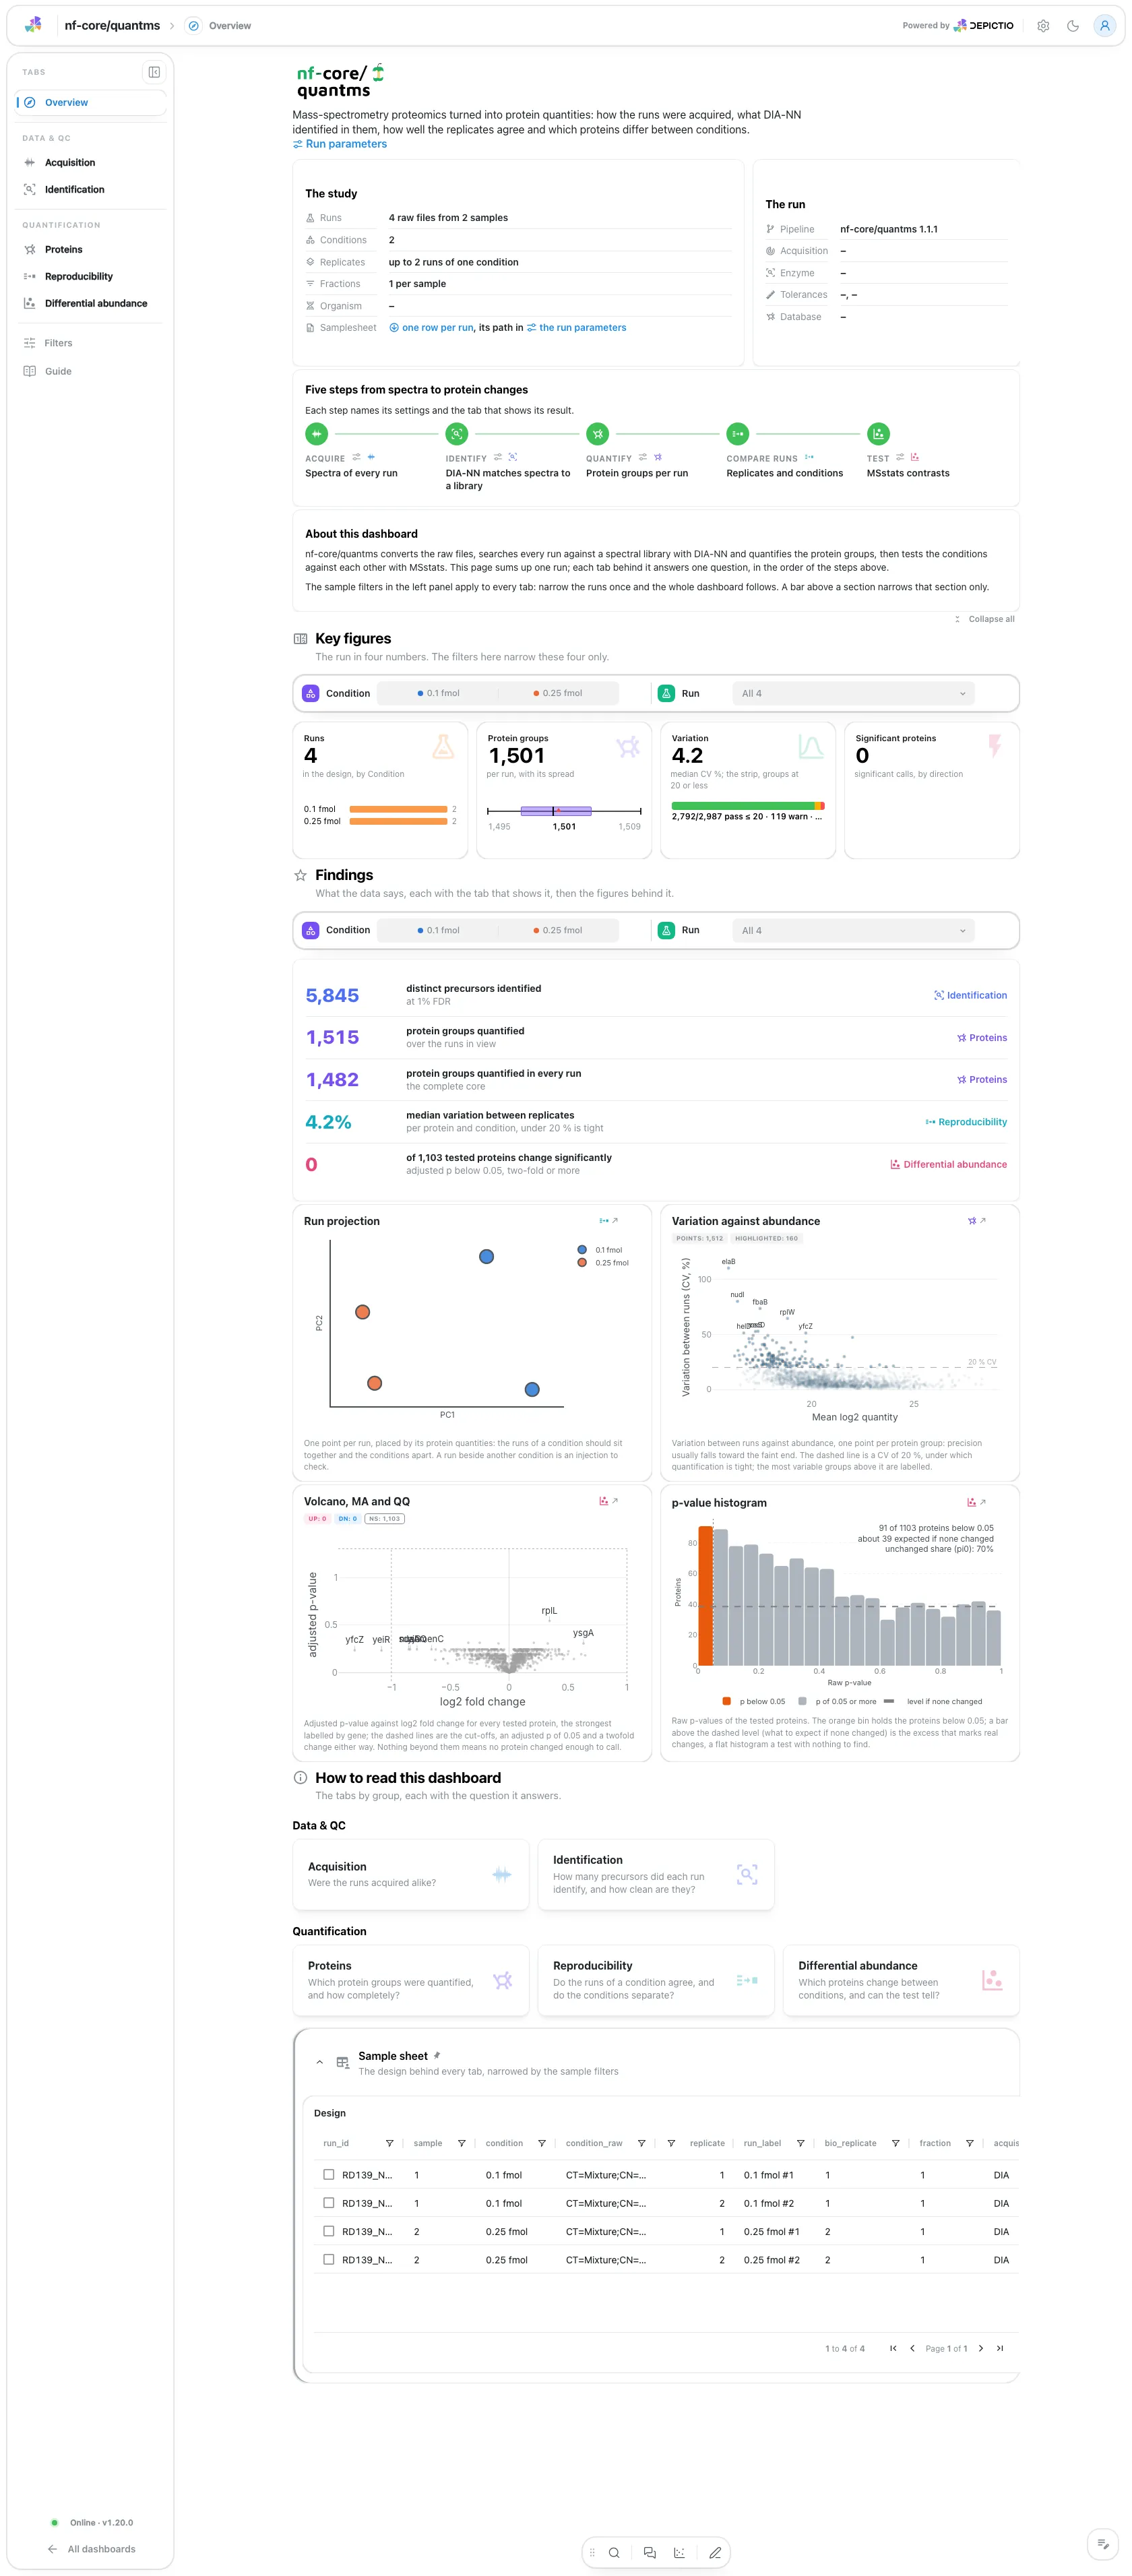
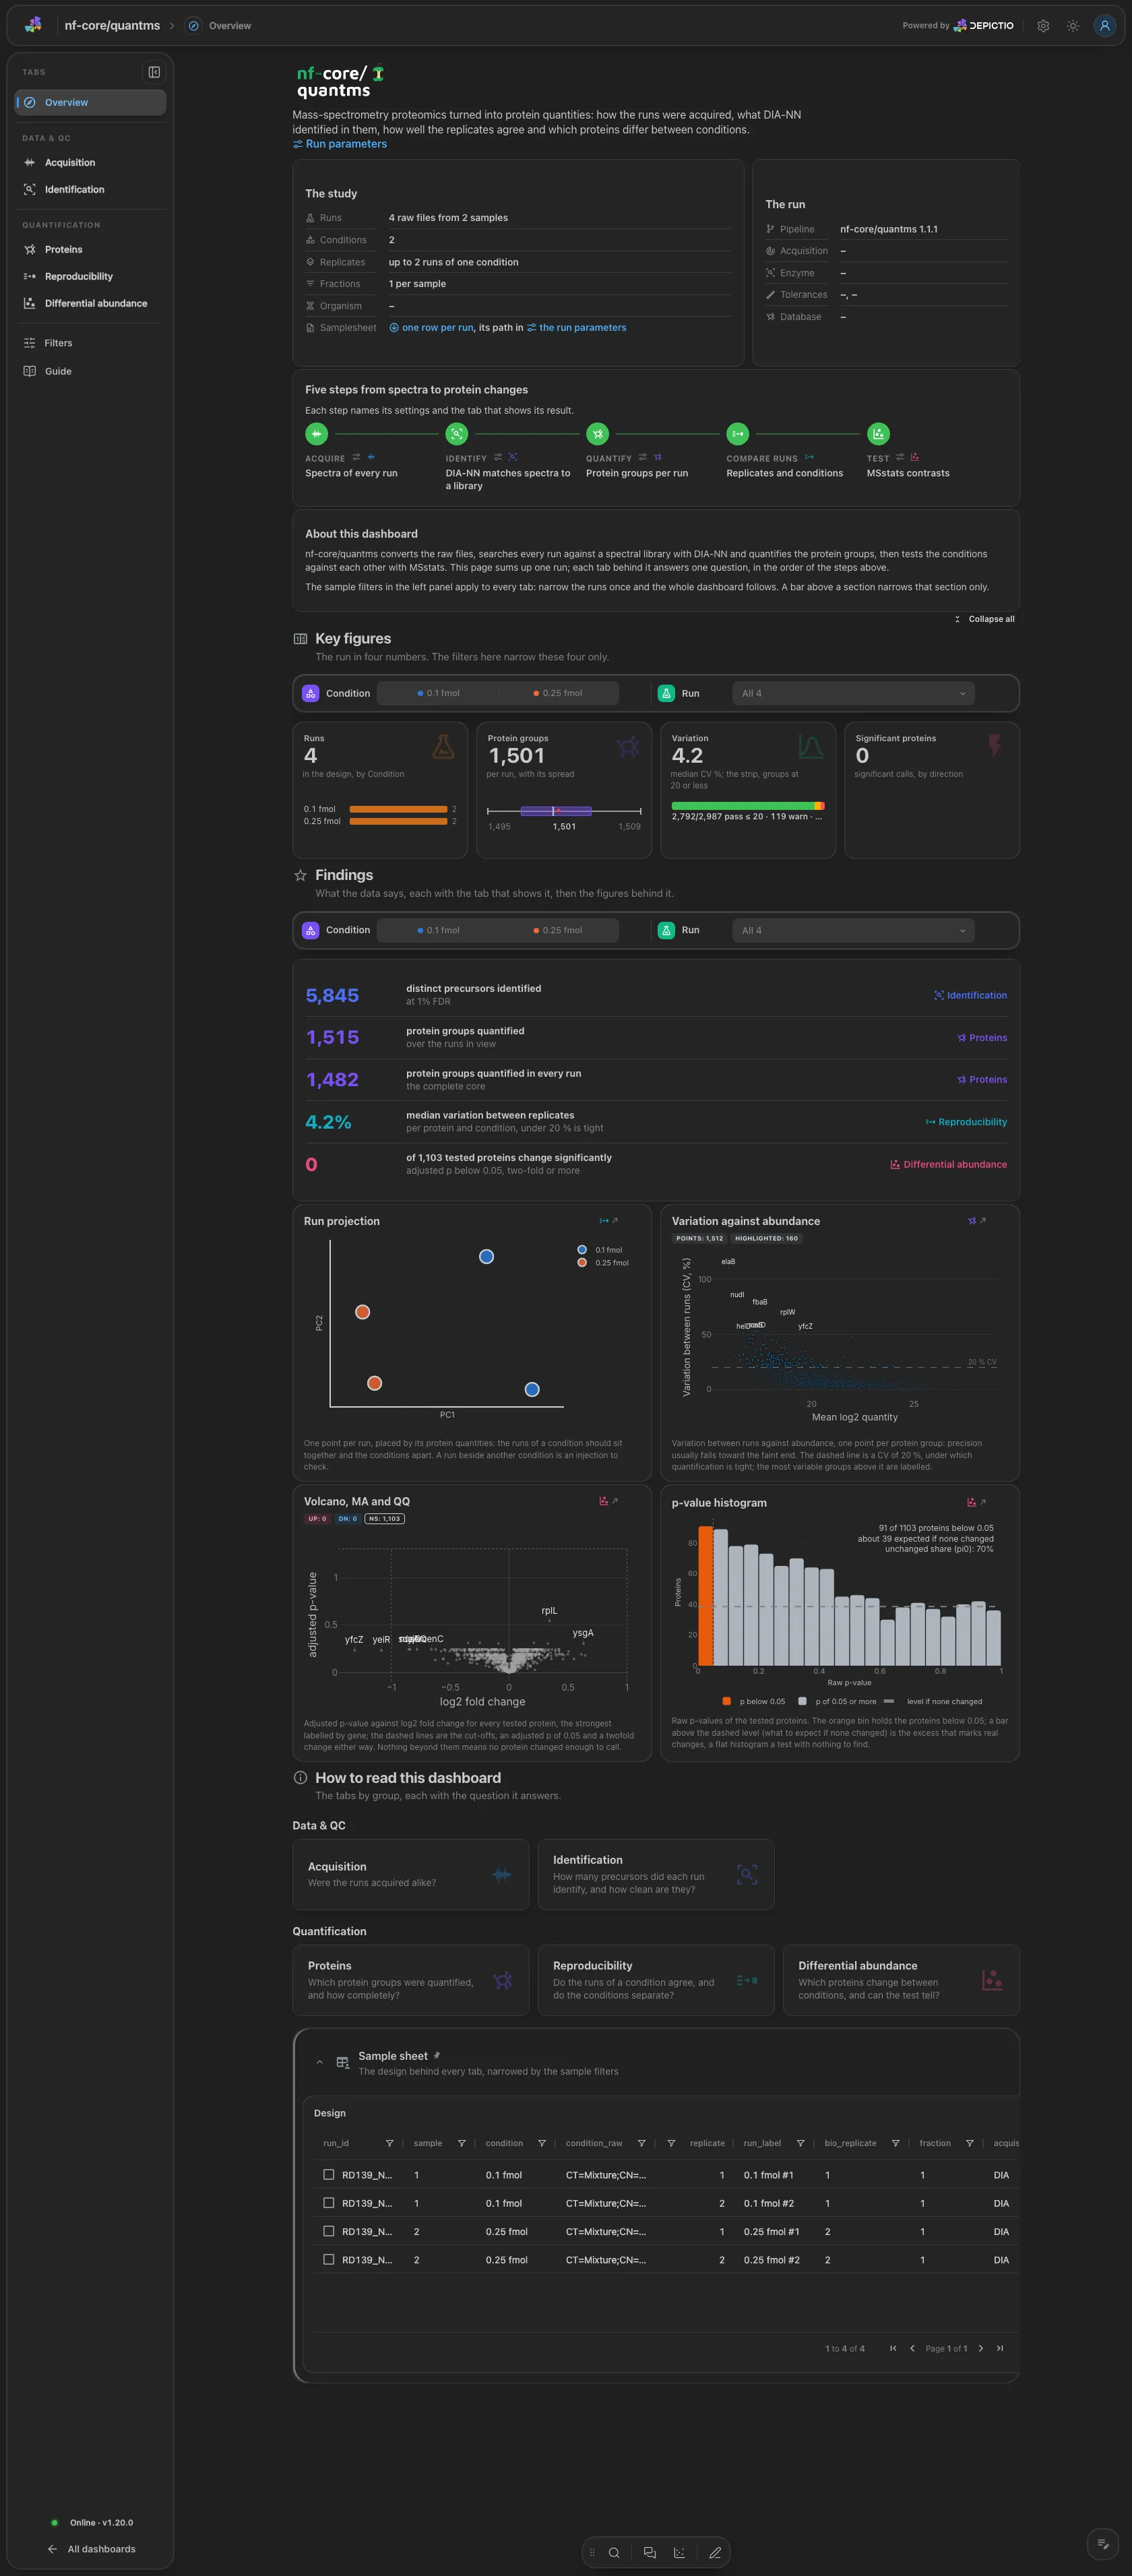
Hero, About and run cards (runs, conditions, acquisition method, enzyme, tolerances, search database) and a five-step Pipeline (acquire, identify, quantify, compare runs, test). Four key figures: the runs, the protein groups per run, the median variation between replicates (a threshold at 20 %) and the significant proteins. The findings follow the filters, then the run projection, the variation against abundance, the volcano and the p-value histogram.
Data & QC · Were the runs acquired alike?
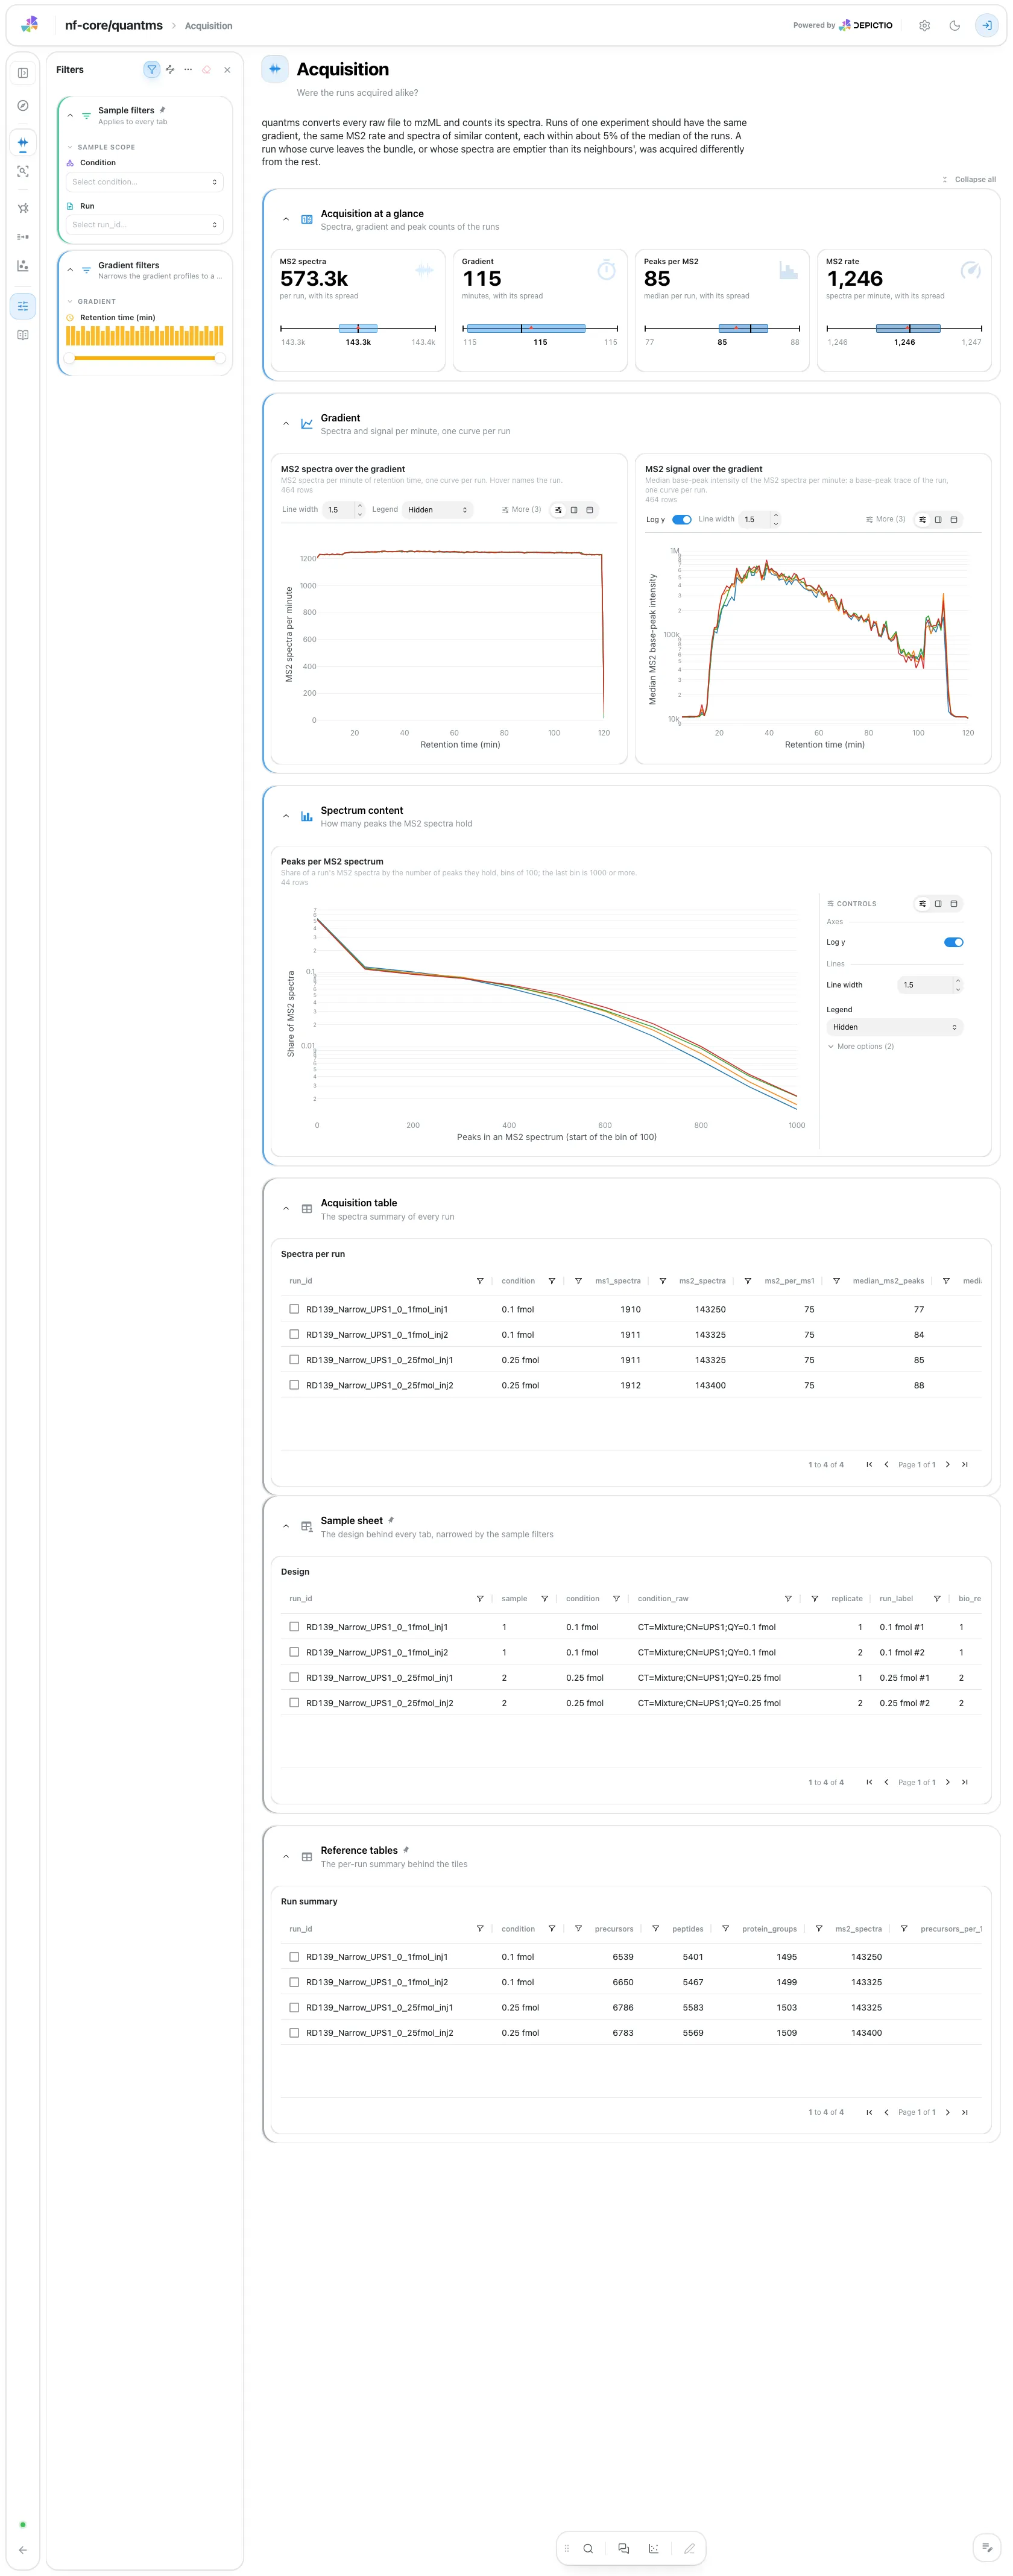
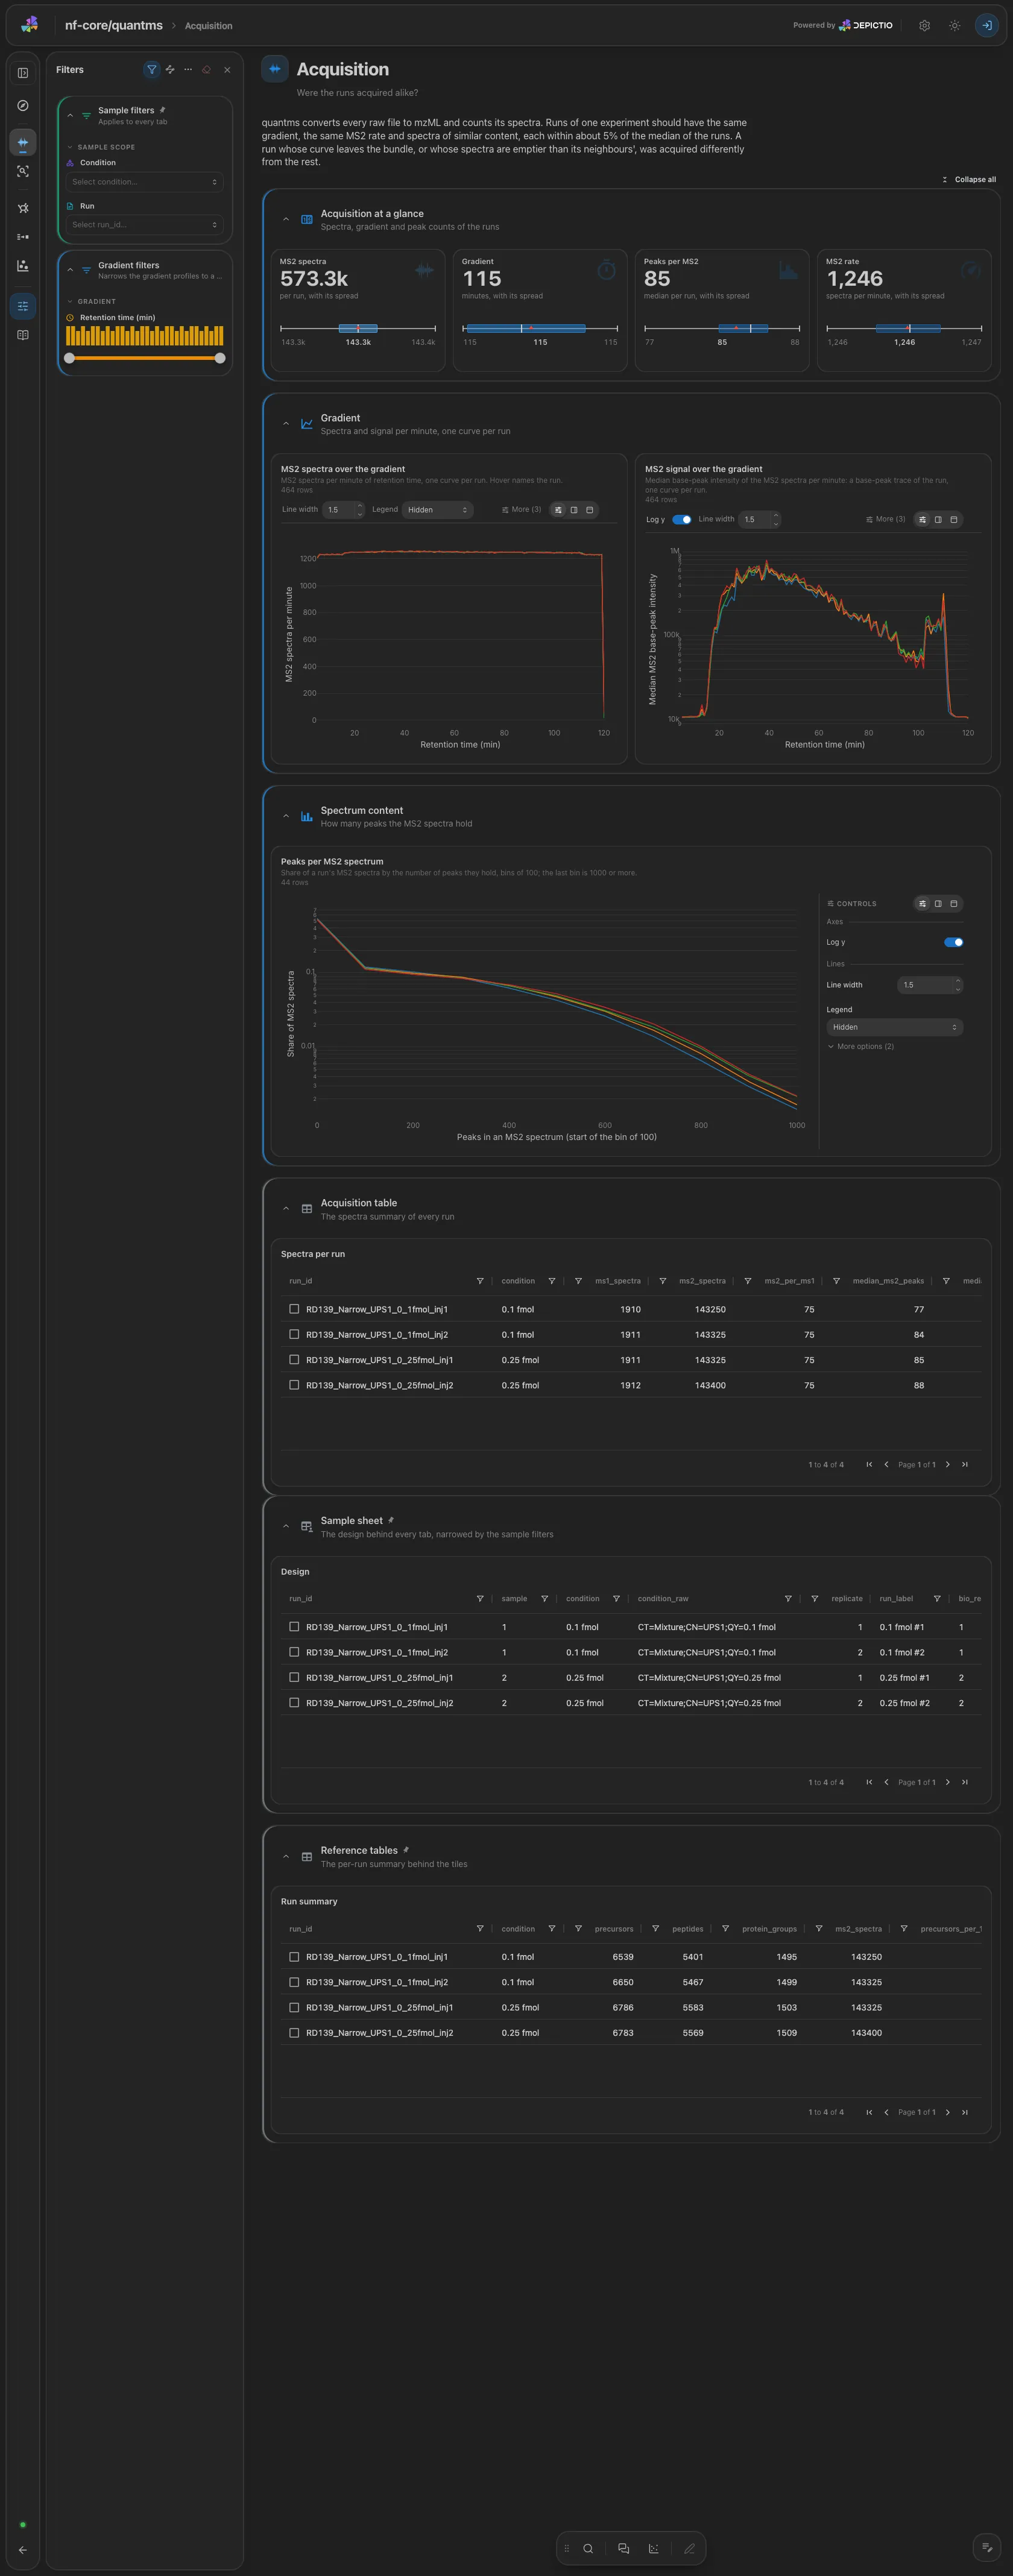
The MS2 spectra per minute and the median MS2 base-peak intensity per minute, one curve per run, and the share of MS2 spectra by the number of peaks they hold. Runs of one experiment are expected within about 5 % of the median on the gradient and the MS2 rate. The spectra summary is collapsed. Filter: a retention-time window.
Data & QC · How many precursors did each run identify, and how clean are they?
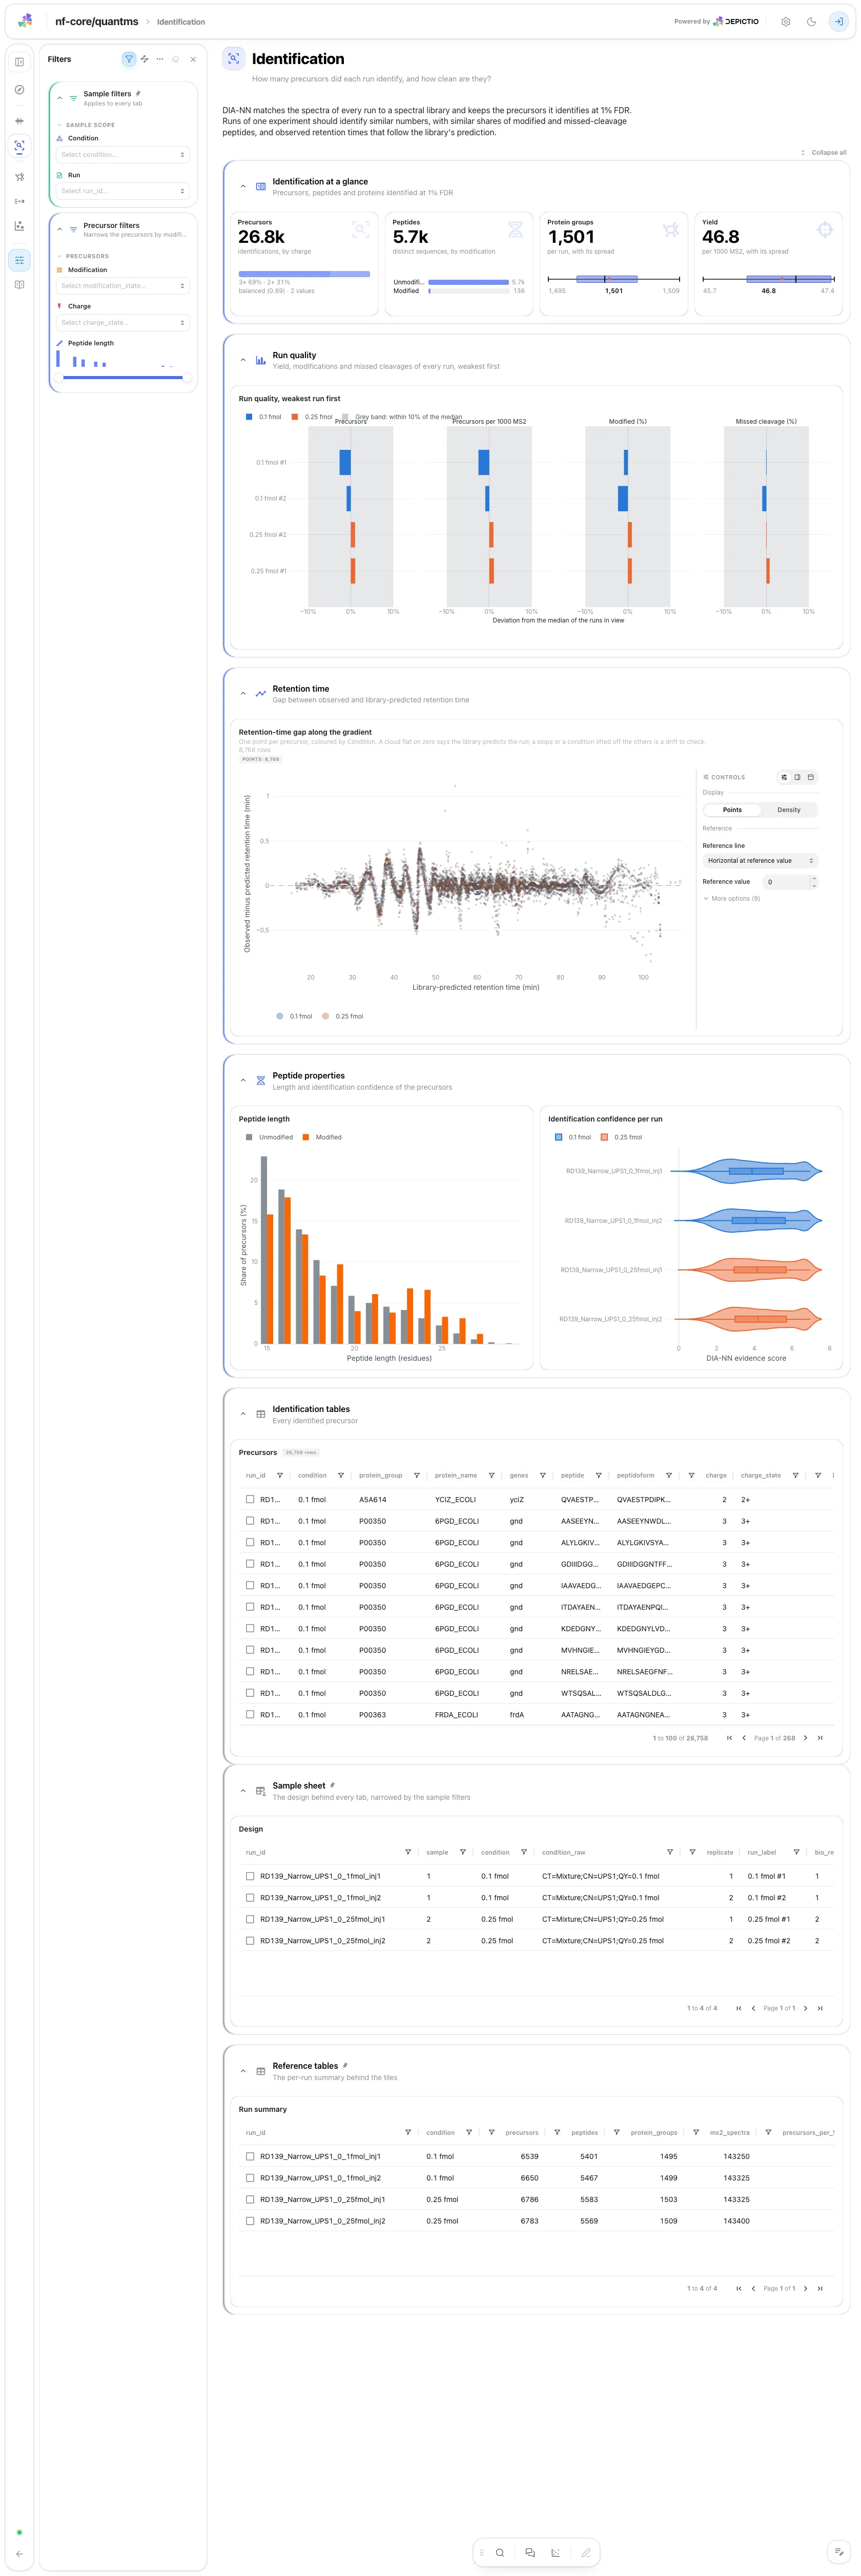
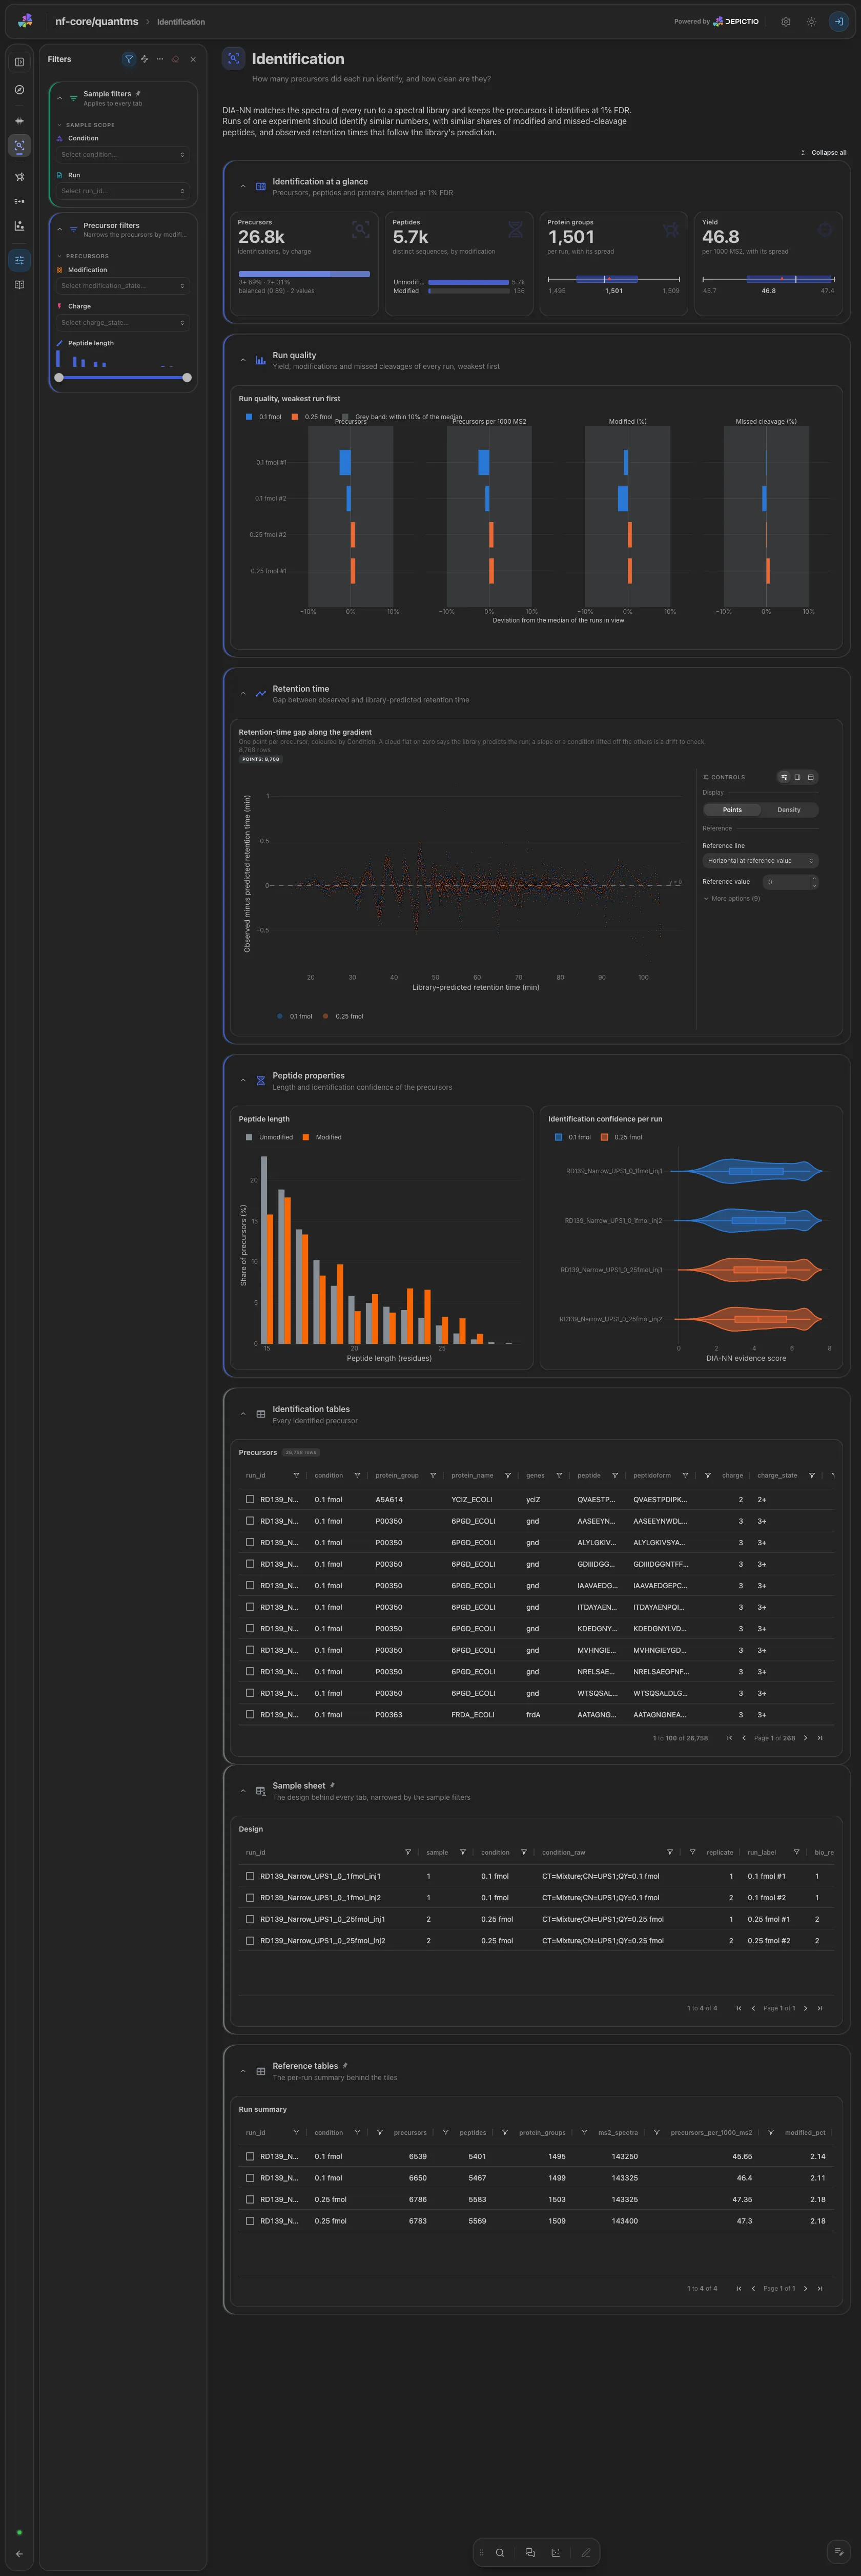
One per-run quality view, the weakest run on top: the deviation from the median of the precursors, the yield per thousand MS2 spectra, the modified share and the missed-cleavage share, coloured by condition. Then the gap between observed and predicted retention time along the gradient, and the peptide length and DIA-NN evidence score per run. The precursor table is collapsed. Filters: modification, charge and peptide length.
Quantification · Which protein groups were quantified, and how completely?
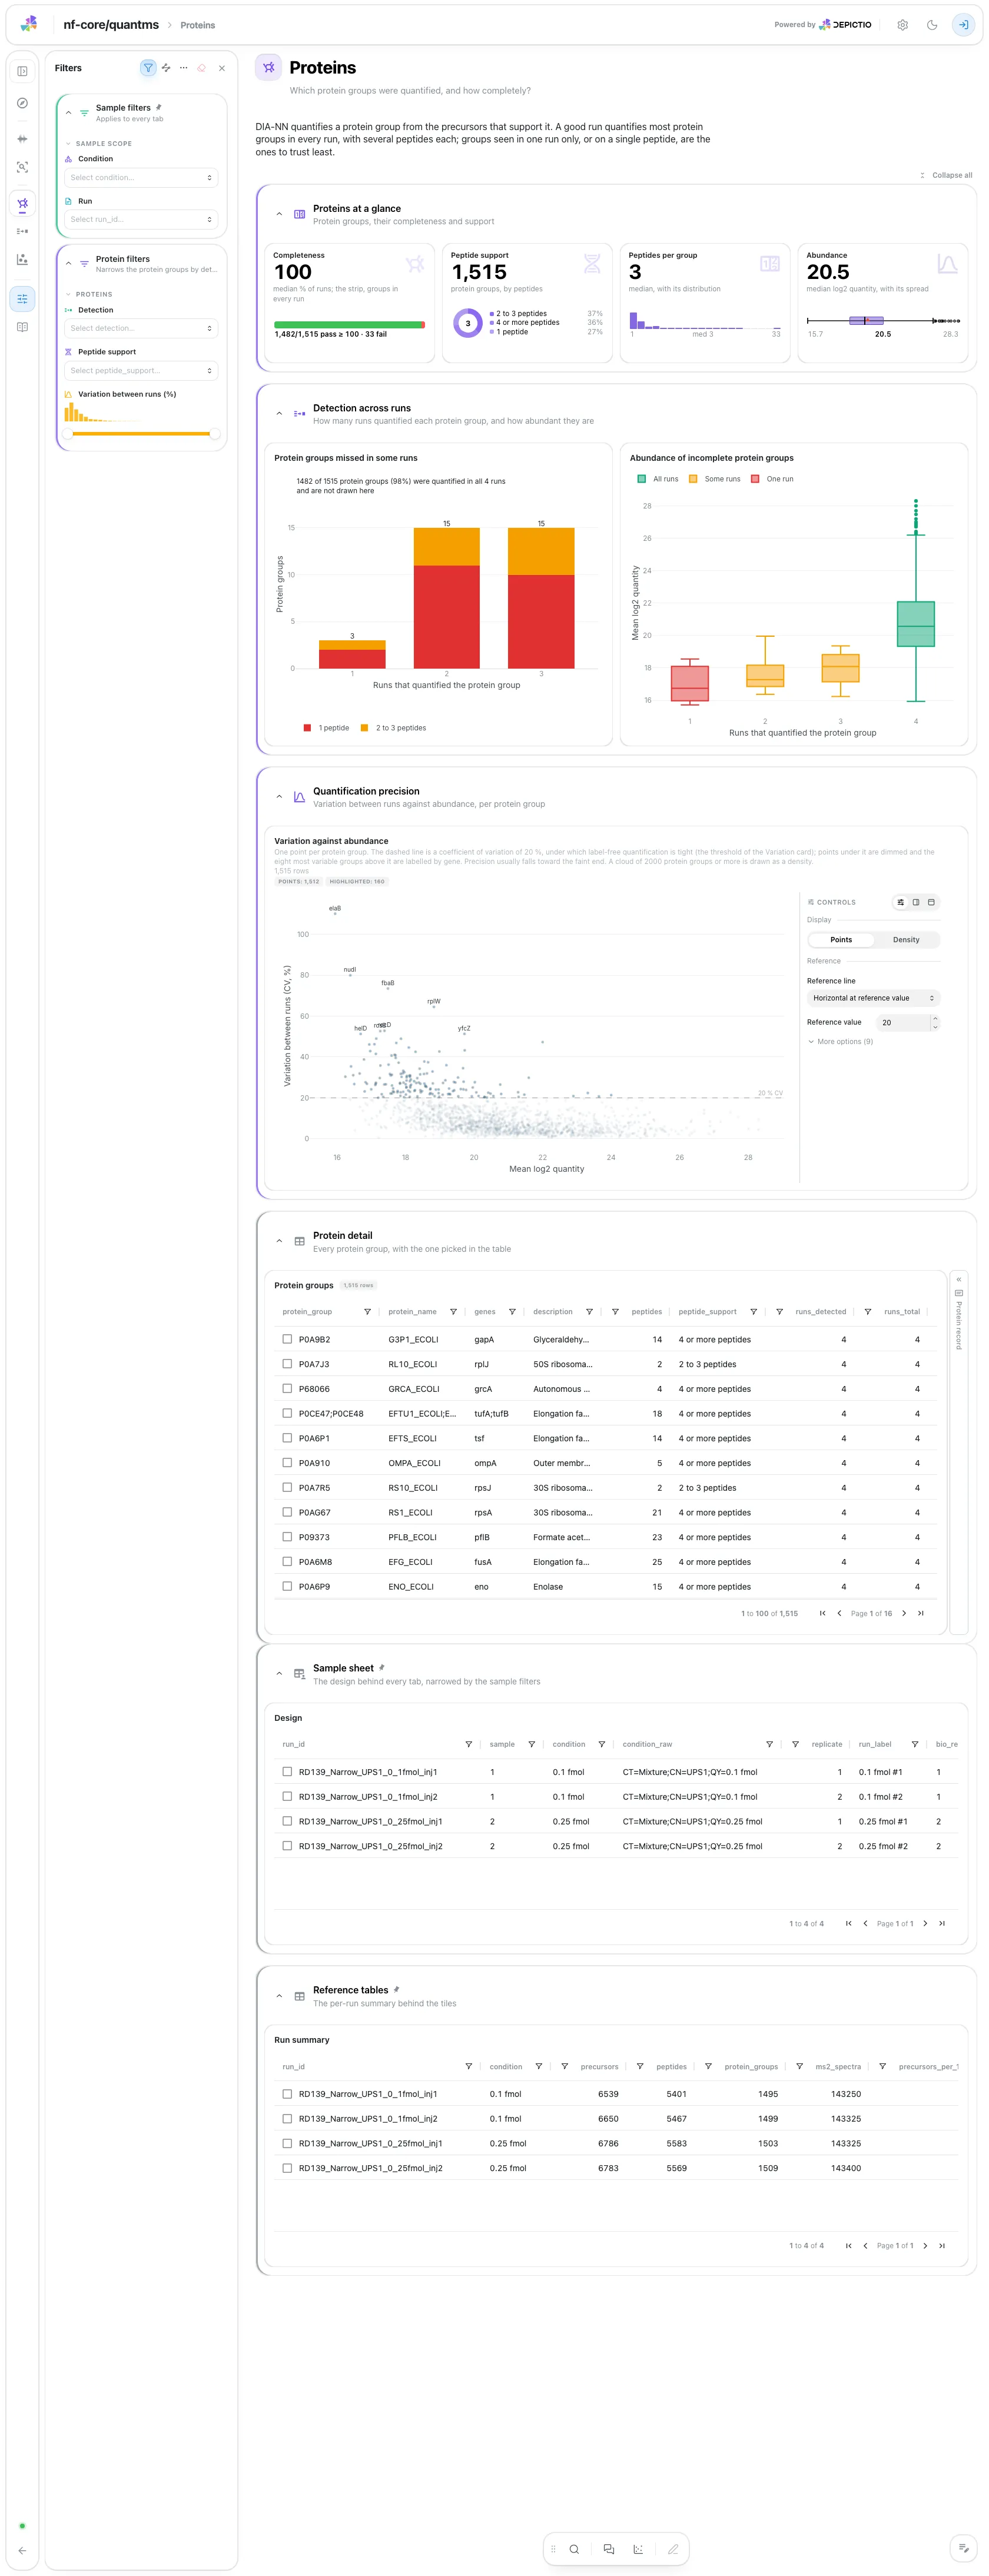
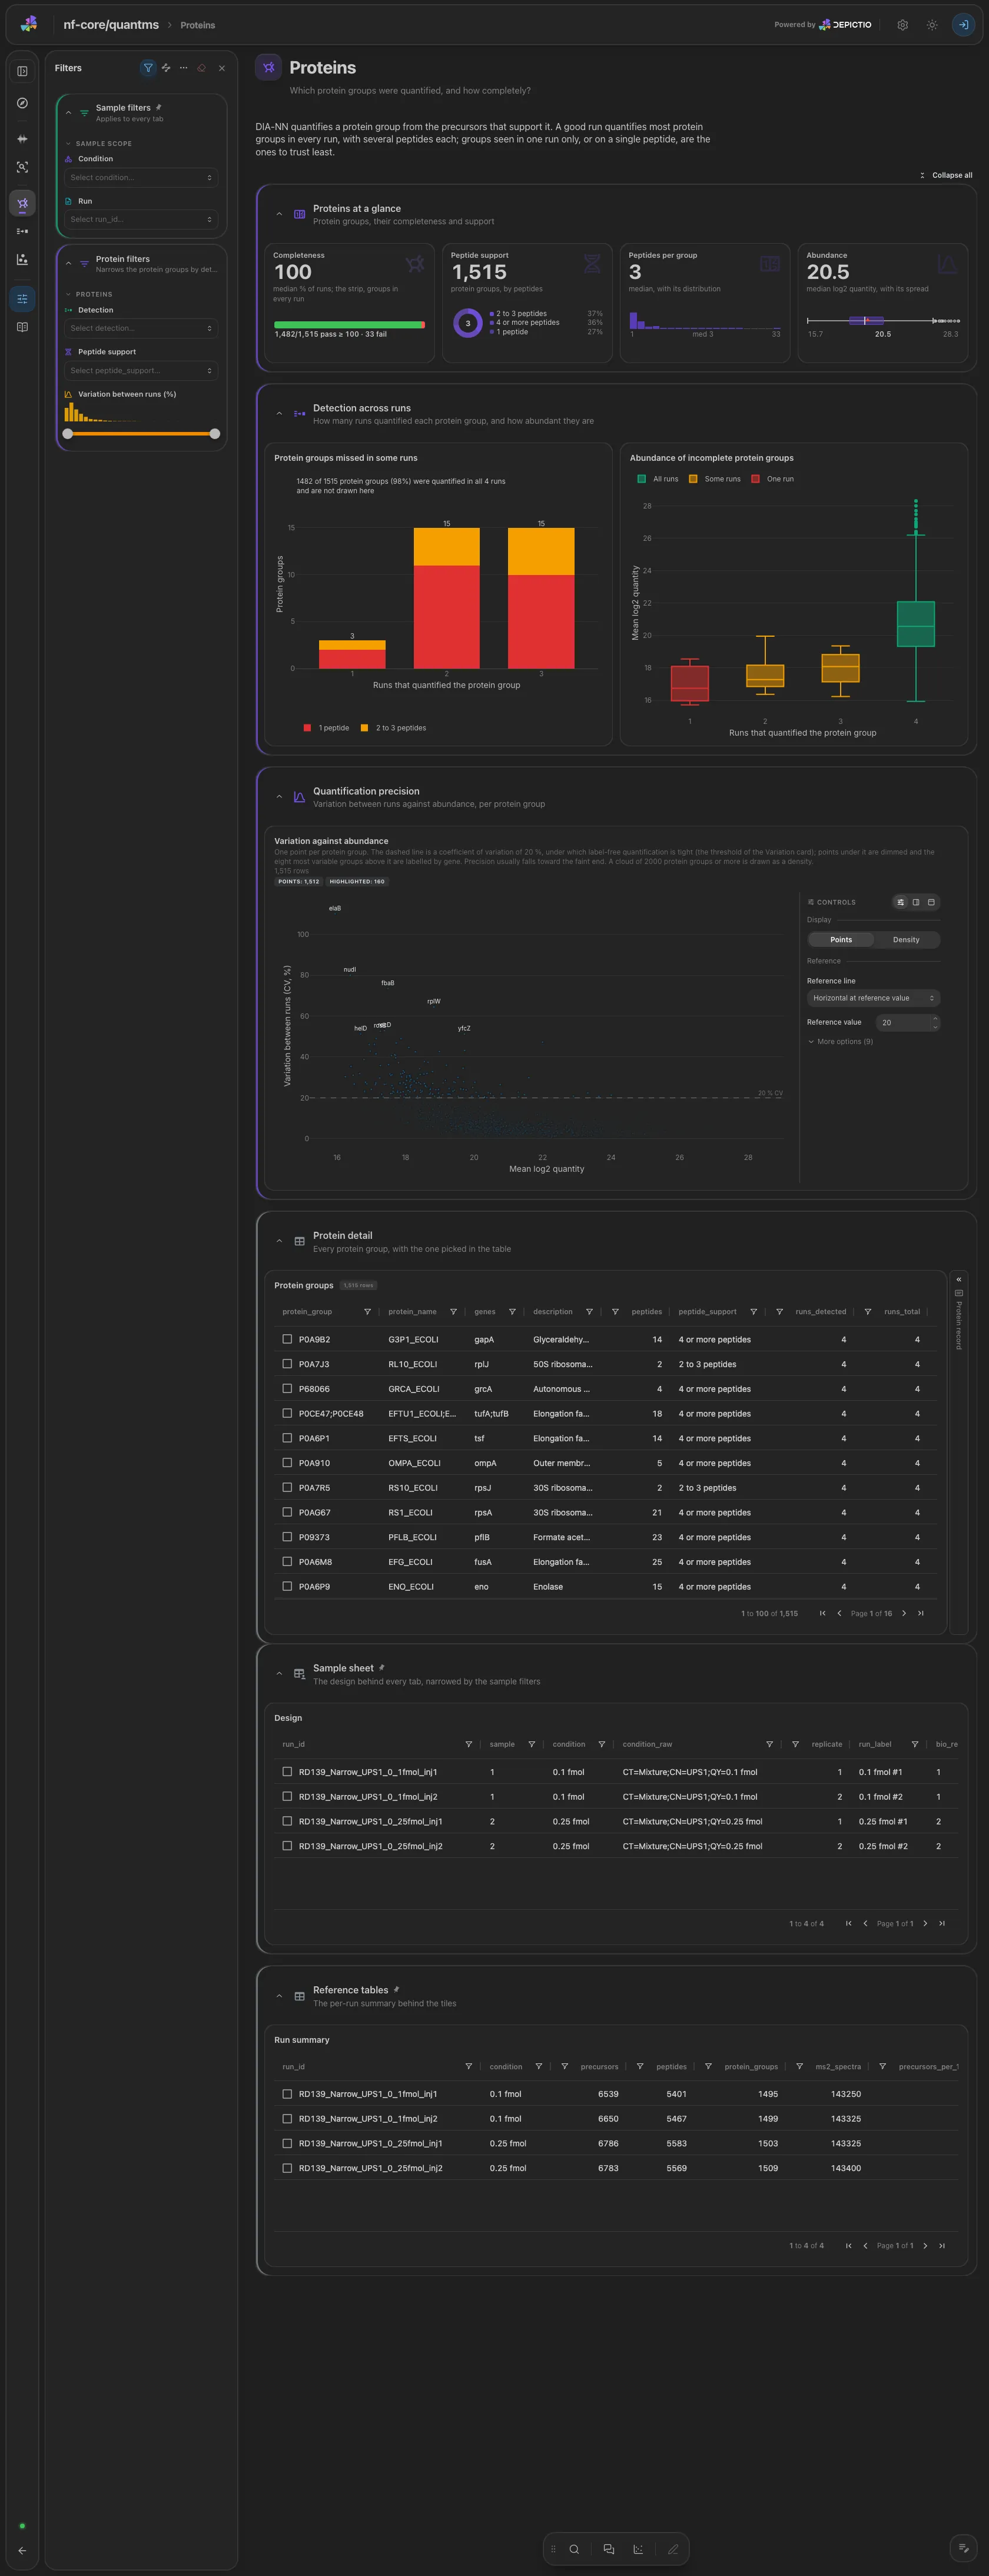
The variation between runs against abundance for every group, with a dashed line at a coefficient of variation of 20 % and the most variable groups labelled by gene. The groups missed in some runs, by how many runs quantified them, and the protein-group table with a record card that links the UniProt entry are collapsed. Filters: detection, peptide support and a variation range.
Quantification · Do the runs of a condition agree, and do the conditions separate?
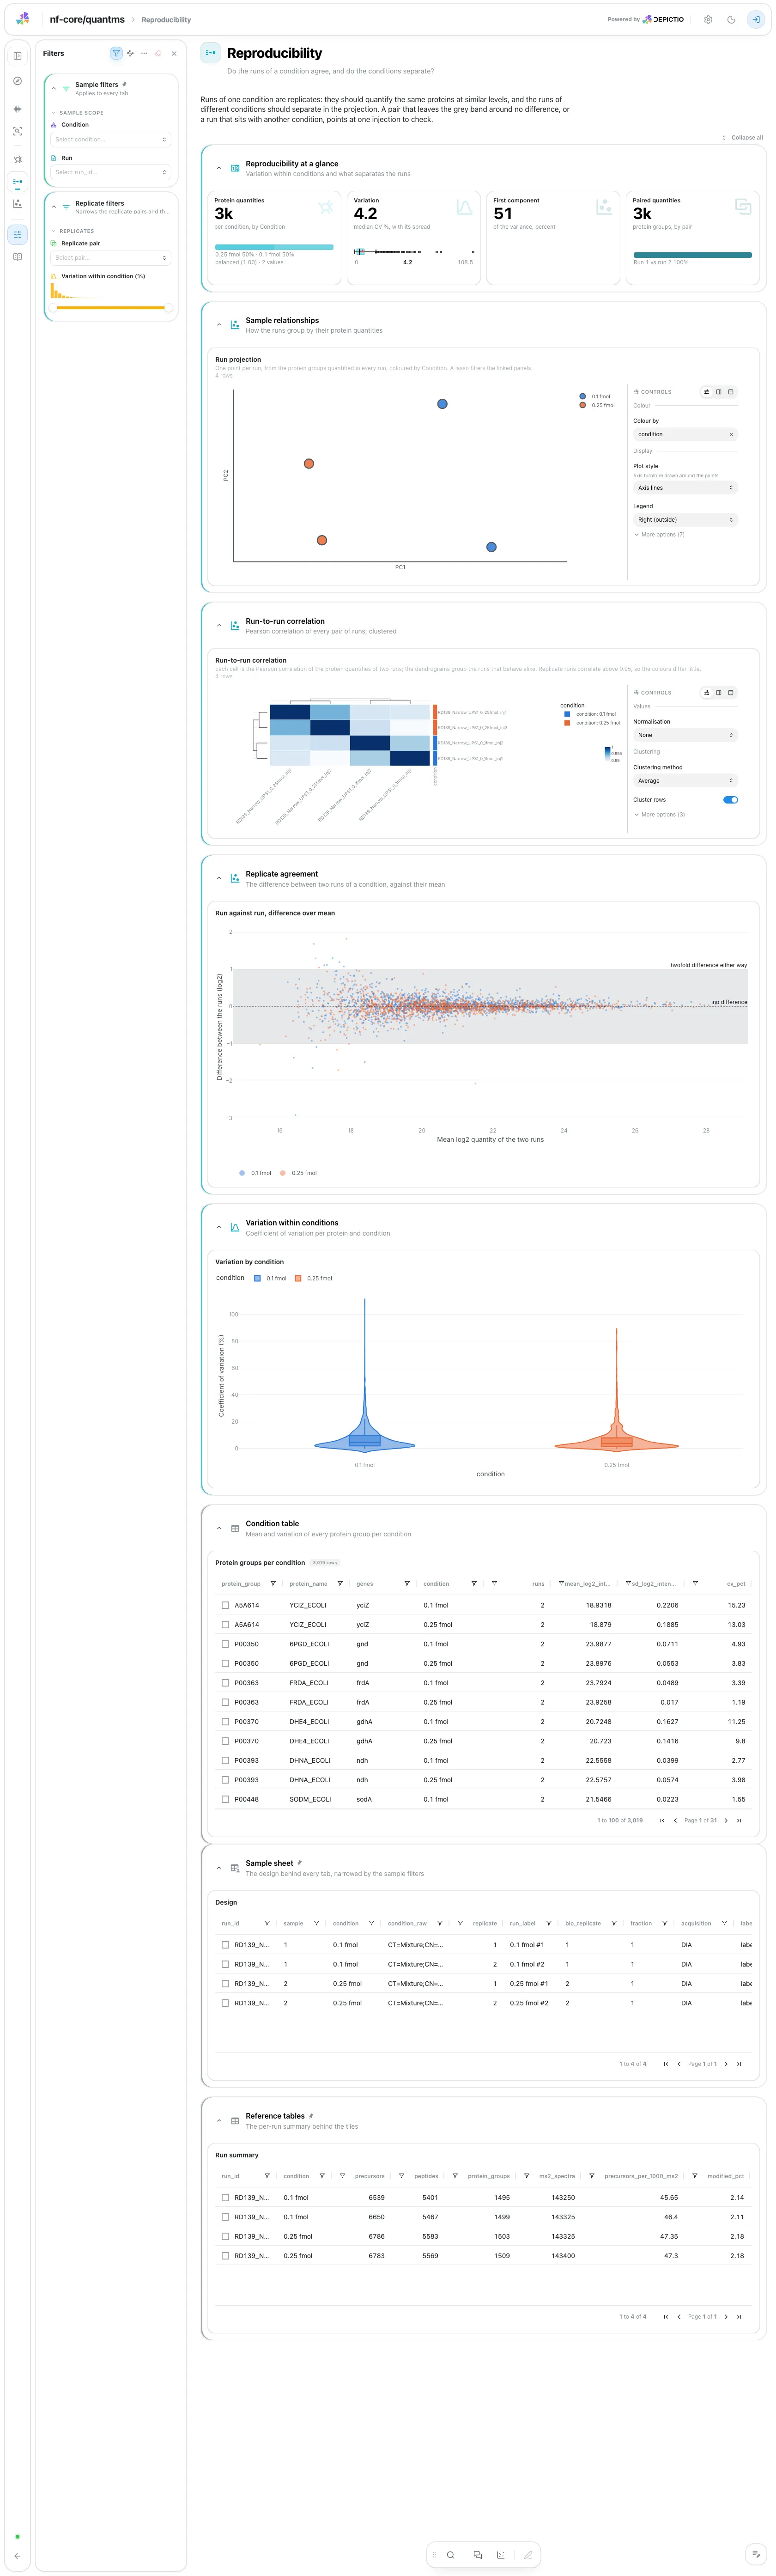
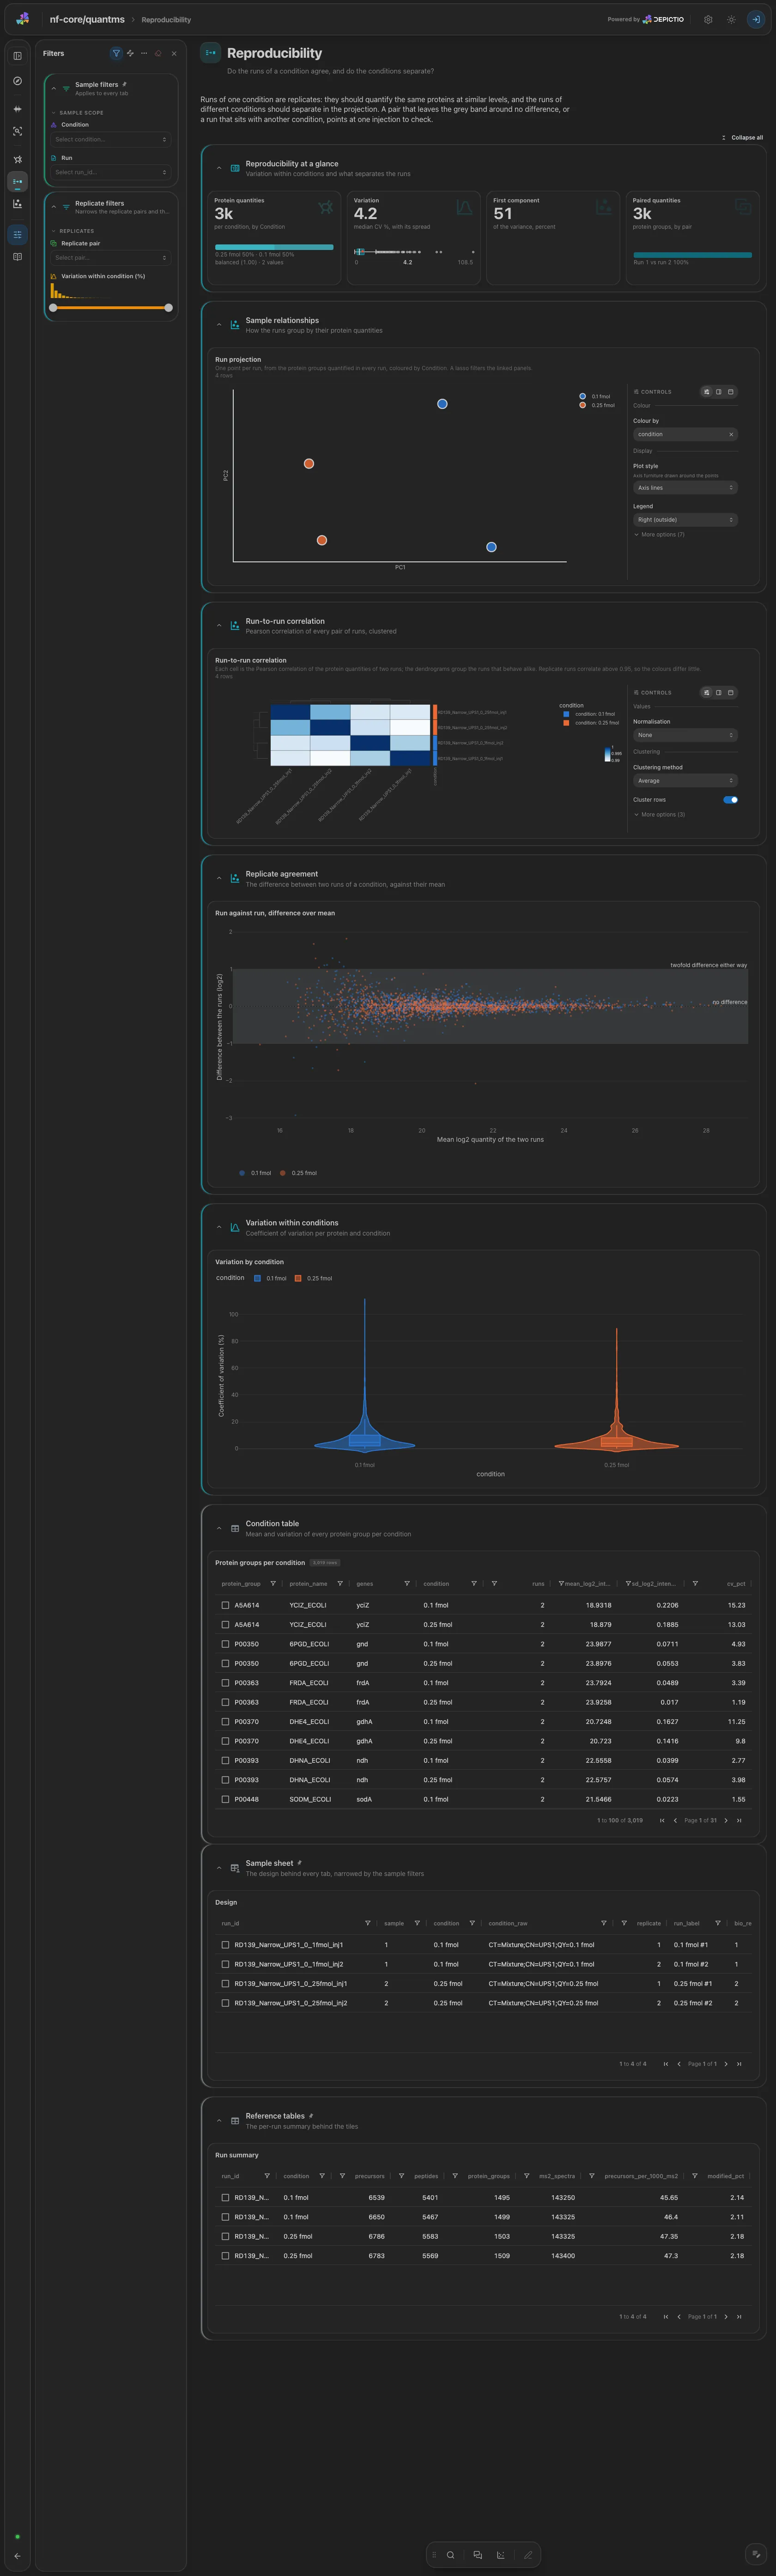
The run projection (a lasso filters the linked panels), the difference between two runs against their mean for every replicate pair, and the variation within each condition as a violin, where under 20 is tight and over 30 noisy. The clustered run correlation and the per-condition table are collapsed. Filters: replicate pair and a variation range.
Quantification · Which proteins change between conditions, and can the test tell?
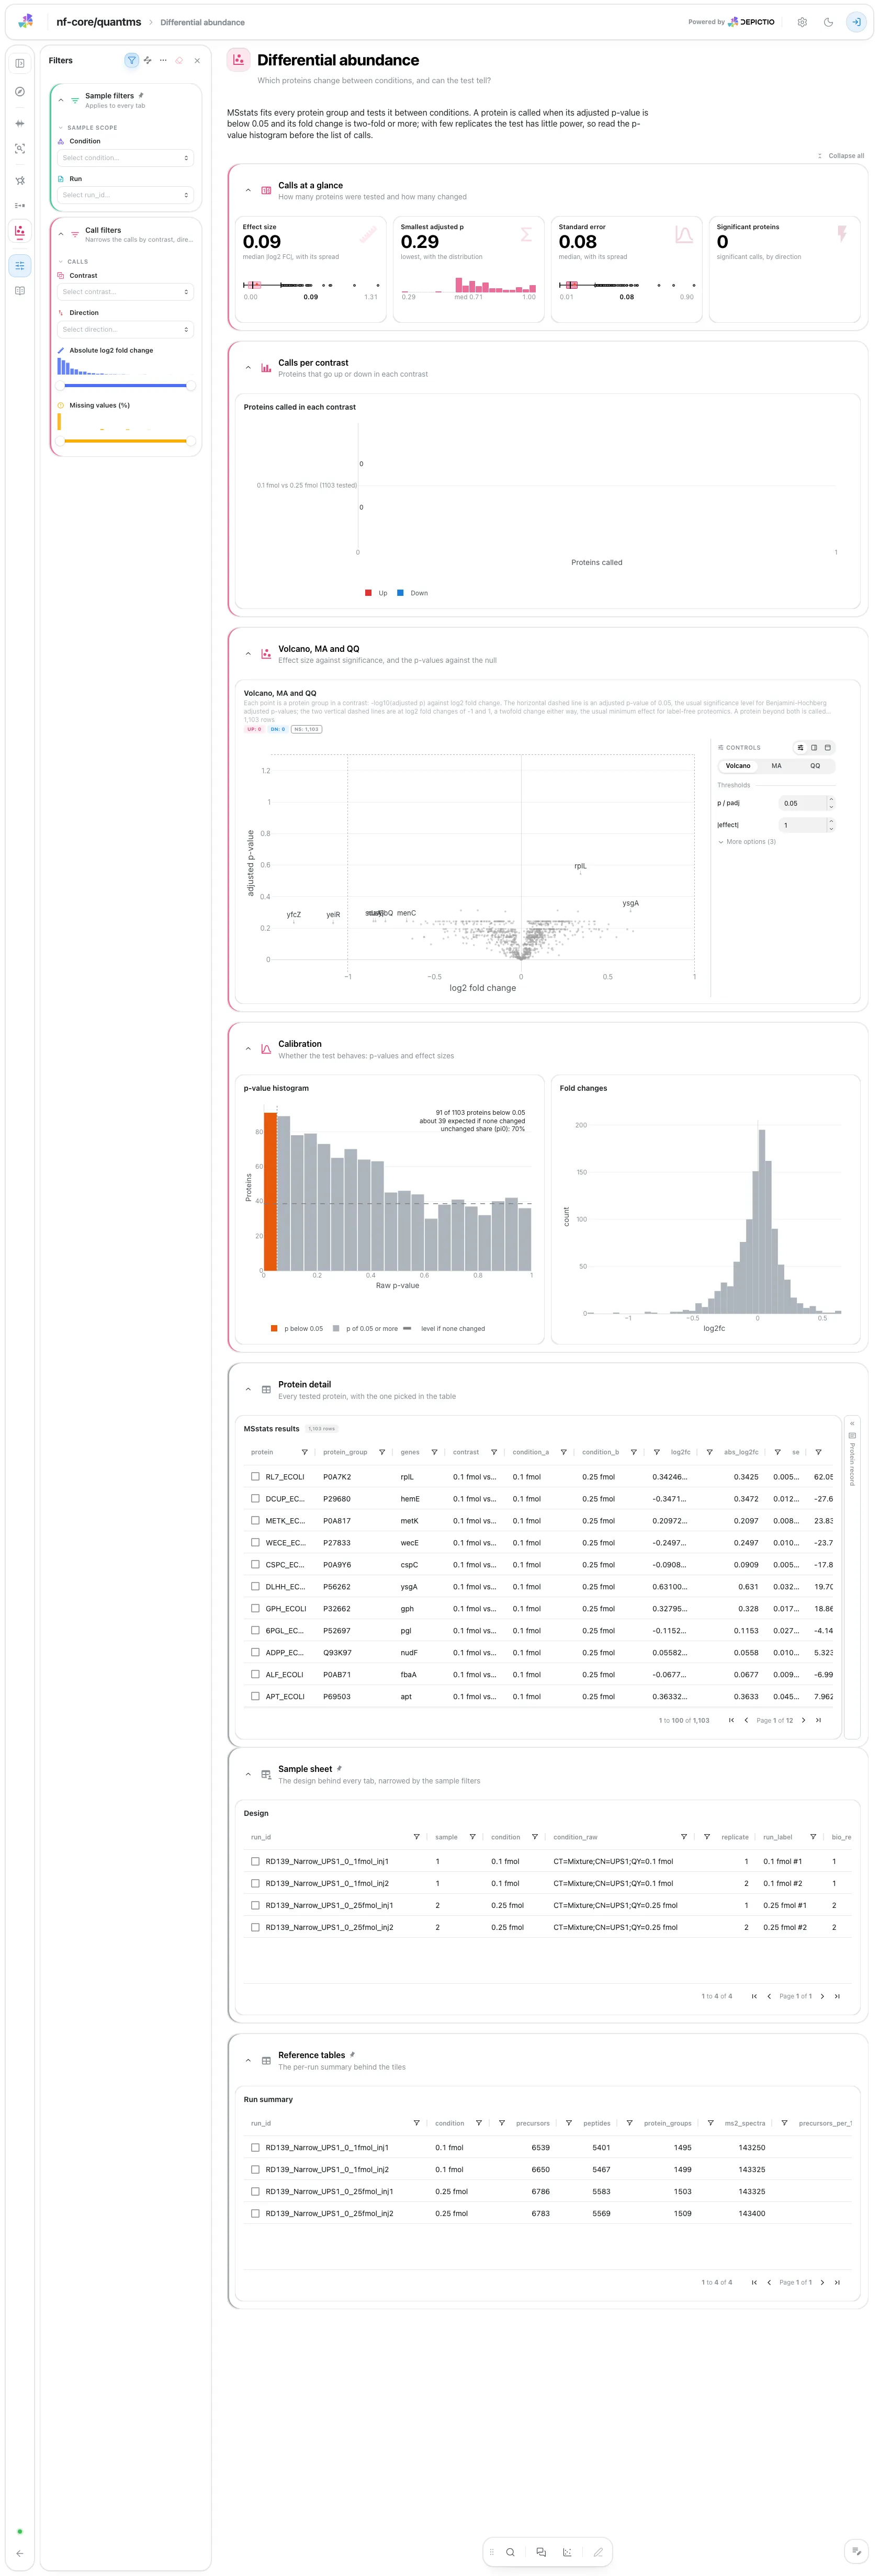
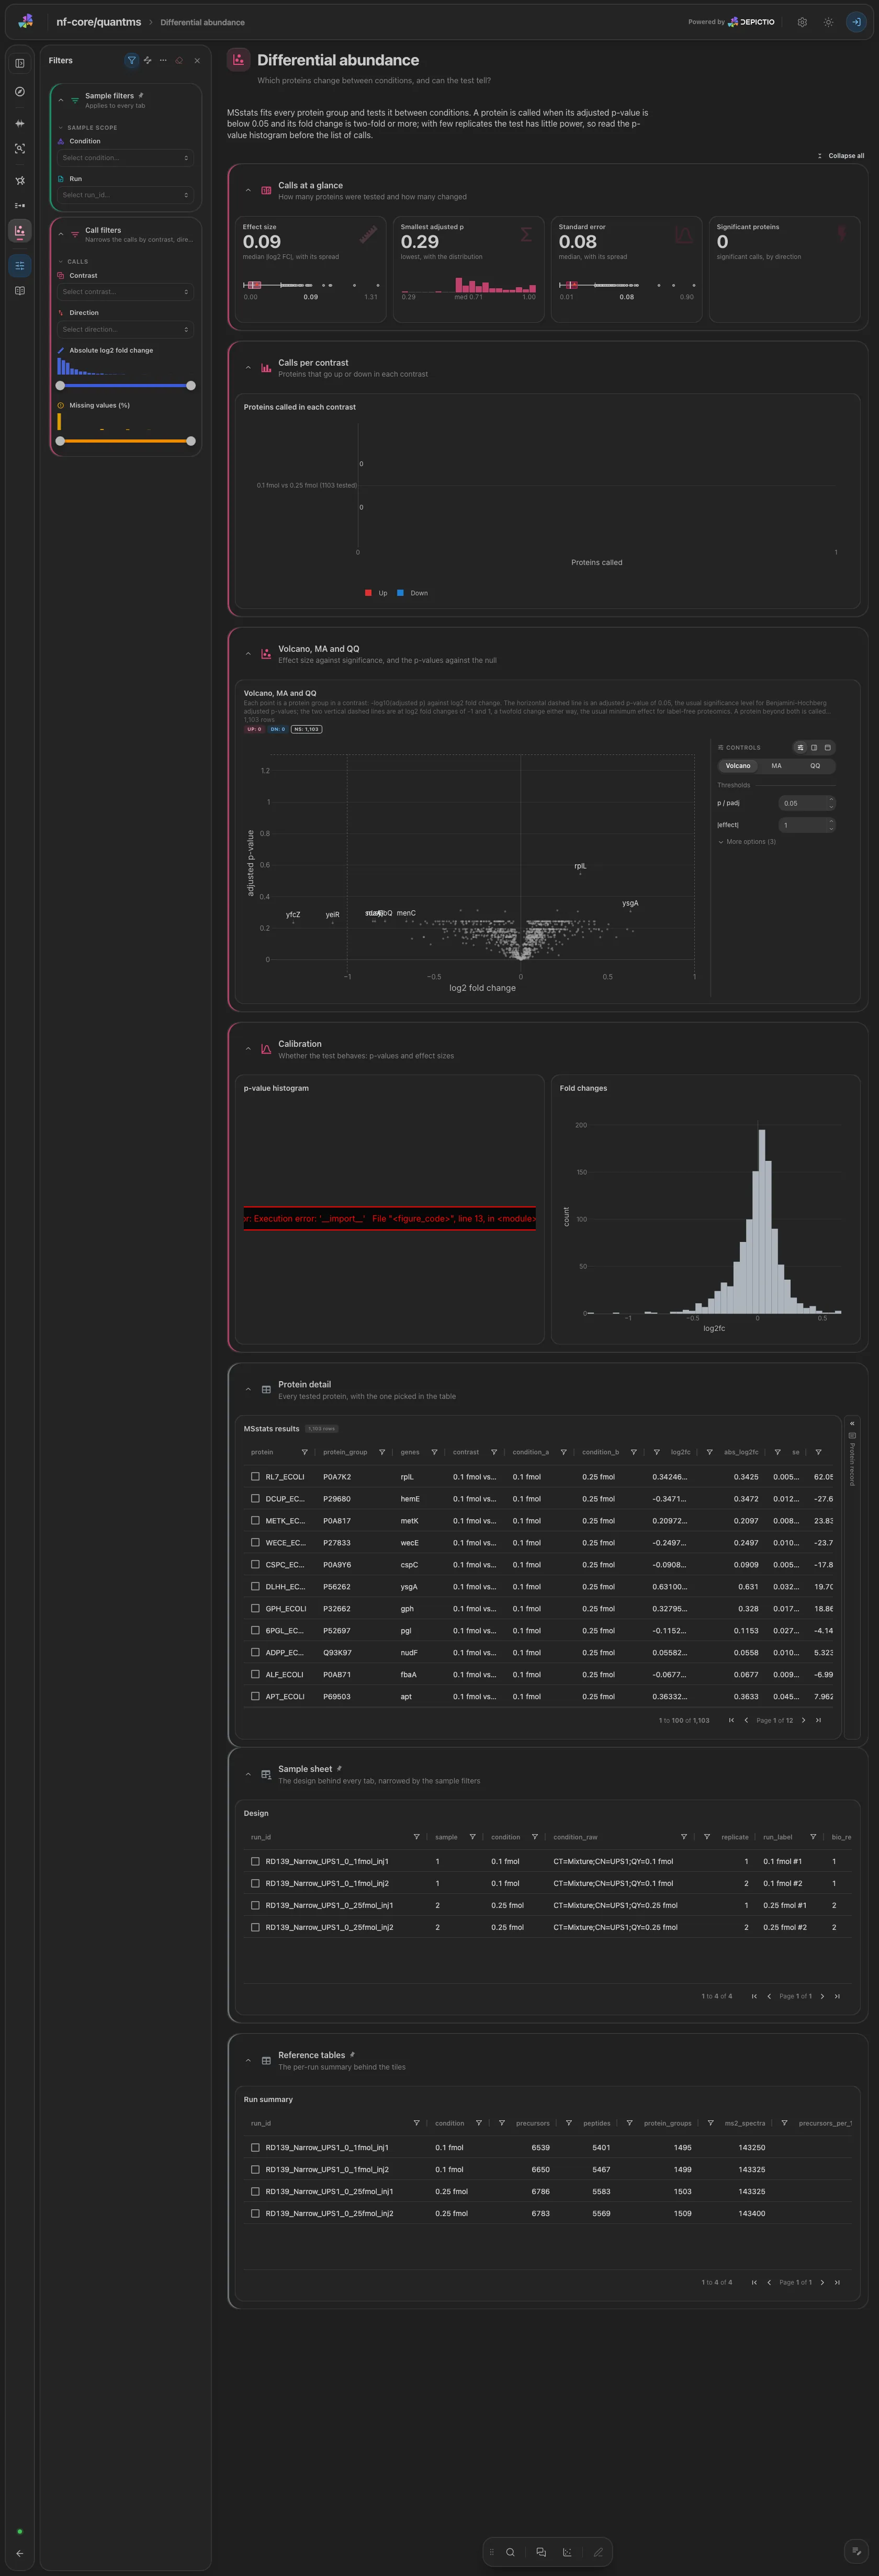
The proteins called Up and Down in each contrast, the volcano with its MA and QQ views (dashed lines at an adjusted p of 0.05 and at log2 fold changes of -1 and 1), the p-value histogram and the fold-change histogram. A flat histogram says the test is calibrated and no protein changed enough. The MSstats table and its record card are collapsed. Filters: contrast, direction, effect size and missing values.
The sample sheet selects on run_id, and the protein tables, the variation scatter
and the volcano select on protein_group. A pick narrows the other tiles of its
collection and of the collections linked from it. A record card waits for a picked
row or point.
Running the pipeline
Depictio reads the output of nf-core/quantms, it does not run the pipeline. Run the pipeline first, on an SDRF of a DIA experiment:
See the usage documentation for the DIA options. Then point Depictio at the directory of the DIA results:
See nf-co.re/quantms/usage for full pipeline documentation.
Required data structure
Point depictio ingest at the directory holding the output of one mode. Depictio
scans recursively and matches on file name.
<DATA_ROOT>/                                    # mode_dia/ for the megatest
├── input/
│   └── sdrf.tsv                                # --var METADATA_FILE (optional)
├── pipeline_info/*software*versions*.yml
├── sdrfparsing/
│   ├── *_openms_design.tsv                     # runs, sample, MSstats condition
│   └── *_config.tsv                            # acquisition settings
├── mzmlstatistics/*_mzml_info.tsv
├── diannsummary/
│   ├── diann_report.tsv                        # precursors
│   └── diann_report.pg_matrix.tsv              # protein groups
└── msstats/*_comparisons.csv                   # contrasts (tab separated)
Validation runs
The repository ships
download_test_data.sh,
which fetches the tables of nf-core's AWS megatest run that the template needs and
copies the vendored SDRF into input/:
bash depictio/projects/nf-core/quantms/1.1.1/download_test_data.sh \
  /tmp/quantms_test
depictio ingest /tmp/quantms_test --template nf-core/quantms/latest
The run is
s3://nf-core-awsmegatests/quantms/results-600505011027ab196bb18b1320607468bdae951a/,
whose mode_dia/ folder holds four label-free DIA runs of two conditions. It
therefore has a single contrast, and the per-contrast views read one. The other
two modes of that run (mode_lfq, mode_tmt) are not read.
Additional resources
- nf-co.re/quantms: official pipeline documentation
- nf-co.re/quantms/results: AWS test results
- Template System Reference: YAML format, variables, conditionals
- Recipes: how to read, test, and write recipes
Authorship
 weber8thomas
Reviewing a template on your own data, or taking over a role here, is a contribution in itself: the contributing guide says what each one involves.