
The pairgenomealign template follows a run that aligns every genome of its samplesheet (the queries) to one target genome, from the query assemblies to where the long alignments land on the target:
- Overview: the run in four key figures, live findings and four figures, each linked to the tab that explains it
- Data & QC: the MultiQC report, and the contiguity, size, composition and scaffolding gaps of each query assembly
- Alignment: the share of the target each genome covers and the identity of its one-to-one alignment, with the scoring parameters last-train fitted
- Divergence: Kimura distance, transition bias and the 12-class substitution spectrum of every pair
- Synteny: the long alignments of one query on a ring shared with the target (needs the PSL export)
Summaries, not alignments
The MAF alignments are gigabytes per pair and are not read: the template
reads the small per-pair summaries LAST writes next to them. The Synteny tab
needs the PSL export (--export_aln_to psl); without it the tab is dropped
at import and the other tabs are untouched.
Quick start
The results directory is the only thing you have to pass. Every per-pair
output is named <target>___<query>, and the query genome is the join key.
depictio ingest /path/to/pairgenomealign_results \
--template nf-core/pairgenomealign/latest \
--var METADATA_FILE=genome_metadata.tsv \
--var GROUP_COL=clade
The samplesheet carries only the genome id and its FASTA, so the design is an
optional TSV: the genome id in a sample column (or the first column) and one
column per factor. GROUP_COL picks the factor the filters and colours use,
the first by default. A run with --skip_assembly_qc needs
--var SKIP_ASSEMBLY_QC=true.
depictio config nextflow --install     # once per machine
nextflow run nf-core/pairgenomealign -r 3.0.4 -profile docker --outdir results
No depictio ingest, and no template named: the pipeline ingests its own
output directory when it finishes and resolves this template from its own
manifest. See Nextflow trigger.
Reference
The template reads, per genome pair, the one-to-one identity summary
(*.o2o.tsv), the substitution matrix with its distance estimates
(*.o2o.matrix.txt) and the fitted scoring parameters (*.train.tsv); per query
assembly, the assembly-scan JSON and the seqtk poly-N BED; and the optional PSL
export. A genome hub, one row per query genome, joins them with the design table:
every filter starts from it, and a selection made on an alignment or assembly tile
narrows the hub and through it every other tab.
Self-adapting layout
The dashboard adapts to whatever the run actually produced: components bound
to pruned or unparsed data collections are hidden, tabs left with no real
visualizations are dropped entirely, and the remaining components are
re-packed so there are no empty rows. Without the PSL export the Synteny tab,
its pipeline step and its findings row go. With --skip_assembly_qc the
assembly statistics go, while the gap views read from the BEDs stay.
Template variables
Variables you provide when running the template: DATA_ROOT is the results directory given to depictio ingest, the others are set with --var NAME=value:
| Variable | Required | Description |
|---|---|---|
DATA_ROOT |
✓ | Root directory of one pairgenomealign run (alignment/, assemblyscan/, cutn/, multiqc/, pipeline_info/). |
METADATA_FILE |
— | Optional design table (TSV): genome id in a column named sample (or in the first column), one column per factor such as a clade. Enables the design filters and grouping. |
METADATA_ID_COL |
— | Design table genome-id column. Auto-detected as the first column; defaults to 'sample'. |
GROUP_COL |
— | Design column the dashboards group and filter genomes by. Auto-detected as the first factor column of METADATA_FILE. |
SKIP_ASSEMBLY_QC |
— | Set (--var SKIP_ASSEMBLY_QC=true) for a run with --skip_assembly_qc: no assemblyscan/ reports, so the assembly statistics collection is pruned. |
Auto-detected (set from the run's metadata / params.json; the route flags drive Conditional routes below): GROUP_COL_DISPLAY, ANNOTATION_COLS
Data collections
10 data collections — 3 required 7 optional · 9 direct 1 derived.
Origin tells you whether a collection is real pipeline data or a reshape of it: direct = a pipeline output (scanned, or a recipe that reads raw files); derived = a recipe that reshapes one or more direct collections into the layout a visualization needs (no new measurement). Reads shows what produces it: a recipe .py transform, whose name links to its source on GitHub, or a raw file scanned off disk. (A direct collection can still have a recipe — one that merely parses/cleans the raw file; derived means the recipe reshapes another collection.)
| Tag | Origin | Type | Reads | Status |
|---|---|---|---|---|
metadata |
direct | Table | file {METADATA_FILE} |
optional |
last_split_identity |
direct | Table | recipe last/split_identity.py |
required |
last_split_matrix |
direct | Table | recipe last/split_matrix.py |
optional |
last_train_params |
direct | Table | recipe last/train_params.py |
optional |
last_synteny_links |
direct | Table | recipe last/synteny_links.py |
optional |
assemblyscan_stats |
direct | Table | recipe assemblyscan/stats.py |
optional |
seqtk_cutn_gaps |
direct | Table | recipe seqtk/cutn_gaps.py |
optional |
seqtk_cutn_gap_lengths |
direct | Table | recipe seqtk/cutn_gap_lengths.py |
optional |
genomes |
derived | Table | recipe nf-core/pairgenomealign/genomes.py |
required |
multiqc_data |
direct |  MultiQC |
file (?:.*/)?multiqc(?:/[^/]+)?/multiqc_data/multiqc.parquet$ |
required |
Conditional routes
Rows are data collections; columns are the variables you set or params.json flags auto-detected from the run. Each filled cell is the effect of setting that variable; an empty cell means that variable leaves the collection unchanged. (8 collections are unaffected by any variable — present on every run.)
+ included− removed⇄ repointed
| Data collection | METADATA_FILE |
SKIP_ASSEMBLY_QC |
|---|---|---|
metadata |
+ | |
assemblyscan_stats |
− |
Cross-DC links
13 links — selecting a value in the source collection filters the target. The join column is shown after the source.
| Source · column | Target | Filters | |
|---|---|---|---|
genomes · pair |
→ | multiqc_data |
Filter the MultiQC alignment sections by the selected genomes |
genomes · genome |
→ | multiqc_data |
Filter the MultiQC assembly sections by the selected genomes |
genomes · genome |
→ | last_split_identity |
Filter the alignment summary by the selected genomes |
genomes · genome |
→ | last_split_matrix |
Filter the substitution summary by the selected genomes |
genomes · genome |
→ | last_train_params |
Filter the fitted parameters by the selected genomes |
genomes · genome |
→ | last_synteny_links |
Filter the synteny links by the selected genomes |
genomes · genome |
→ | assemblyscan_stats |
Filter the assembly statistics by the selected genomes |
genomes · genome |
→ | seqtk_cutn_gaps |
Filter the assembly gap summary by the selected genomes |
genomes · genome |
→ | seqtk_cutn_gap_lengths |
Filter the gap length profiles by the selected genomes |
last_split_identity · query |
→ | genomes |
Narrow the genome hub to the genomes selected on the alignment tiles |
assemblyscan_stats · genome |
→ | genomes |
Narrow the genome hub to the assemblies selected on the assembly tiles |
last_split_matrix · query |
→ | genomes |
Narrow the genome hub to the genomes selected on the divergence tiles |
last_train_params · query |
→ | genomes |
Narrow the genome hub to the genomes selected on the fitted-parameter tiles |
Recipes
Each recipe reshapes raw pipeline output into a tidy table. The name links to its source; Output lists the validated OUTPUT_SCHEMA columns.
| Recipe | Transforms | Output |
|---|---|---|
assemblyscan/stats.py |
Assembly statistics of each genome from assembly-scan's JSON report. | genome, contigs, total_length, max_contig_length, mean_contig_length, median_contig_length, min_contig_length, n50, l50, gc_pct, n_pct, contigs_over_1kb, contigs_over_10kb, contigs_over_100kb, contigs_over_1mb, contigs_over_1mb_pct |
last/split_identity.py |
One row per pairwise genome alignment from LAST's one-to-one summary (*.o2o.tsv). |
pair, target, query, aligned_bp, percent_identity, percent_identity_no_gaps, target_sequences, target_length, query_sequences, query_length, target_aligned_pct, query_aligned_pct |
last/split_matrix.py |
Substitution matrix and evolutionary distances of each one-to-one genome alignment. | pair, target, query, blocks, columns_analyzed, p_distance, jc69_distance, f81_distance, k80_distance, t92_distance, identical_columns, substituted_columns, transitions, transversions, ts_tv_ratio, target_gap_columns, query_gap_columns, A_to_C_pct, A_to_G_pct, A_to_T_pct, C_to_A_pct, C_to_G_pct, C_to_T_pct, G_to_A_pct, G_to_C_pct, G_to_T_pct, T_to_A_pct, T_to_C_pct, T_to_G_pct |
last/synteny_links.py |
Synteny links between the target and each query genome, from the PSL export of the one-to-one alignment. | pair, target, query, label, chrom_a, start_a, end_a, pos_a, chrom_b, start_b, end_b, pos_b, weight, aligned_bp, identity_pct, category, rank |
last/train_params.py |
Alignment scoring parameters last-train fitted for each genome pair (*.train.tsv). |
pair, target, query, training_percent_identity, score_scale, deletion_open_cost, insertion_open_cost, deletion_extend_cost, insertion_extend_cost, strand_setting |
nf-core/pairgenomealign/genomes.py |
The nf-core/pairgenomealign genome hub: one row per query genome, every per-genome number. | genome, aligned_bp, percent_identity, target_aligned_pct, query_aligned_pct, blocks, k80_distance, ts_tv_ratio, contigs, total_length, n50, gc_pct, gaps, gap_bp, target, pair |
seqtk/cutn_gap_lengths.py |
Length distribution of the assembly gaps of each genome (seqtk cutN BED). |
genome, gap_length_bp, log10_gap_length, gaps, gaps_pct, gap_bp |
seqtk/cutn_gaps.py |
Assembly gaps per genome, from the poly-N regions seqtk cutN reports. |
genome, gaps, gap_bp, sequences_with_gaps, median_gap_bp, max_gap_bp |
Dashboard tabs
One dashboard: the Overview, then five child tabs in two groups, read as a funnel from the query assemblies to where the long alignments land on the target. Each tab below carries the same icon and colour the dashboard gives it, so the page and the app read alike.
| Group | Tabs |
|---|---|
| Data & QC | MultiQC, Assemblies |
| Genome alignment | Alignment, Divergence, Synteny |
Each child tab opens with a short intro and a strip of four cards, then at most three open sections; tables and record cards follow, collapsed. The persistent Sample filters (design group and query genome) narrow every tab through the genome hub.
Pairwise genome alignment, from the query assemblies to identity, divergence and synteny.
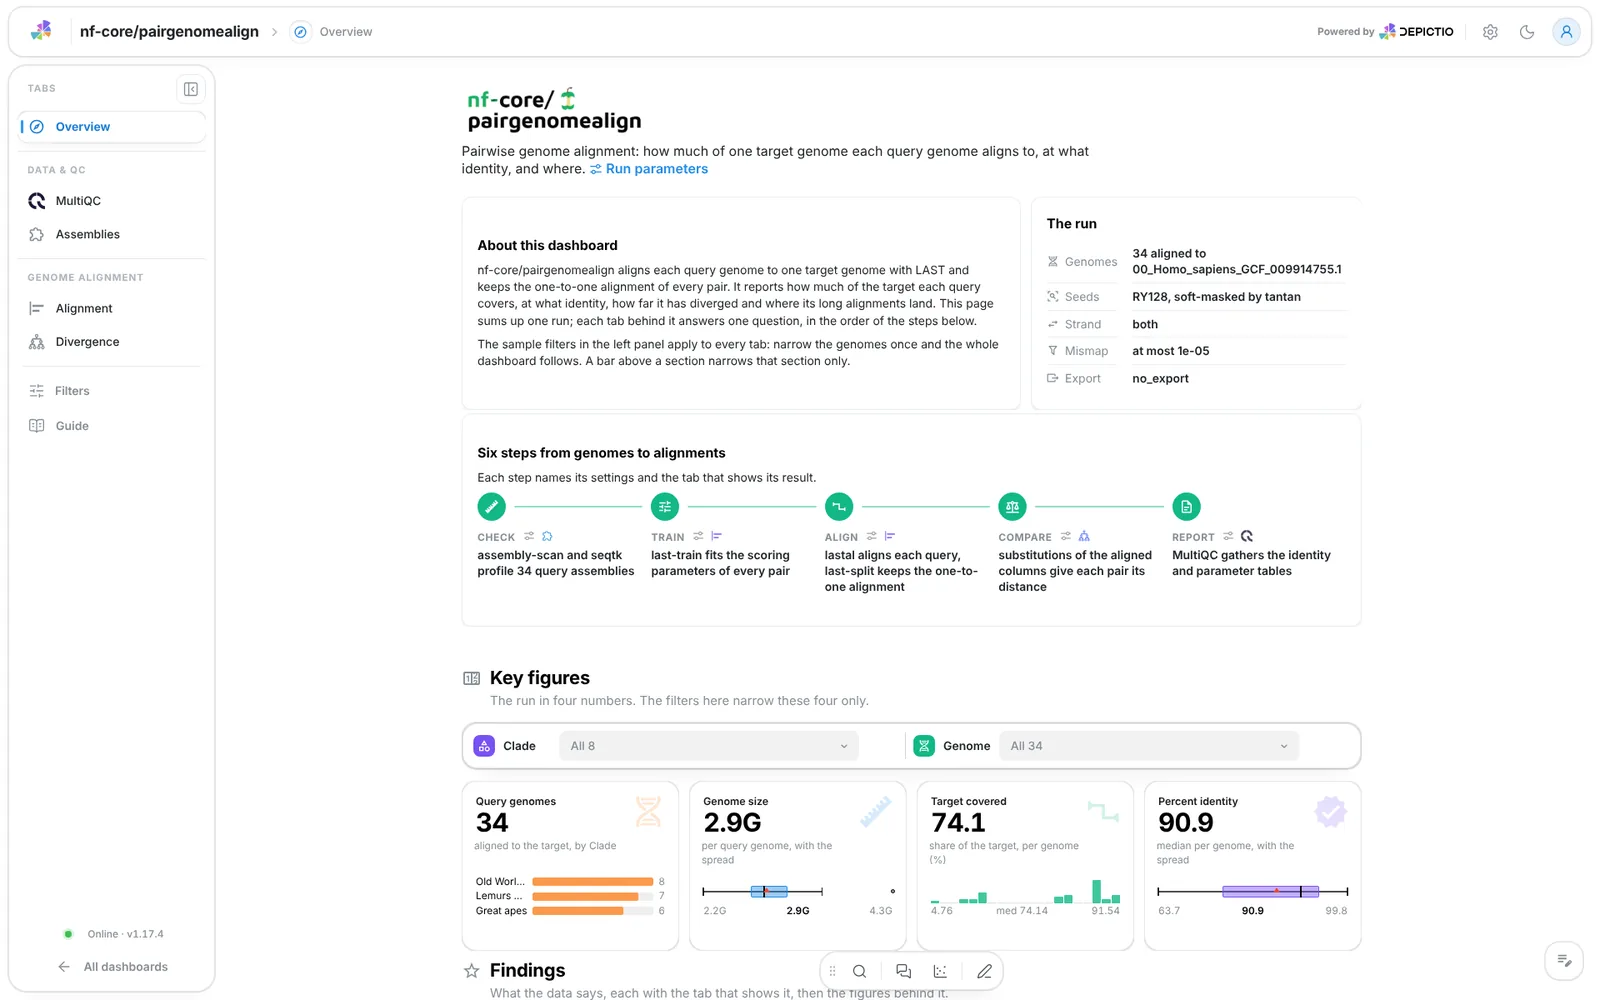
A short hero links the run parameters. The run lists the genome count and target, the seed and soft-masking, the strand, the mismap limit and the export format, and Six steps from genomes to alignments walks check, train, align, compare, link and report, each linked to its parameters and its tab. The findings are live values that follow the filters.
Filters and components
Filters · the left panel starts collapsed. Key figures and Findings each have their own filter bar (the design group and the query genome): each narrows its own section only.
| Section | What it holds |
|---|---|
| Key figures | 4 headline cards: query genomes (split by group), genome size, target covered, percent identity |
| Findings | Live result rows (identity with target coverage, K80 distance with transition bias, N50 with the share of sequences over 1 Mb, synteny links with their matching bases), then 4 figures: the contiguity scatter, identity against coverage, the fitted gap costs and the saturation scatter |
Data & QC · What does the MultiQC report say about the alignments?
MultiQC panels only. The report holds custom content: the one-to-one identity and the fitted parameters of every genome pair, then the contig length statistics and the base content of every query assembly. The pair id reaches the alignment panels by prefix and the genome the assembly panels directly, so the pinned sample filters narrow them.
Filters and components
Filters · Report scope (Report row) narrows the panels to
selected report rows, next to the pinned sample filters.
| Section | What it holds |
|---|---|
| Alignment sections | 2 MultiQC panels: one-to-one alignment identity, fitted alignment parameters |
| Assembly sections | 2 MultiQC panels: contig length statistics, base content |
Data & QC · How contiguous is each query assembly, and where are its gaps?
Sequences against N50 of each assembly on log axes, sized by length, then the gap length matrix: one row per assembly, the lengths of its runs of N on a log10 scale across and the share of its runs in each bin as the colour. A fixed scaffolding filler is one dark cell, and a dotted line marks the common 100 bp one.
Filters and components
Filters · Assembly scope: N50 (bp) and Sequences, both range
sliders.
| Section | What it holds |
|---|---|
| Assemblies at a glance | 4 cards: N50, sequences over 1 Mb, assembly length, GC content |
| Contiguity | 1 advanced visualization, Sequences against N50 per assembly; a lasso on it narrows every tab |
| Scaffolding gaps | 1 advanced visualization, Gap lengths per assembly |
| Assembly tables (collapsed) | Assembly statistics, Assembly gaps |
Genome alignment · How much of the target does each genome cover, at what identity?
Percent identity is the identical columns over all alignment columns, gaps included. Every genome is placed by target coverage and identity, with the record of the picked genome beside it (alignment, divergence and assembly in one card), then the gap cost last-train fitted against the identity of its training alignments. A closer genome gets a higher cost.
Filters and components
Filters · Alignment scope: Percent identity and Target covered
(%), both range sliders.
| Section | What it holds |
|---|---|
| Alignment at a glance | 4 cards: percent identity, target covered, aligned length, gap opening cost |
| Identity and coverage | Target coverage against identity per genome, with the Picked genome record beside it |
| Fitted parameters | 1 advanced visualization, Fitted gap cost against training identity |
| Alignment tables (collapsed) | One-to-one alignment per query genome, Fitted scoring parameters per genome pair |
Genome alignment · How far has each genome diverged from the target?
The K80 distance is substitutions per site on the aligned A, C, G and T columns. The transition bias is plotted against the raw distance, one point per pair sized by its blocks (the ratio falls as multiple hits saturate the transitions), beside the substitution spectrum: the share of each of the 12 directed substitutions per genome, scaled per column and clustered by row.
Filters and components
Filters · Divergence scope: K80 distance, a range slider.
| Section | What it holds |
|---|---|
| Divergence at a glance | 4 cards: K80 distance, transitions over transversions, alignment blocks, deletions in the query |
| Saturation | 1 advanced visualization, Transition bias against divergence |
| Substitution spectrum | 1 advanced visualization, Substitution spectrum per genome |
| Divergence tables (collapsed) | Substitutions and distances per genome pair |
Genome alignment · Where do the long alignments of each query land on the target?
Only with a PSL export, which keeps up to 2000 alignments per pair. Target and query sequences share the ring: a chord joins the two loci of an alignment, its width the matching bases and its colour the orientation. The ring reads one query genome, and its picker is always selected, so it holds the first query until another is picked.
Filters and components
Filters · Synteny scope: Query genome (a single pick) and
Orientation.
| Section | What it holds |
|---|---|
| Synteny at a glance | 4 cards: links, matching bases, identity of the links, span of the links |
| Synteny ring | 1 advanced visualization, Synteny between the target and the picked query; click chords to select their alignments |
| Link tables (collapsed) | Alignments behind the chords |
Running the pipeline
Depictio reads the output of nf-core/pairgenomealign, it does not run the pipeline. Run the pipeline first, with the PSL export if you want the Synteny tab:
nextflow run nf-core/pairgenomealign -r 3.0.4 \
  --input samplesheet.csv \
  --target target_genome.fasta \
  --export_aln_to psl \
  --outdir results -profile docker
Then point Depictio at the results. The run writes a MultiQC parquet, so no reprocess step is needed:
See nf-co.re/pairgenomealign/usage for full pipeline documentation.
Required data structure
Point depictio ingest at the directory holding the pipeline output. Depictio scans
recursively and matches on file name. The *.o2o.tsv summaries and the MultiQC
report are mandatory; the rest is optional.
<DATA_ROOT>/
├── input/
│   └── genome_metadata.tsv                     # optional design table (--var METADATA_FILE)
├── pipeline_info/                              # params_*.json, *software*versions*.yml
├── multiqc/multiqc_data/multiqc.parquet        # custom content sections
├── alignment/
│   ├── <target>___<query>.o2o.tsv              # mandatory: identity and coverage per pair
│   ├── <target>___<query>.o2o.matrix.txt       # substitutions and distances (Divergence)
│   ├── <target>___<query>.train.tsv            # fitted scoring parameters (Alignment)
│   └── <target>___<query>.psl.gz               # only with --export_aln_to psl
├── assemblyscan/*.json                         # absent with --skip_assembly_qc
└── cutn/*.bed                                  # runs of N per query assembly
Validation runs
The repository ships
download_test_data.sh,
which fetches the subset of nf-core's AWS megatest run that the template needs:
The run is
s3://nf-core-awsmegatests/pairgenomealign/results-8ee09a1cdc920fc90cd62358952045e5019e1fe0/,
the 3.0.4 test_full profile: 34 query genomes aligned to one target assembly. The
run is 42.8 GB, almost all of it alignments; the manifest keeps the per-pair
summaries, about 20 MB. It ran without the PSL export, so the Synteny tab is
dropped on this data. The script also copies the samplesheet and the design table
the template ships (clade, divergence_mya) to input/.
Then run Depictio against it:
depictio ingest /tmp/pga_test \
  --template nf-core/pairgenomealign/latest \
  --var METADATA_FILE=/tmp/pga_test/input/genome_metadata.tsv \
  --var GROUP_COL=clade
Additional resources
- nf-co.re/pairgenomealign: official pipeline documentation
- nf-co.re/pairgenomealign/3.0.4/results: AWS test results
- Template System Reference: YAML format, variables, conditionals
- Recipes: how to read, test, and write recipes
Authorship
 weber8thomas
Reviewing a template on your own data, or taking over a role here, is a contribution in itself: the contributing guide says what each one involves.