Advanced visualizations
An advanced visualization is a domain chart that knows what its columns mean. A volcano knows it needs a feature, an effect size and a significance; a genome view knows chromosome and position. You bind your columns to those roles once, and the tile brings the domain logic: thresholds, tiers, genomic axes, linked selections.
Pick one over a generic Figure when your table matches a known shape (the output of DESeq2, mosdepth, QIIME2, AlphaFold...). Pick a Figure for a plain plot of any columns.
Catalog
Click a thumbnail to enlarge it, or a name to jump to its entry.
Differential analysis


Single cell & embeddings


Genome tracks
 Coverage track v0.13.0+

 Genome view v1.13.0+
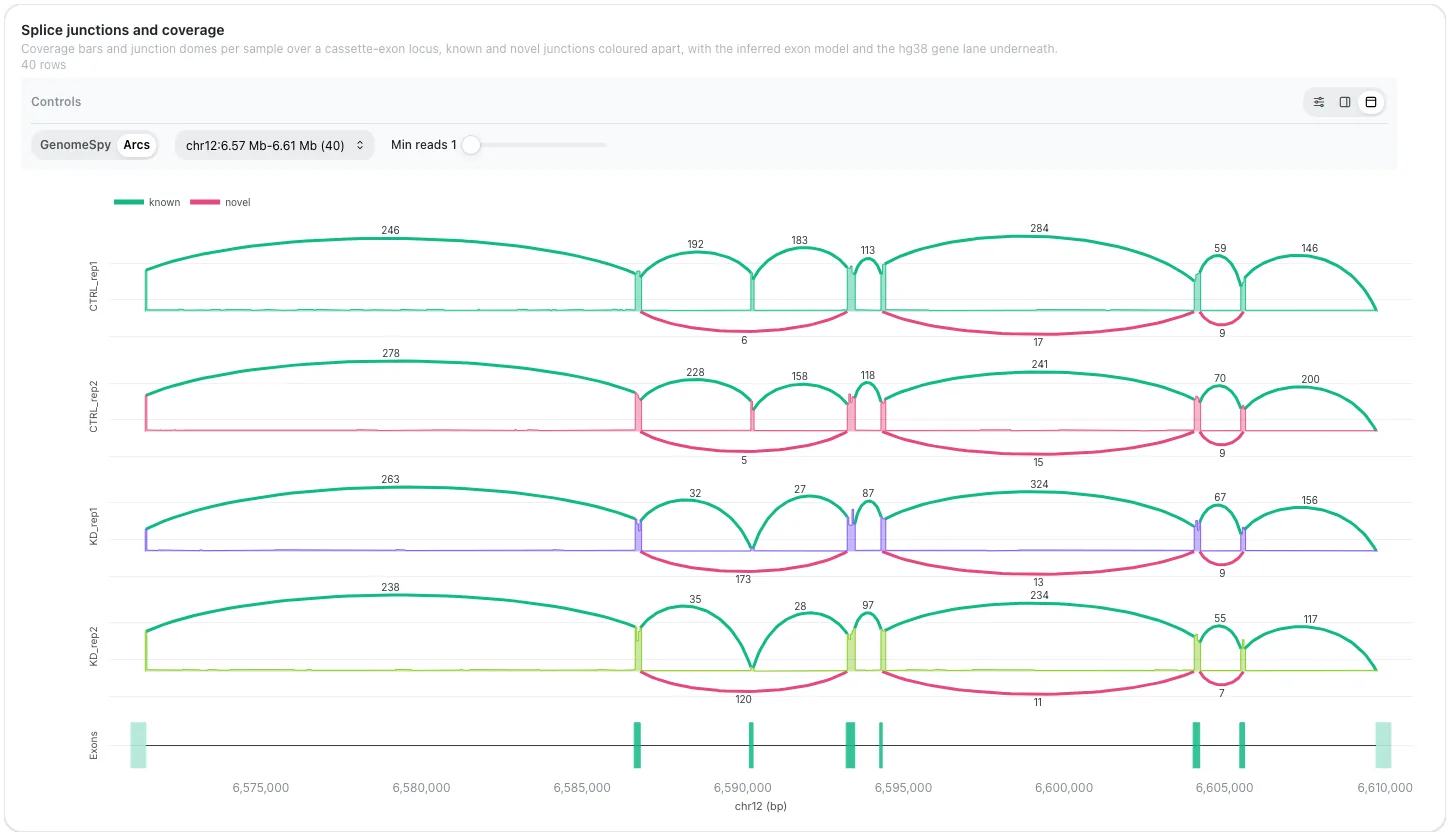
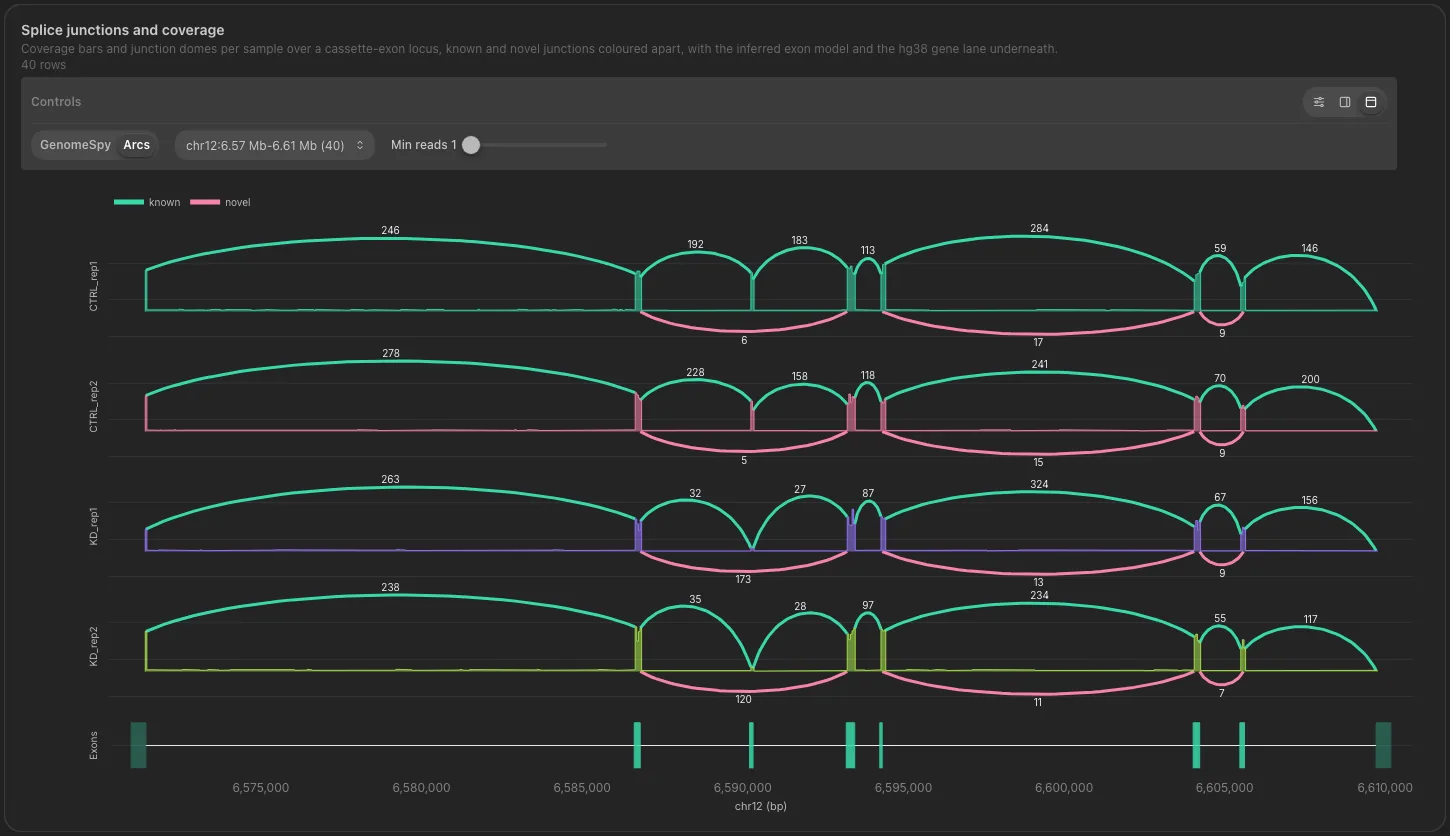 Sashimi v1.11.0+

 Copy-number profile v1.13.0+

 Contact map v1.13.0+

 Transcript structure v1.13.0+
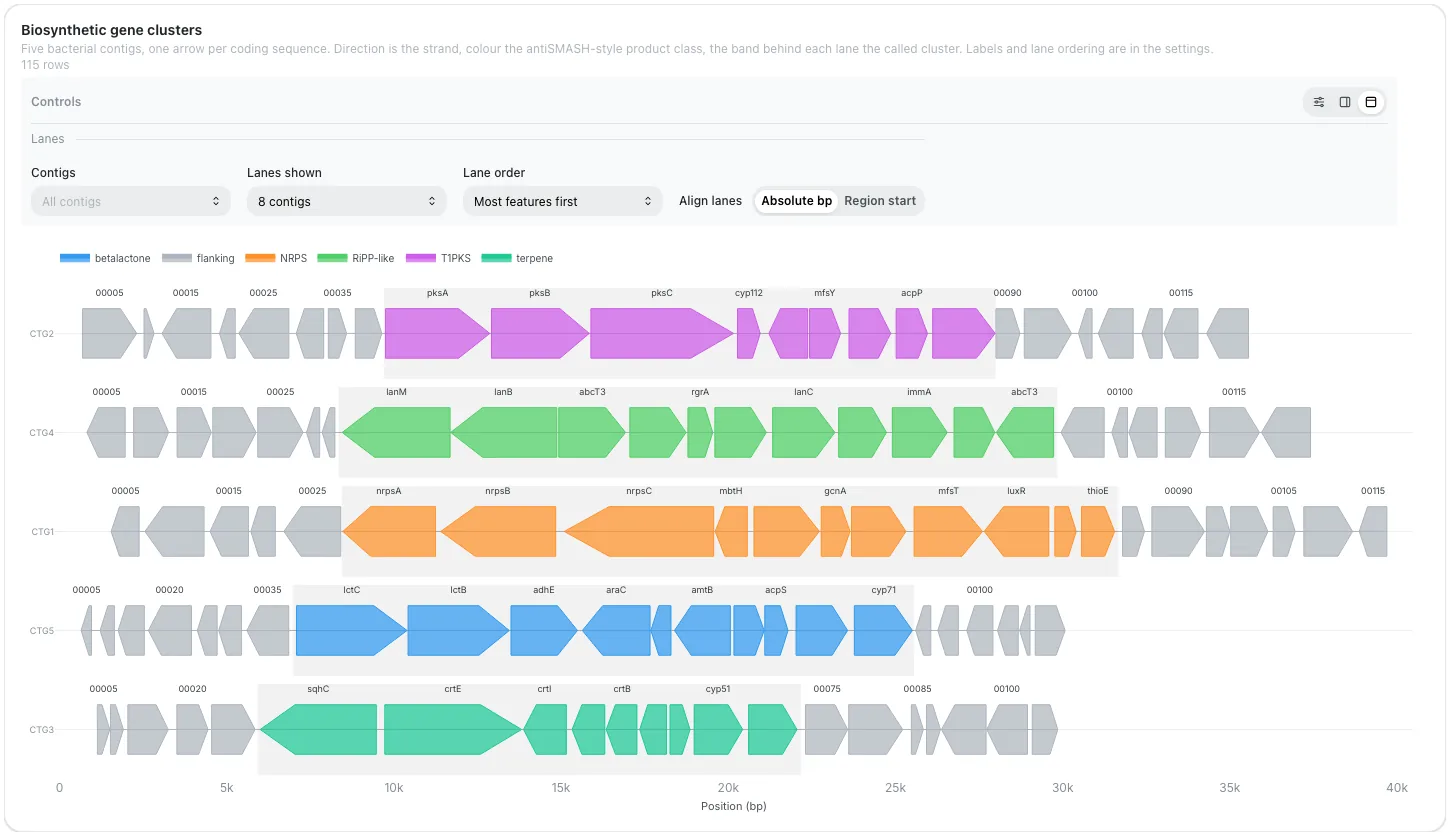
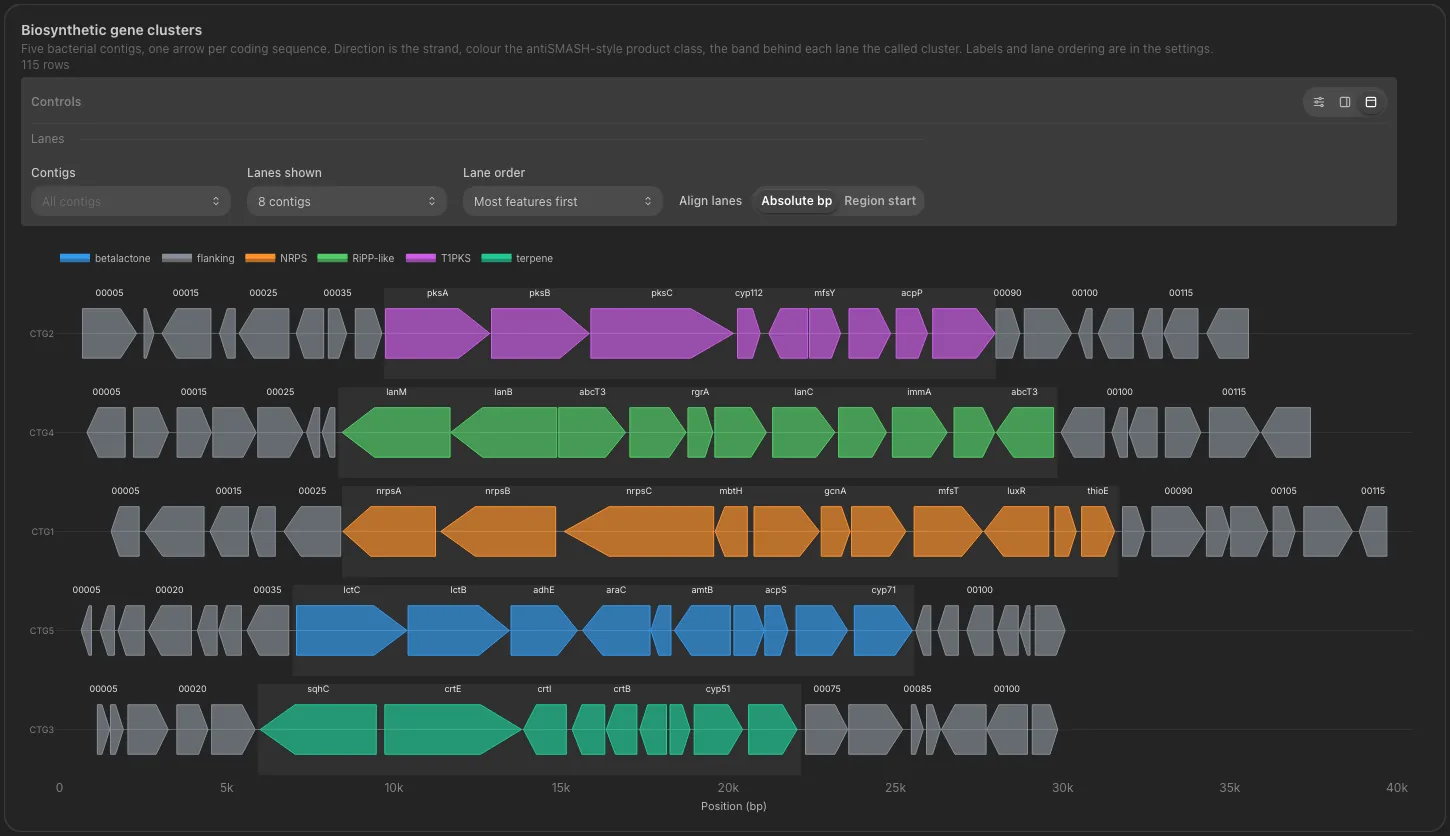 Gene arrow track v1.11.0+
Variants & rearrangements
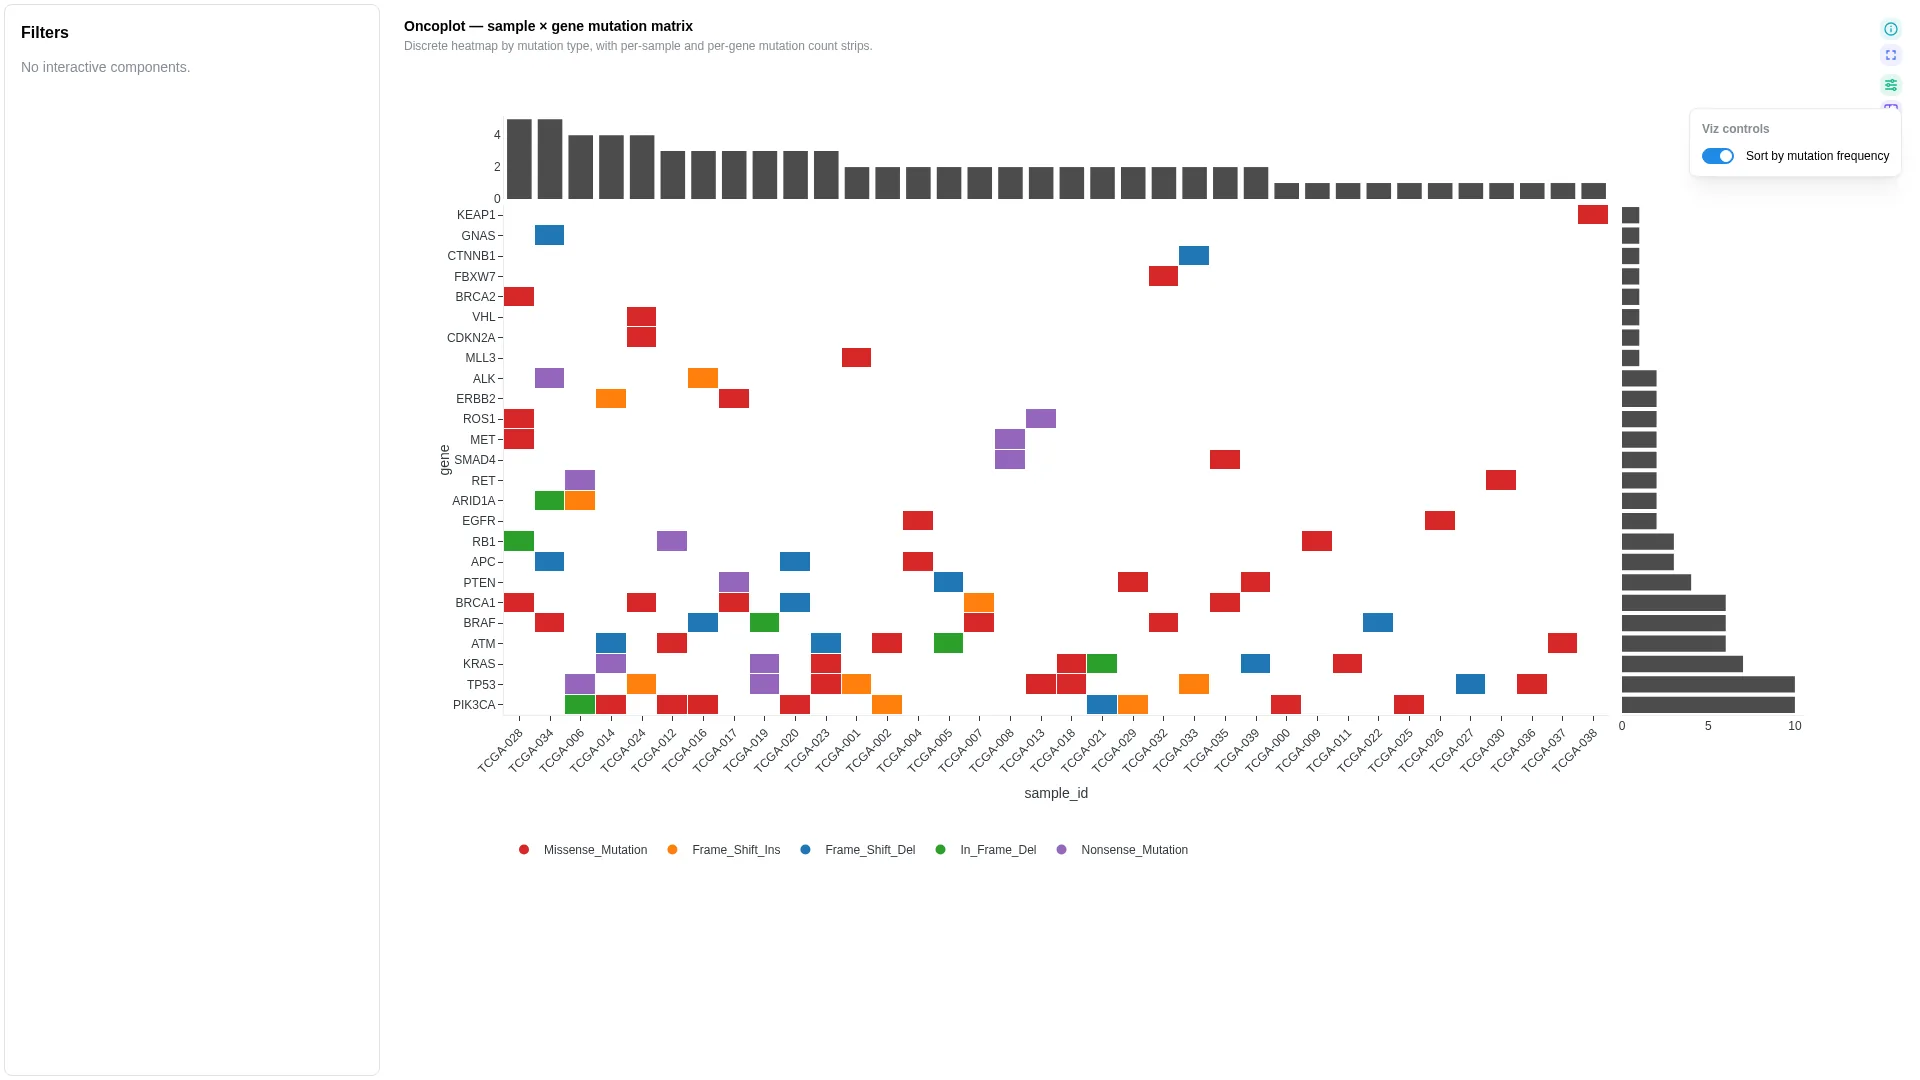
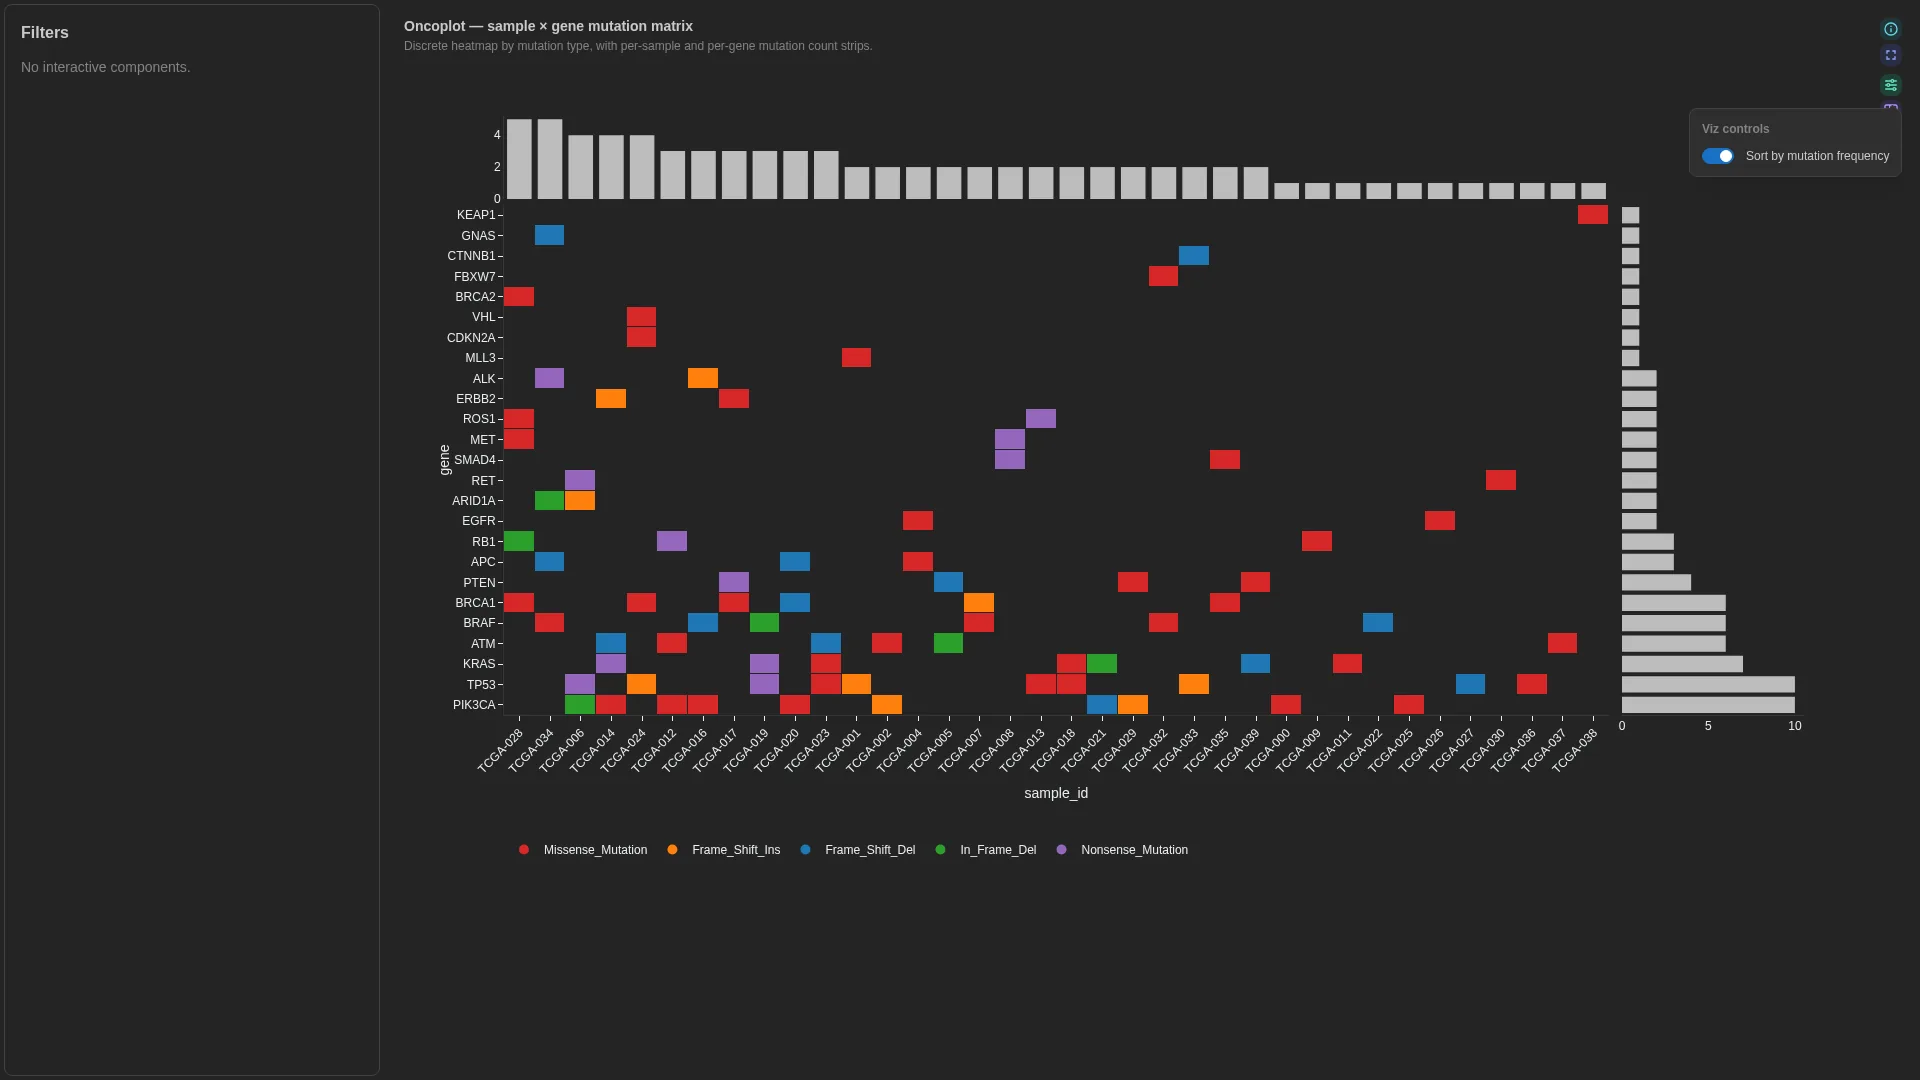 Oncoplot v0.13.0+
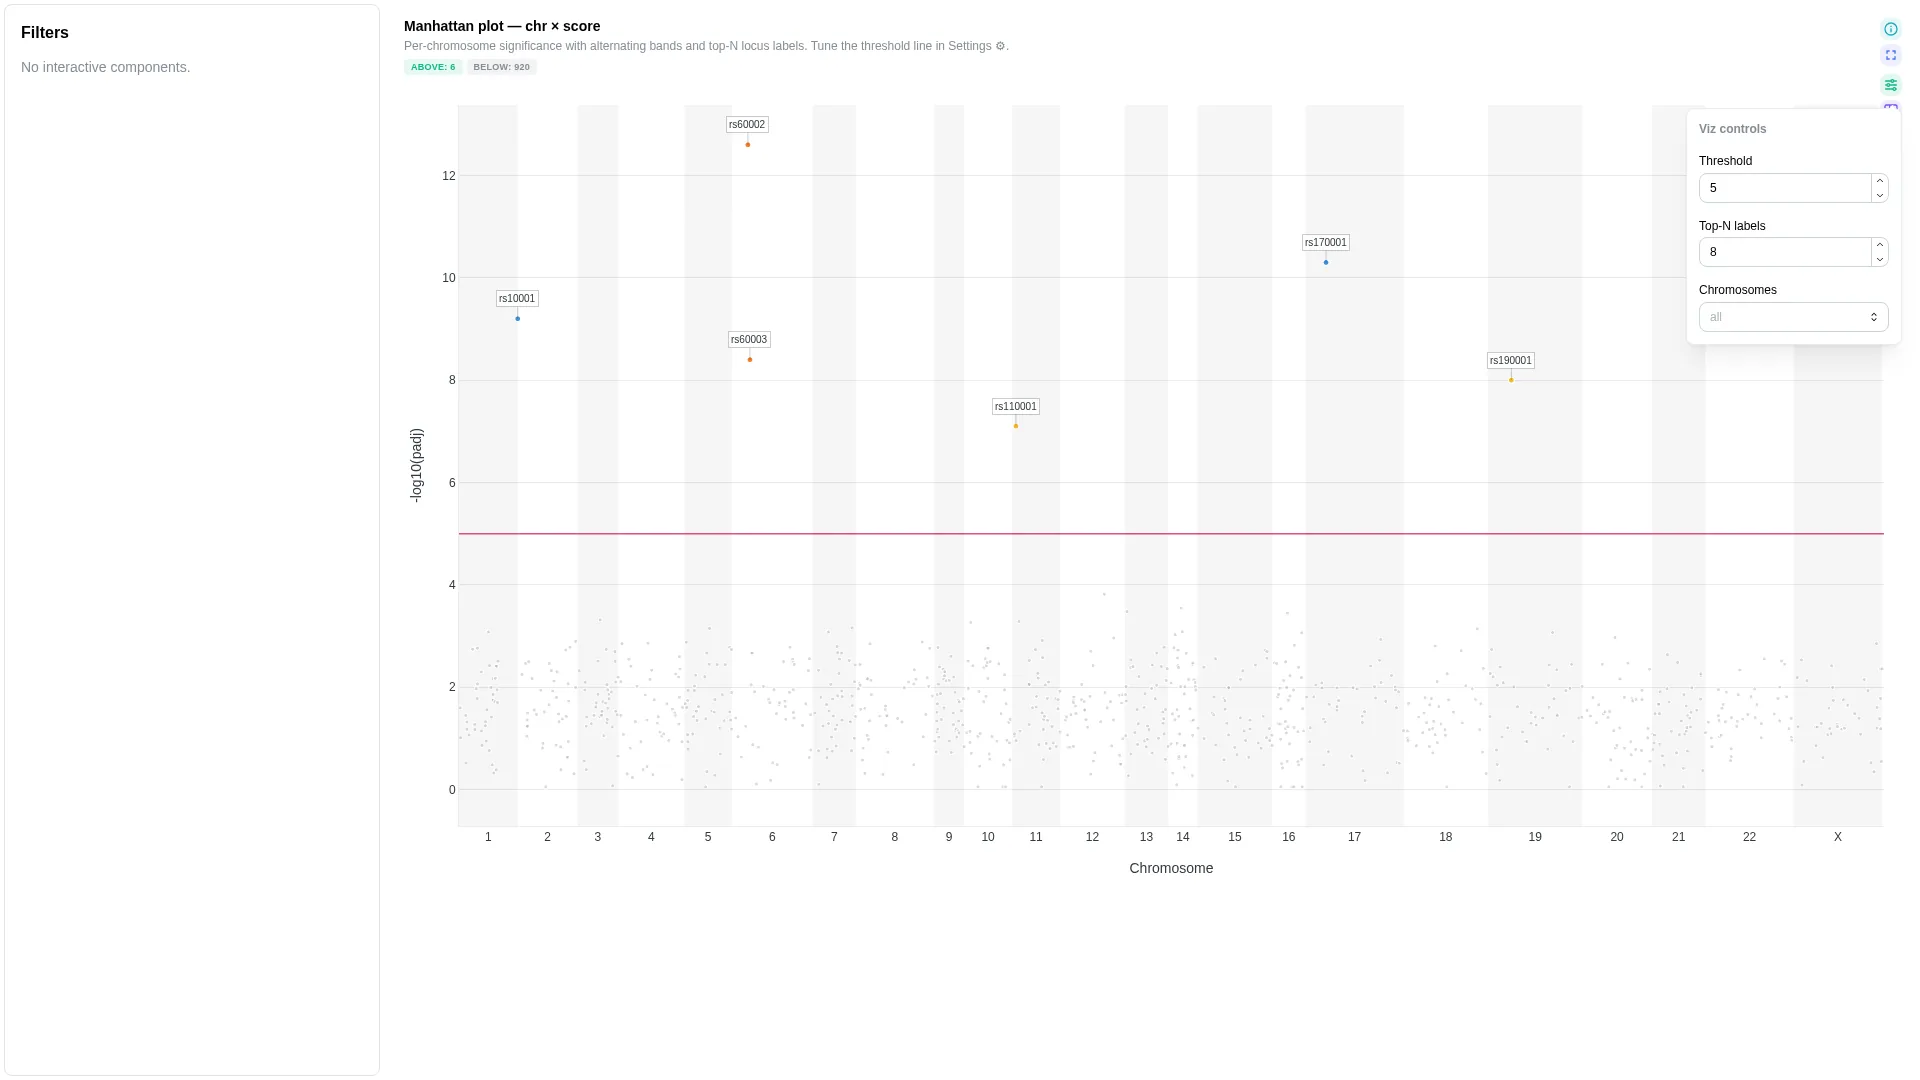
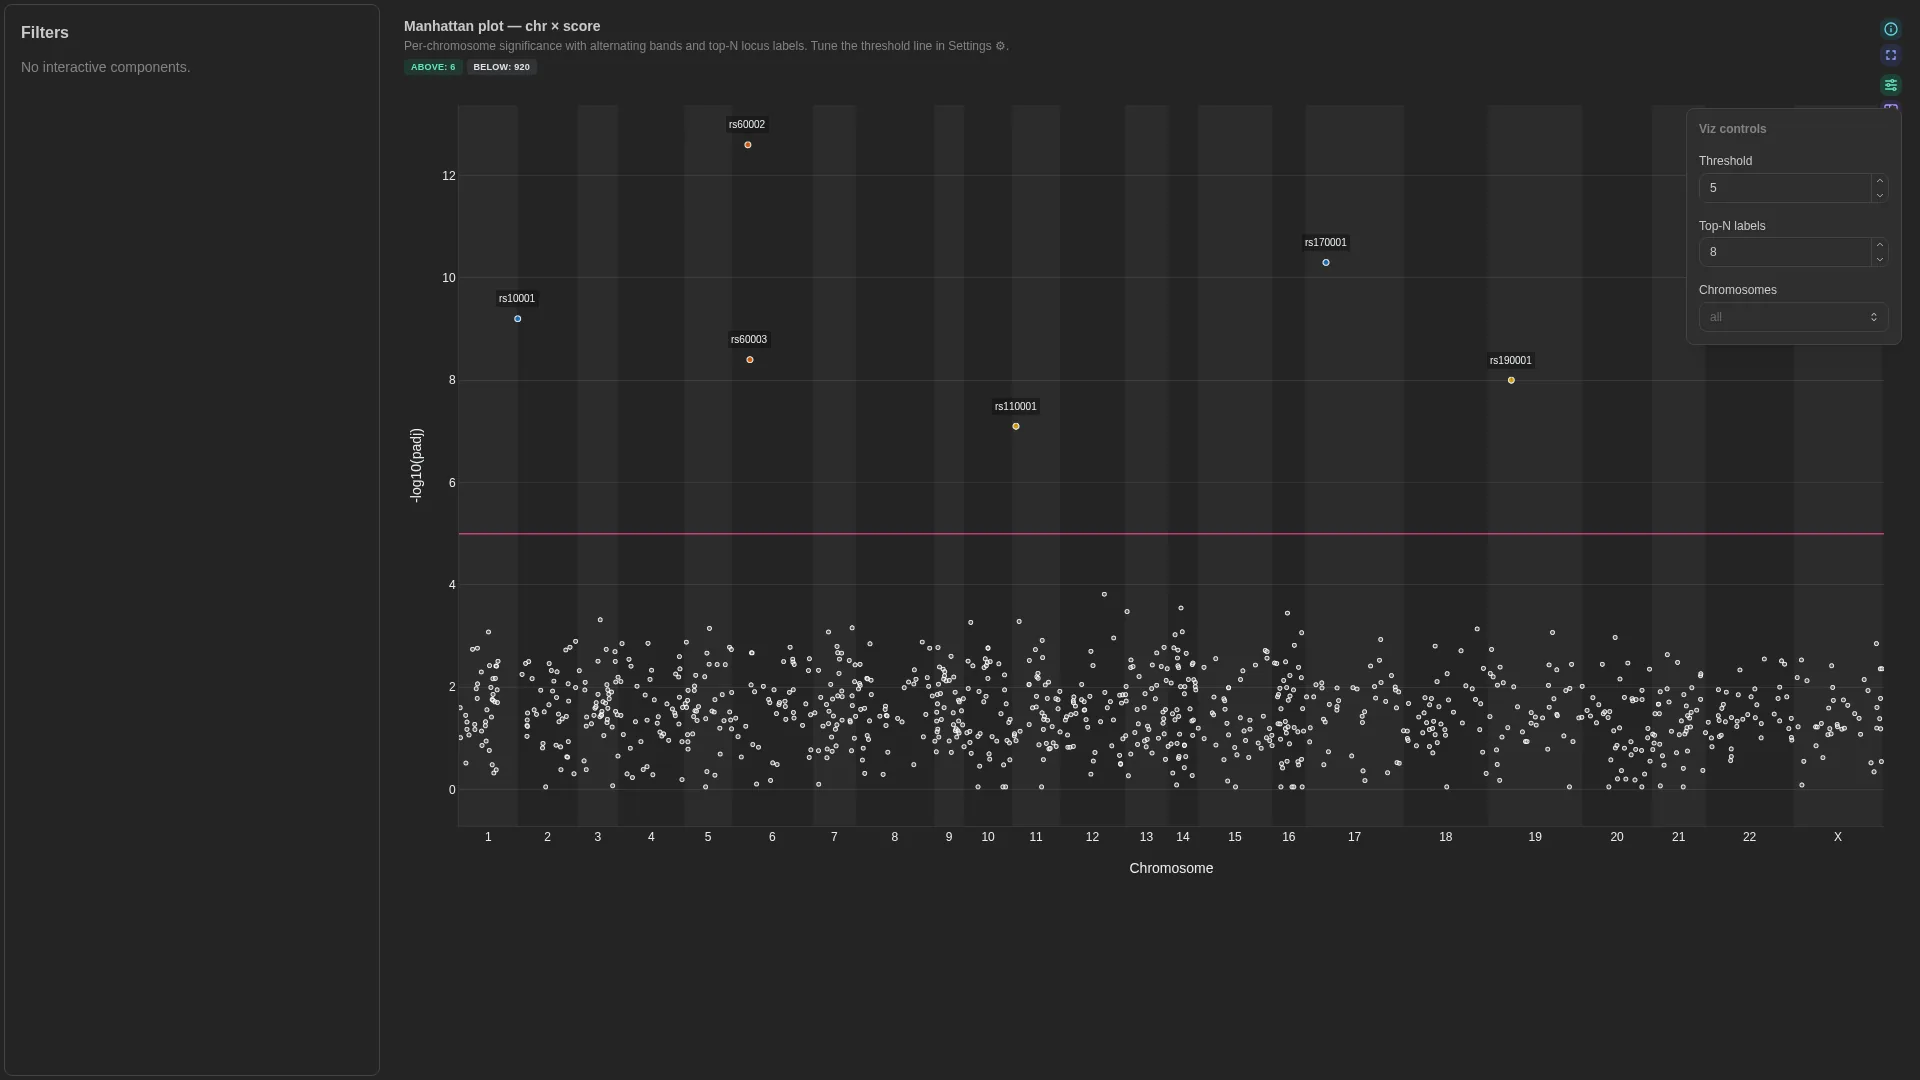 Manhattan v0.13.0+
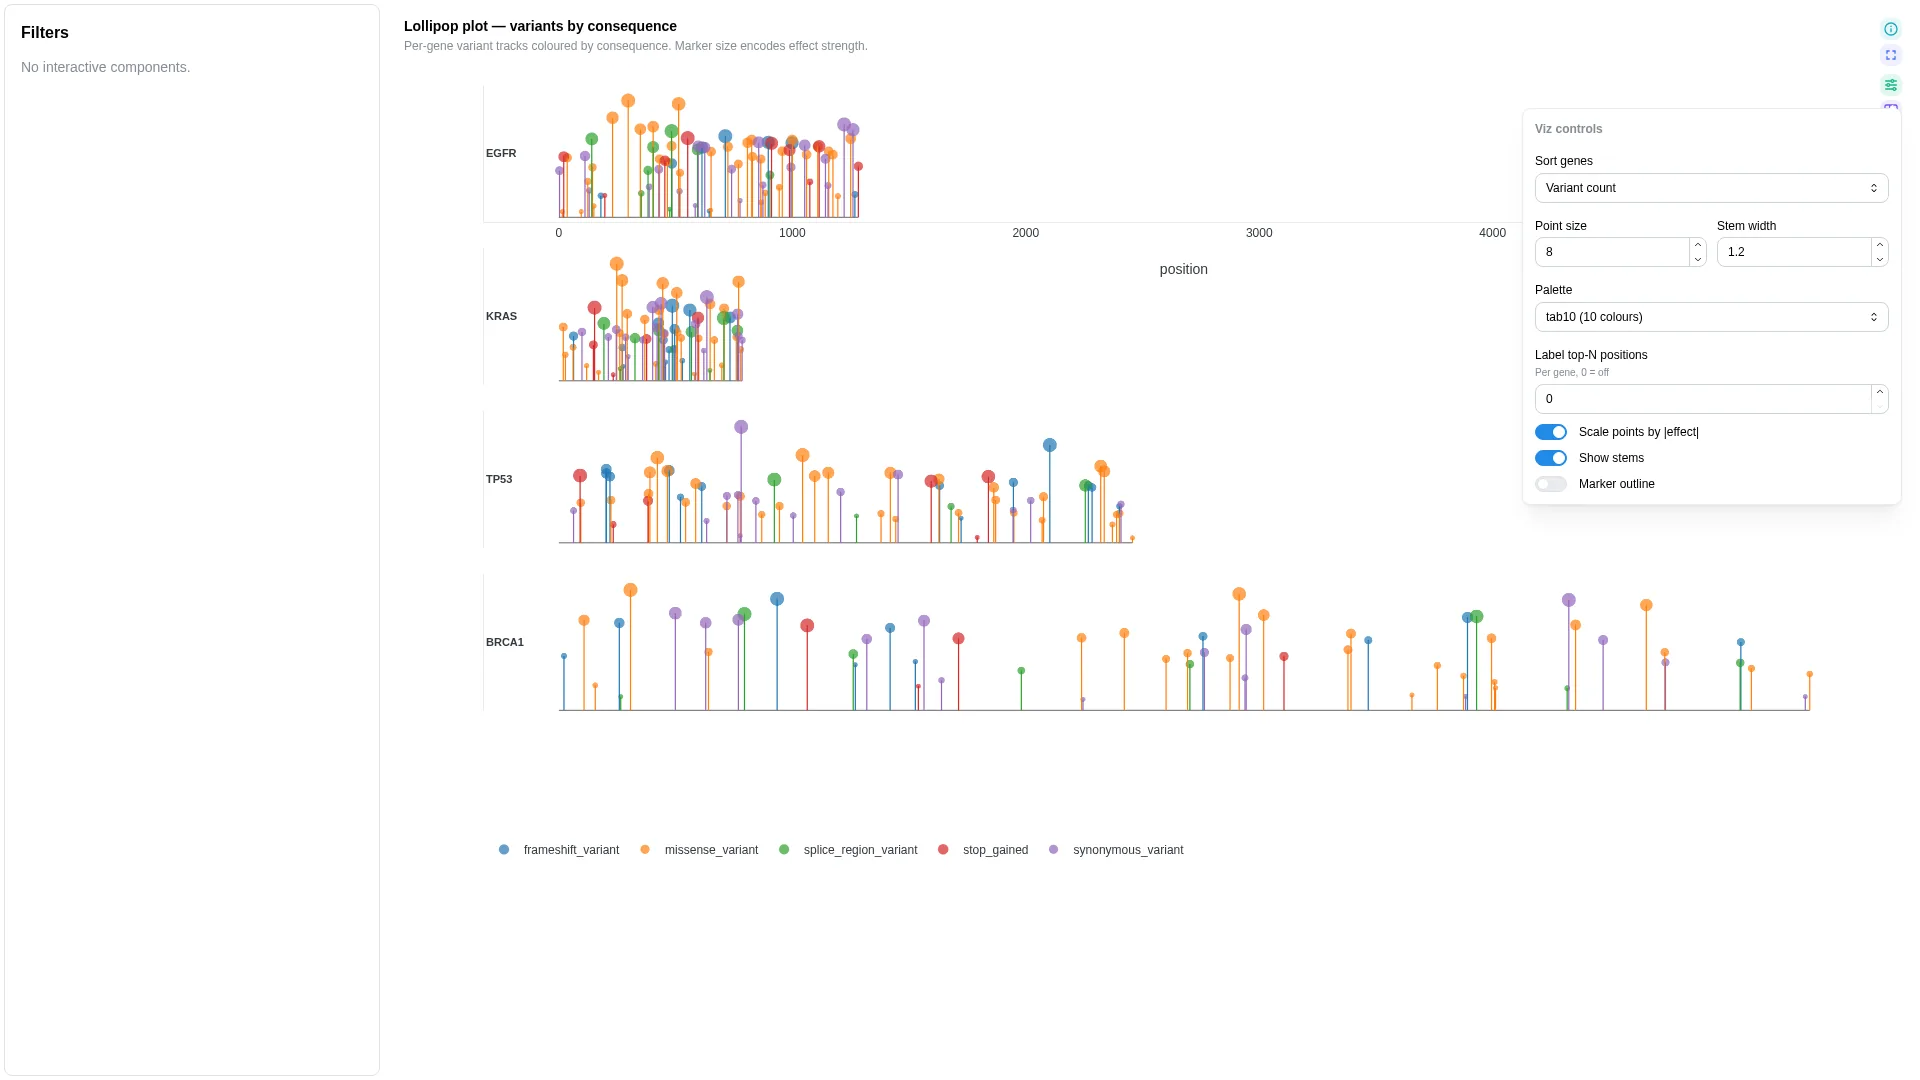
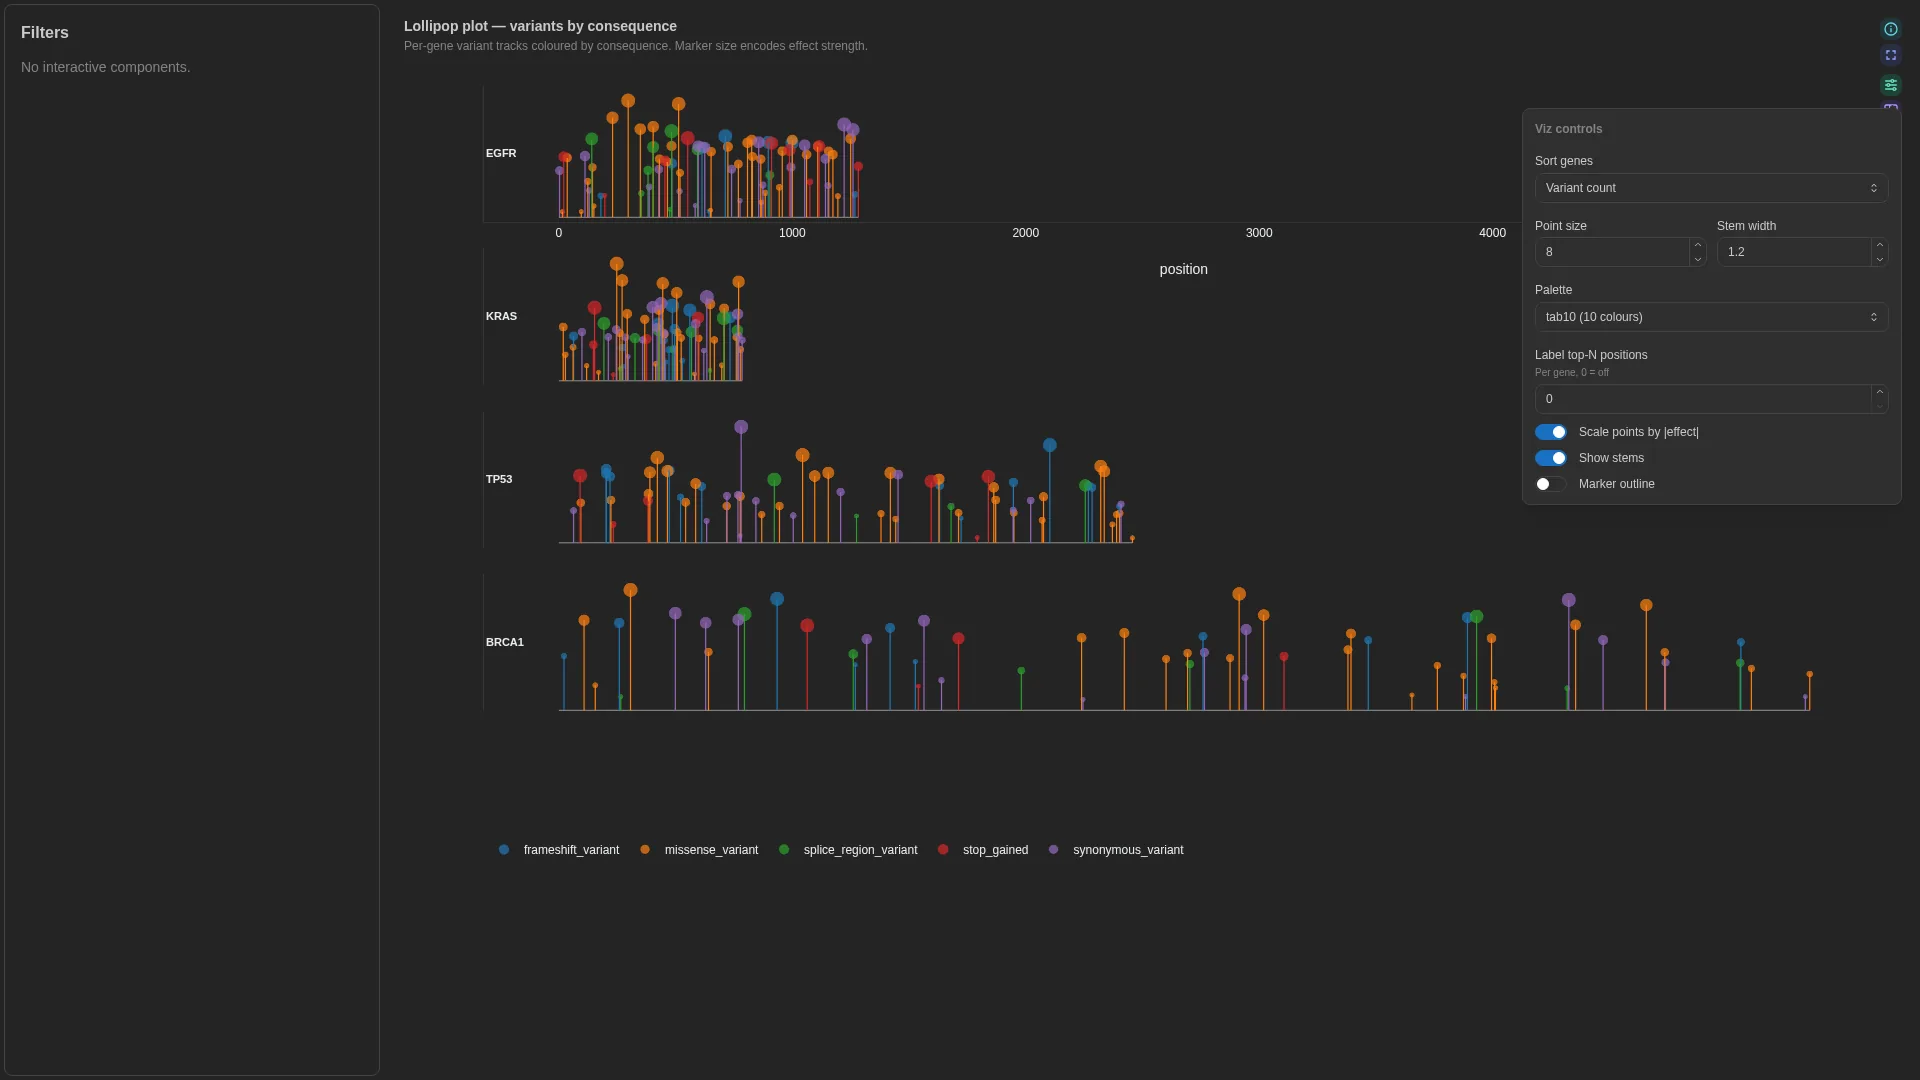 Lollipop v0.13.0+

 Genome chord v1.13.0+
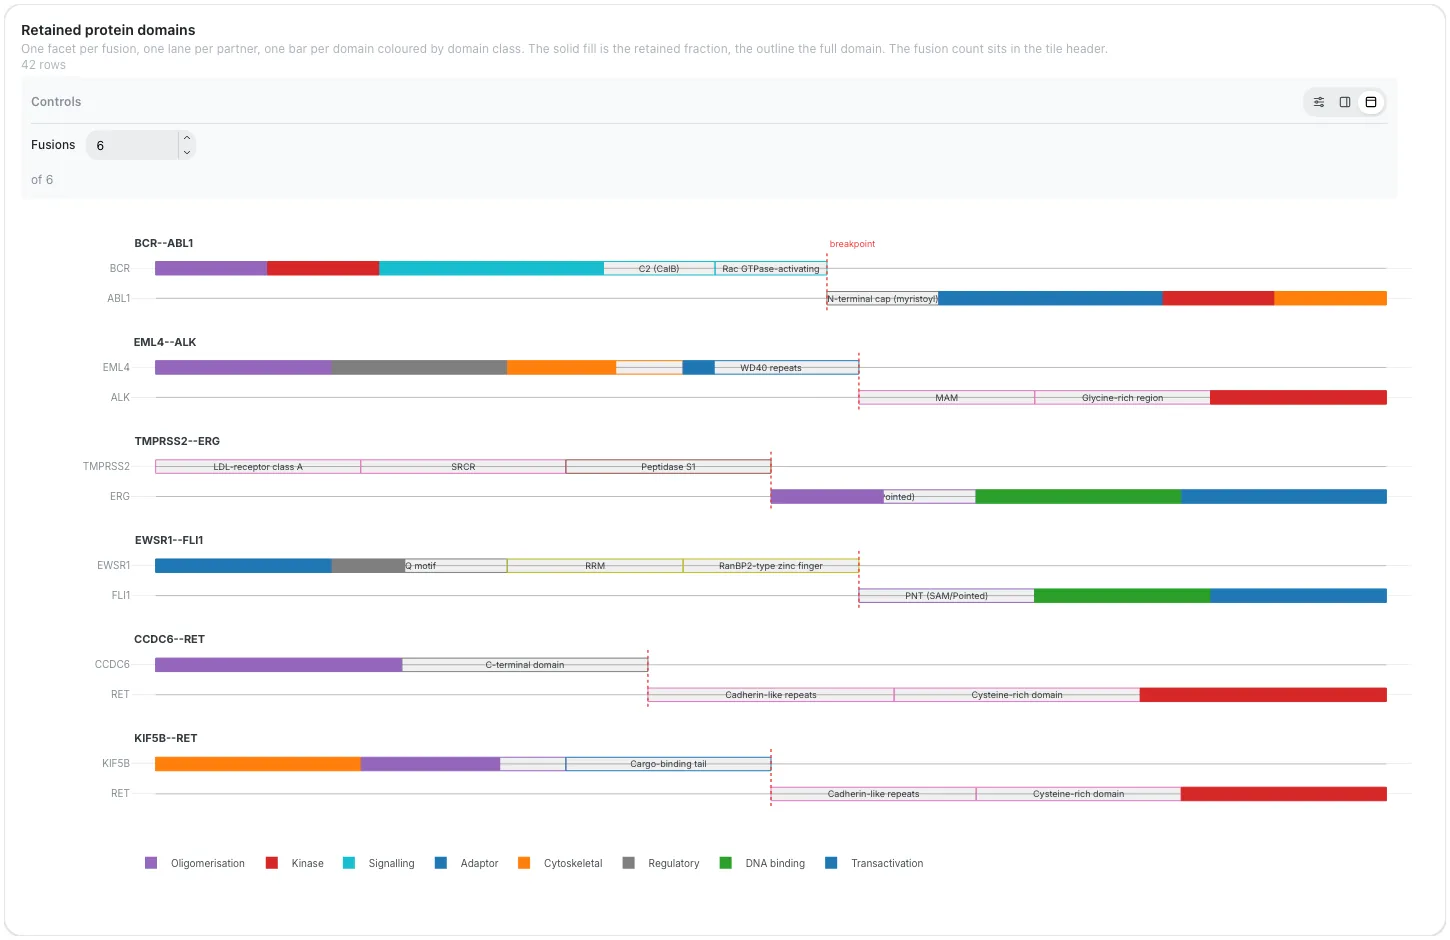
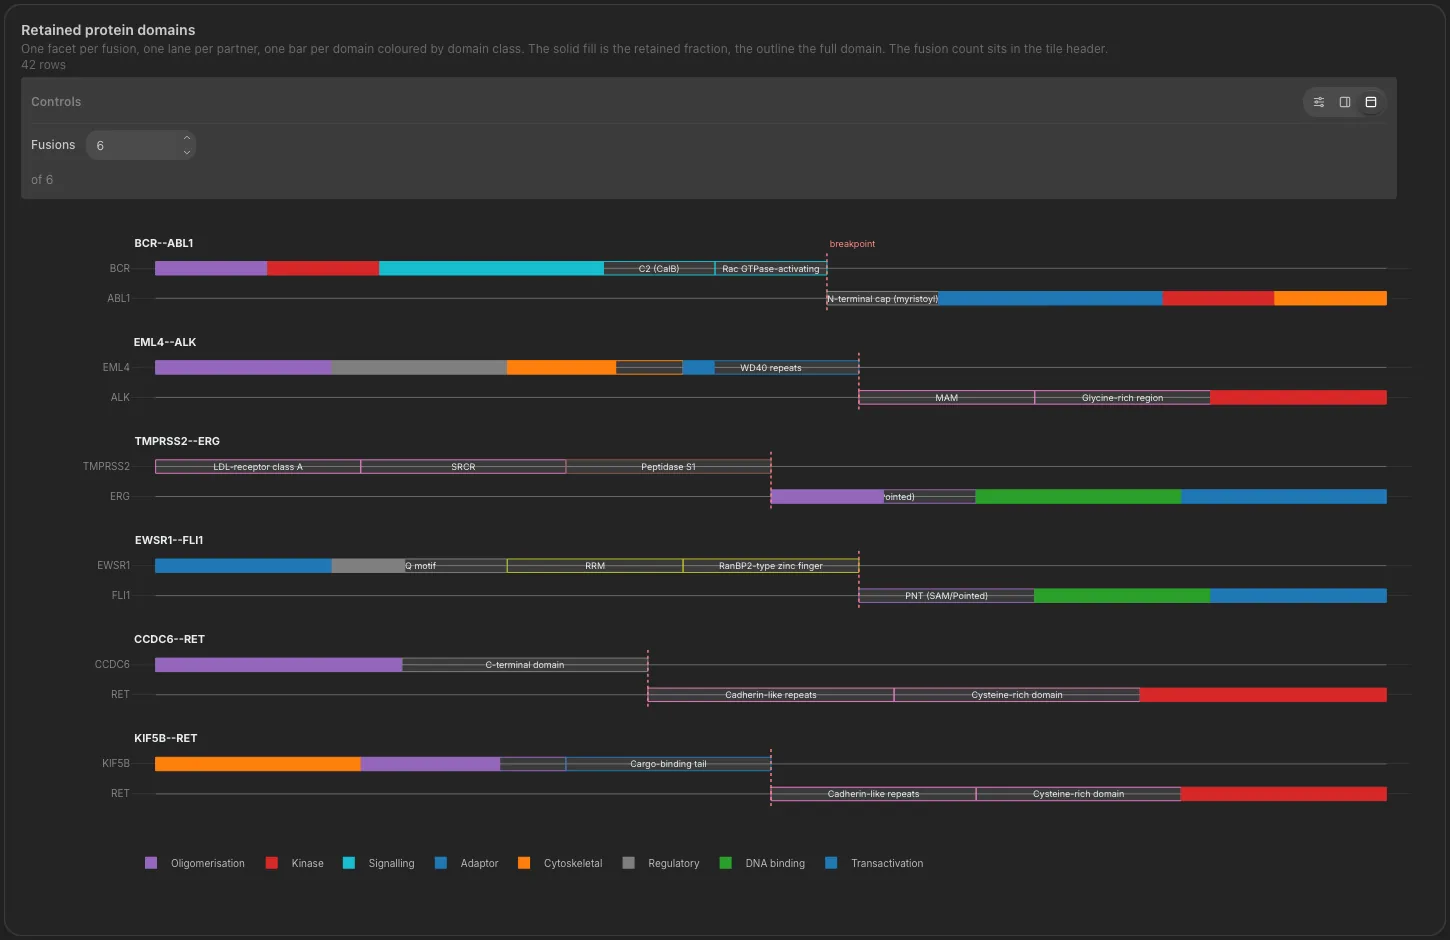 Fusion structure v1.11.0+
Signal & read profiles


Microbiome & ecology
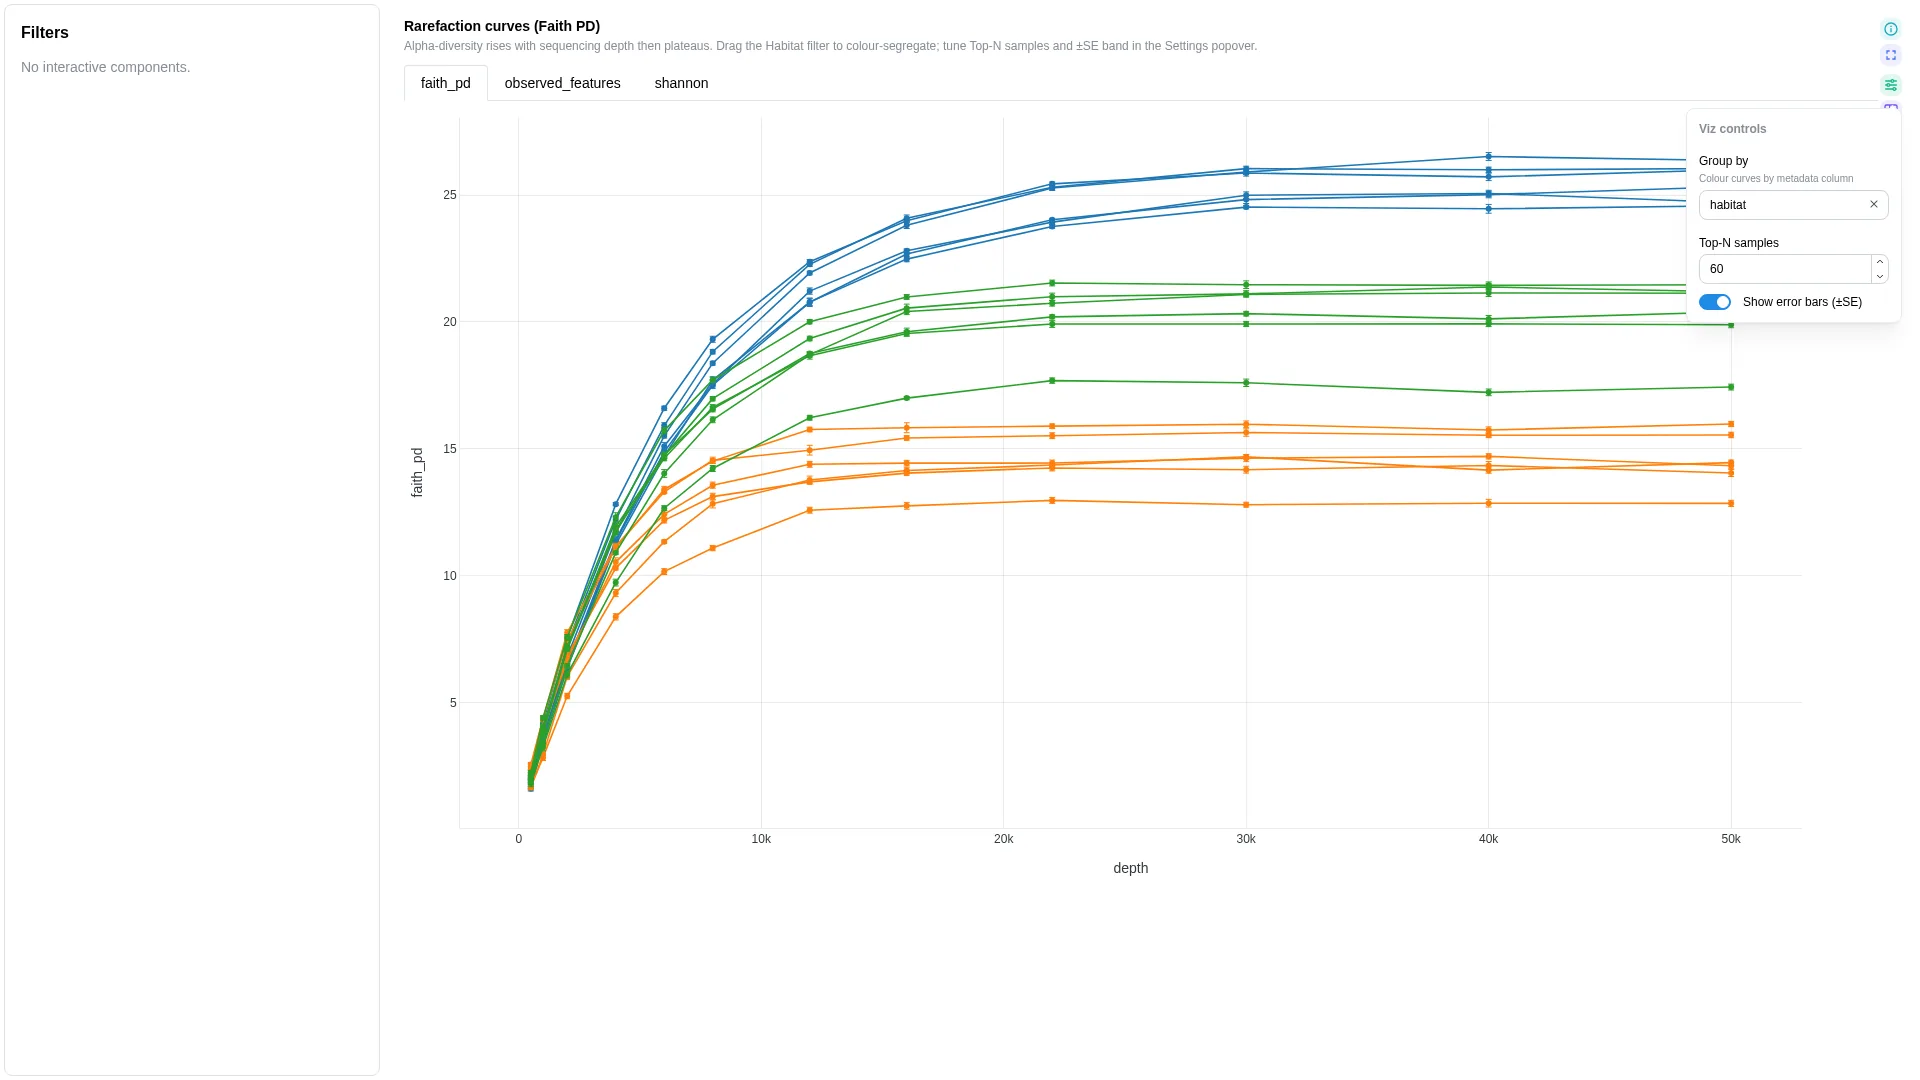
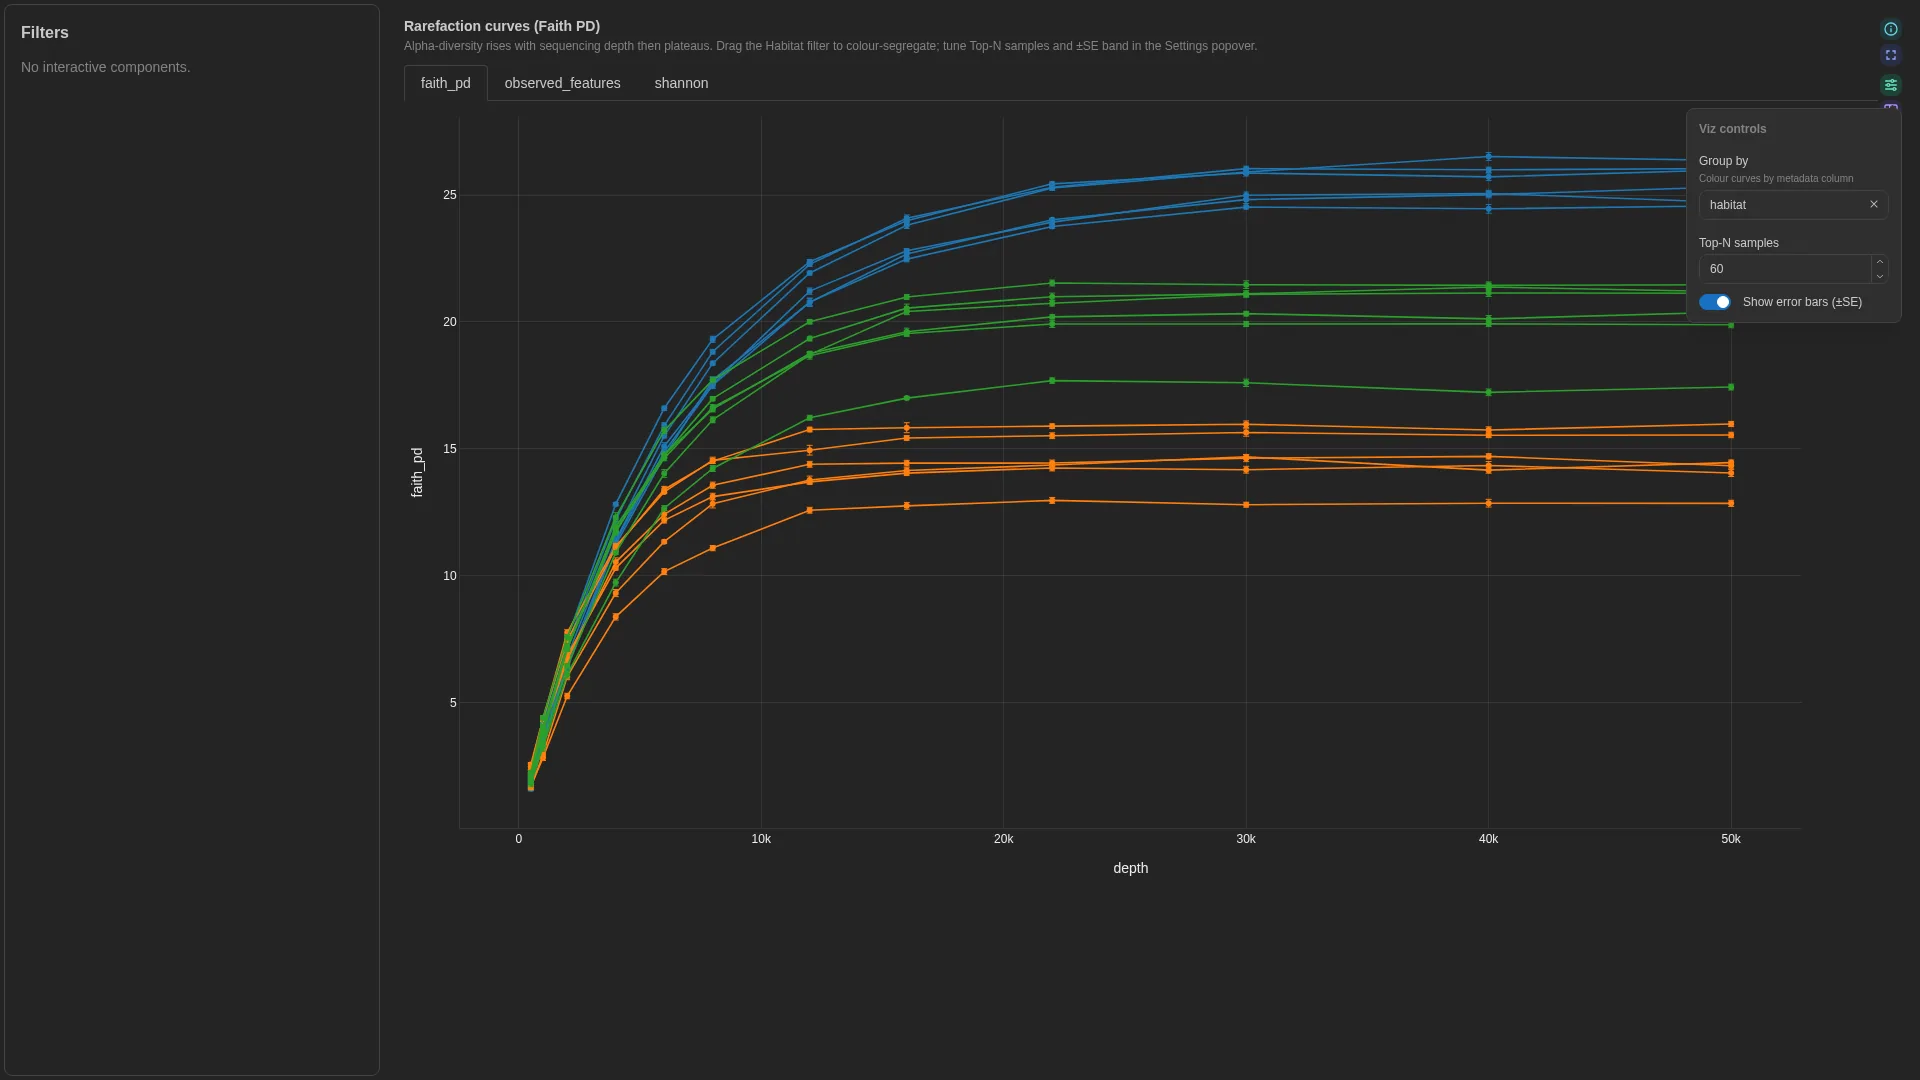
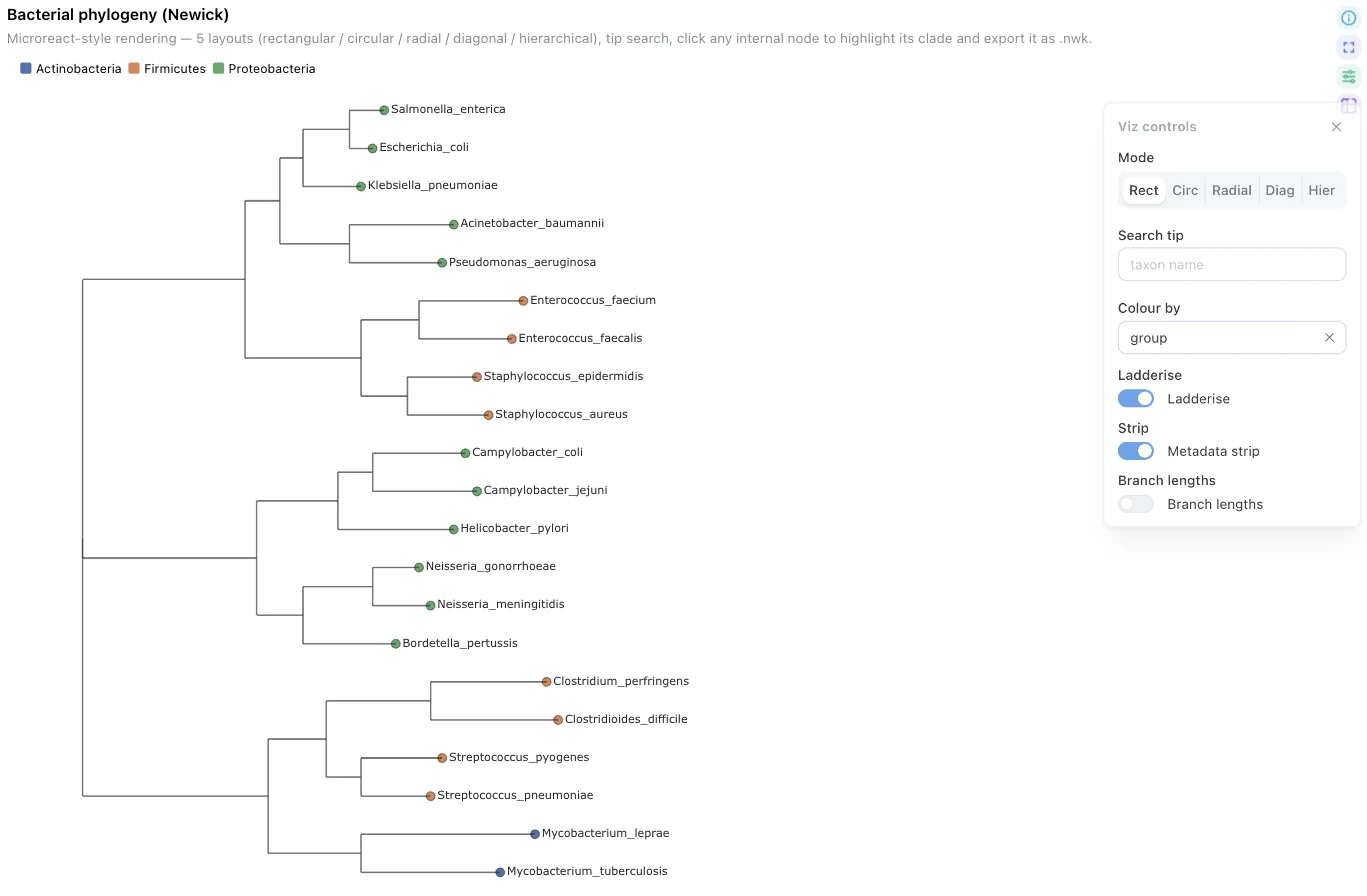
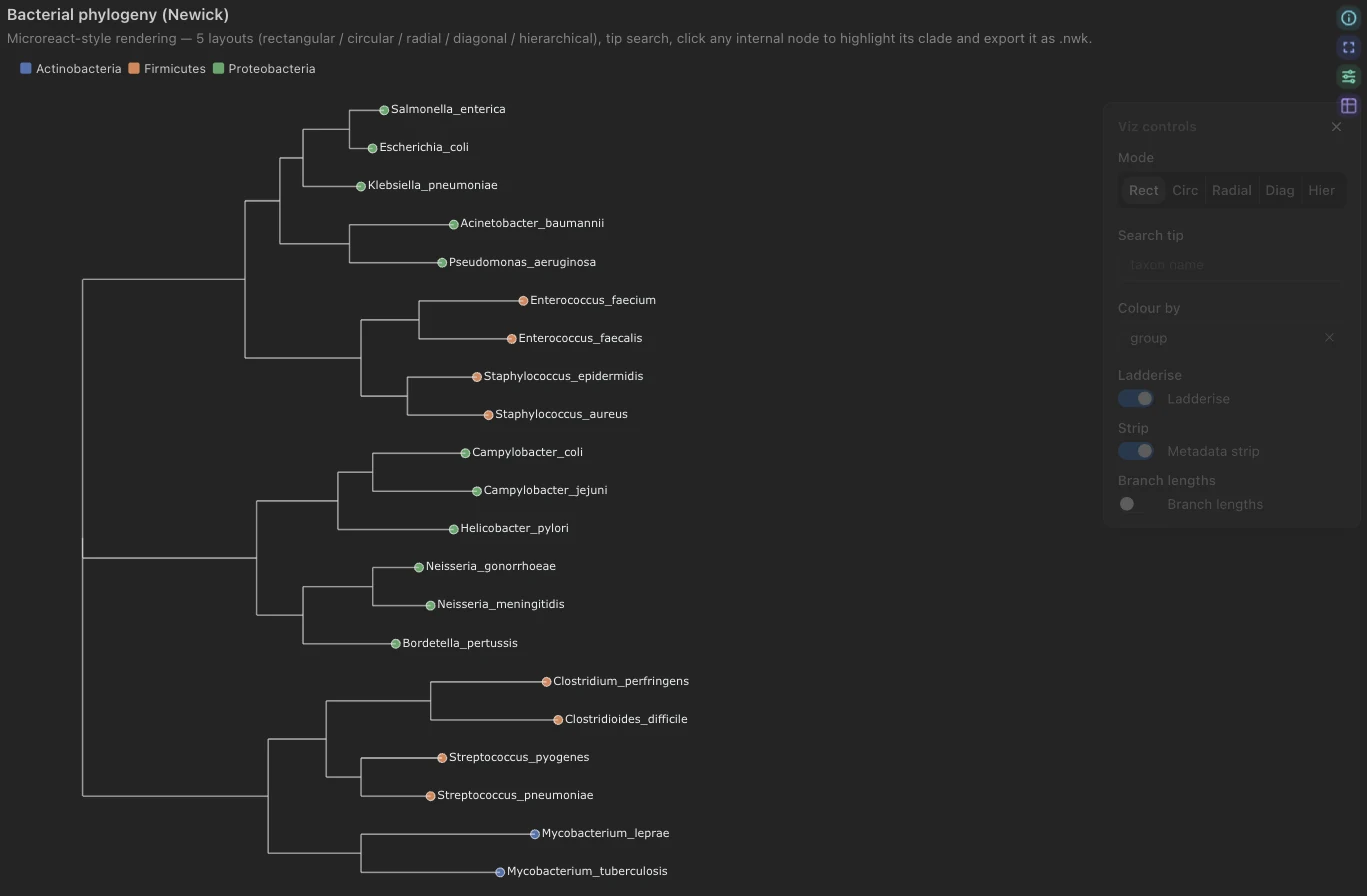
Samples & specimens
General purpose
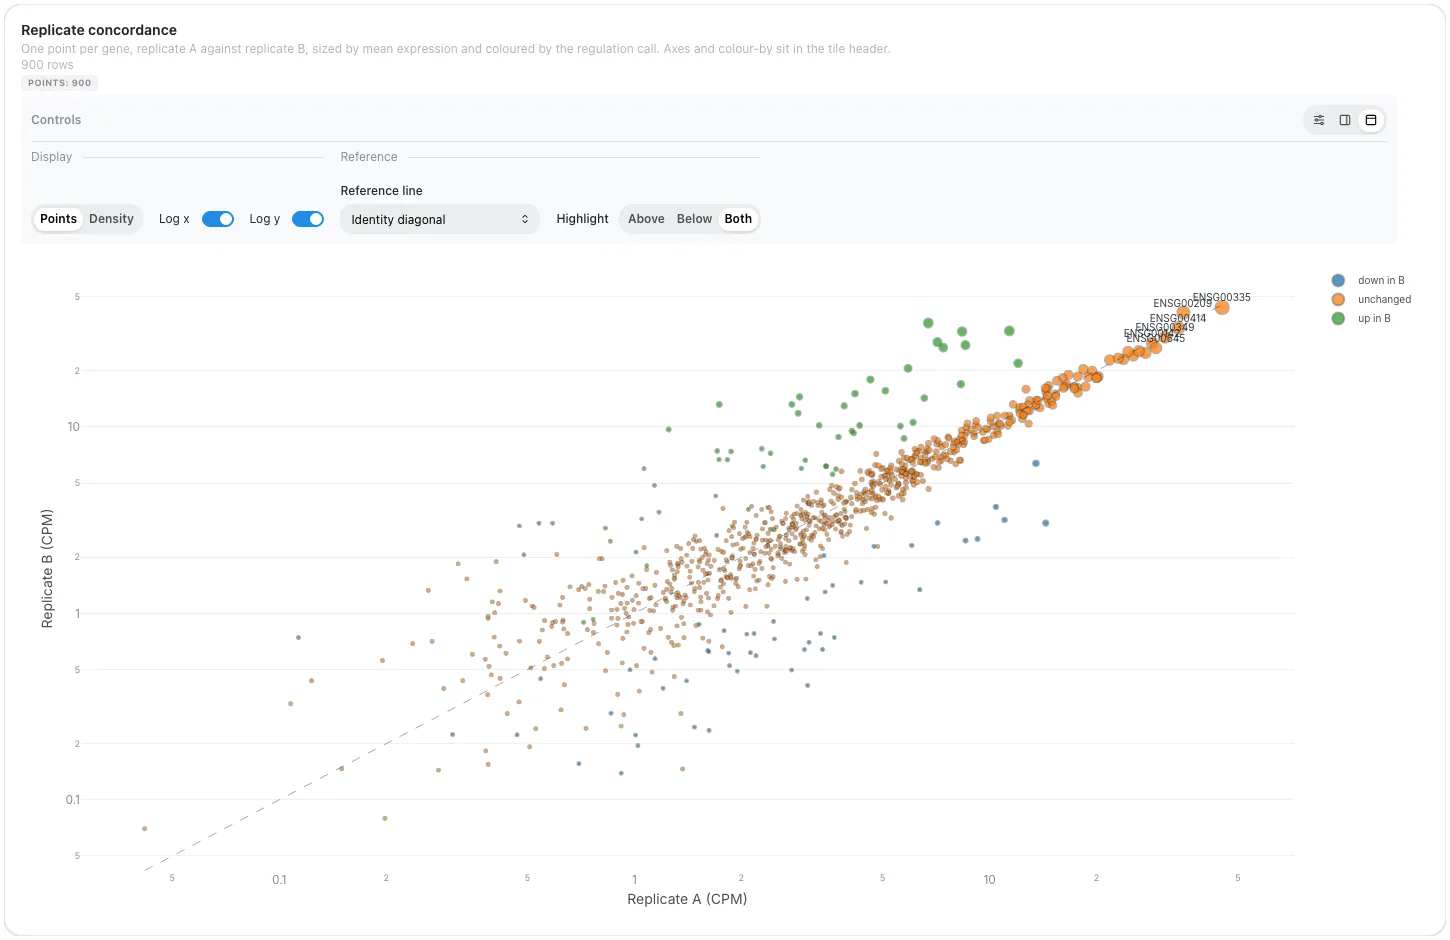
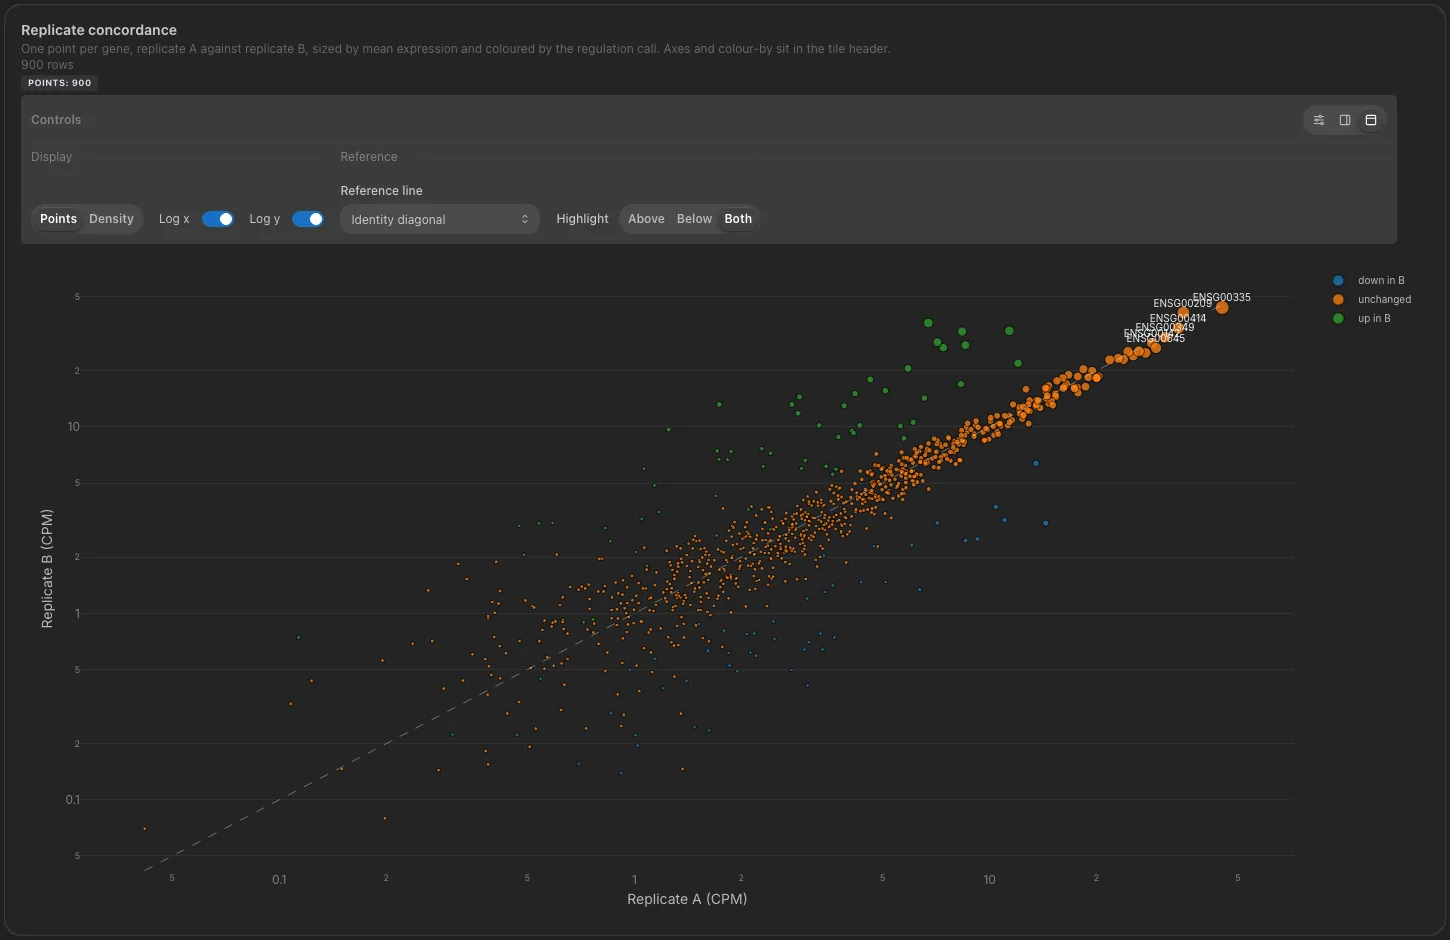 Scatter (X/Y) v1.11.0+
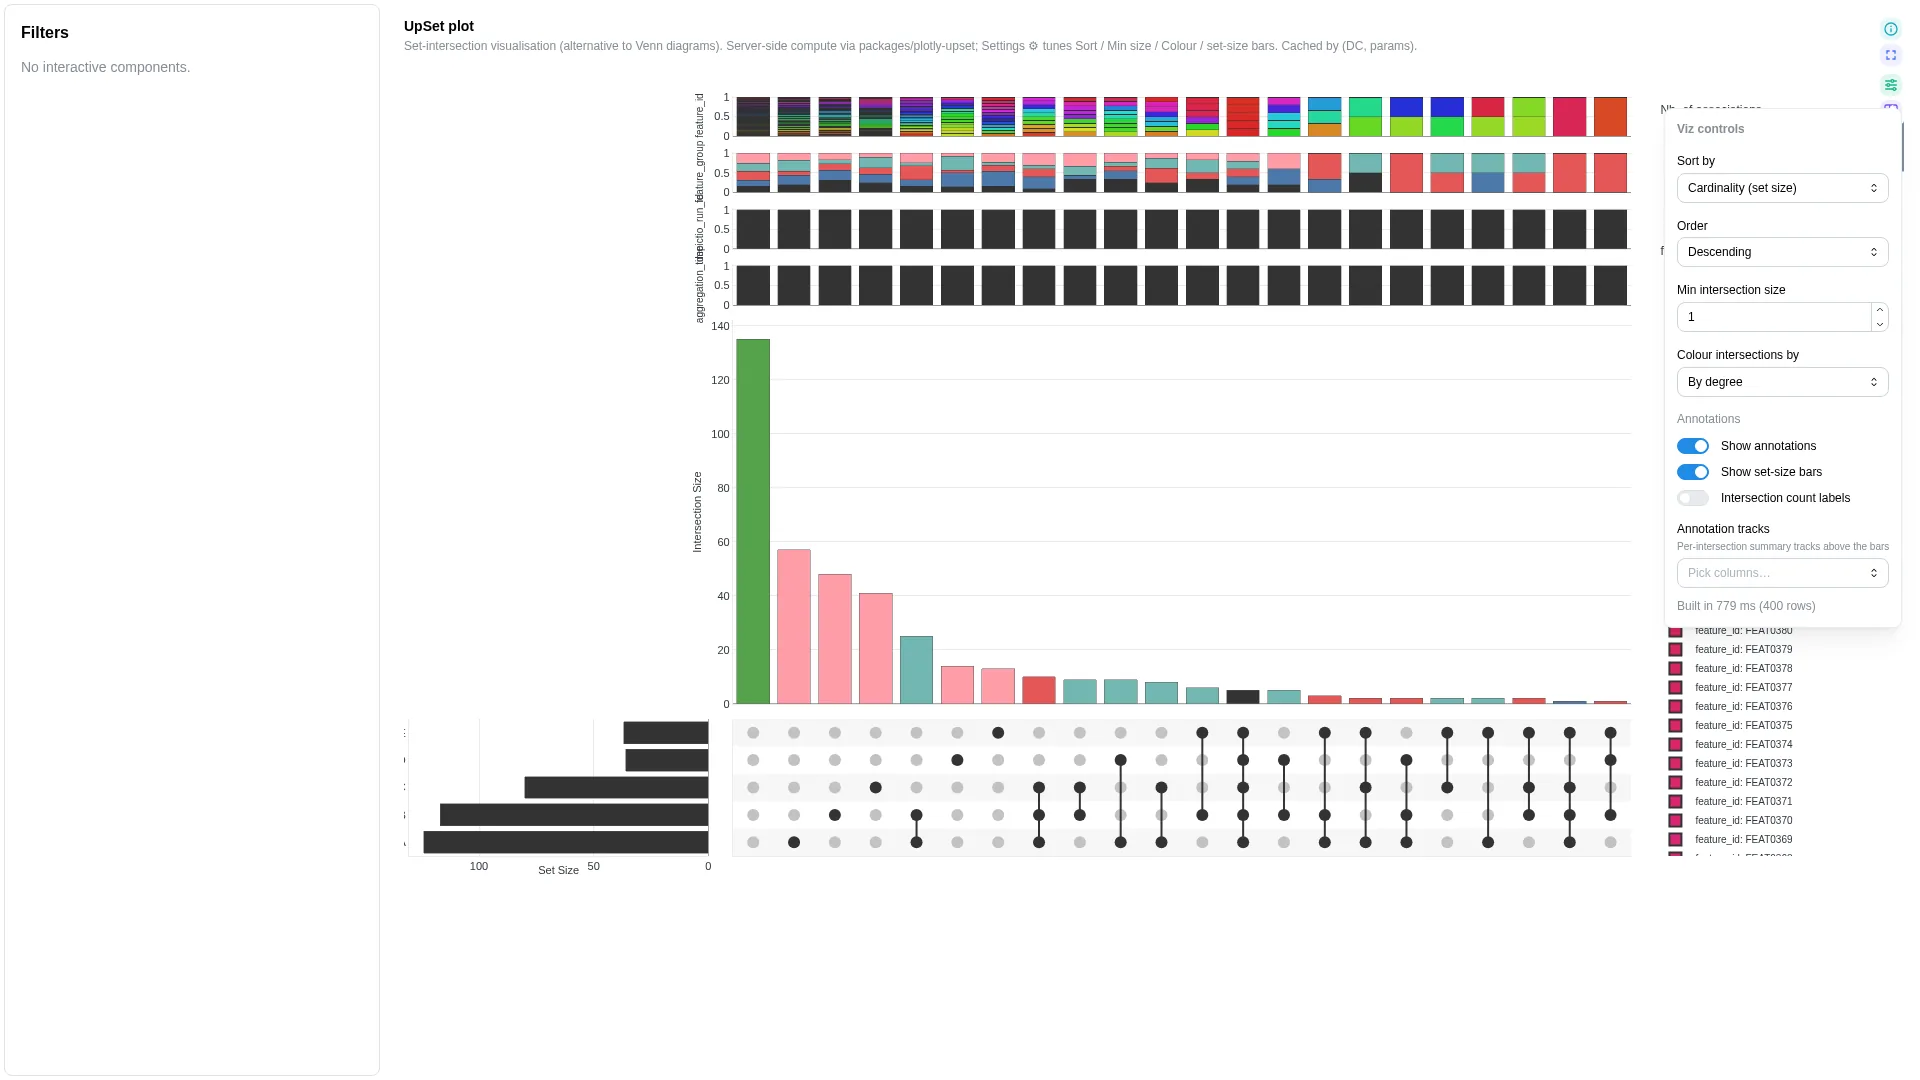
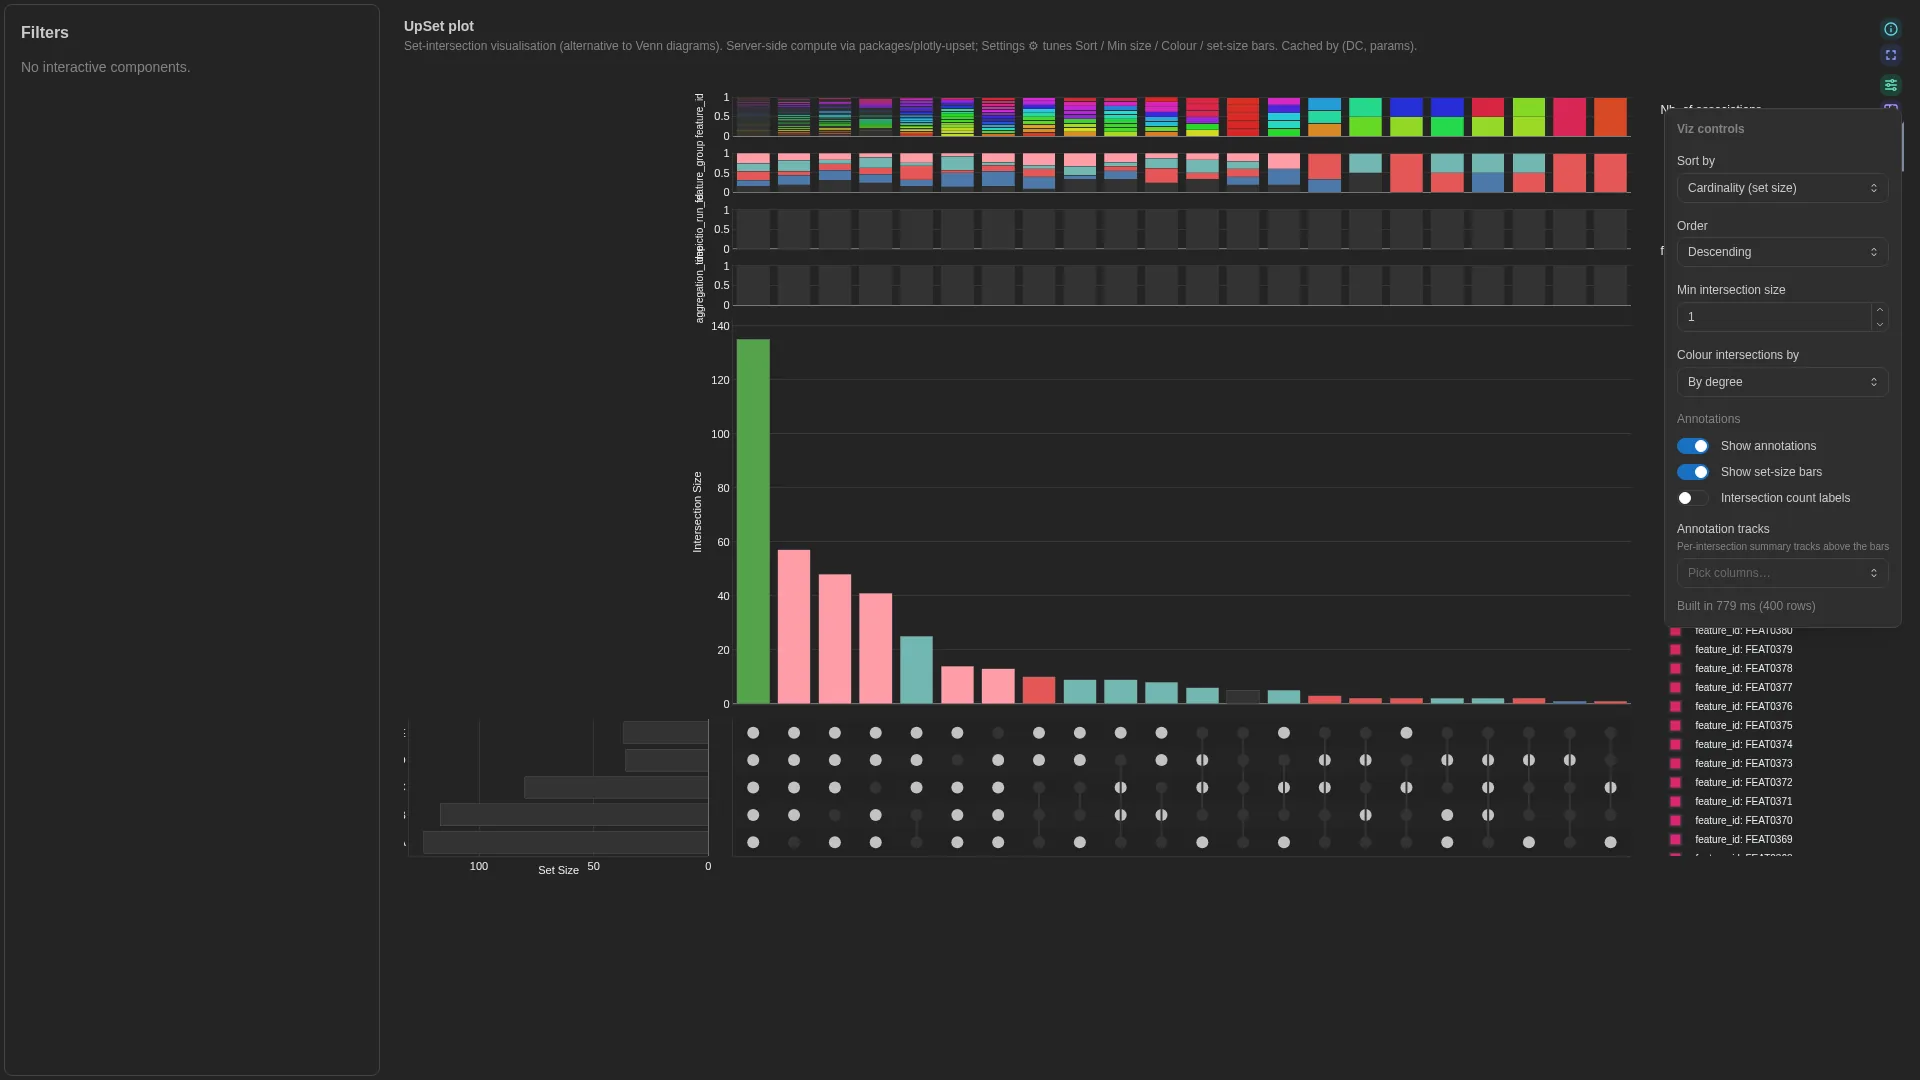 UpSet v0.13.0+

 Parallel coordinates v1.13.0+

 Record card v1.13.0+
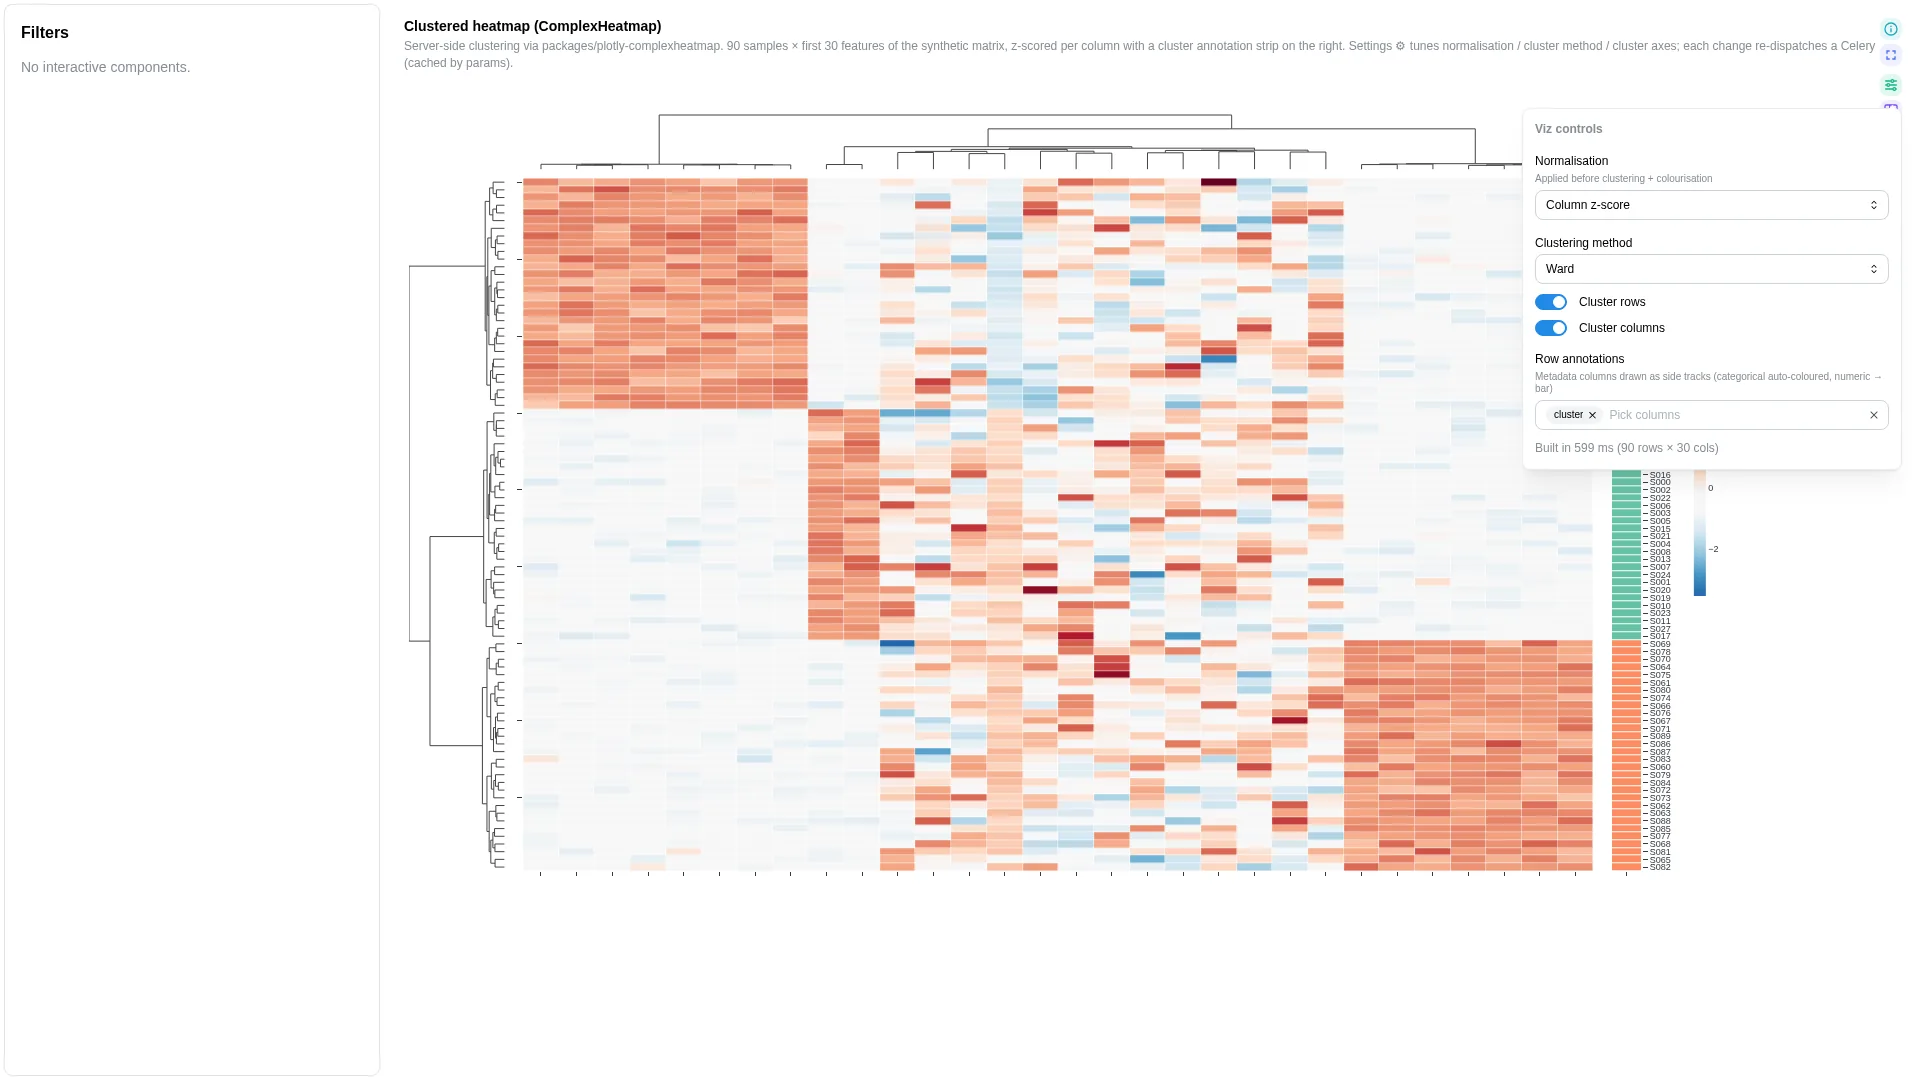
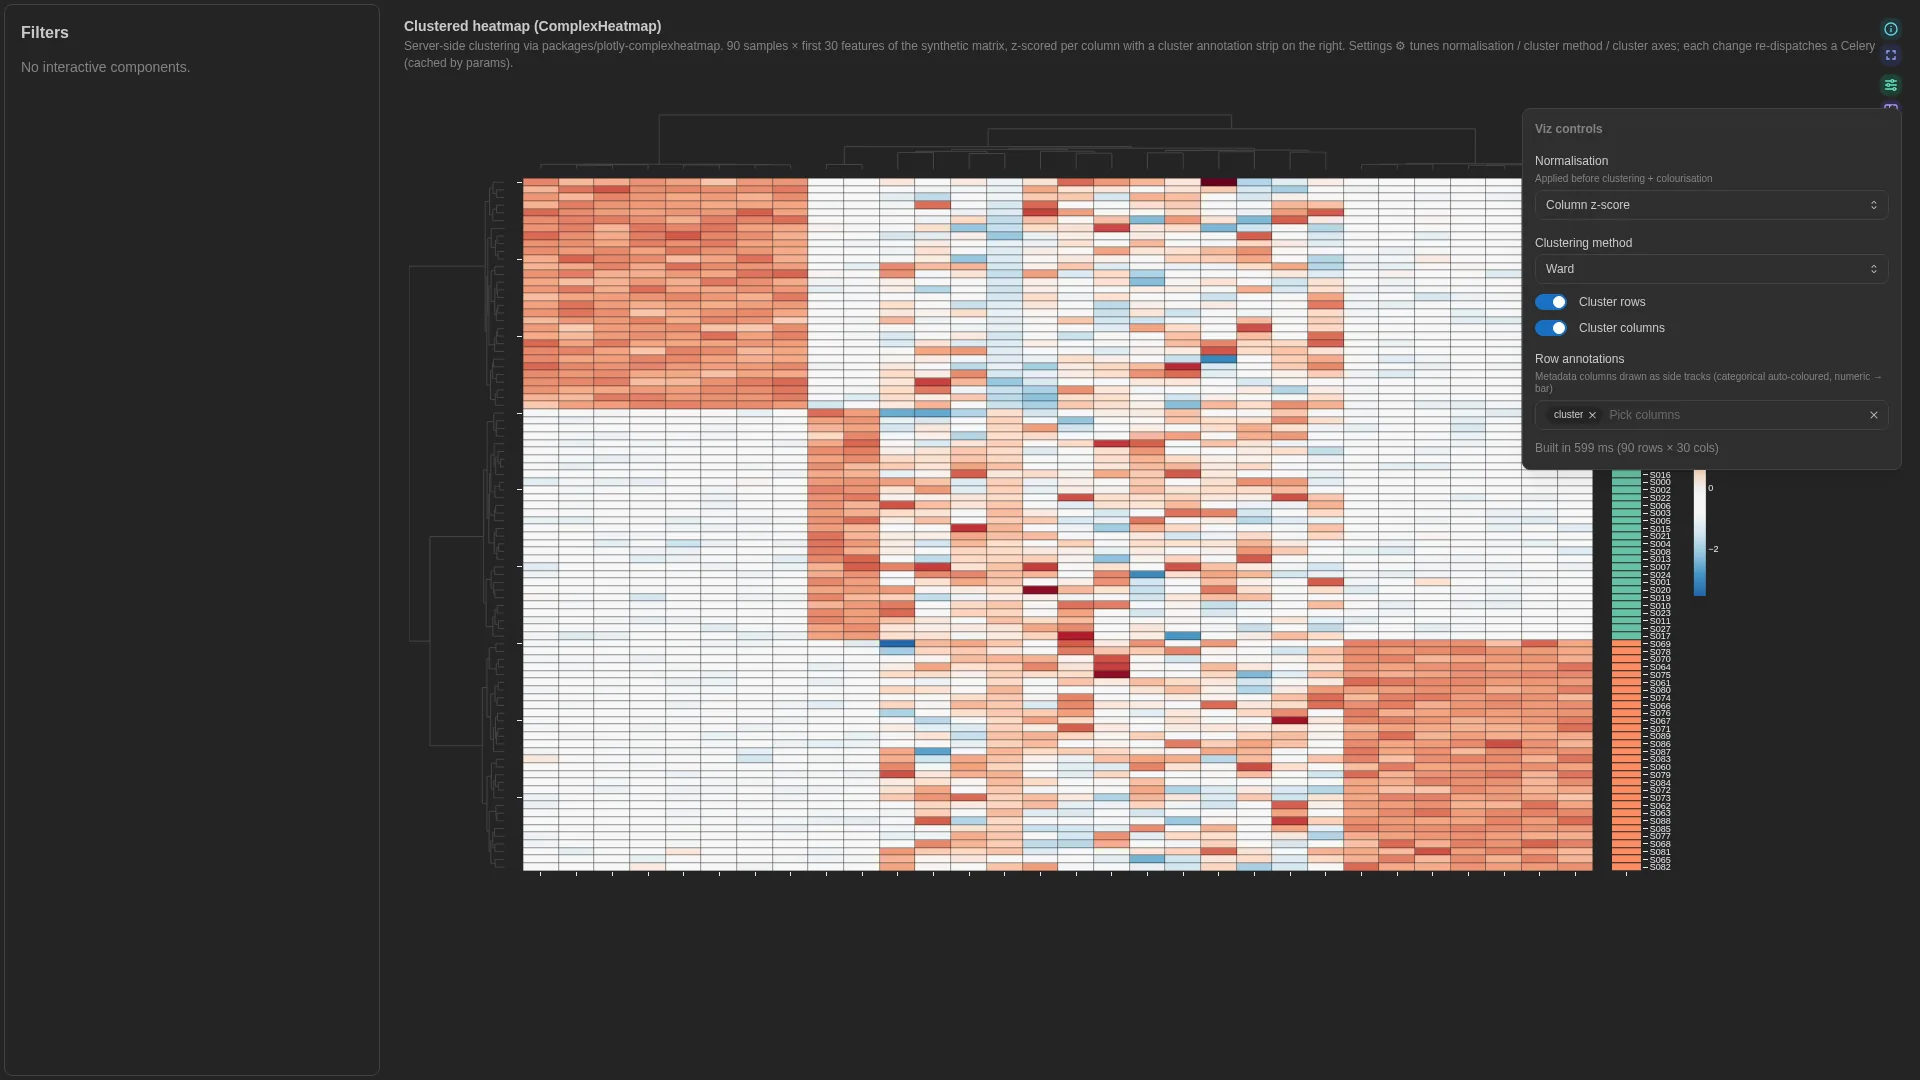 Hierarchical heatmap v0.13.0+
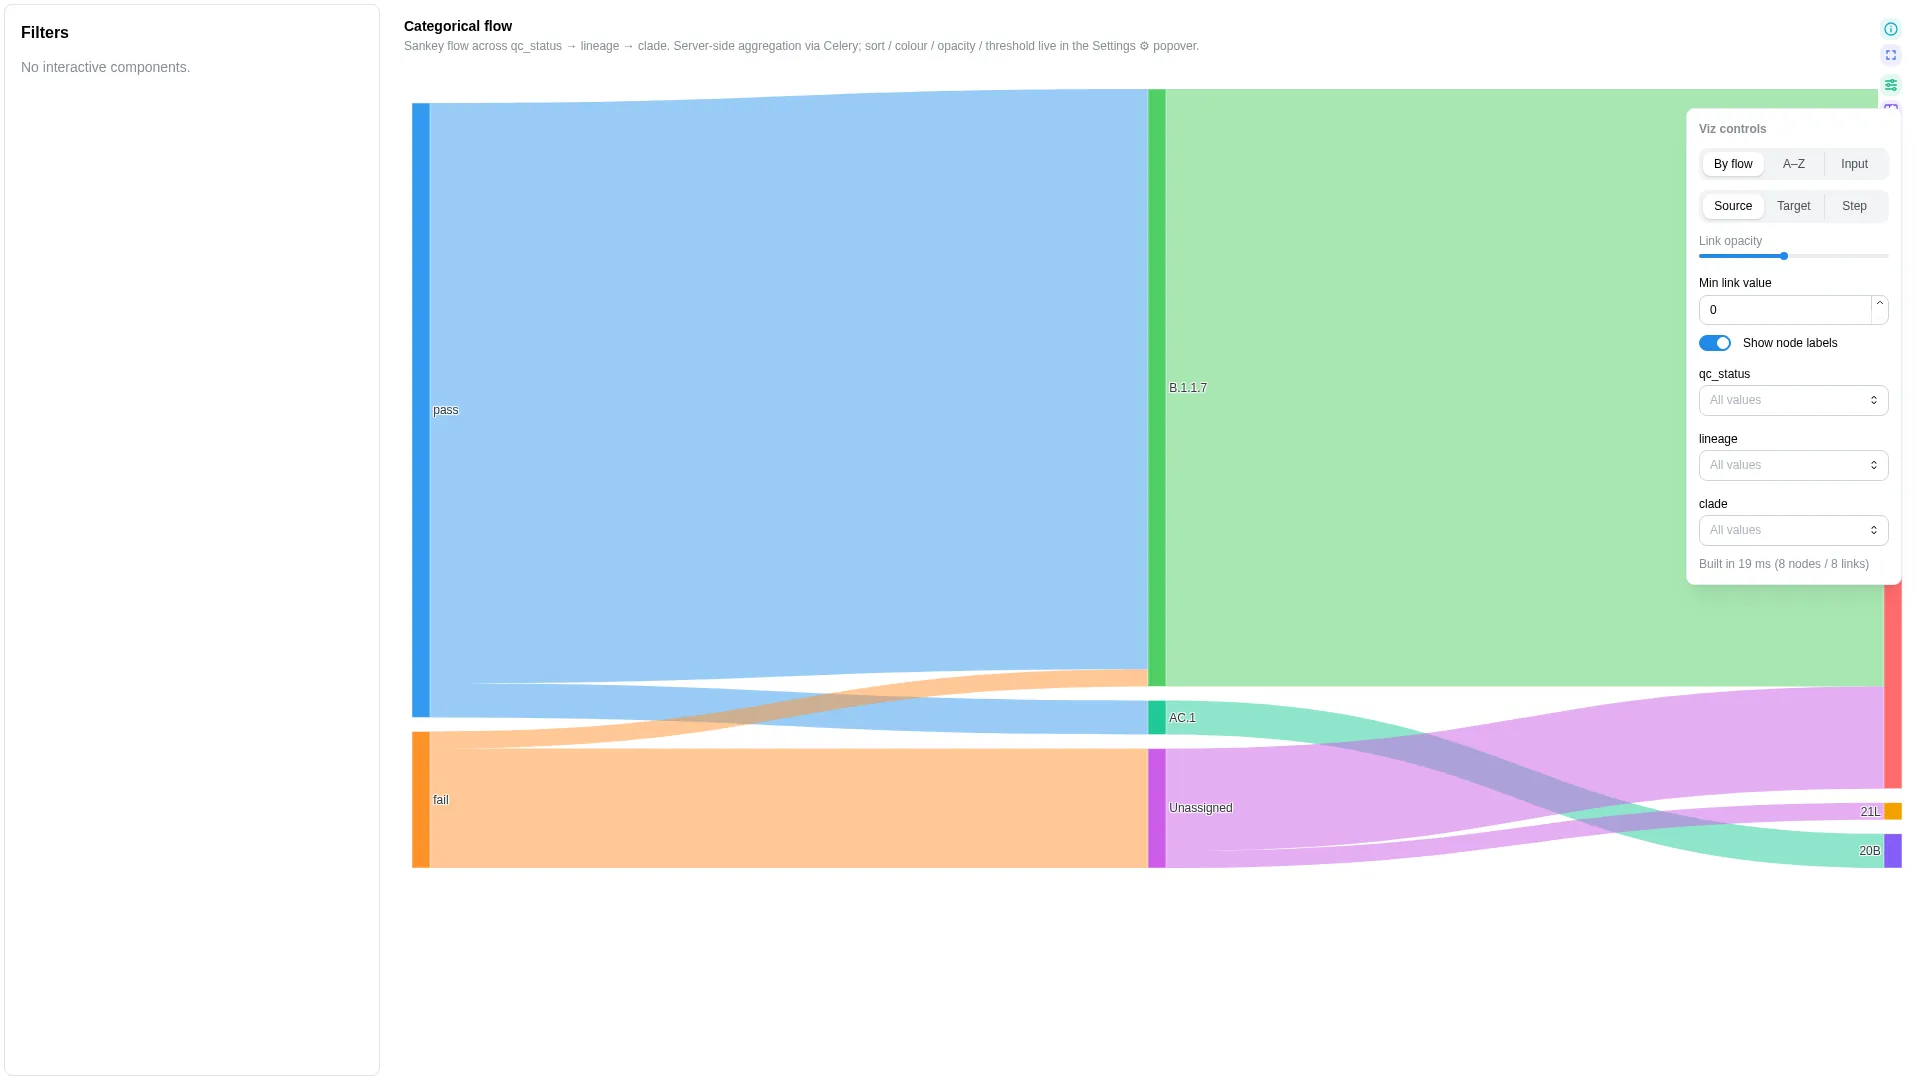
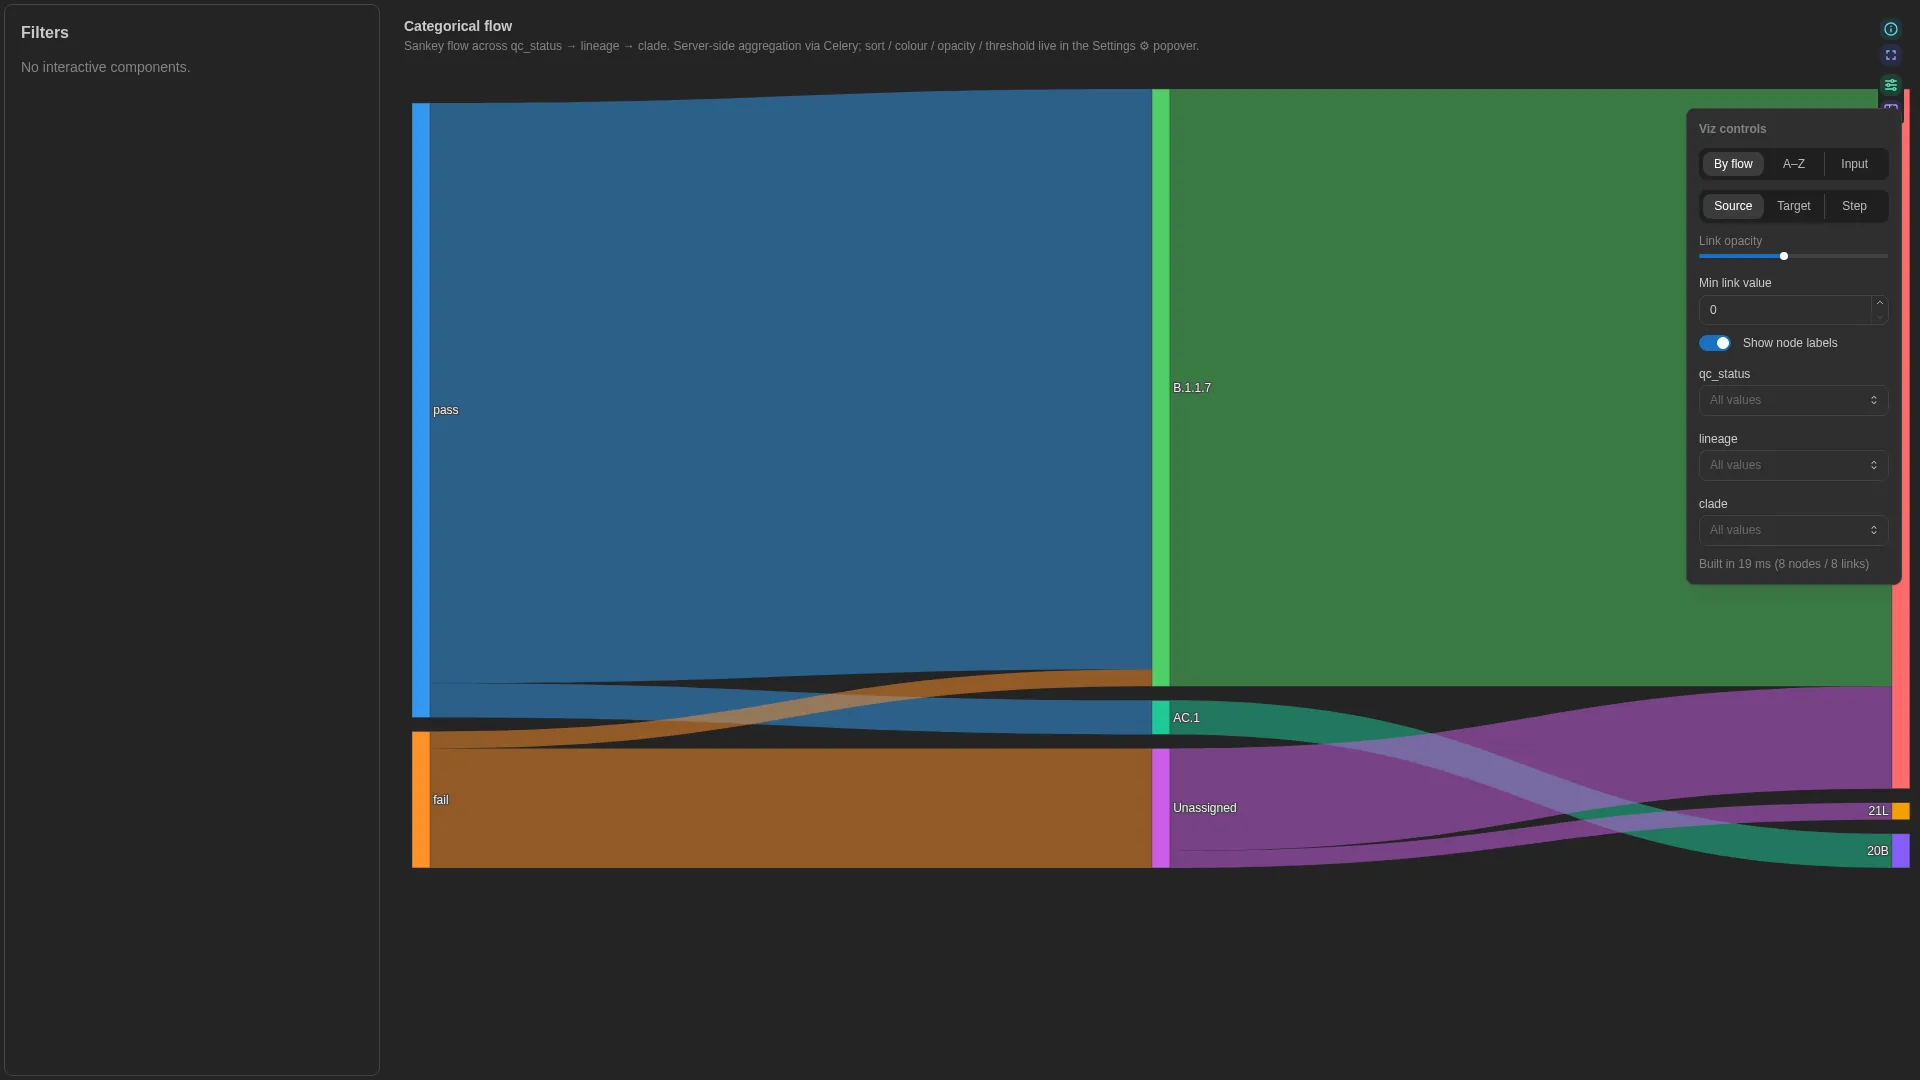 Sankey v0.13.0+
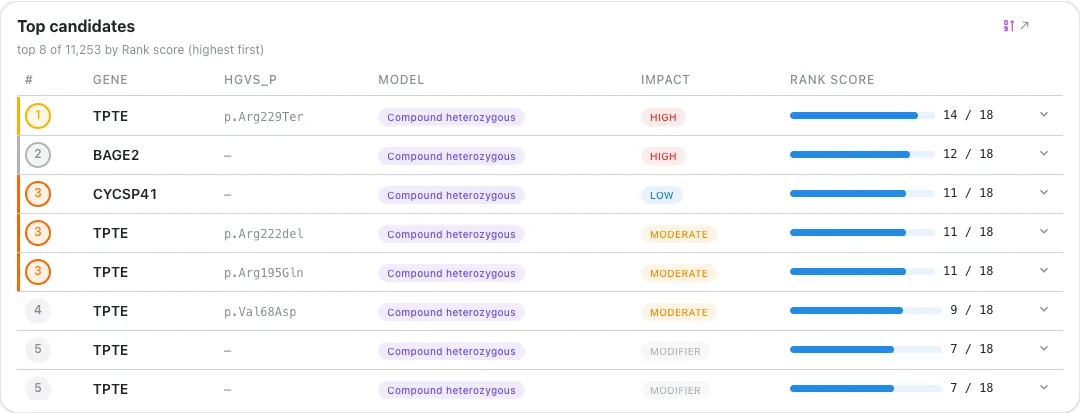
 Ranked table v1.20.0+
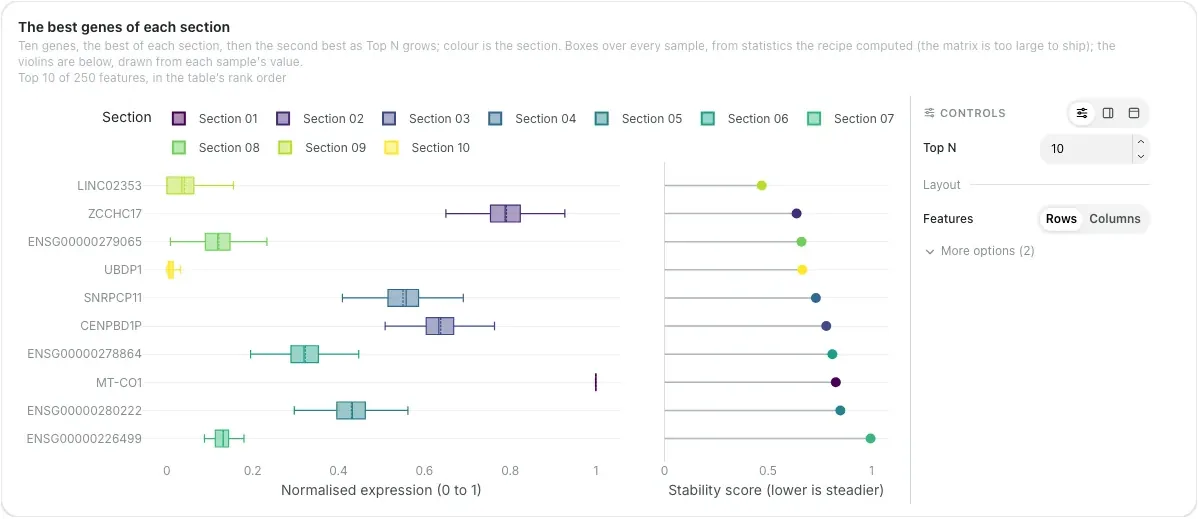
 Ranked distribution v1.20.0+
Benchmarking
Proteins
 3D structure v1.19.0+
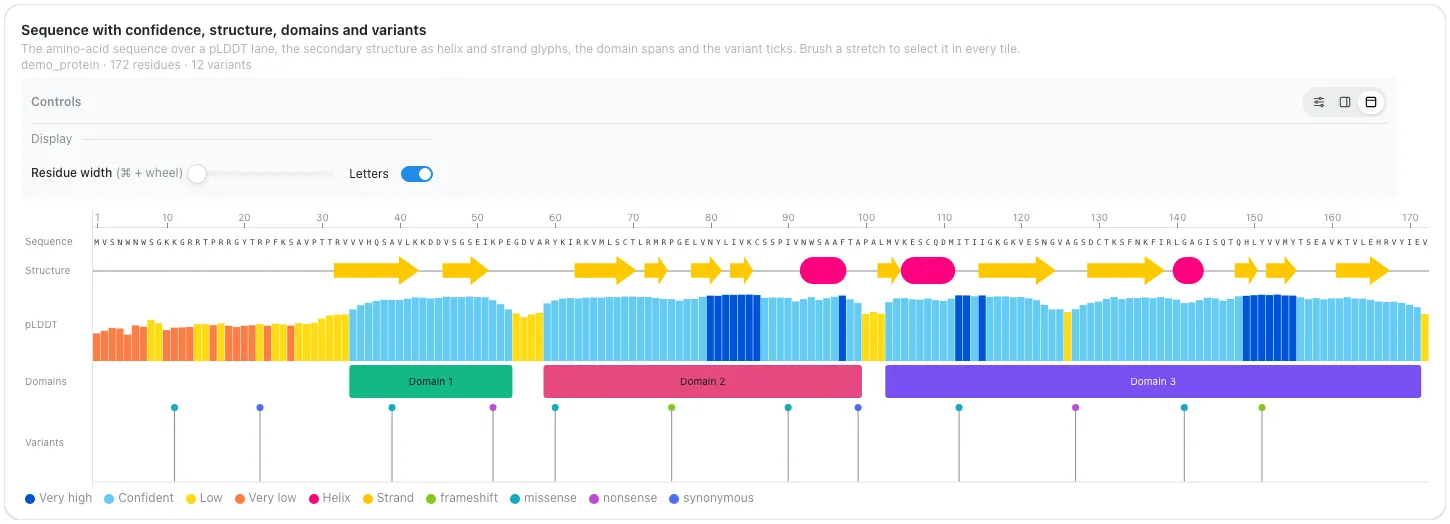
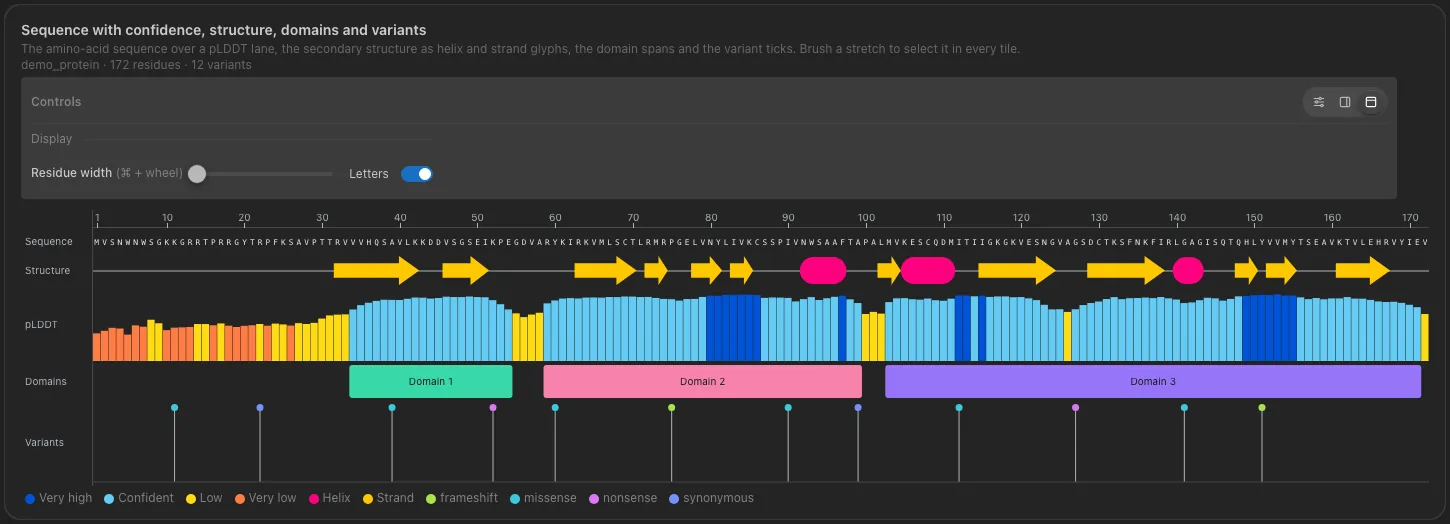 Sequence track v1.19.0+
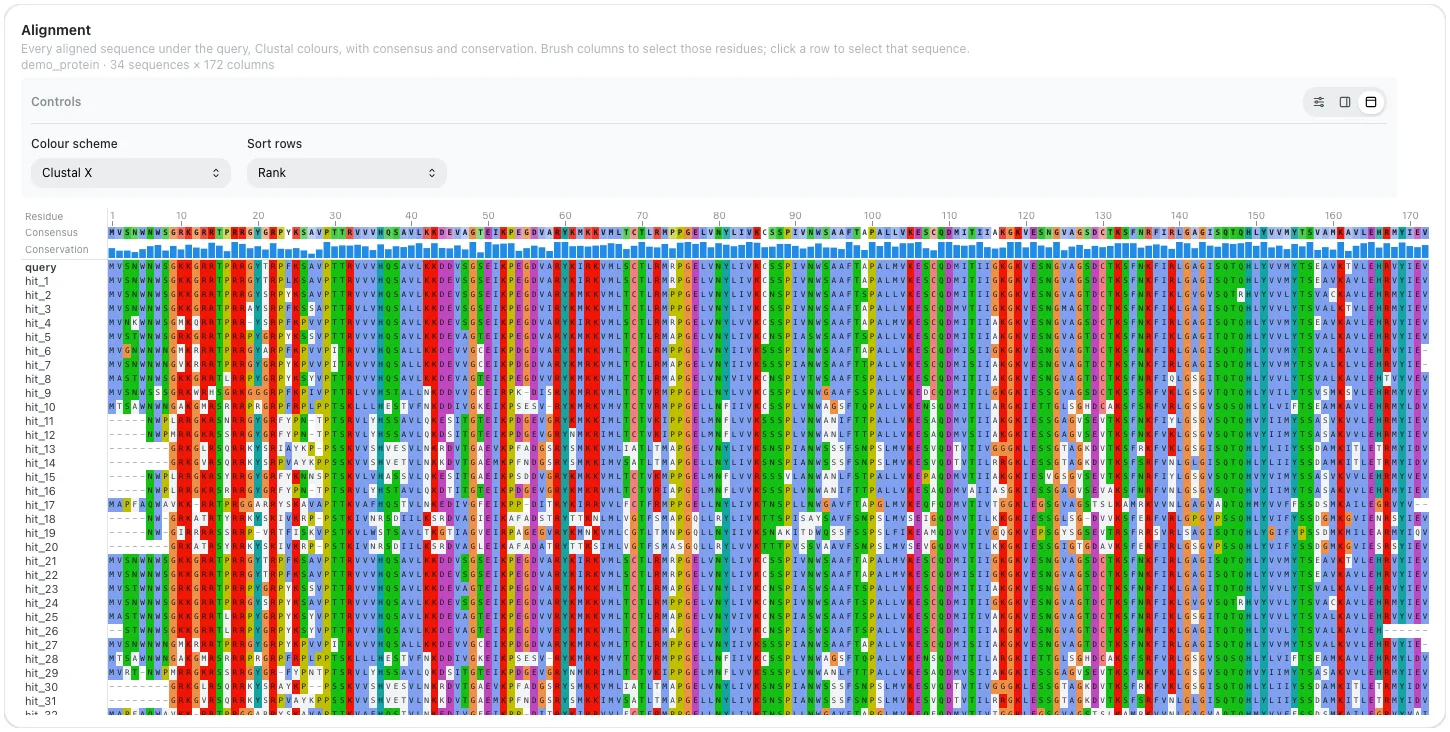
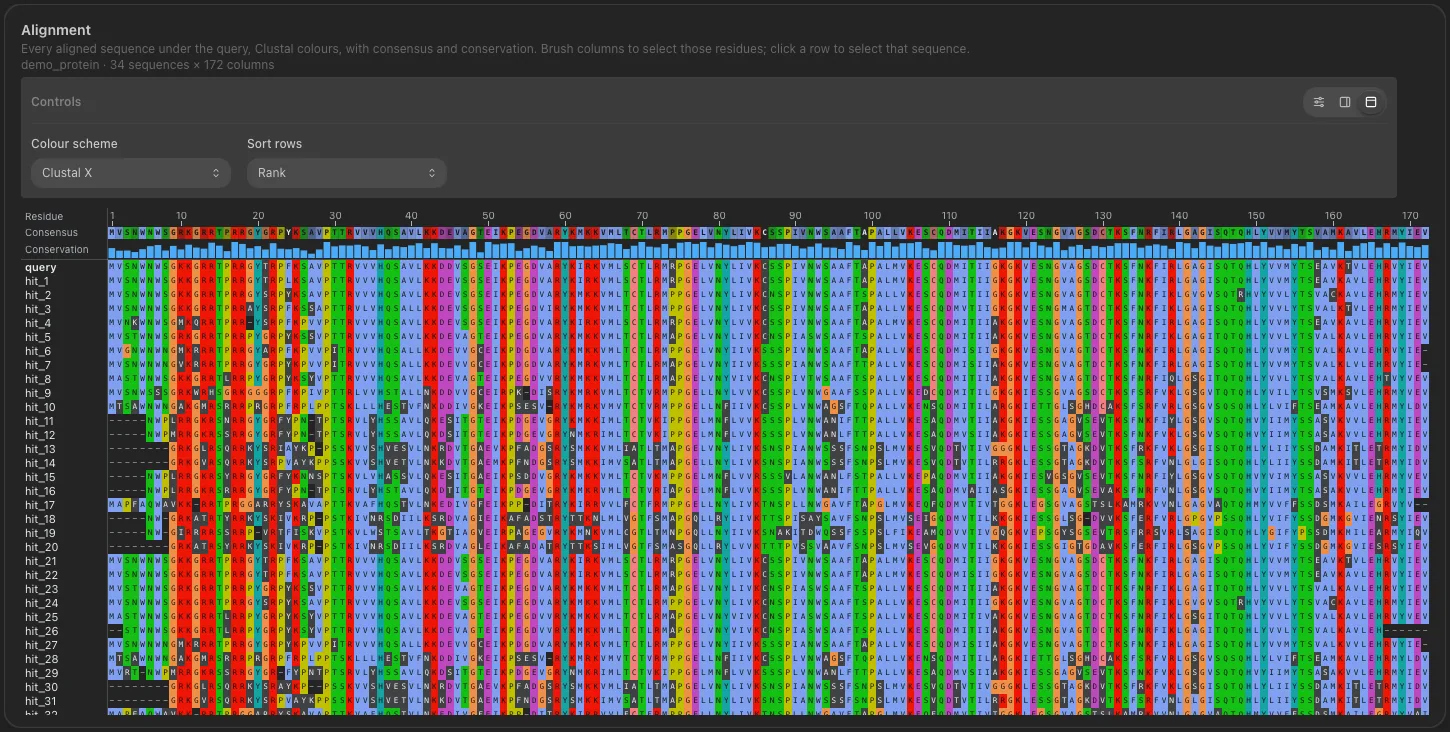 Alignment v1.19.0+
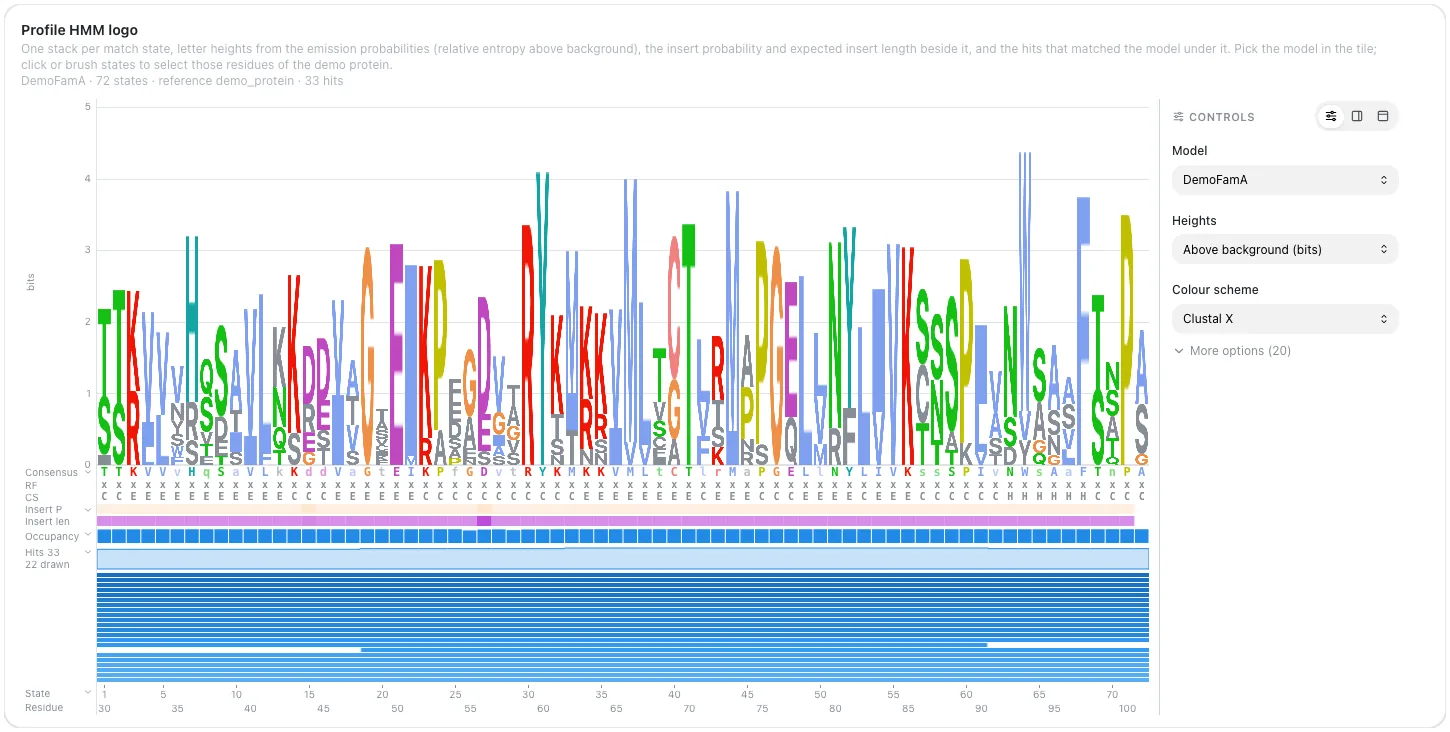
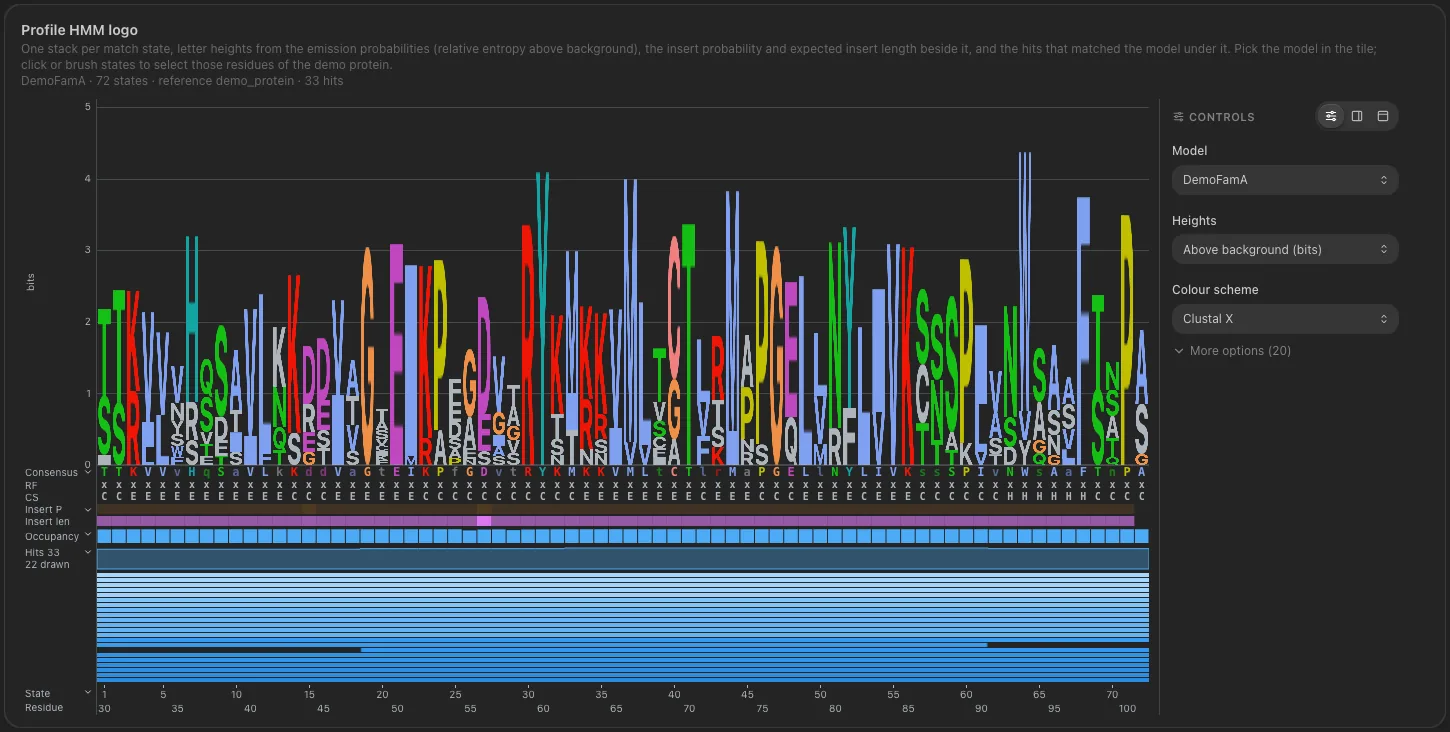 HMM logo v1.19.0+
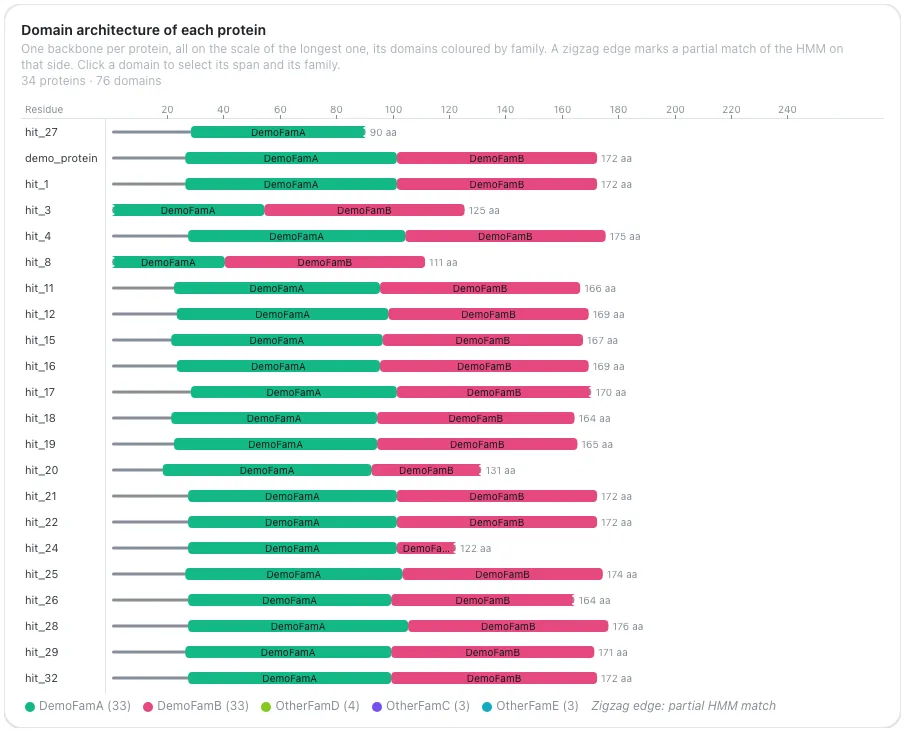
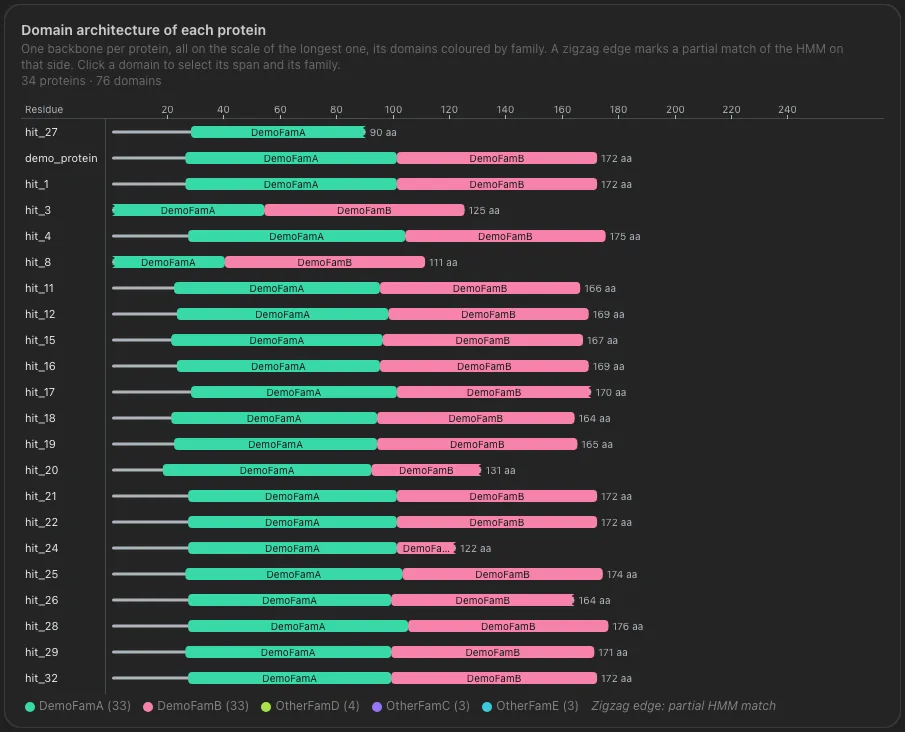 Domain architecture v1.19.0+
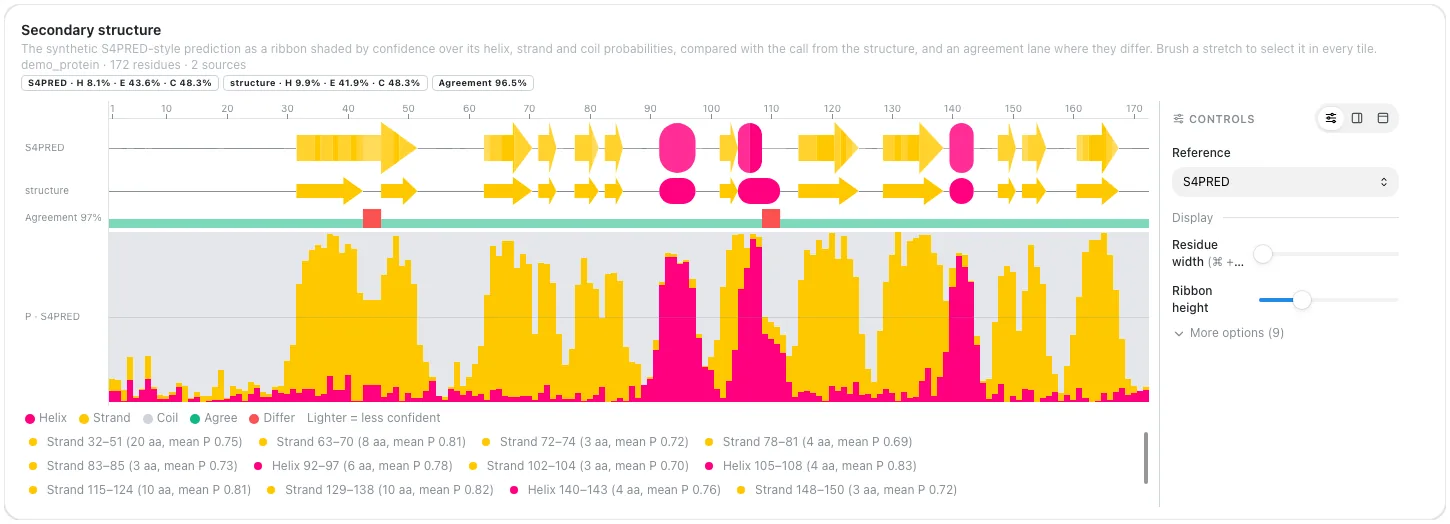
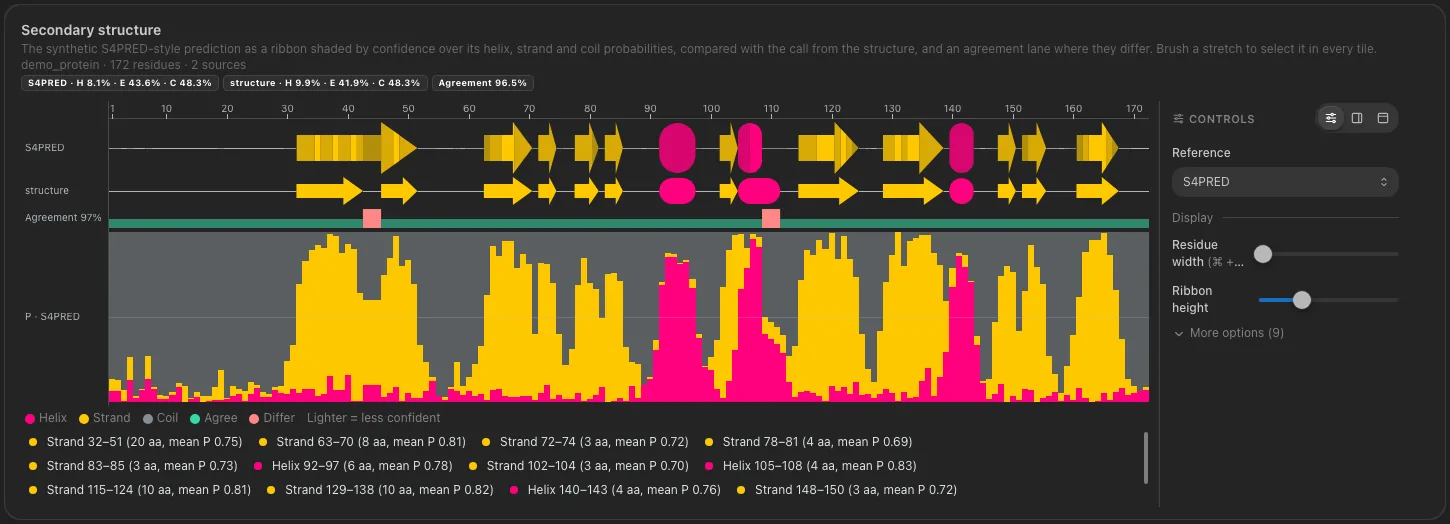 Secondary structure v1.19.0+
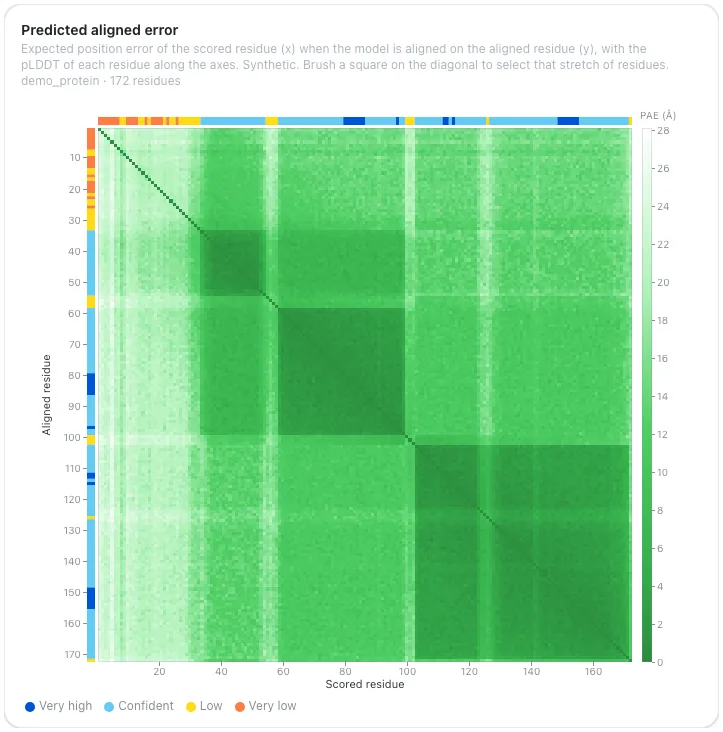
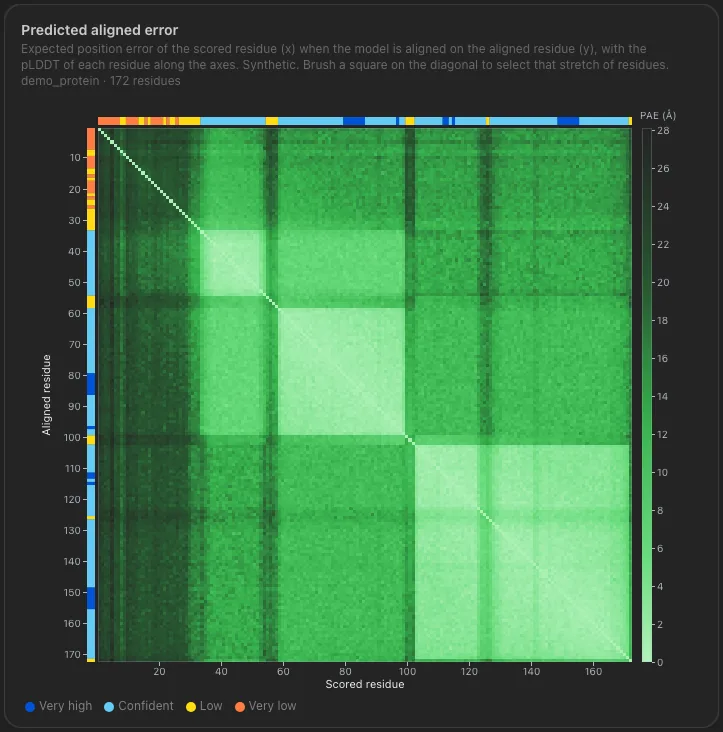 Predicted aligned error v1.19.0+
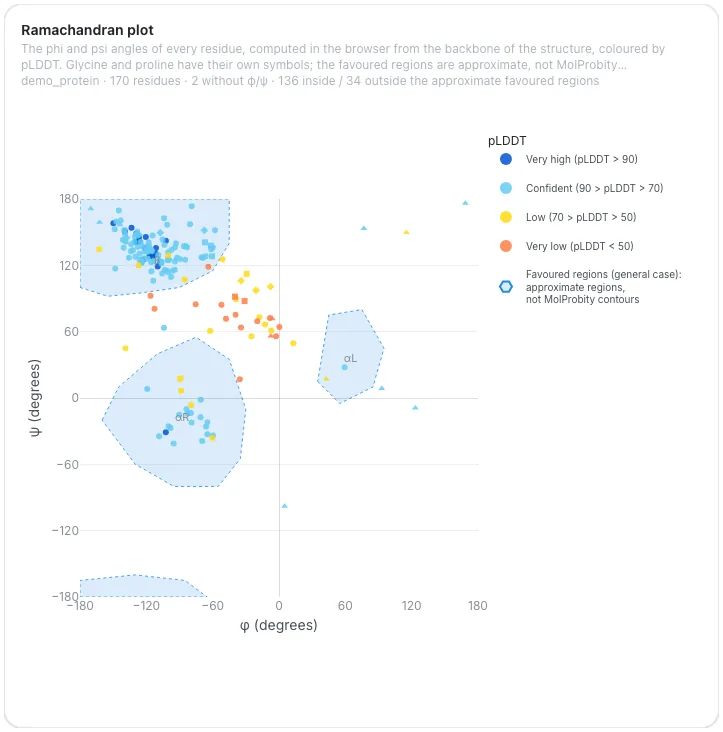
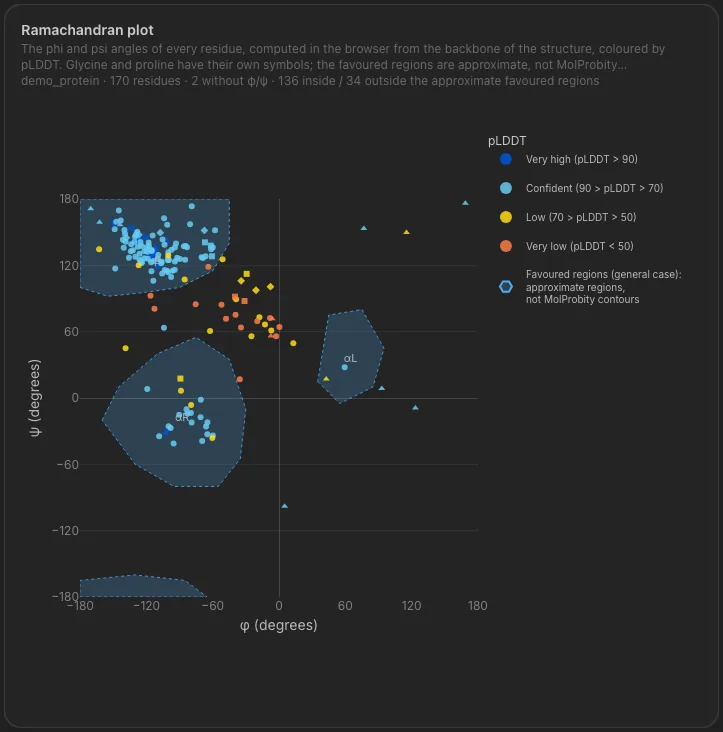 Ramachandran v1.19.0+
How to use one
- In the dashboard editor, add a component, pick a data collection, then the Advanced viz type.
- Pick a kind. The builder ranks the kinds by how well they fit the collection (see the kind picker).
- Bind each role to a column under Column bindings. Required roles must be bound; the builder checks the column types.
- Optionally choose where the controls go under Viz controls, then add the tile.
In a dashboard YAML file, the same tile is a component_type: advanced_viz
entry. A role x binds through the config key x_col:
- tag: viz-de
  component_type: advanced_viz
  workflow_tag: my_workflow
  data_collection_tag: de_results
  viz_kind: volcano
  config:
    viz_kind: volcano
    feature_id_col: gene_id
    effect_size_col: log2FoldChange
    significance_col: padj
Every entry below follows the same layout: a version badge (v1.19.0+ means available since that release), a screenshot, its input table (one row per column: the Column name as in its YAML example, the Config key that binds it, its Need (required or optional), the Type checked and an Example value), the tools whose output fits, its controls and a YAML example.
Shared settings
Controls and where they go
Each tile splits its controls in two tiers. Primary controls change what is shown: the
view switch, thresholds, colour by, a gene or sample picker. Cosmetic controls change how
it is drawn: marker sizes, palettes, labels, legend. The config key controls_placement sets
where they go v1.13.0+:
controls_placement |
Where |
|---|---|
popover (default) |
Behind the settings icon, or docked beside or above the plot when the tile has room v1.14.0+ |
header |
Primary controls in a strip under the title, cosmetic ones in the popover |
rail |
All controls in a column right of the plot, no popover |
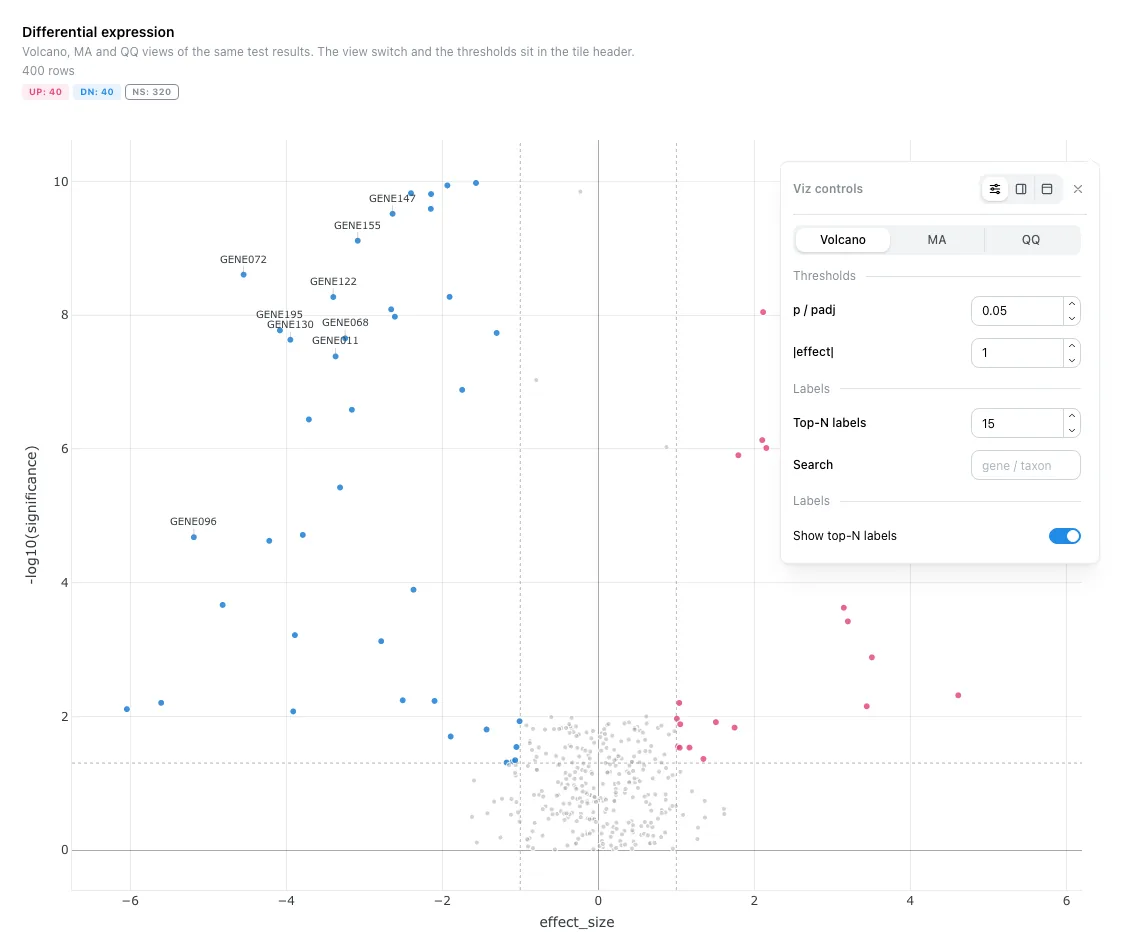
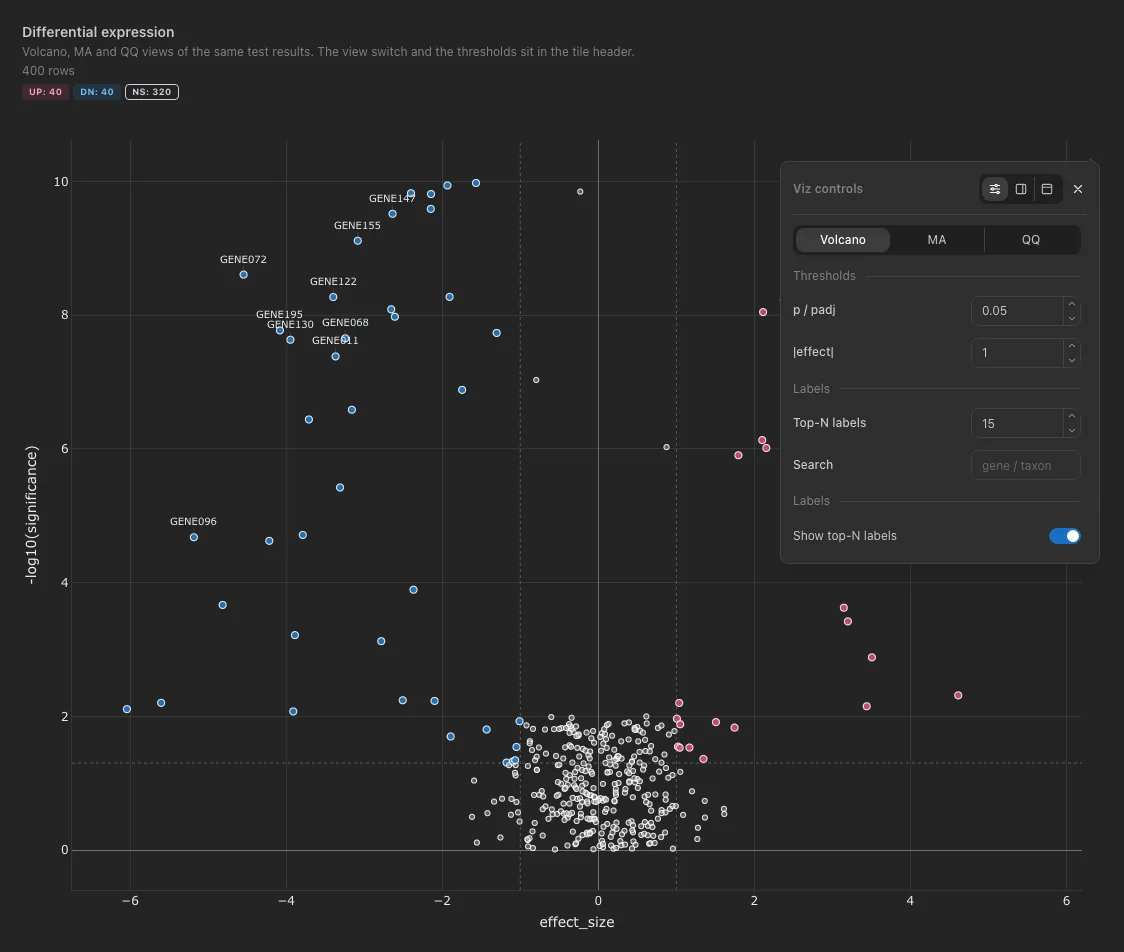
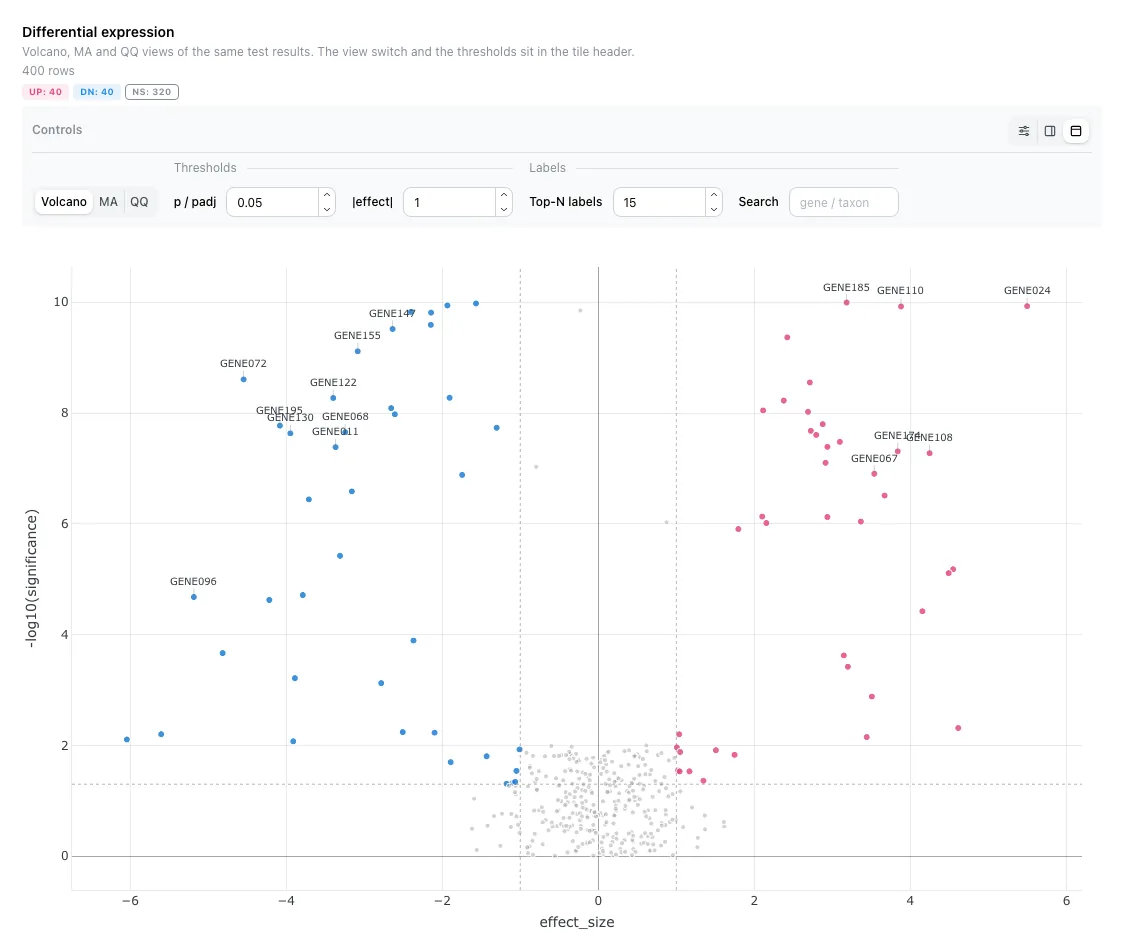
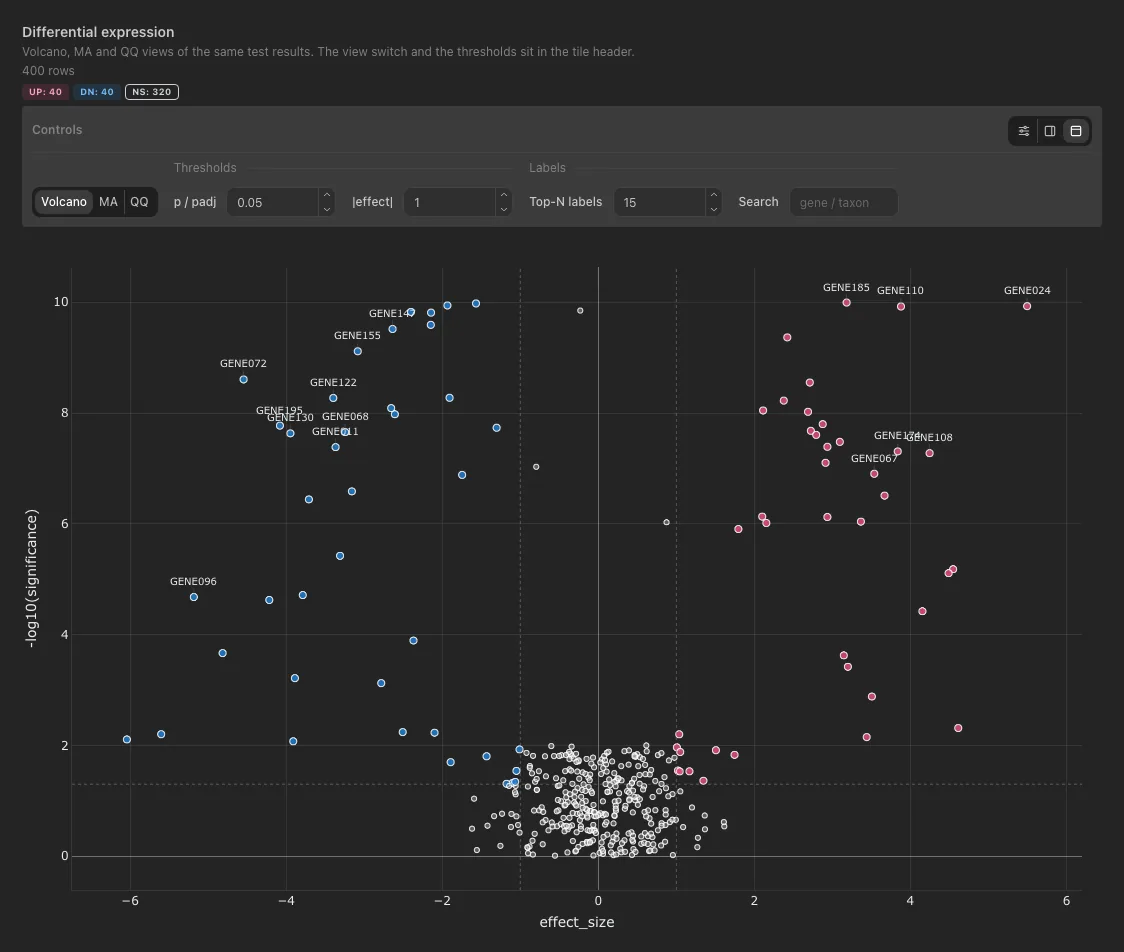
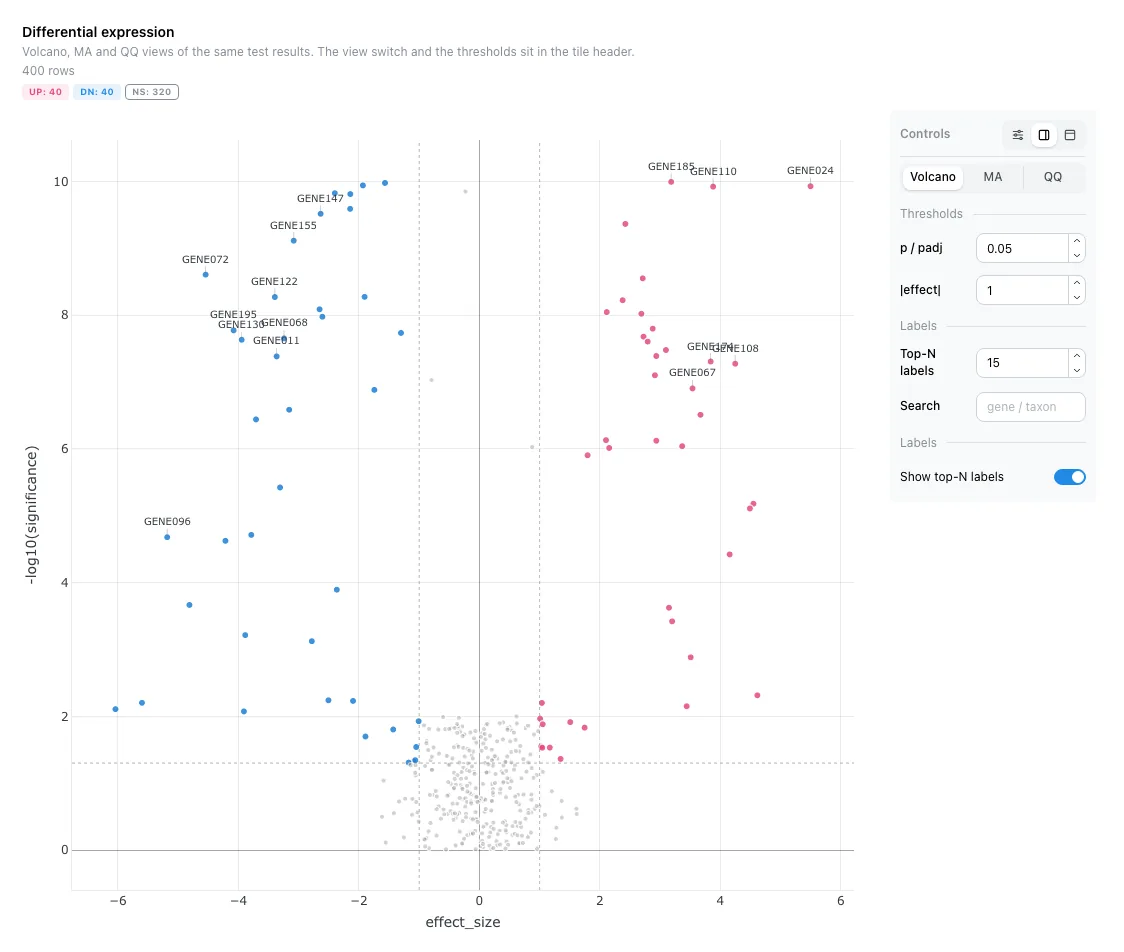
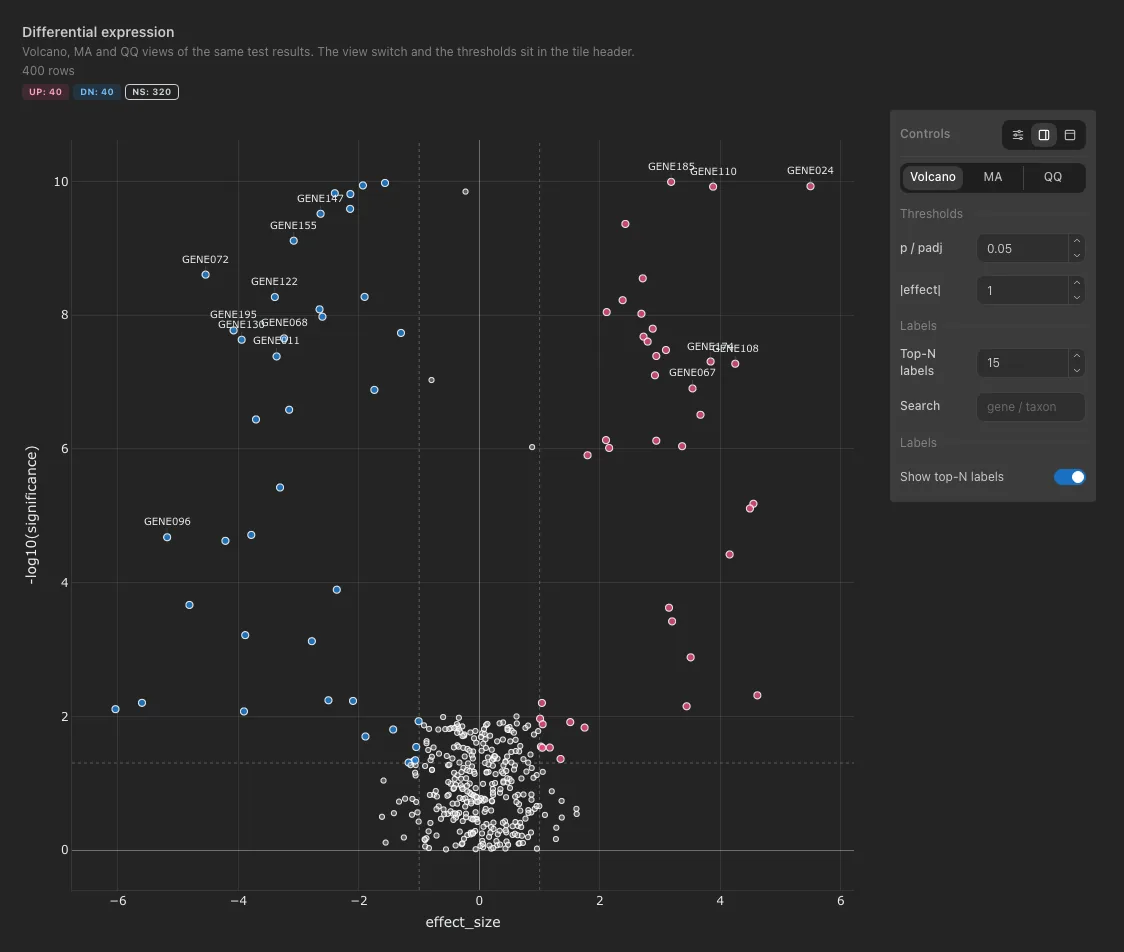
- A docked panel shows the first three controls and folds the rest under More options.
The component-level
controls_placement(auto,right,top,popover), the builder's Viz controls section, forces the dock side or keeps the icon. - A reader can move the controls with the placement picker; the choice lasts the session.
- A dashboard sets a default for every tile with
advanced_viz_controls. See Tile height and control placement. - Every tile also offers Show underlying data: the rows behind the plot.
Switchable views
Some kinds draw the same rows several ways. view is the view the tile opens on, views the
views it offers. A view is only offered when its columns are bound.
| Kind | Views (default first) |
|---|---|
| Volcano | volcano, ma, qq |
| Dot plot | dotplot, enrichment |
| PR benchmark | pr, roc, both |
| Coverage track | track, locus |
| Copy-number profile | plotly, locus |
| Sashimi | plotly, genomespy |
Retired kinds still load
viz_kind: ma, qq, enrichment and roc_pr_curve became views in v1.13.0. They still
load and open on the matching view of volcano, dot_plot or pr_benchmark; the builder
no longer offers them. ancombc_differentials loads as a DA barplot.
The kind picker
The builder lists the tile's current kind first, then Recommended kinds, then the others, folded. A badge says what a suggestion rests on:
| Badge | Meaning |
|---|---|
| Named match | Columns are named for the kind's roles (log2FoldChange, padj...) |
| Shape match | Columns have the right types and shape, without matching names |
| Fits your selection | Another tile on the tab emits a selection the kind can follow, as for a Record card |
| Weak | Pickable, but a required role has no good column |
Differential analysis
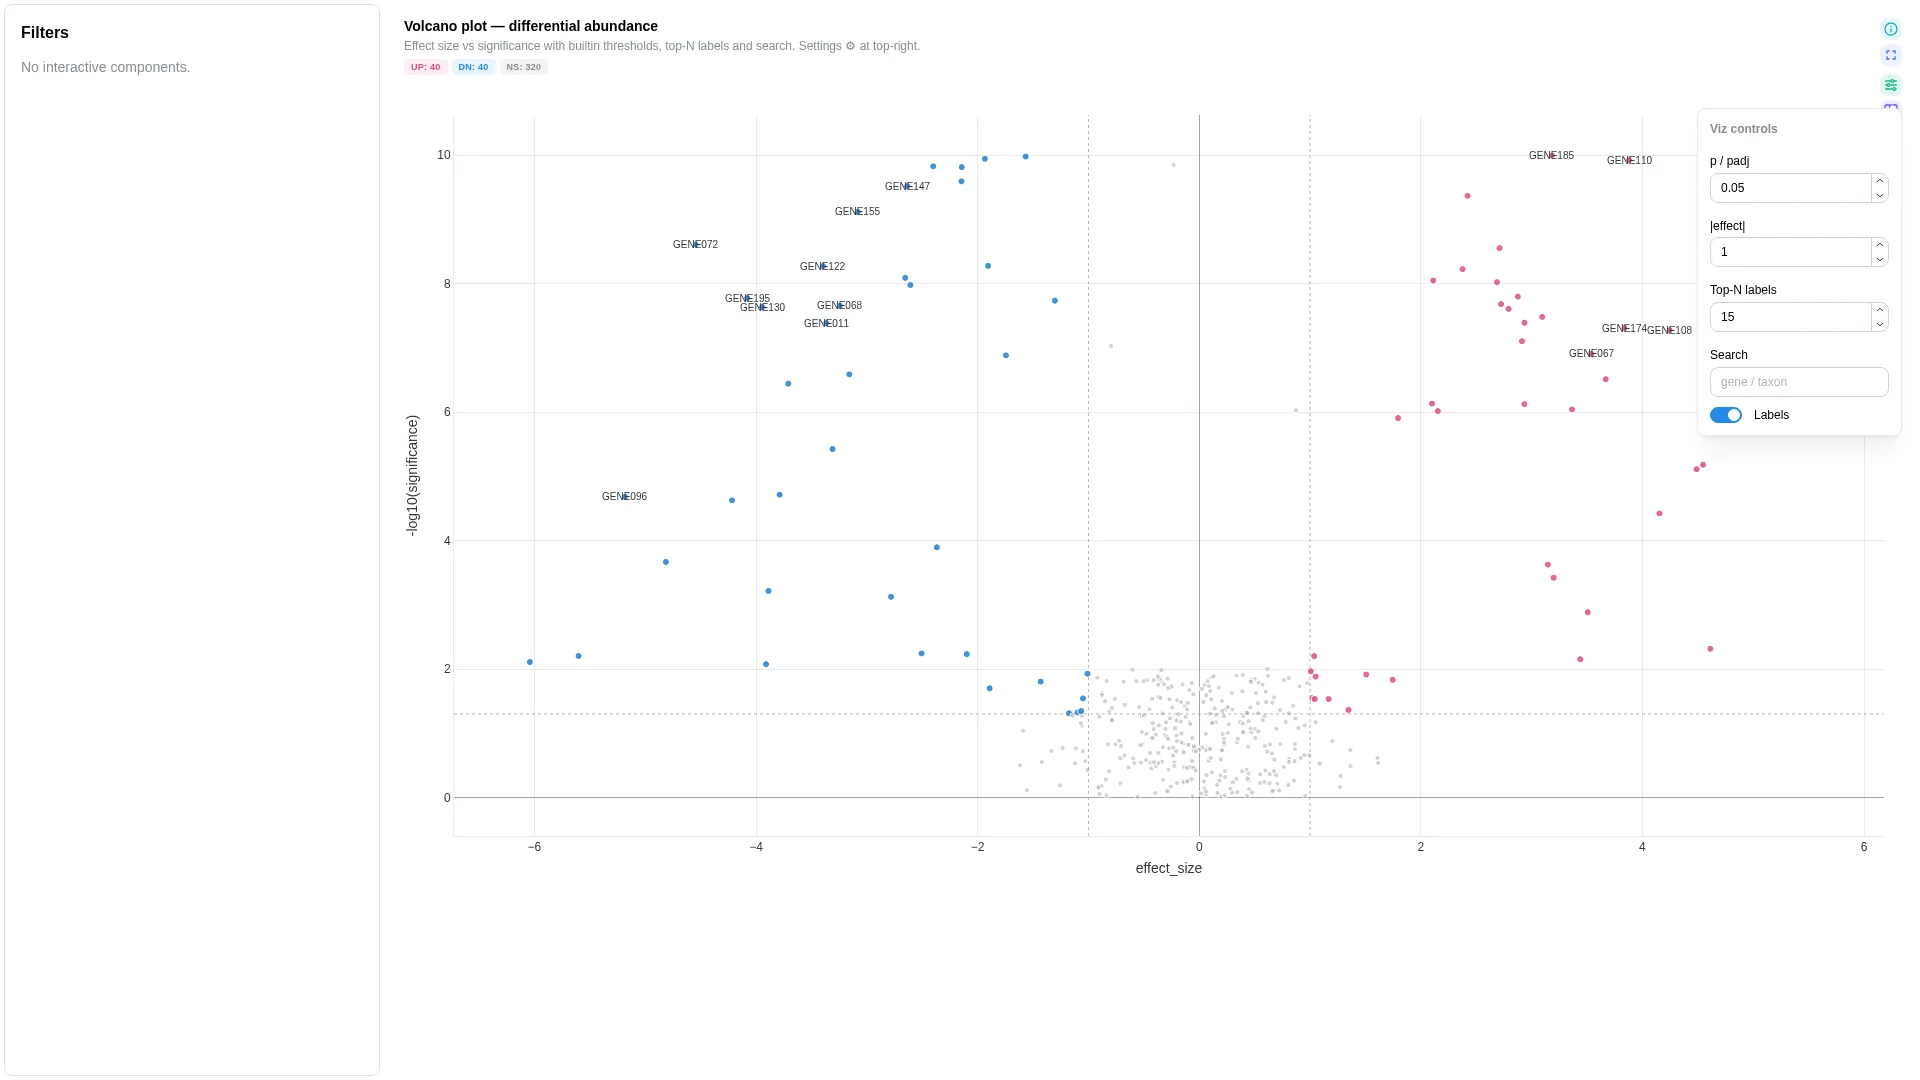
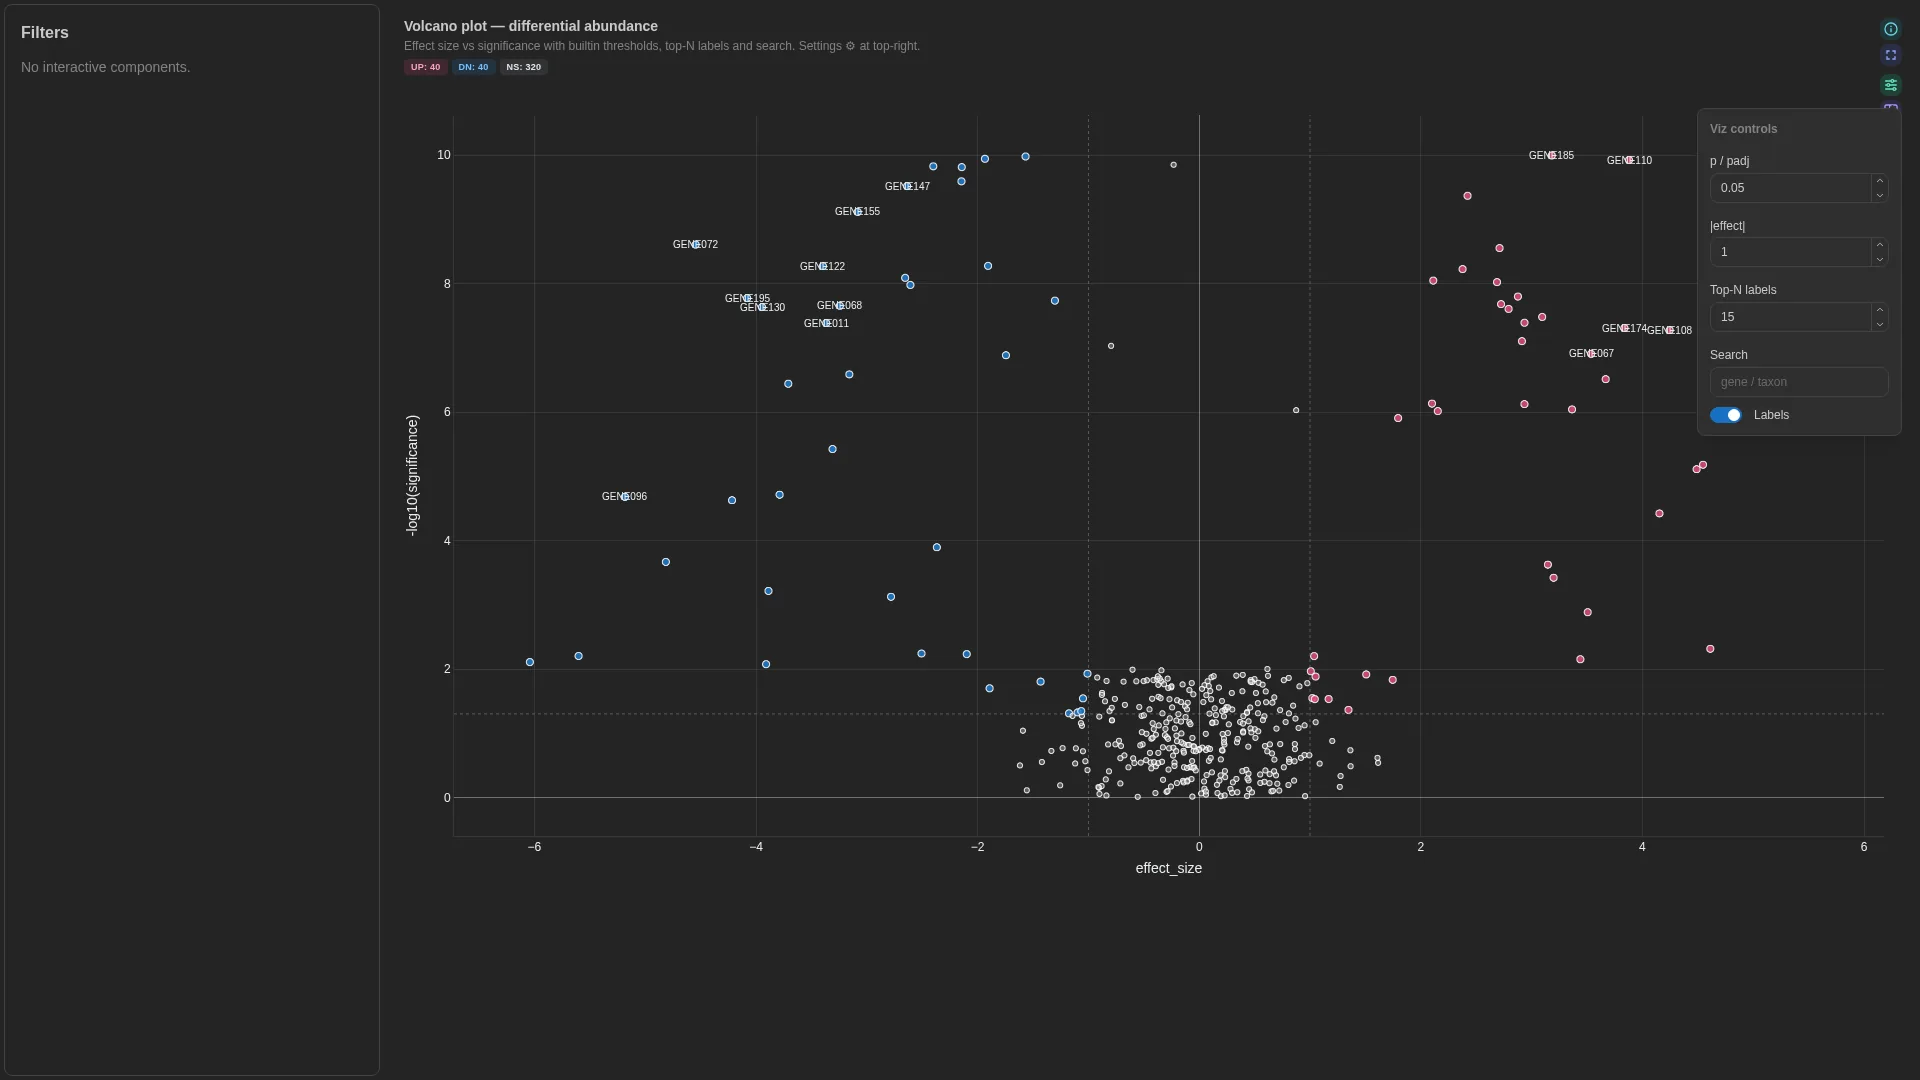
Volcano
v0.13.0+ viz_kind: volcano
Effect size against significance for a differential test. The same table also reads as an MA plot and a QQ plot from the view switch.
Input: one row per gene.
| Column | Config key | Need | Type | Example |
|---|---|---|---|---|
gene_id |
feature_id_col |
required | String | ENSG00000141510 |
log2FoldChange |
effect_size_col |
required | Float | -1.84, 2.47 |
padj |
significance_col |
required | Float | 3.2e-08 |
log2_baseMean |
avg_log_intensity_col |
optional, adds the MA view | Float | 11.2 |
pvalue |
p_value_col |
optional, adds the QQ view | Float | 1.1e-09 |
gene_name |
label_col |
optional, hover label | String | TP53 |
contrast |
category_col |
optional, point colour | String | treated_vs_control |
Compatible inputs: DESeq2, limma or edgeR results tables, as nf-core/differentialabundance publishes them.
Controls
- Primary: View (Volcano, MA, QQ), p / padj threshold, |effect| or |log2 FC| threshold, Top-N labels, Search
- Cosmetic: Show top-N labels; in the QQ view: identity line, 95% null band, point size
Contrasts v1.19.2+: reference, contrast_prefix and contrast_separator name the two sides (localityBarcelona reads Barcelona, _vs_ names both), effect_label can say vs {reference}, group_symbols and marker_cols set the marker shape and the Shape by control, hover_col and hover_category add hover lines.
YAML
- tag: viz-volcano
  component_type: advanced_viz
  workflow_tag: my_workflow
  data_collection_tag: de_results
  viz_kind: volcano
  config:
    viz_kind: volcano
    feature_id_col: gene_id
    effect_size_col: log2FoldChange
    significance_col: padj
    avg_log_intensity_col: log2_baseMean
    p_value_col: pvalue
    views: [volcano, ma, qq]
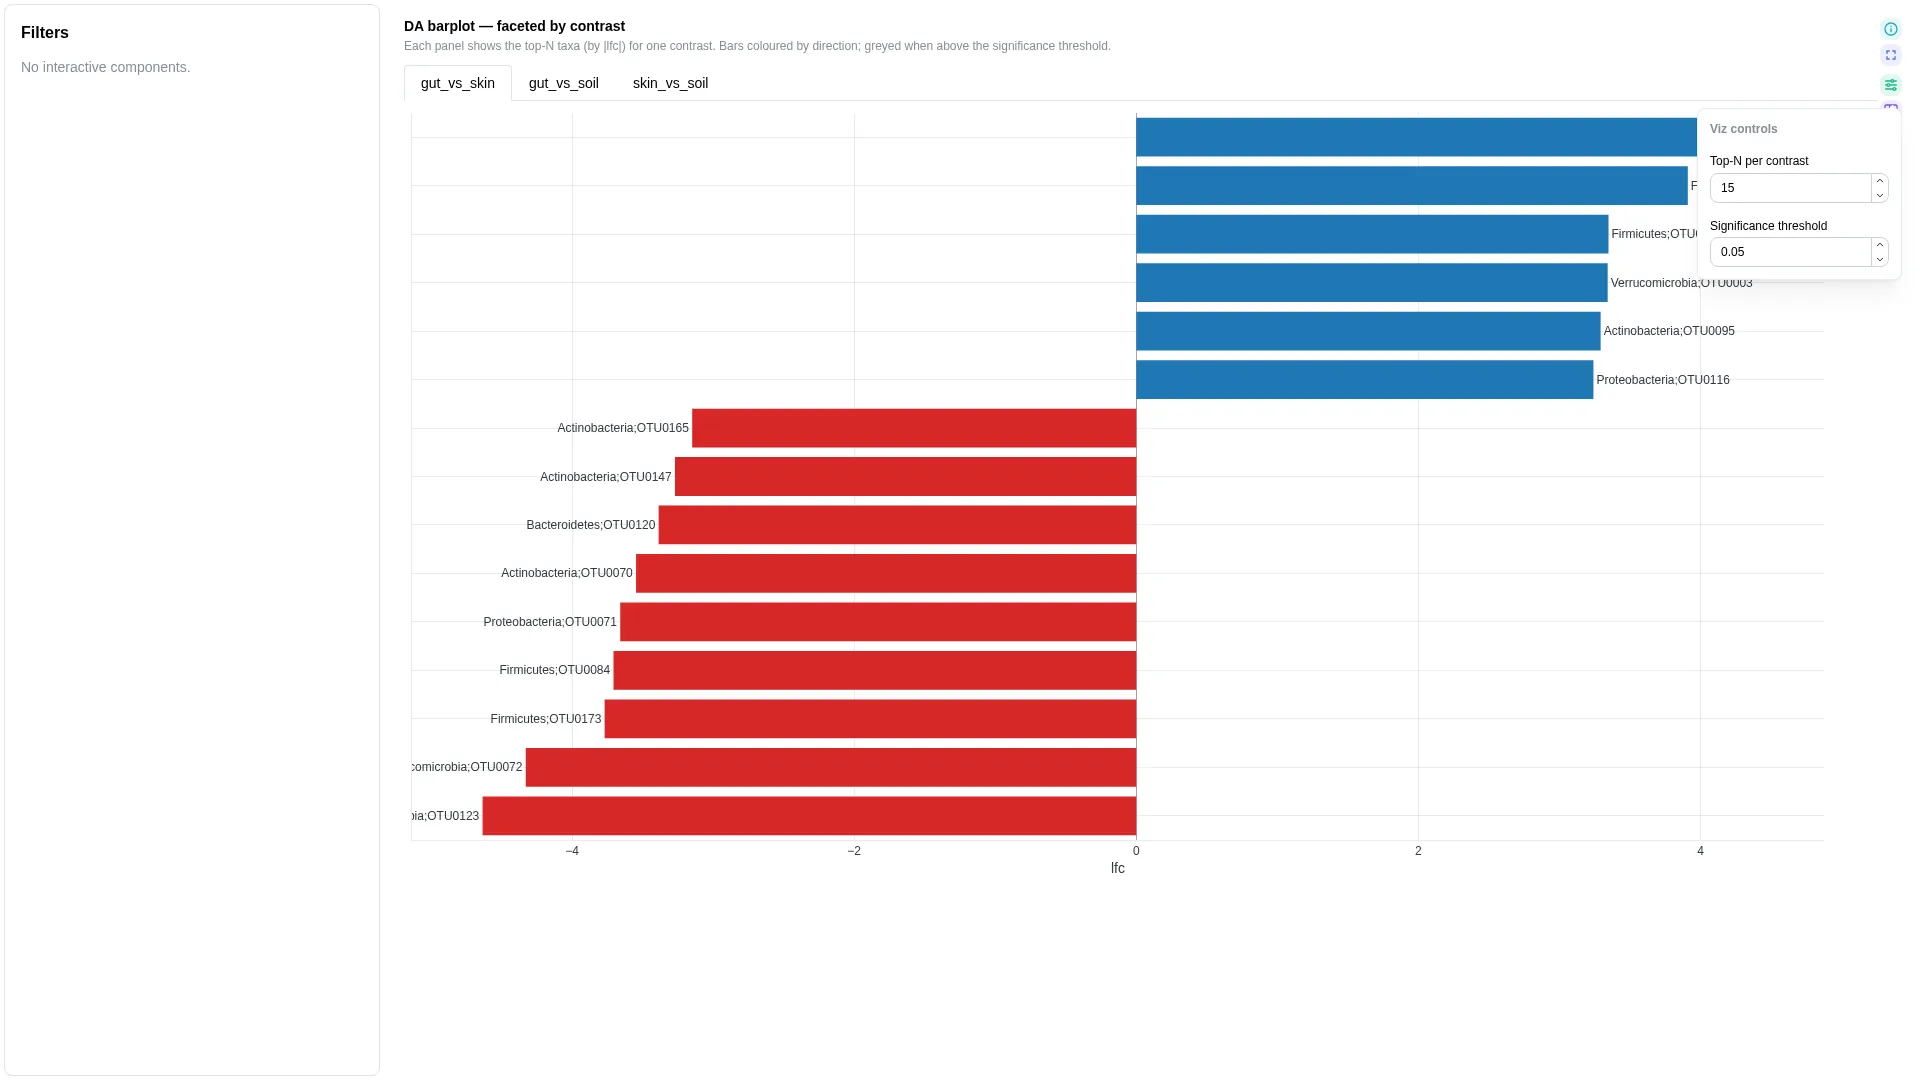
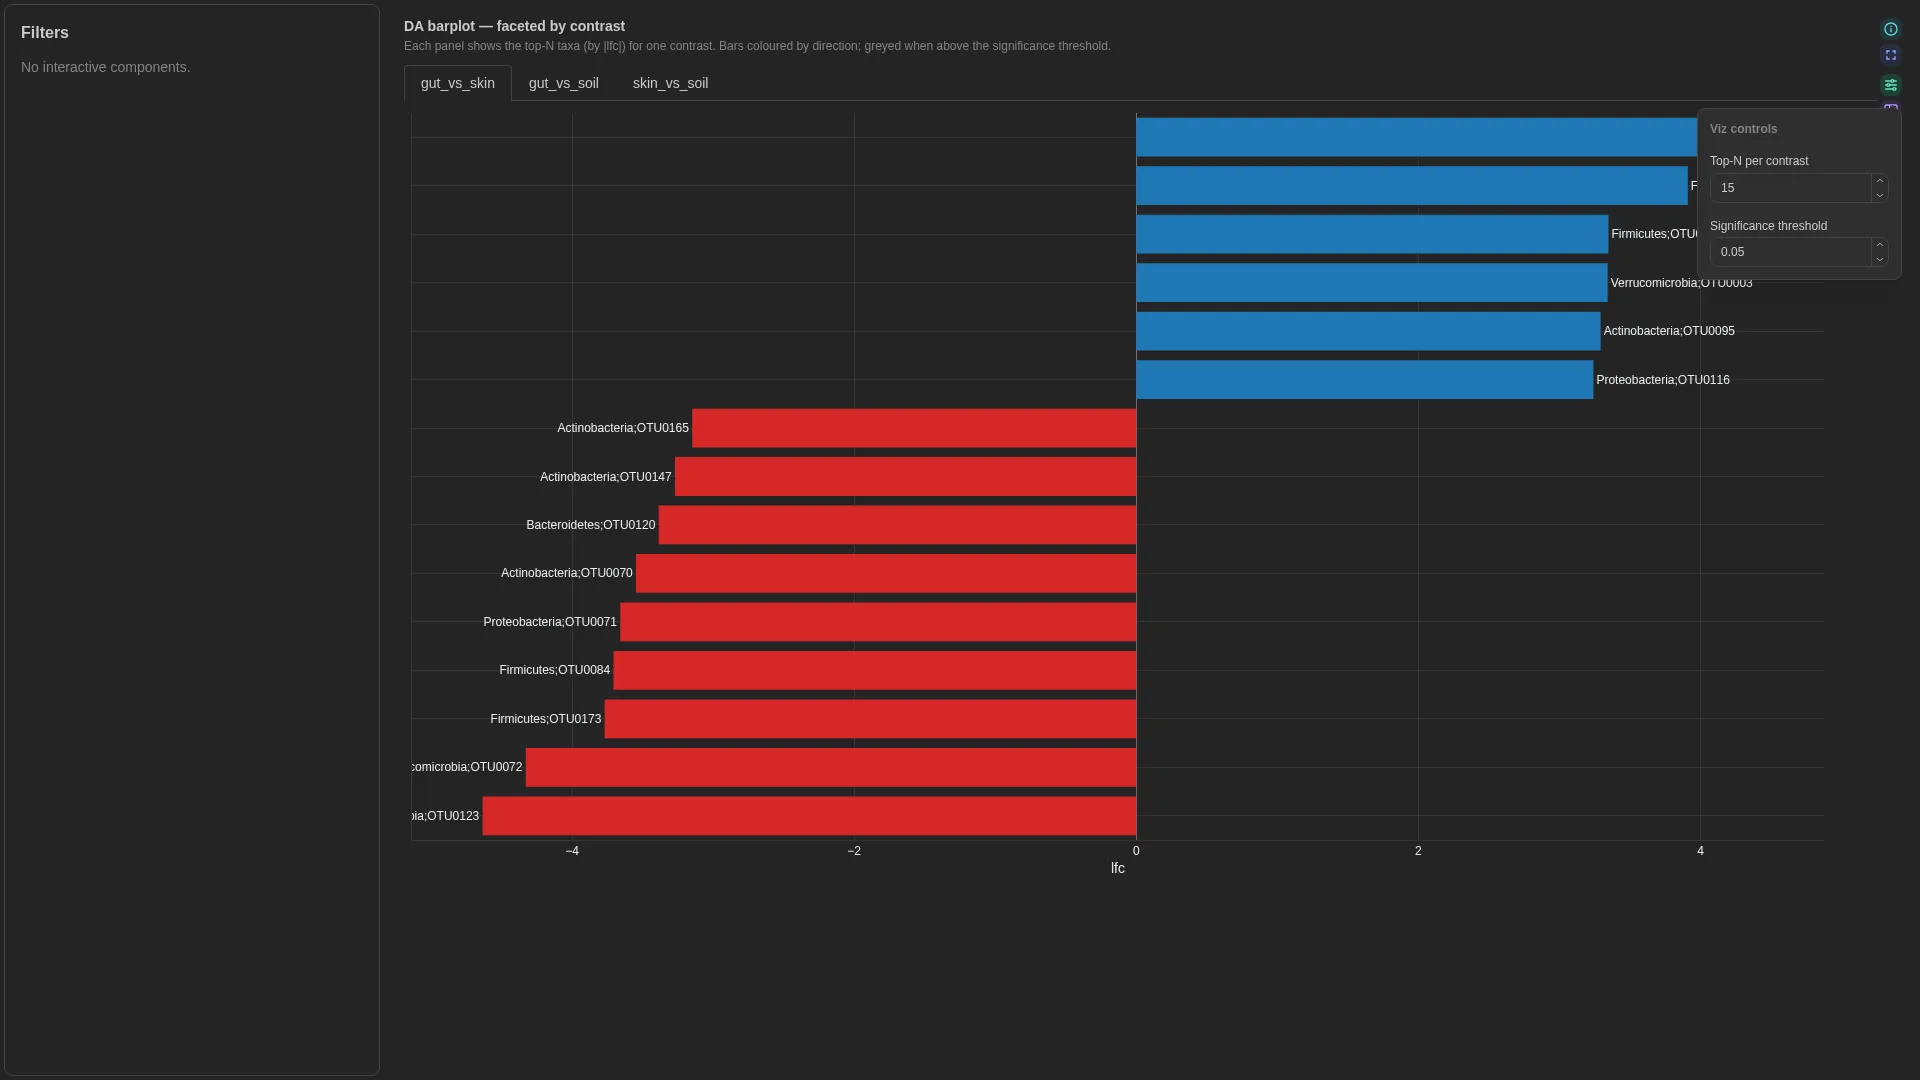
DA barplot
v0.13.0+ viz_kind: da_barplot
Ranked signed log fold changes per feature, one panel per contrast or one contrast at a time.
Input: one row per taxon and contrast (long format).
| Column | Config key | Need | Type | Example |
|---|---|---|---|---|
taxon |
feature_id_col |
required | String | Bacteroides |
contrast |
contrast_col |
required | String | treatment_vs_control |
lfc |
lfc_col |
required | Float | 1.92, -2.35 |
q_val |
significance_col |
optional, significance threshold | Float | 0.003 |
label |
label_col |
optional, display label | String | B. fragilis |
Compatible inputs: ANCOM-BC, ALDEx2 or MaAsLin2 differentials (nf-core/ampliseq).
Controls
- Primary: Contrast tabs (All or one contrast), Top-N per panel, Significance threshold
- Cosmetic: None
Contrasts v1.19.2+: reference, contrast_prefix, contrast_separator and group_colors name the two sides as on the Volcano and colour a bar by the group it leans toward; bars past the cutoff are hatched. effect_label, hover_col and hover_category as on the Volcano.
YAML
GSEA running score
v1.11.0+ viz_kind: gsea_running_score
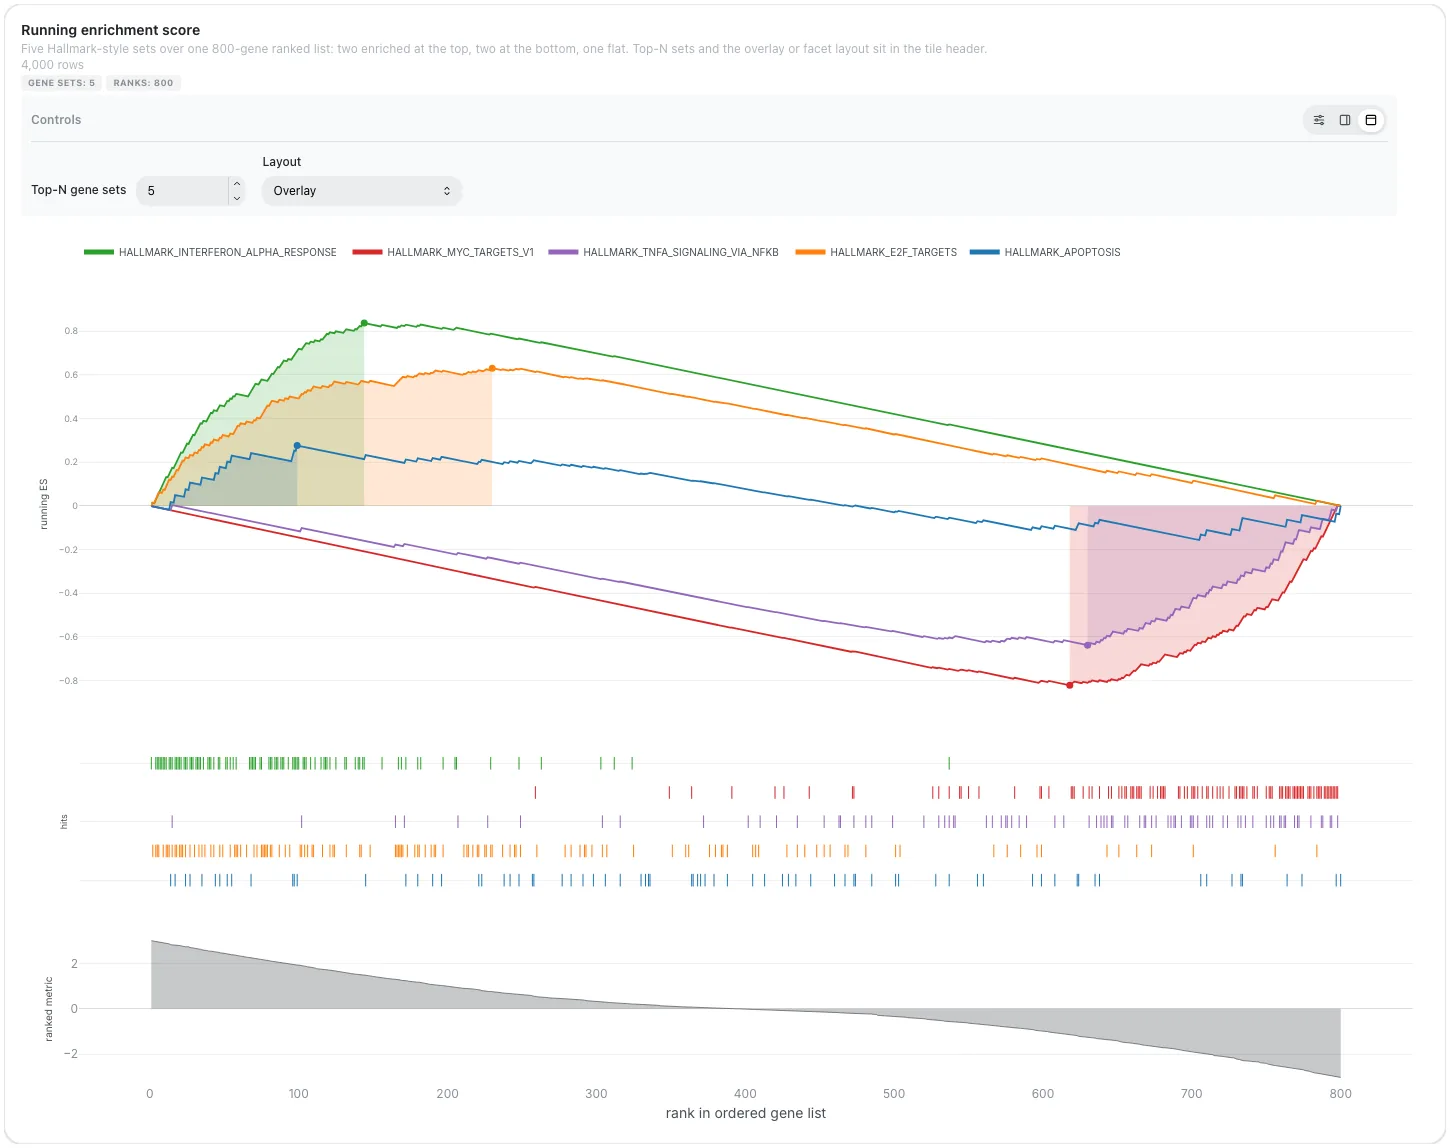
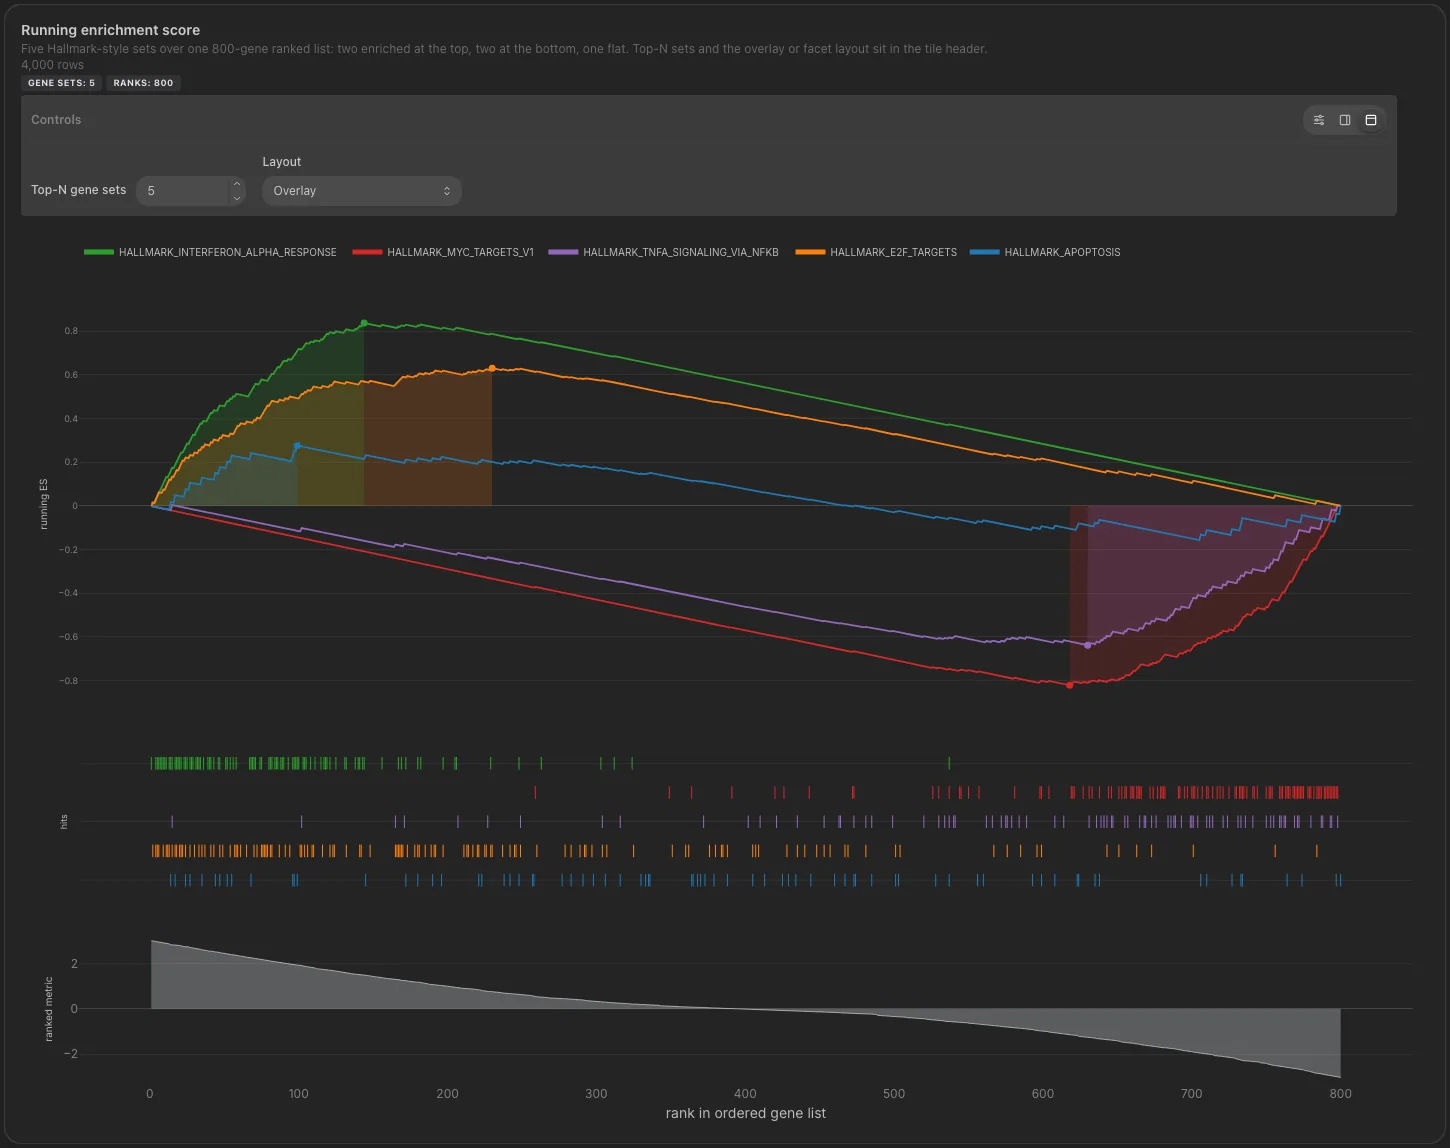
The running enrichment score along the ranked gene list, one curve per gene set, with the set members as a rug.
Input: one row per gene set and rank.
| Column | Config key | Need | Type | Example |
|---|---|---|---|---|
gene_set |
gene_set_col |
required | String | HALLMARK_E2F_TARGETS |
rank |
rank_col |
required | Numeric | 1, 2 |
running_es |
running_es_col |
required | Float | 0.012 |
member |
member_col |
optional, the hit rug | Boolean or 0/1 | true, false |
metric |
metric_col |
optional, ranked metric panel | Float | 3.21 |
Compatible inputs: GSEA output of nf-core/differentialabundance.
Controls
- Primary: Top-N gene sets, Layout
- Cosmetic: Shade the leading edge, Hit rug, Ranked metric
YAML
- tag: viz-gsea-running-score
  component_type: advanced_viz
  workflow_tag: my_workflow
  data_collection_tag: gsea_running
  viz_kind: gsea_running_score
  config:
    viz_kind: gsea_running_score
    gene_set_col: gene_set
    rank_col: rank
    running_es_col: running_es
    member_col: member
    metric_col: metric
    top_n_sets: 5
Group compare
v1.13.0+ viz_kind: group_compare
Two groups of rows tested feature by feature on demand, drawn as a volcano over a ranked table. The groups come from the dashboard's selection groups or from group values.
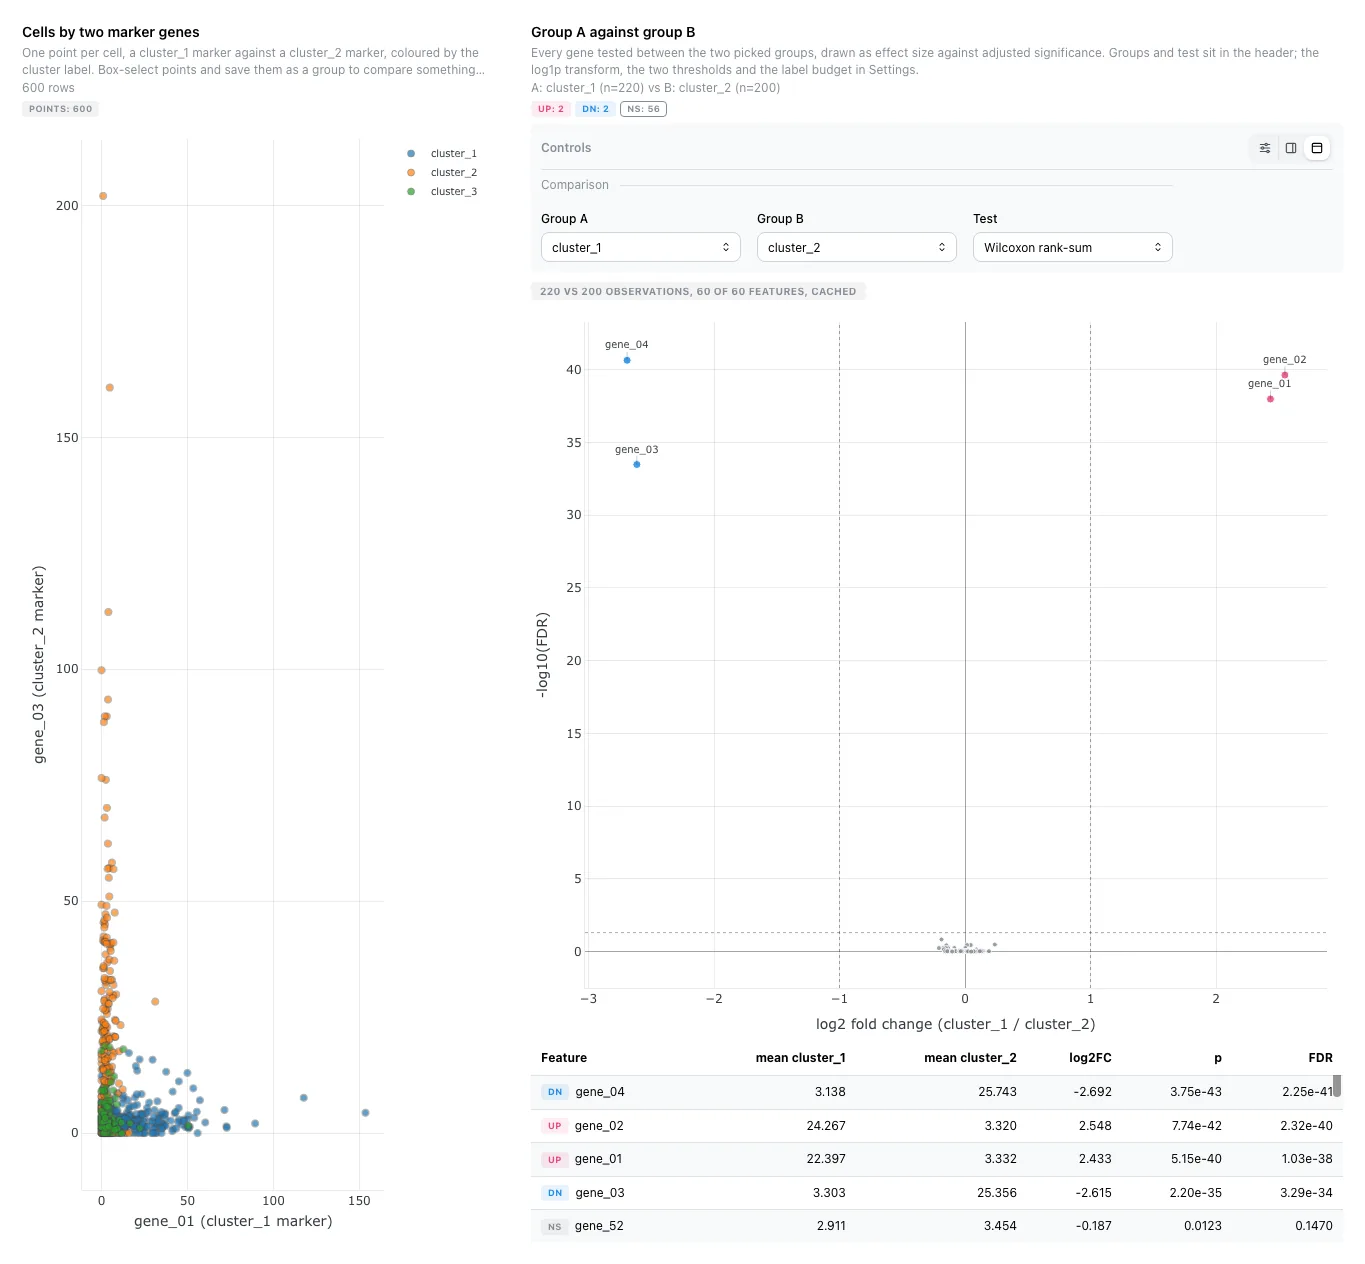
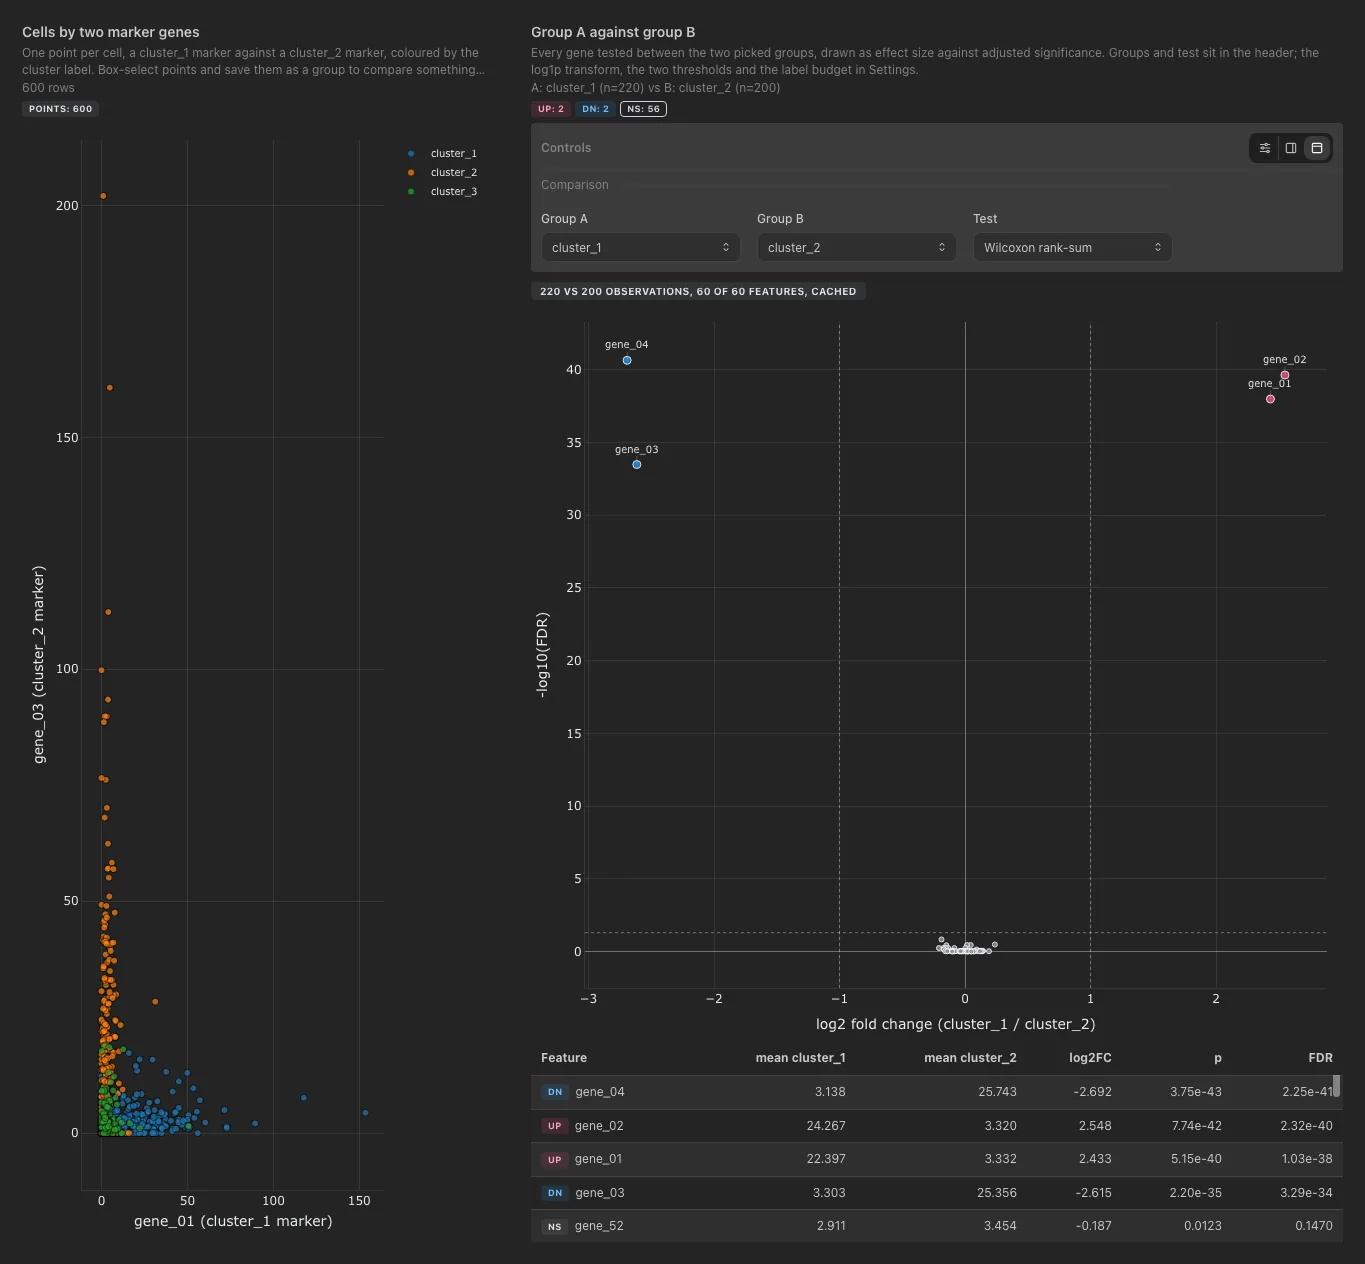
Input: one row per cell or sample, one numeric column per feature (wide format).
| Column | Config key | Need | Type | Example |
|---|---|---|---|---|
cell_id |
index_col |
required | String | AAACCTGAGAAGGCCT-1 |
CD3E, MS4A1, ... |
none, every numeric column | required, each one is tested | Numeric | 2.31, 0.0 |
cluster |
group_col |
optional, groups when no selection group is picked | String | cluster_1 |
Compatible inputs: Per-cell matrices from nf-core/scrnaseq, or per-sample normalised counts from nf-core/rnaseq.
Controls
- Primary: Group A, Group B, Test (Wilcoxon or t-test)
- Cosmetic: log1p before testing, FDR threshold, |log2FC| threshold, Top-N labels
YAML
Single cell & embeddings
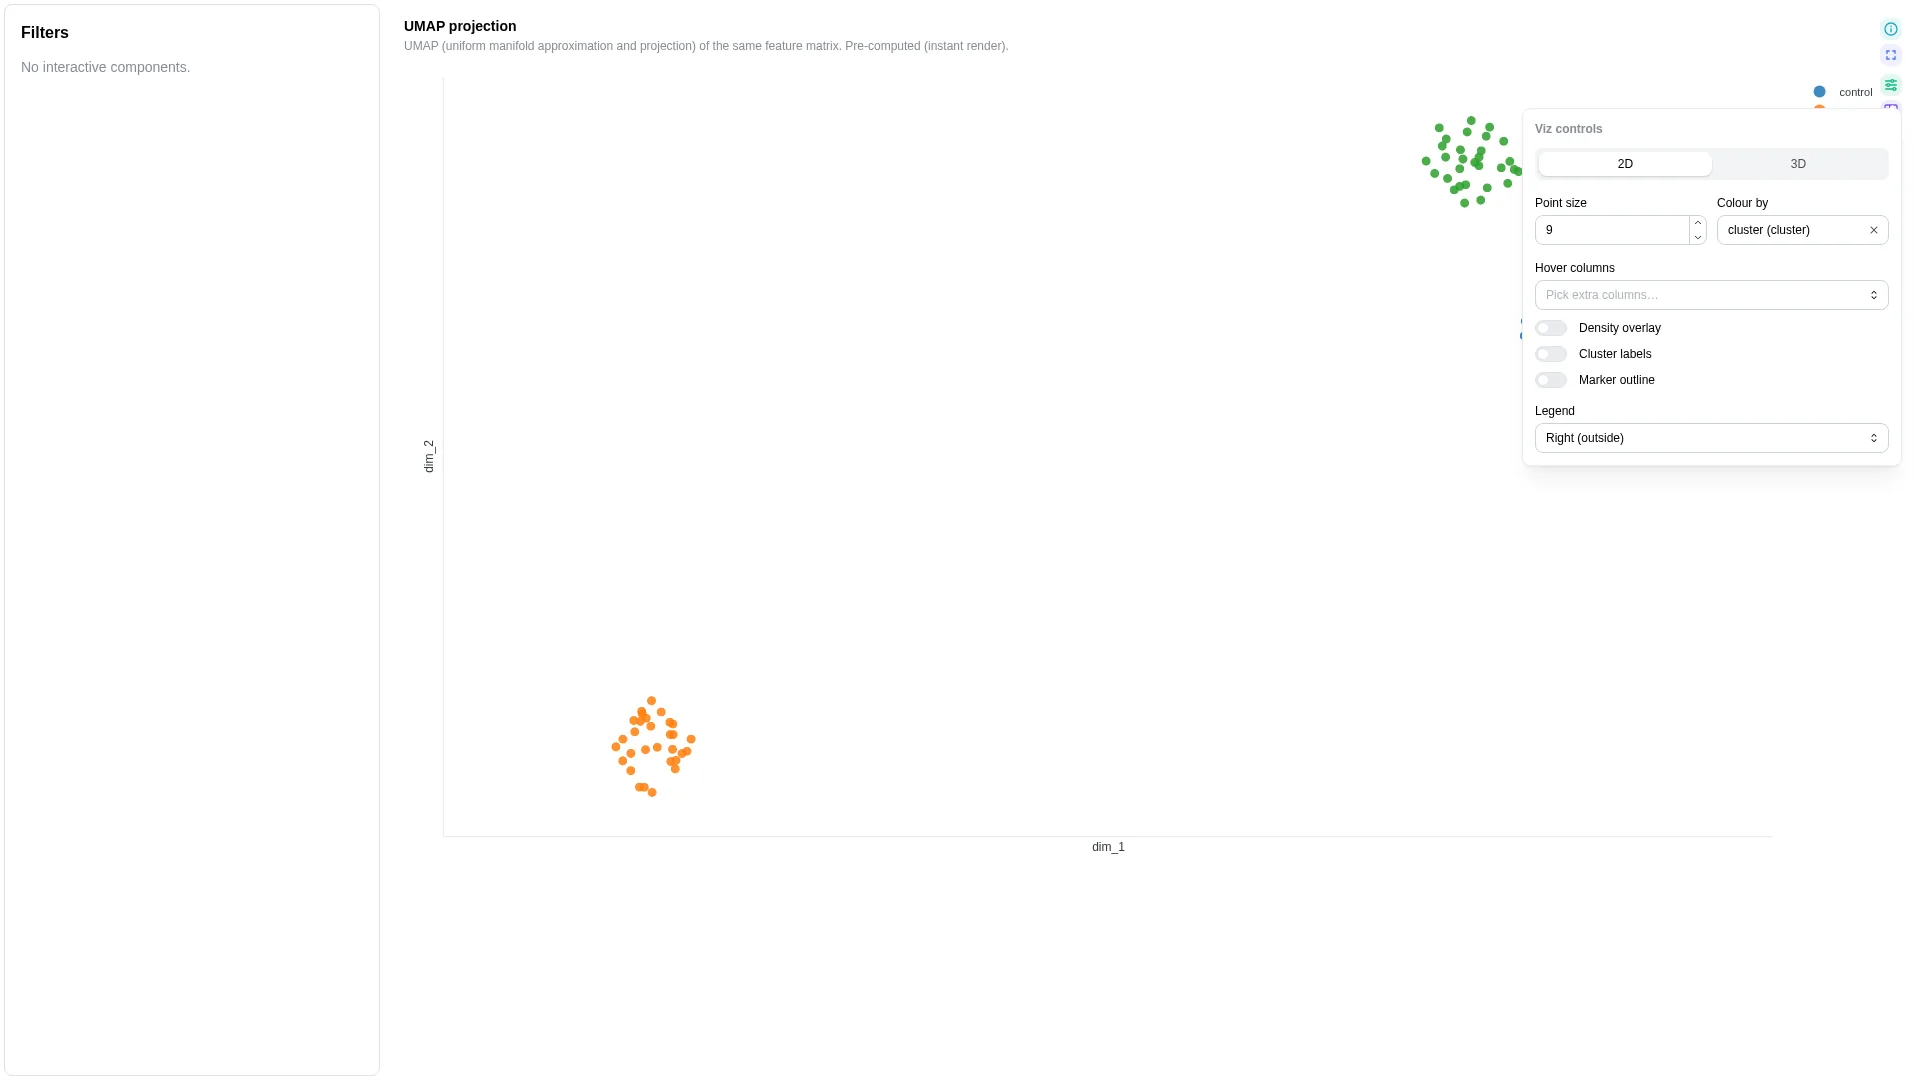
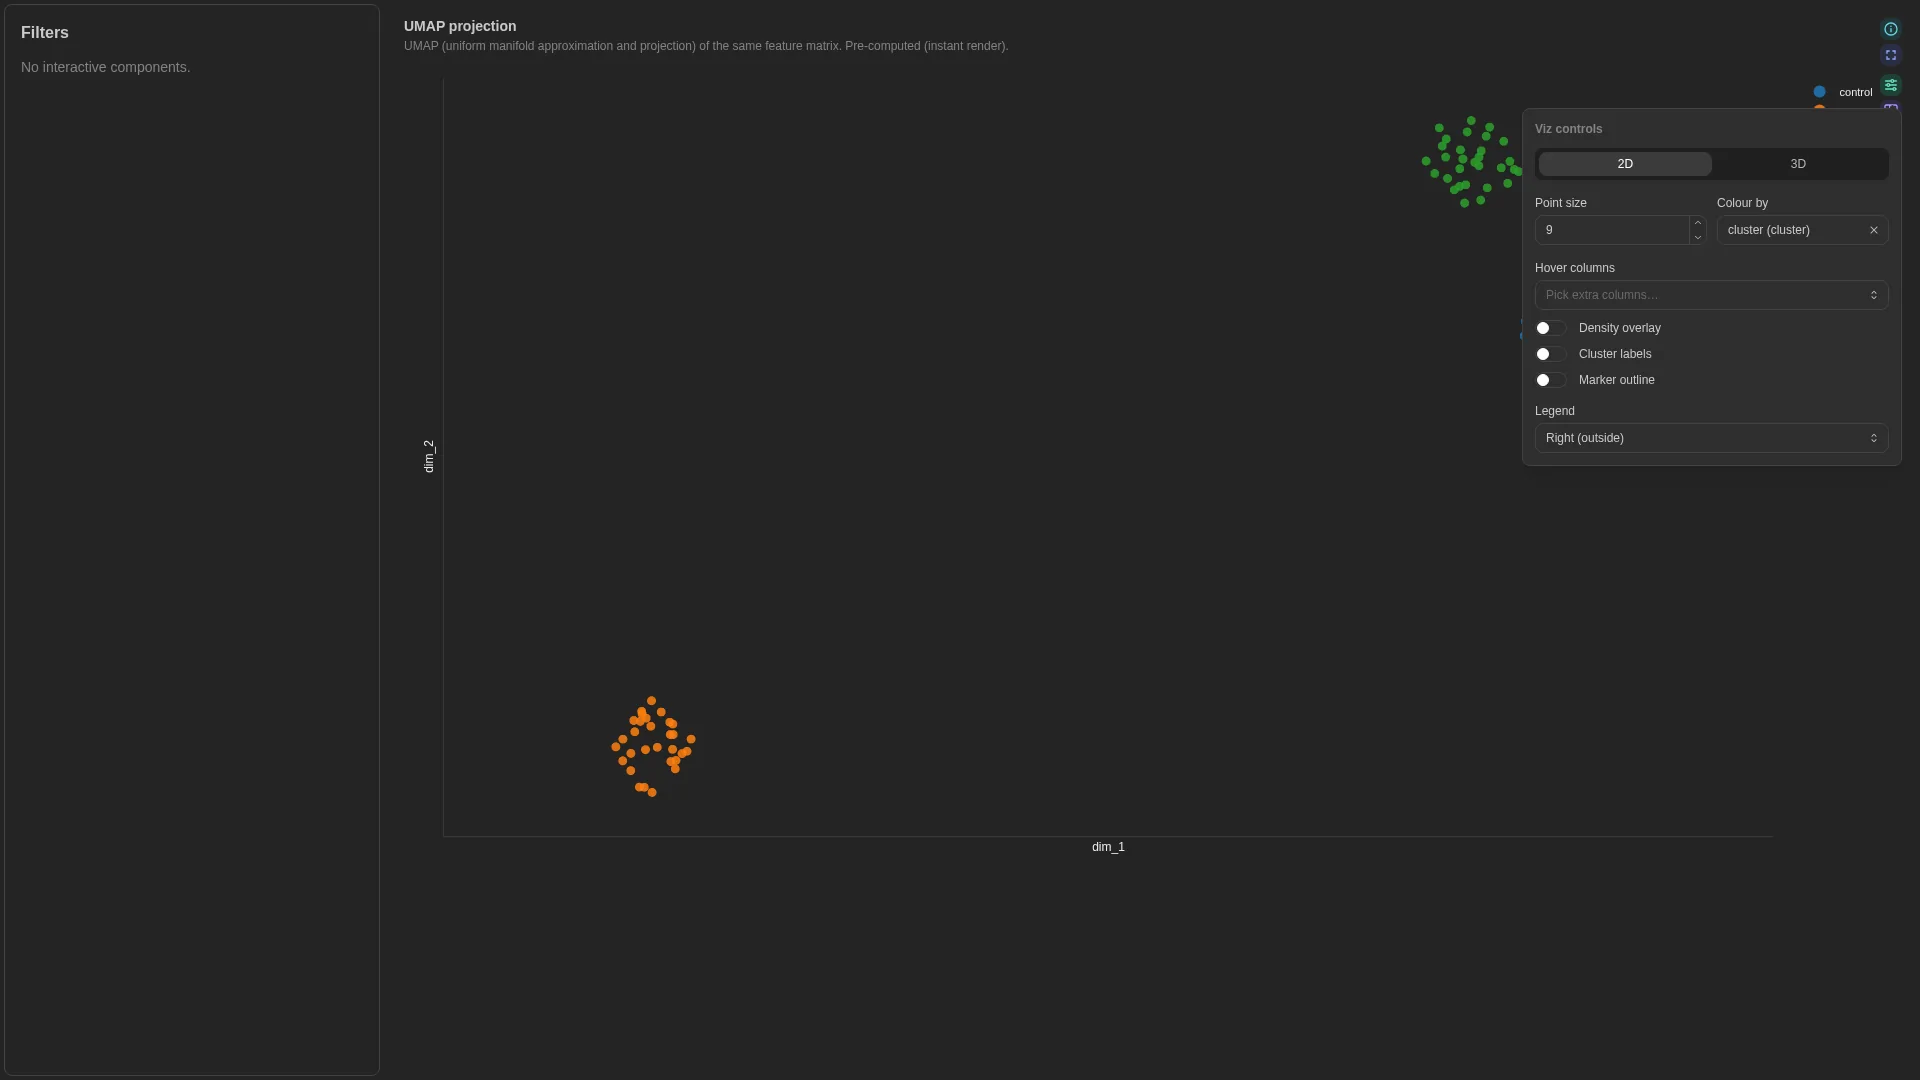
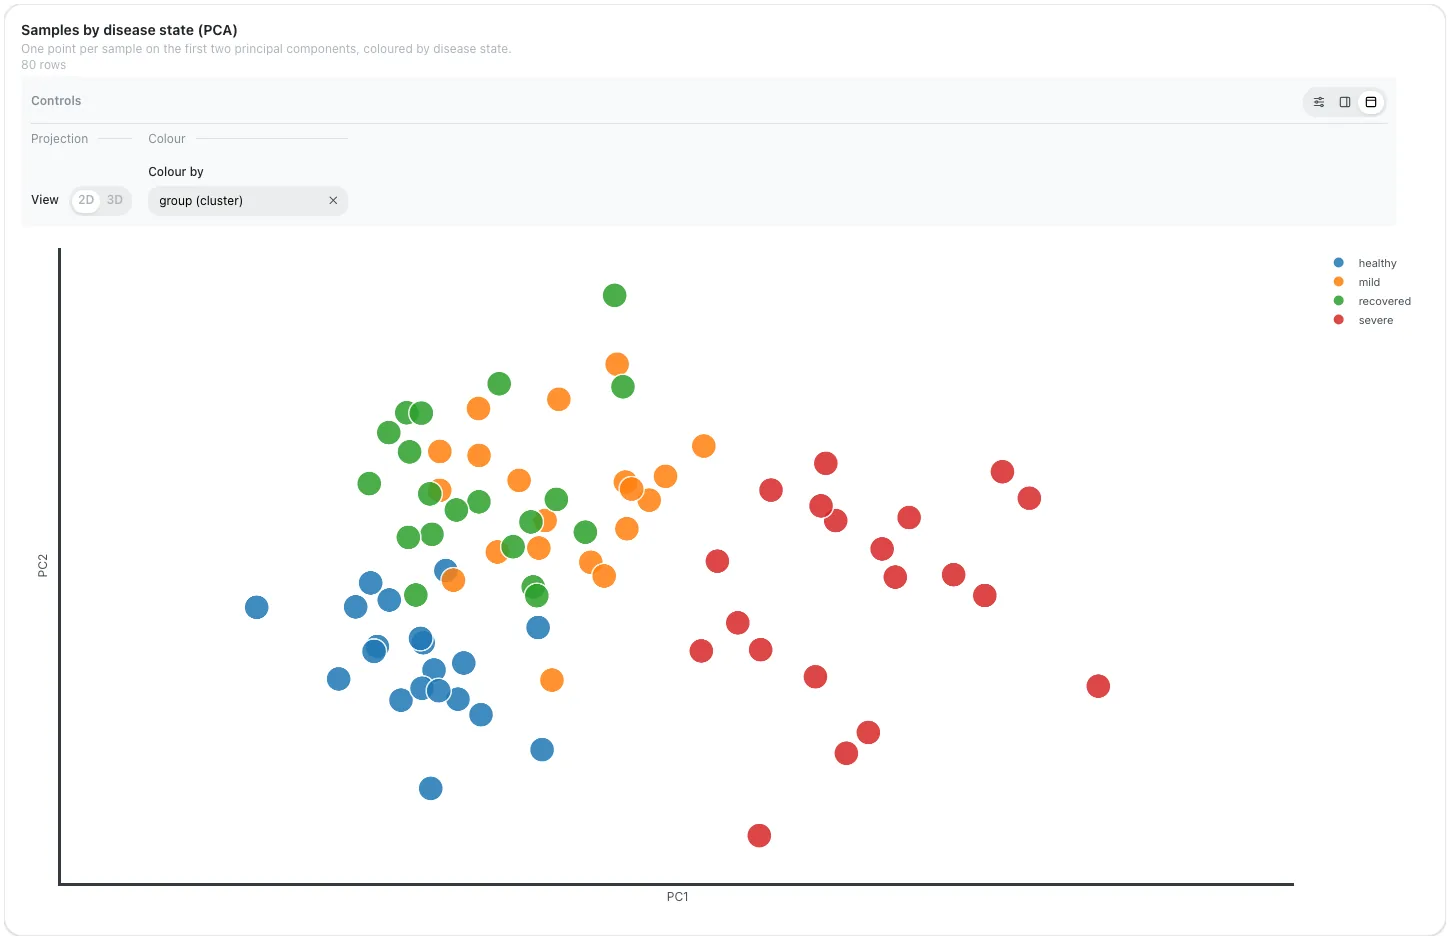
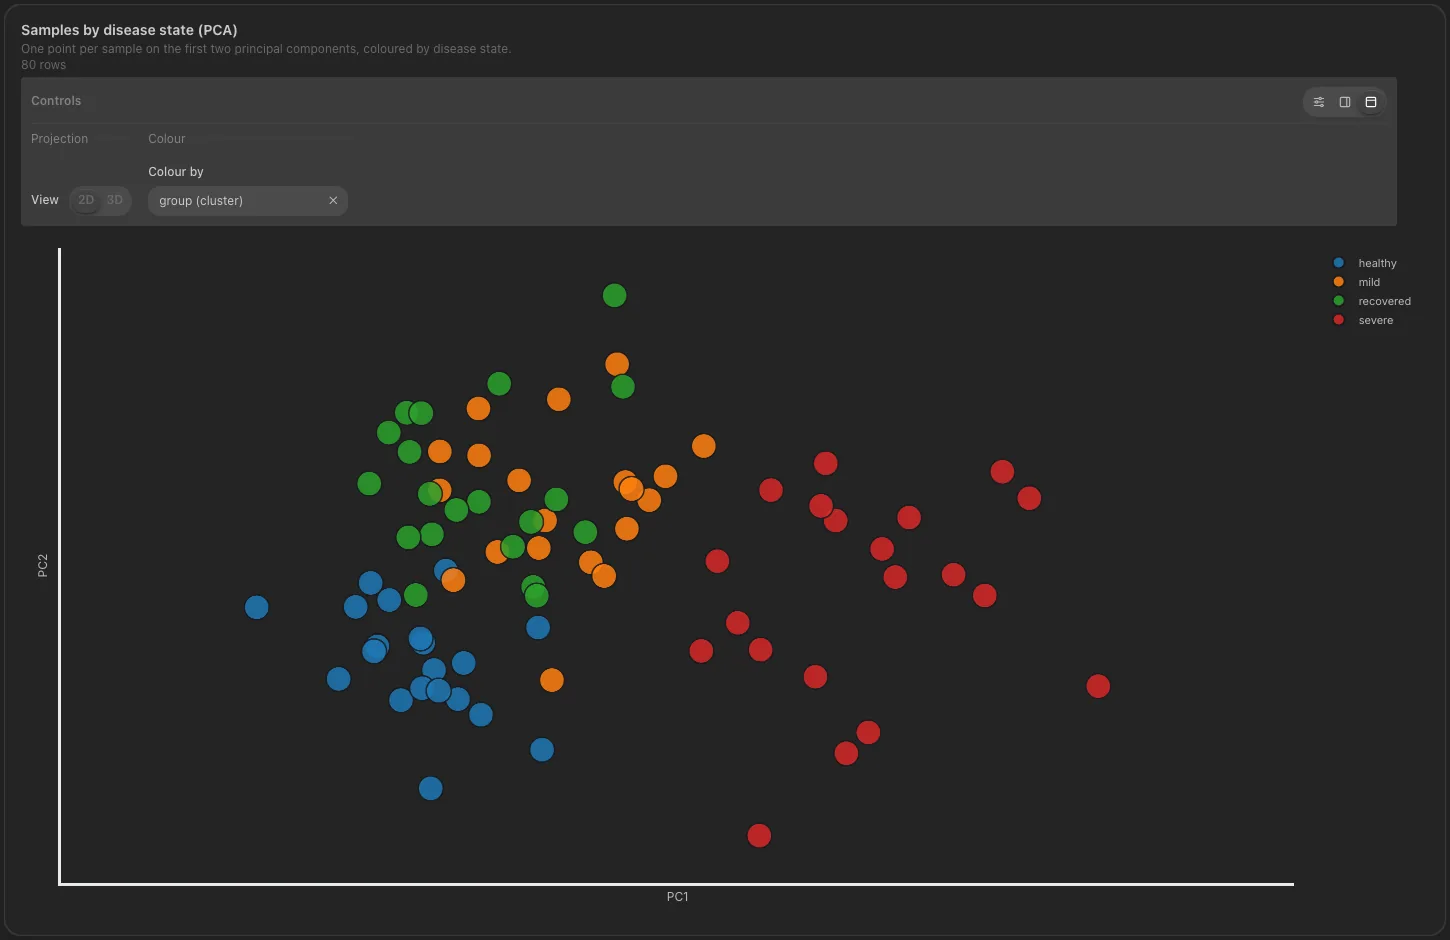
Embedding
v0.13.0+ viz_kind: embedding
Samples or cells in 2D or 3D, from precomputed coordinates or a PCA, UMAP, t-SNE or PCoA computed live on the server.
The same kind on a sample PCA, with Point size at 25:
Input: one row per cell or sample.
| Column | Config key | Need | Type | Example |
|---|---|---|---|---|
cell_id |
sample_id_col |
required | String | AAACCTGAGAAGGCCT-1 |
umap_1 |
dim_1_col |
required | Float | 4.12 |
umap_2 |
dim_2_col |
required | Float | -1.37 |
cluster |
cluster_col |
optional | String | T cells |
umap_3 |
dim_3_col |
optional, adds the 3D view | Float | 0.58 |
CD3E |
color_col |
optional, colour by metadata or expression | Numeric or String | 2.31 |
With compute_method set, the coordinates are computed from the numeric columns instead.
Compatible inputs: scanpy or Seurat coordinates (nf-core/scrnaseq), or any sample by feature matrix with compute_method set.
Controls
- Primary: Method (live mode), View (2D, 3D), Colour by
- Cosmetic: Method parameters, plot style, legend, hover columns, point size, outline, density overlay, centroids
YAML
Dot plot
v0.13.0+ viz_kind: dot_plot
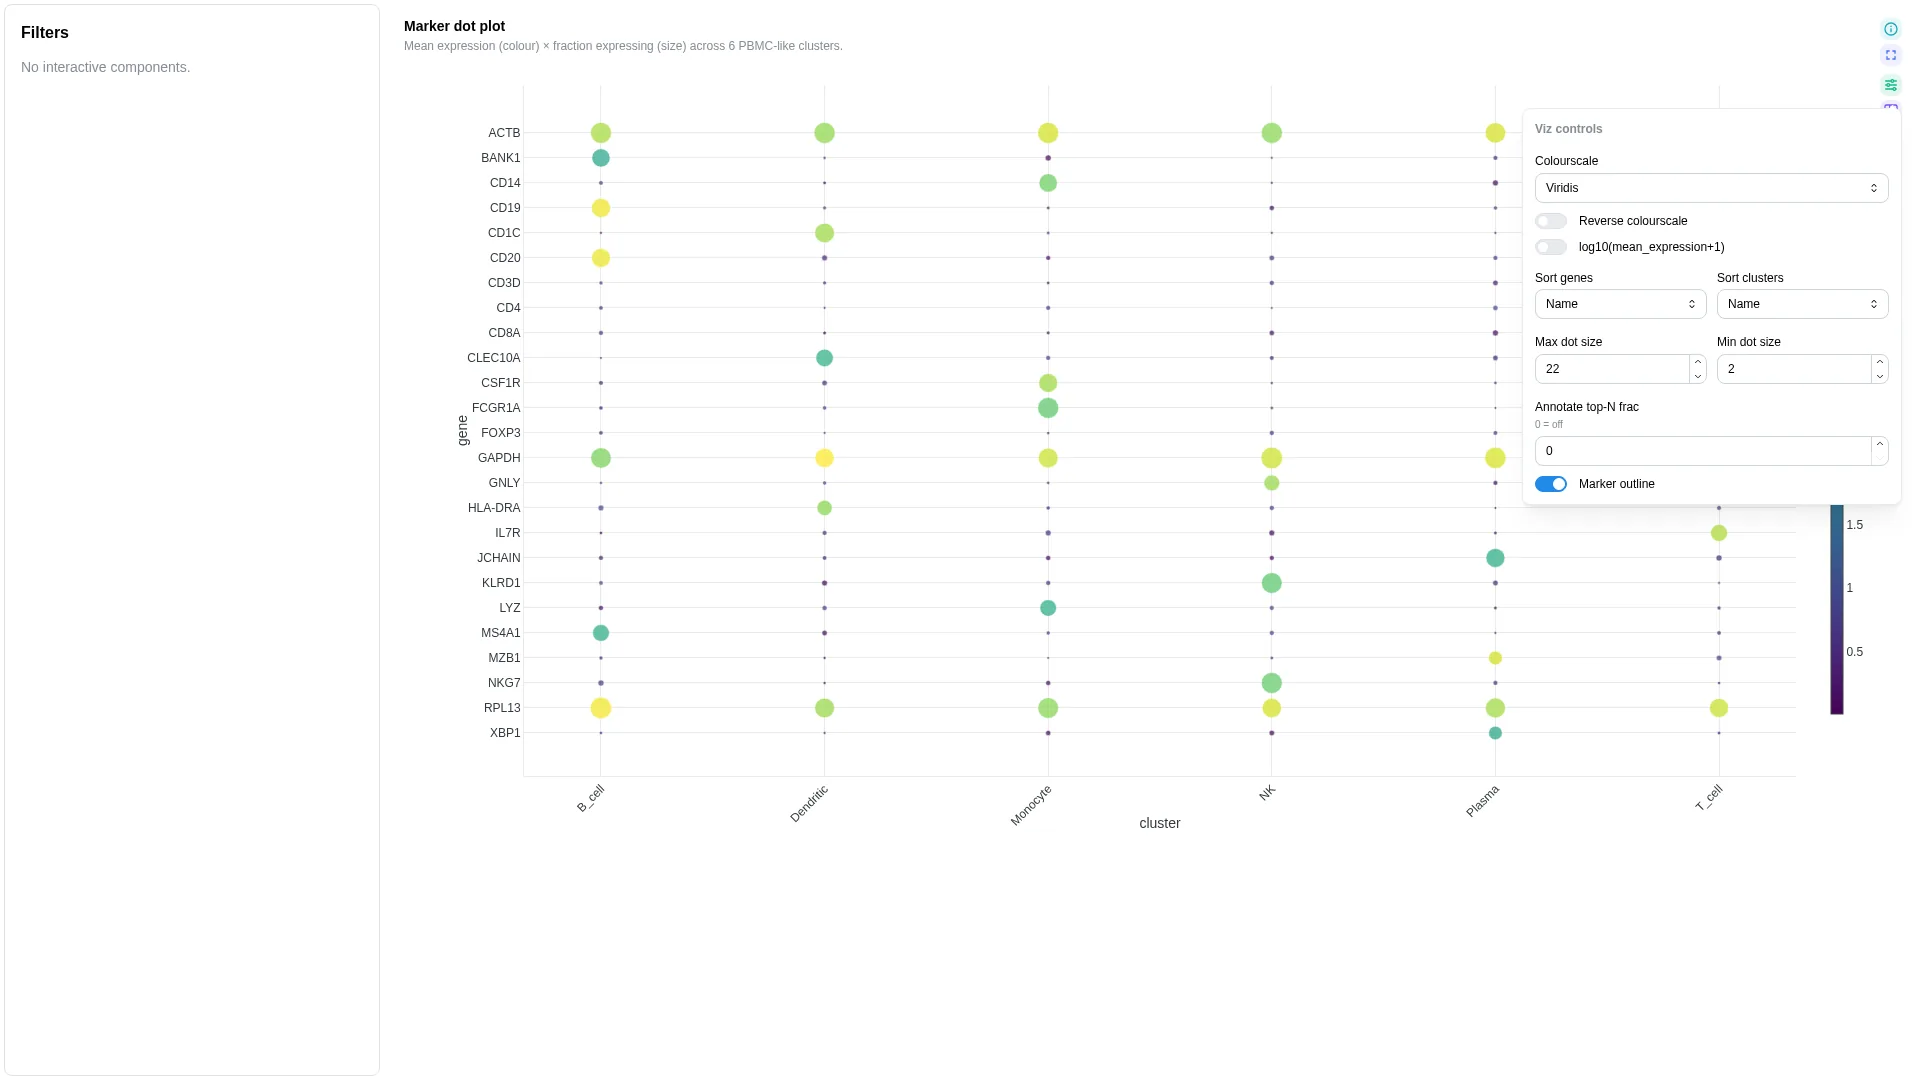
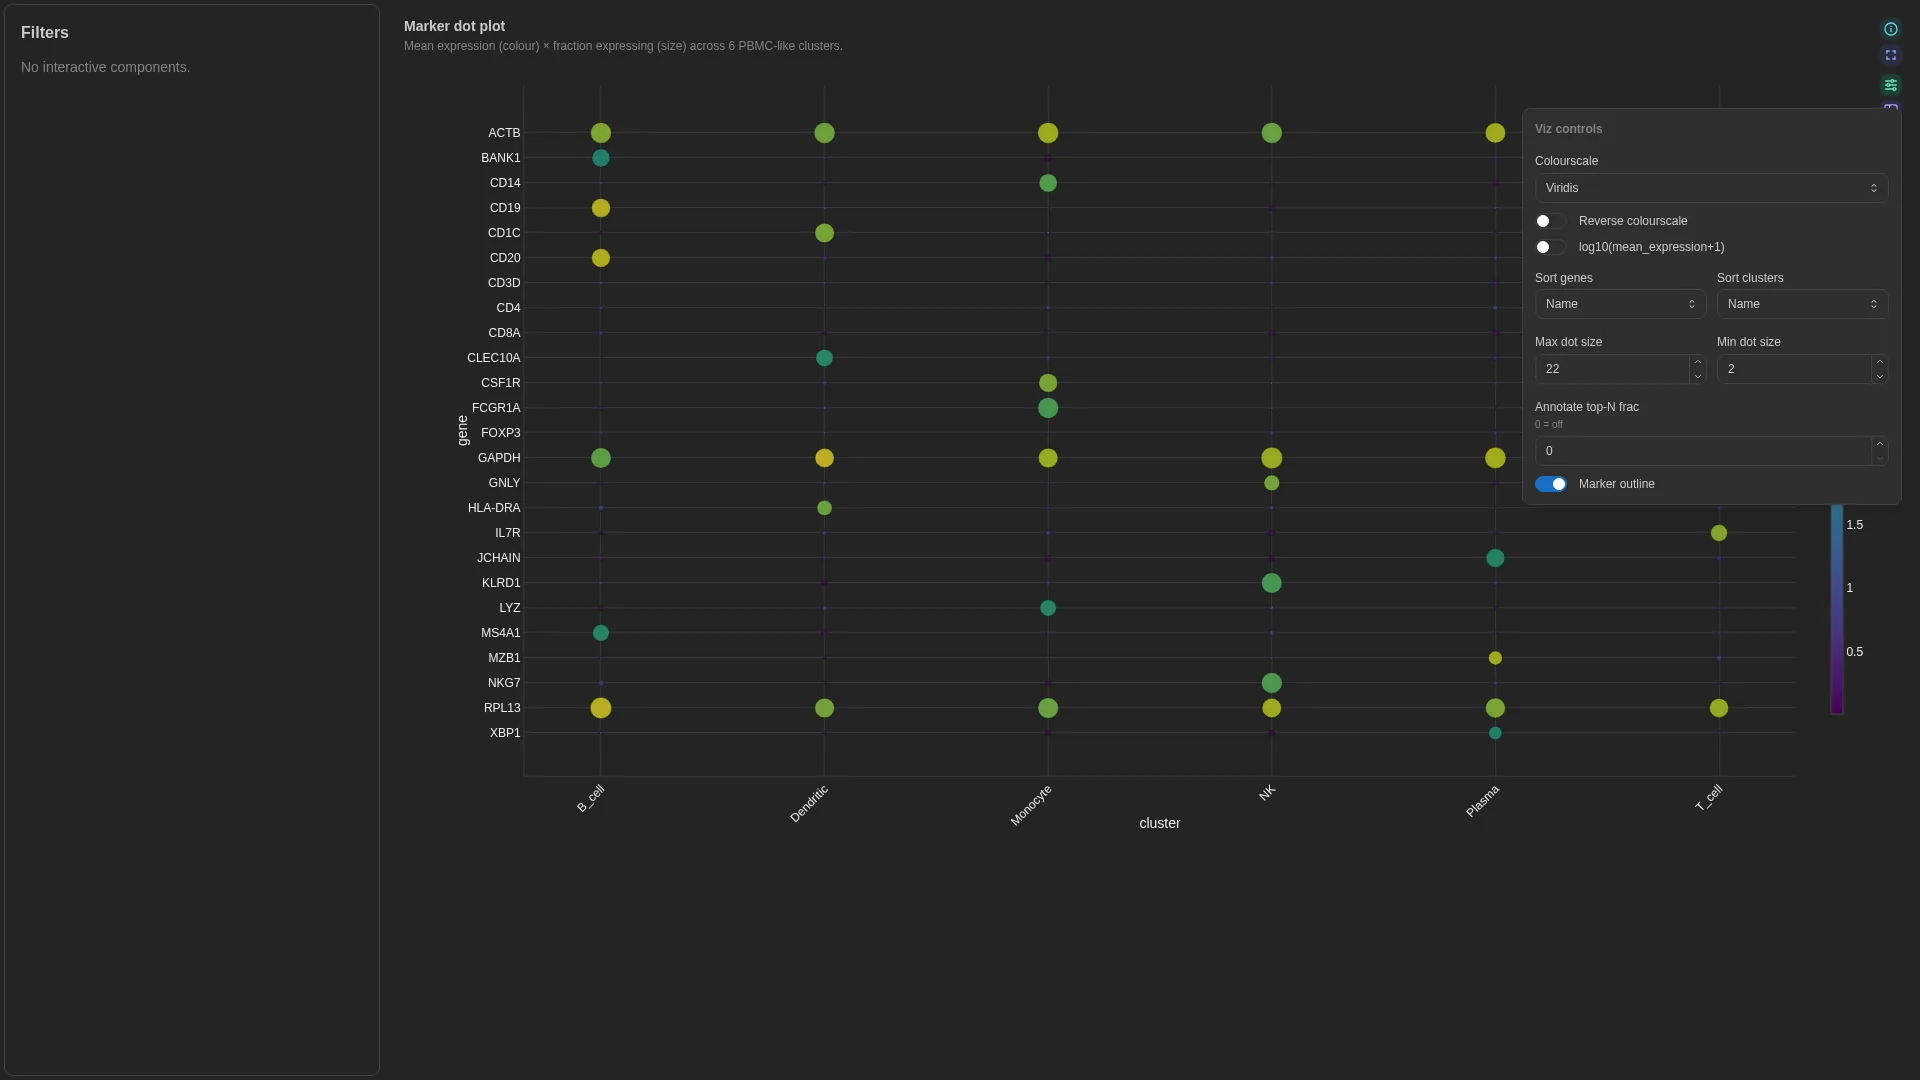
Marker genes by cluster: size is the fraction expressing, colour the mean expression. The enrichment view draws the same marks over a gene-set table.
Input: one row per cluster and gene (long format).
| Column | Config key | Need | Type | Example |
|---|---|---|---|---|
cluster |
cluster_col |
required | String | T cells, B cells |
gene |
gene_col |
required | String | CD3E, MS4A1 |
mean_expression |
mean_expression_col |
required | Float | 2.14 |
frac_expressing |
frac_expressing_col |
required | Float | 0.87 |
Enrichment view, one row per term:
| Column | Config key | Need | Type | Example |
|---|---|---|---|---|
term |
term_col |
required | String | HALLMARK_E2F_TARGETS |
nes |
nes_col |
required | Float | 2.14 |
padj |
padj_col |
optional | Float | 0.0012 |
gene_count |
gene_count_col |
optional | Numeric | 196 |
source |
source_col |
optional | String | GO_BP |
Compatible inputs: scanpy aggregates per cluster (sc.get.aggregate); clusterProfiler, GSEA or g:Profiler results for the enrichment view.
Controls
- Primary: View (Dot plot, Enrichment); dot plot: Sort genes, Sort clusters, Max genes; enrichment: Source, Top-N pathways, padj threshold, Colour by, Sort terms
- Cosmetic: Colourscale, reverse colourscale, max and min dot size, outline, labels
YAML
Knee plot
v1.13.0+ viz_kind: knee_plot
Barcode rank against UMI count, one curve per library, with the cell-calling cutoff.
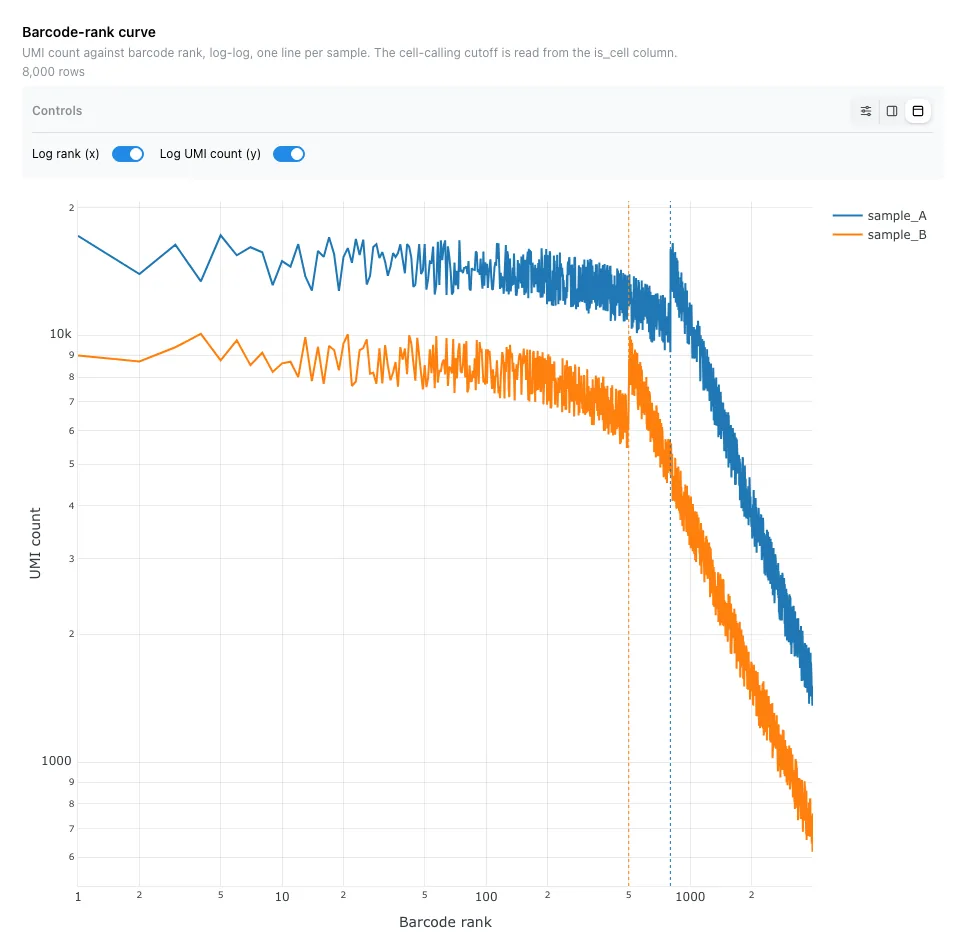
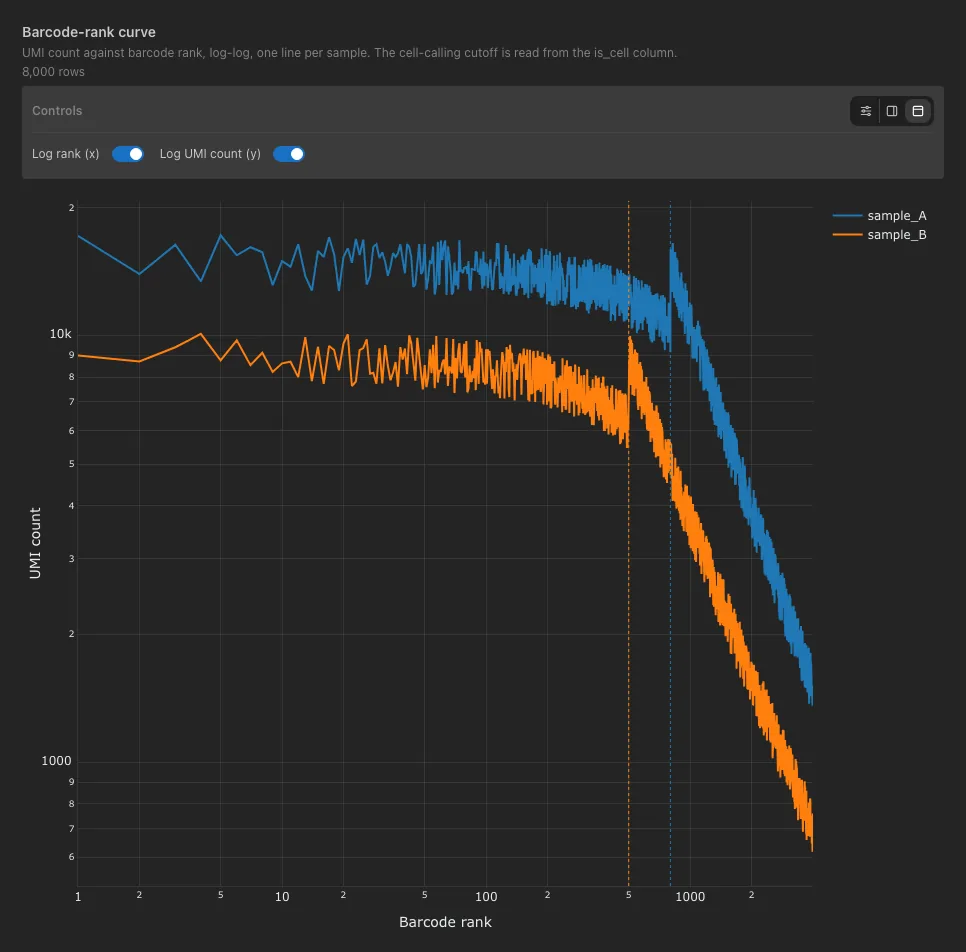
Input: one row per library and barcode rank.
| Column | Config key | Need | Type | Example |
|---|---|---|---|---|
sample |
sample_col |
required | String | pbmc_1k |
rank |
rank_col |
required | Numeric | 1, 1250 |
umi_count |
umi_count_col |
required | Numeric | 48213, 312 |
is_cell |
is_cell_col |
optional, the cell-calling cutoff | Boolean or 0/1 | true, false |
Compatible inputs: STARsolo, alevin-fry or Cell Ranger barcode counts (nf-core/scrnaseq).
Controls
- Primary: Log rank (x), Log UMI count (y)
- Cosmetic: Show cell-calling cutoff
YAML
Genome tracks
Coverage track
v0.13.0+ viz_kind: coverage_track
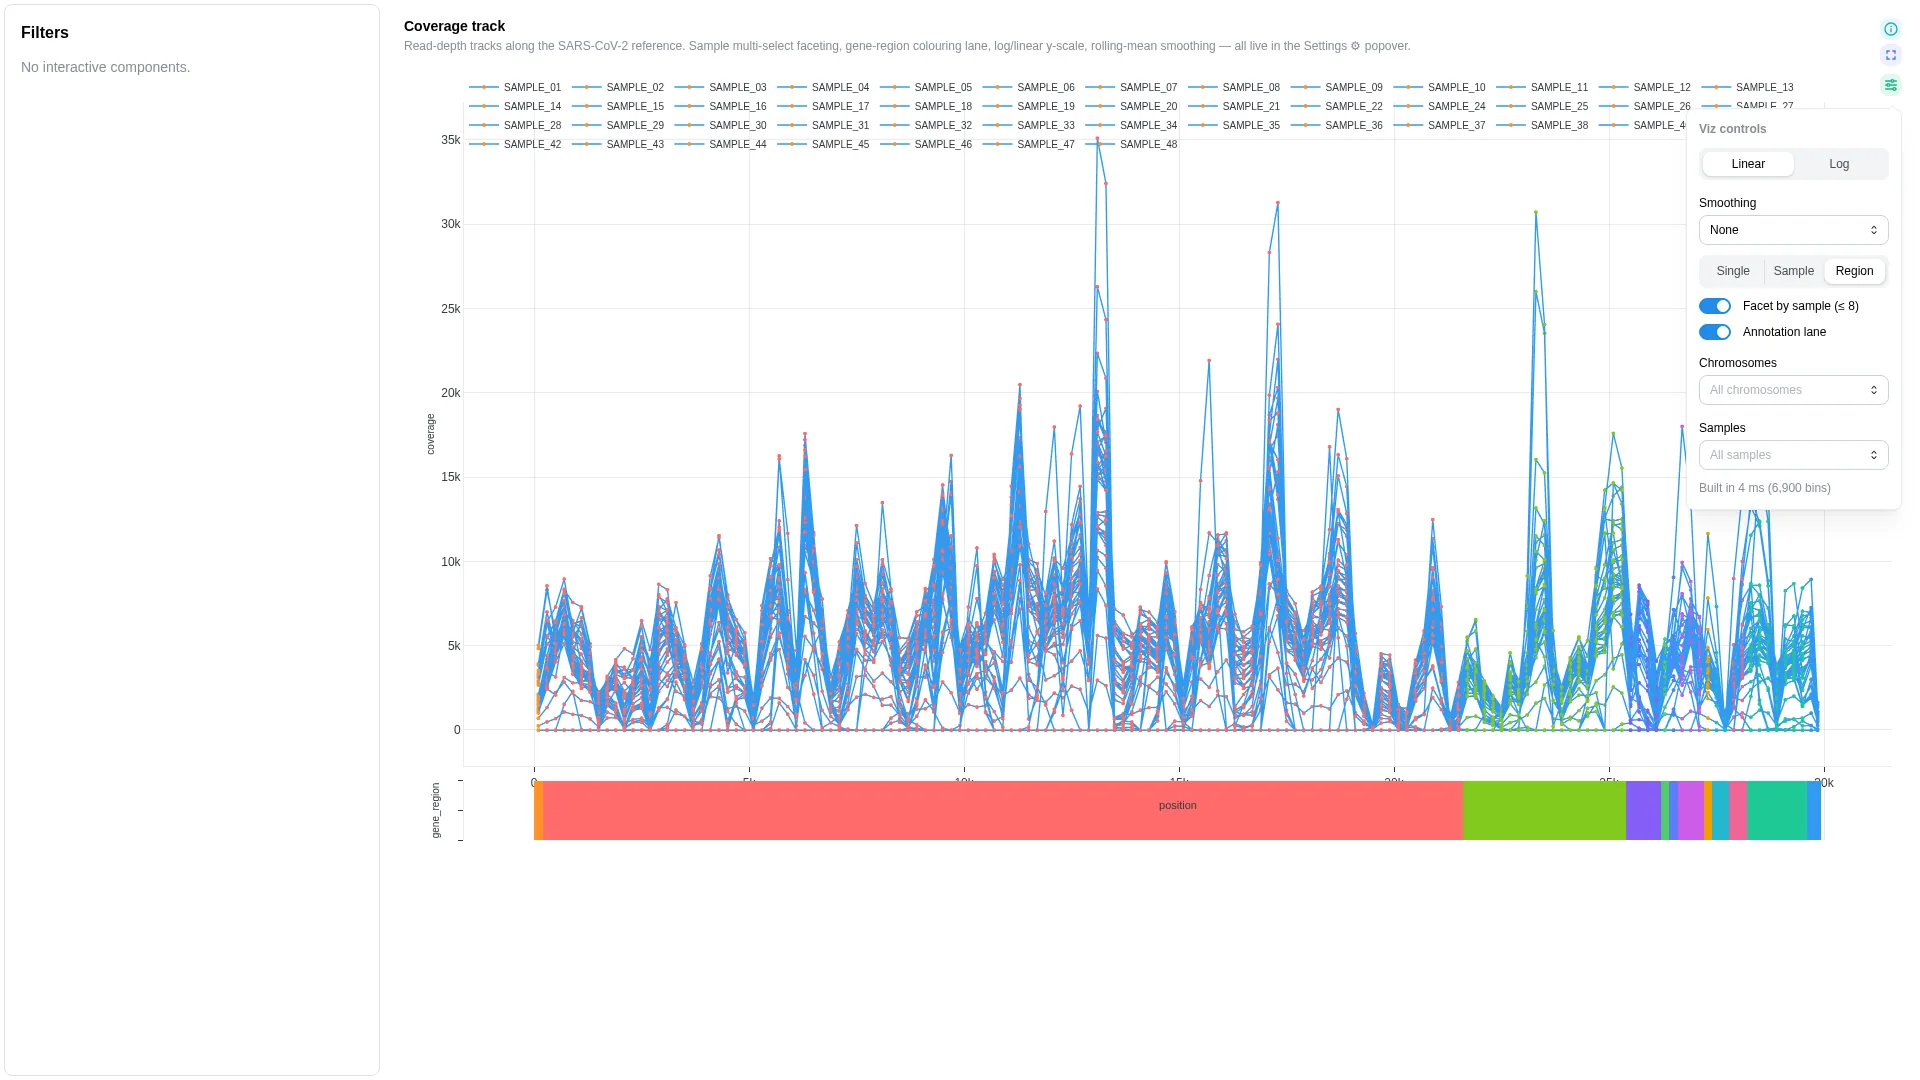
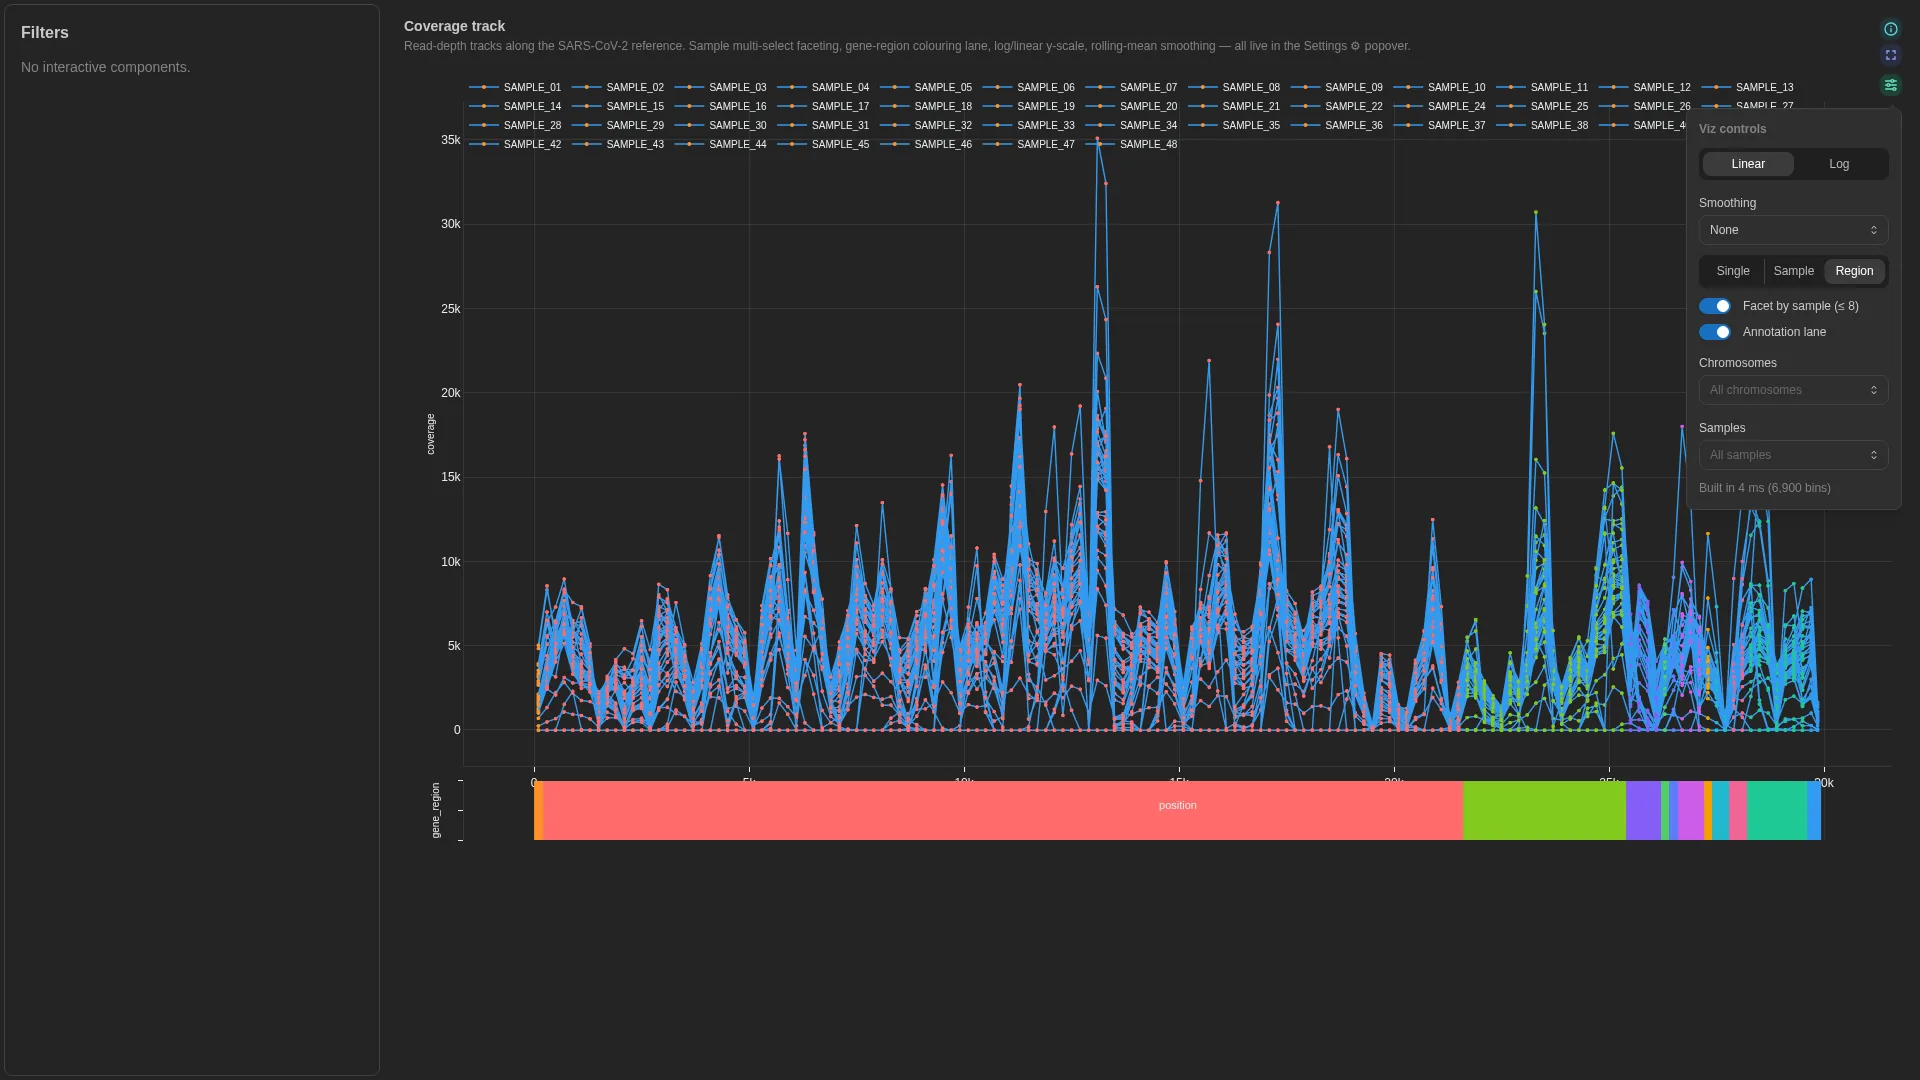
Depth or signal along a chromosome, per sample or as a cohort median. The locus view redraws it as a zoomable GenomeSpy track.
Input: one row per sample and bin (or base).
| Column | Config key | Need | Type | Example |
|---|---|---|---|---|
chrom |
chromosome_col |
required | String | MN908947.3 |
start |
position_col |
required | Integer | 0, 100 |
depth |
value_col |
required | Numeric | 812 |
end |
end_col |
optional, bins as intervals | Integer | 100, 200 |
sample |
sample_col |
optional | String | SAMPLE_01 |
amplicon |
category_col |
optional, colour by | String | nCoV-2019_1 |
Compatible inputs: mosdepth per-base or per-bin depth (nf-core/viralrecon, sarek, rnaseq), bigWig-derived bins.
Controls
- Primary: View (Track, Locus), Sample layout, Y scale, Smoothing, Chromosomes, Samples
- Cosmetic: Mark, Colour by, Show individual traces, gene strip
YAML
Genome view
v1.13.0+ viz_kind: genome_view
A GenomeSpy track on a chromosome axis: scroll to zoom, drag to pan, brush or type a locus to filter the dashboard by region.
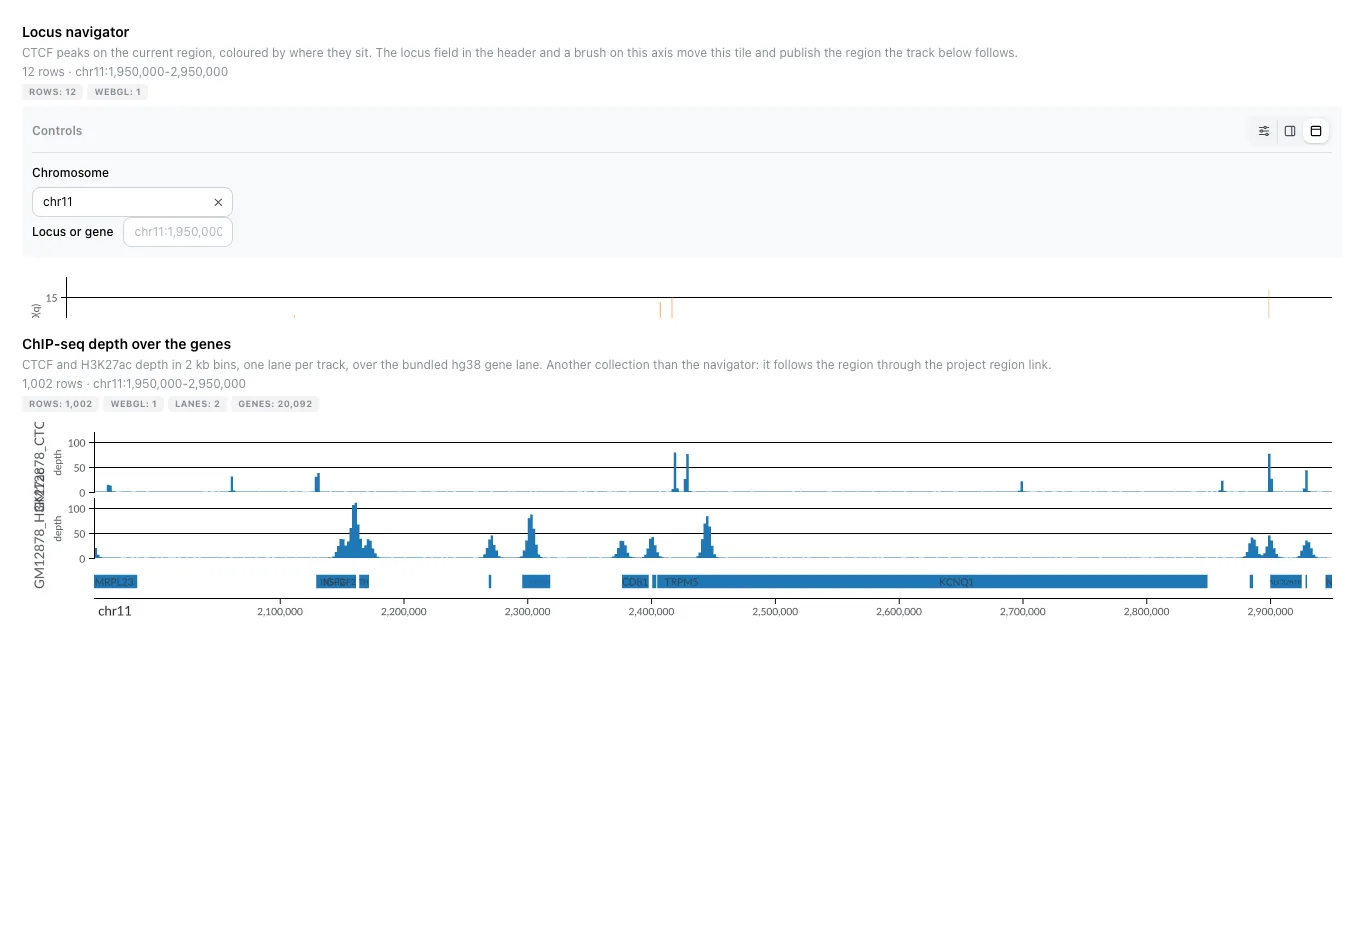
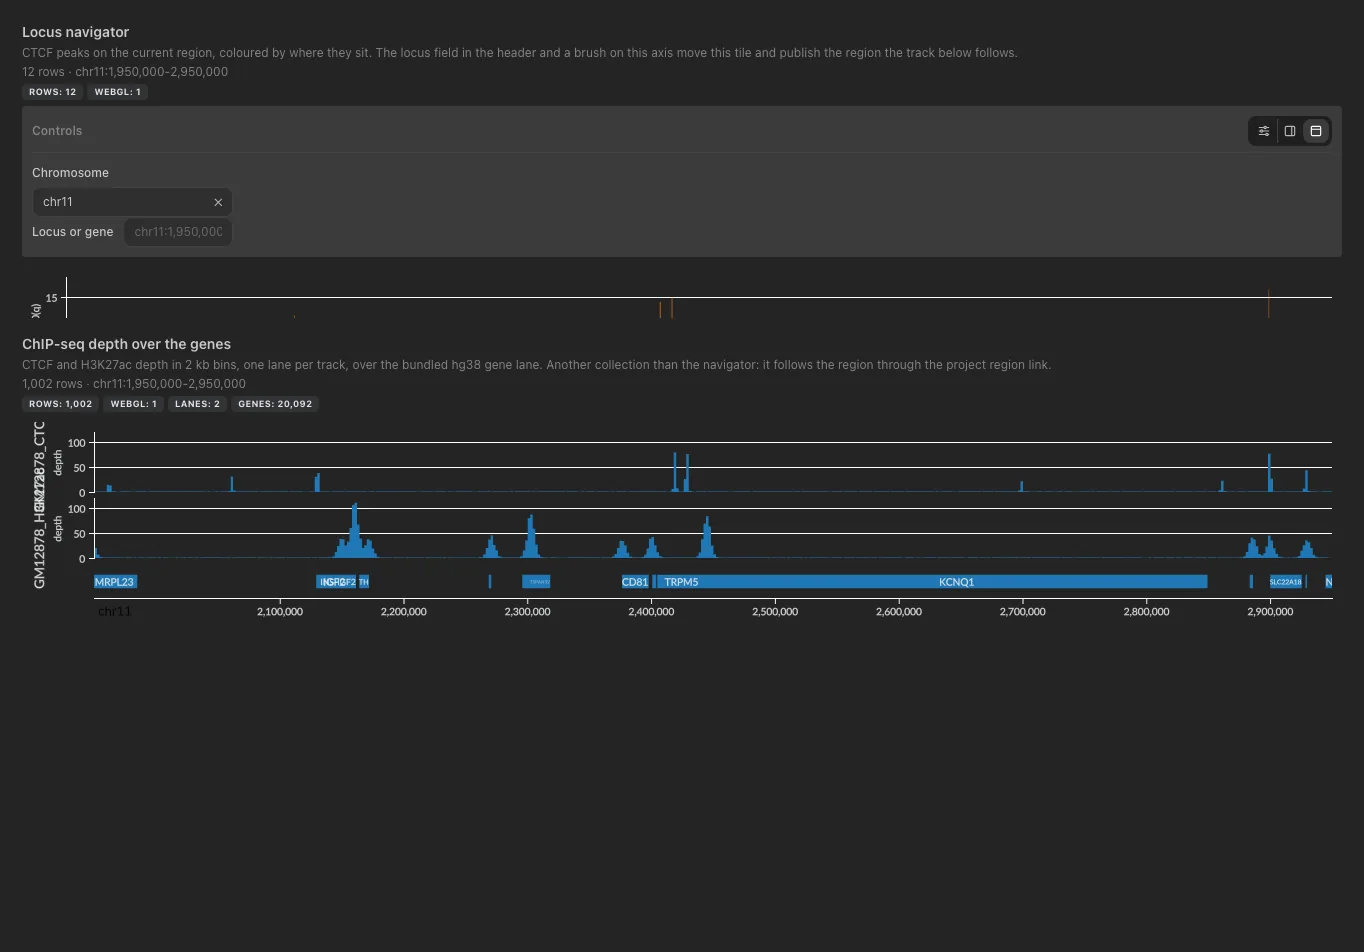
Input: one row per position, or per interval with end.
| Column | Config key | Need | Type | Example |
|---|---|---|---|---|
chrom |
chr_col |
required | String | chr8 |
start |
pos_col |
required | Integer | 127735800 |
score |
score_col |
required | Float | 42.7 |
end |
end_col |
optional, rows as intervals | Integer | 127736600 |
peak_class |
category_col |
optional, mark colour | String | promoter, enhancer |
feature |
feature_col |
optional, hover name | String | peak_00412 |
sample |
sample_col |
optional, one lane per sample | String | H3K27ac_rep1 |
Compatible inputs: Any chr / pos / score table: peaks, depth bins, association scores.
Controls
- Primary: Chromosome, Locus or gene
- Cosmetic: Mark, point size, opacity, threshold rule, one lane per sample, max lanes, assembly, gene annotation lane, zoom to an incoming region
YAML
- tag: viz-genome-view
  component_type: advanced_viz
  workflow_tag: my_workflow
  data_collection_tag: peaks
  viz_kind: genome_view
  config:
    viz_kind: genome_view
    chr_col: chrom
    pos_col: start
    end_col: end
    score_col: score
    category_col: peak_class
    mark: bar
    assembly: hg38
    default_region: "chr8:127,400,000-128,100,000"
Copy-number profile
v1.13.0+ viz_kind: cnv_profile
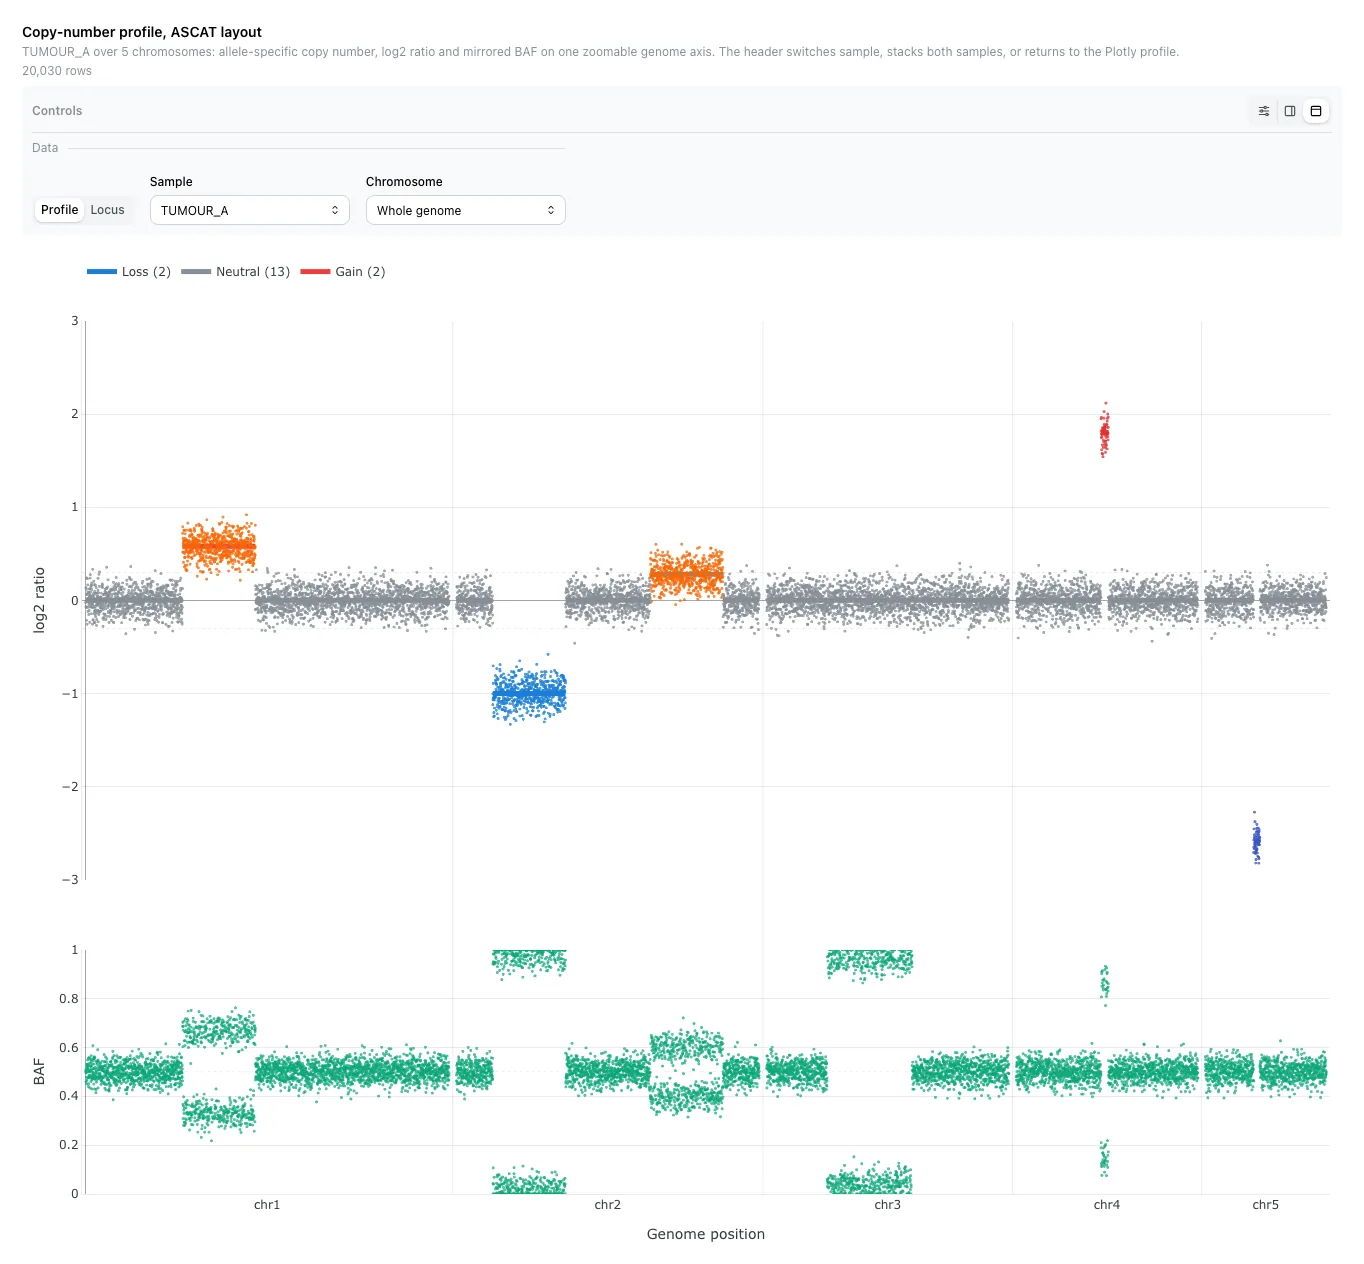
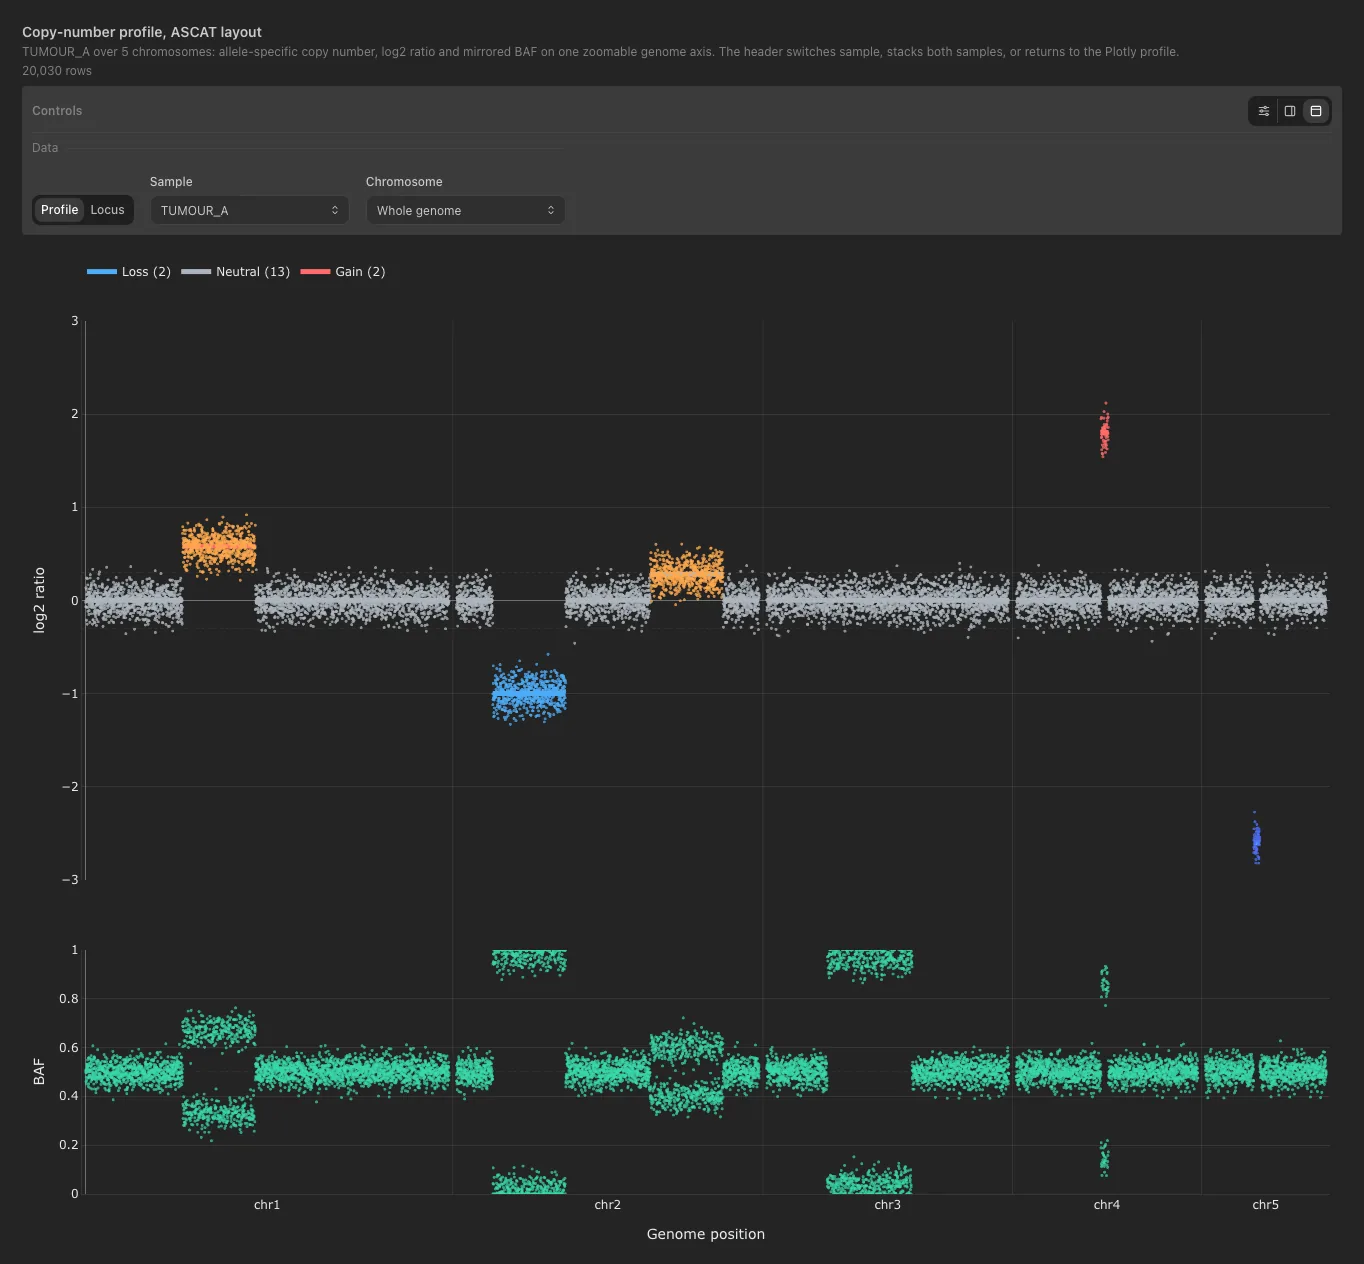
Log2 ratio per bin with the called segments over it and the B-allele frequency underneath. The locus view draws the allele-specific layout.
Input: one row per bin or called segment, both in one table.
| Column | Config key | Need | Type | Example |
|---|---|---|---|---|
sample |
sample_col |
required | String | TUMOUR_A |
chrom |
chrom_col |
required | String | chr1 |
start |
start_col |
required | Numeric | 1000000 |
end |
end_col |
required | Numeric | 1100000 |
log2 |
log2_col |
required | Numeric | 0.14, 0.06 |
baf |
baf_col |
optional, the BAF panel | Float | 0.48 |
segment |
segment_col |
optional, segment rows draw as segments, the rest as bins |
String | bin, segment |
copy_number |
copy_number_col |
optional | Numeric | 2 |
label |
label_col |
optional, hover label | String | TP53 |
Compatible inputs: CNVkit, ASCAT or Control-FREEC bins and segments (nf-core/sarek).
Controls
- Primary: View (Plotly, Locus), Sample, Chromosome
- Cosmetic: log2 axis limit, bin marker size, Show BAF panel, gene lane
YAML
- tag: viz-cnv-profile
  component_type: advanced_viz
  workflow_tag: my_workflow
  data_collection_tag: cnv_bins_segments
  viz_kind: cnv_profile
  config:
    viz_kind: cnv_profile
    sample_col: sample
    chrom_col: chrom
    start_col: start
    end_col: end
    log2_col: log2
    baf_col: baf
    segment_col: segment
    views: [plotly, locus]
Contact map
v1.13.0+ viz_kind: contact_map
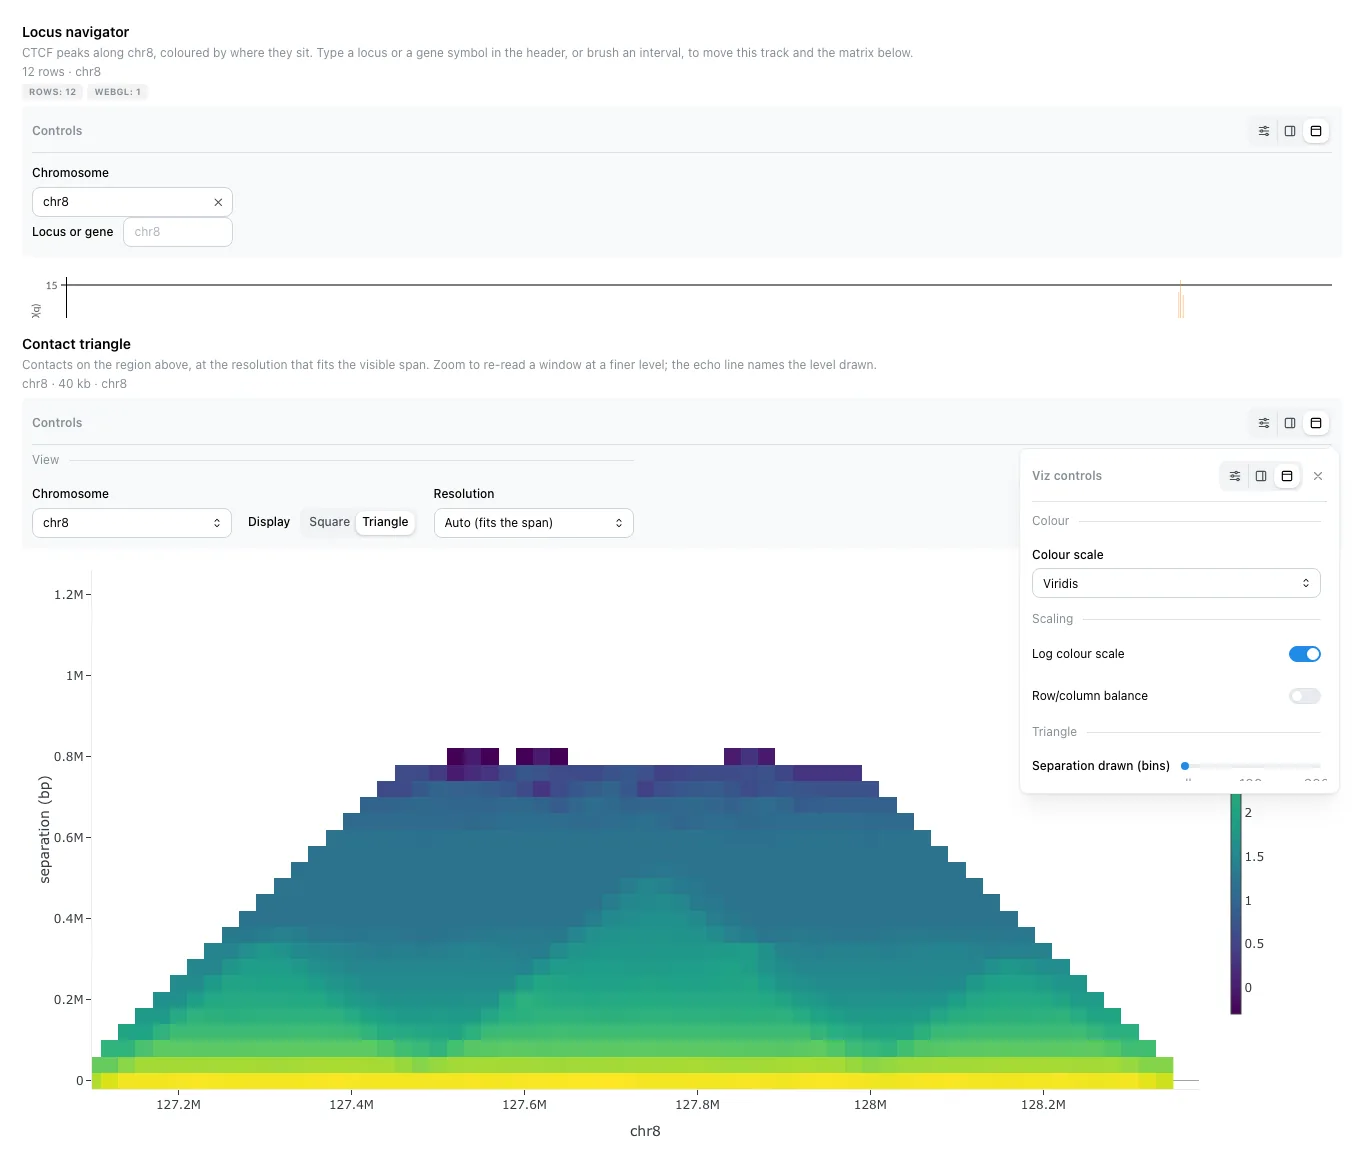
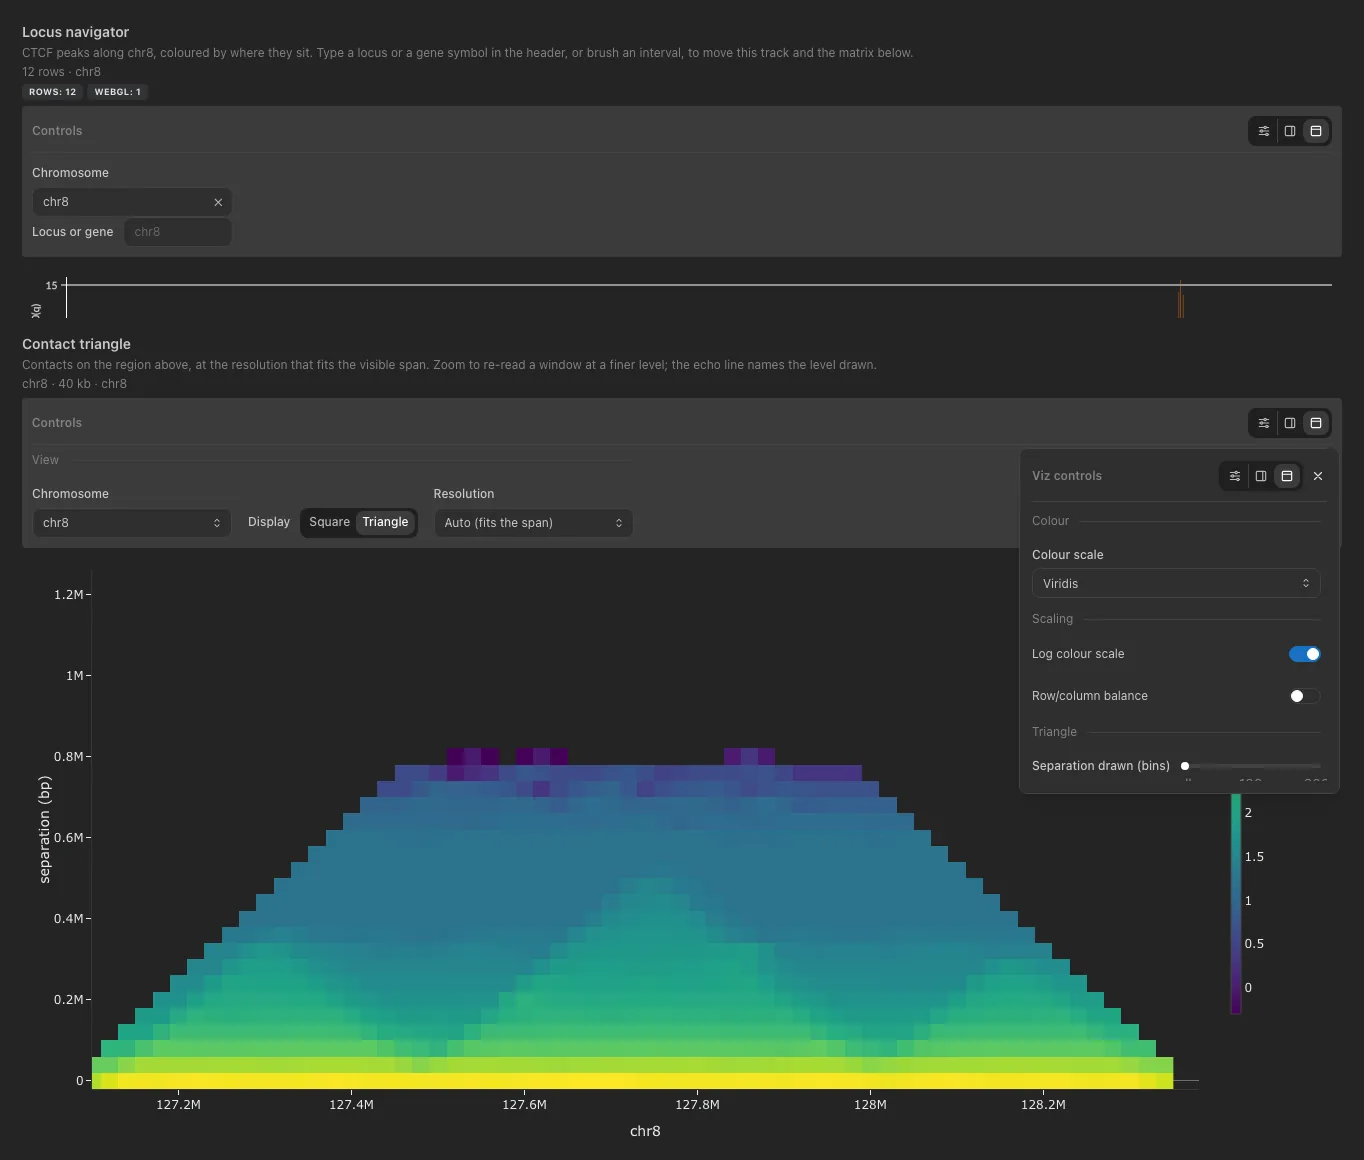
A binned Hi-C matrix, square or as a triangle under a genome track. Zooming re-reads the best resolution for the window.
Input: one row per pair of bins.
| Column | Config key | Need | Type | Example |
|---|---|---|---|---|
chrom |
chrom1_col |
required | String | chr1 |
start |
start1_col |
required | Numeric | 0 |
chrom2 |
chrom2_col |
required | String | chr1 |
start2 |
start2_col |
required | Numeric | 100000 |
count |
count_col |
required | Numeric | 2841, 932 |
resolution |
resolution_col |
optional, one matrix per resolution | Numeric | 100000, 500000 |
end |
end1_col |
optional | Numeric | 100000 |
end2 |
end2_col |
optional | Numeric | 200000 |
sample |
sample_col |
optional | String | HeLa_rep1 |
Compatible inputs: cooler .mcool pixels dumped per resolution (nf-core/hic).
Controls
- Primary: Chromosome, Display (square, triangle), Resolution
- Cosmetic: Colour scale, log colour scale, row/column balance, separation drawn
YAML
Transcript structure
v1.13.0+ viz_kind: transcript_structure
The isoforms of one gene, one lane per transcript, exons as blocks and coding parts taller.
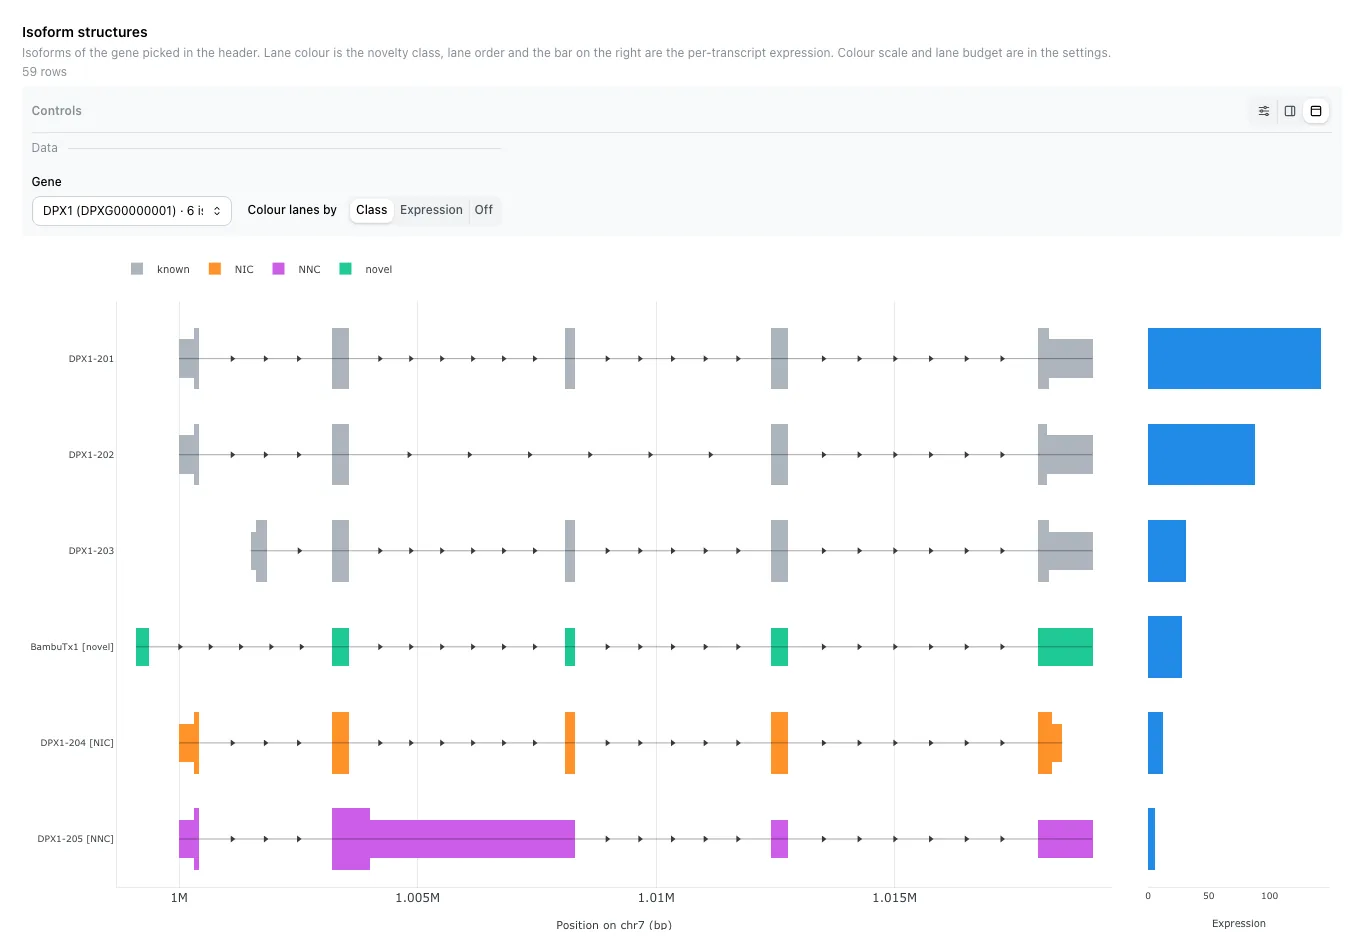
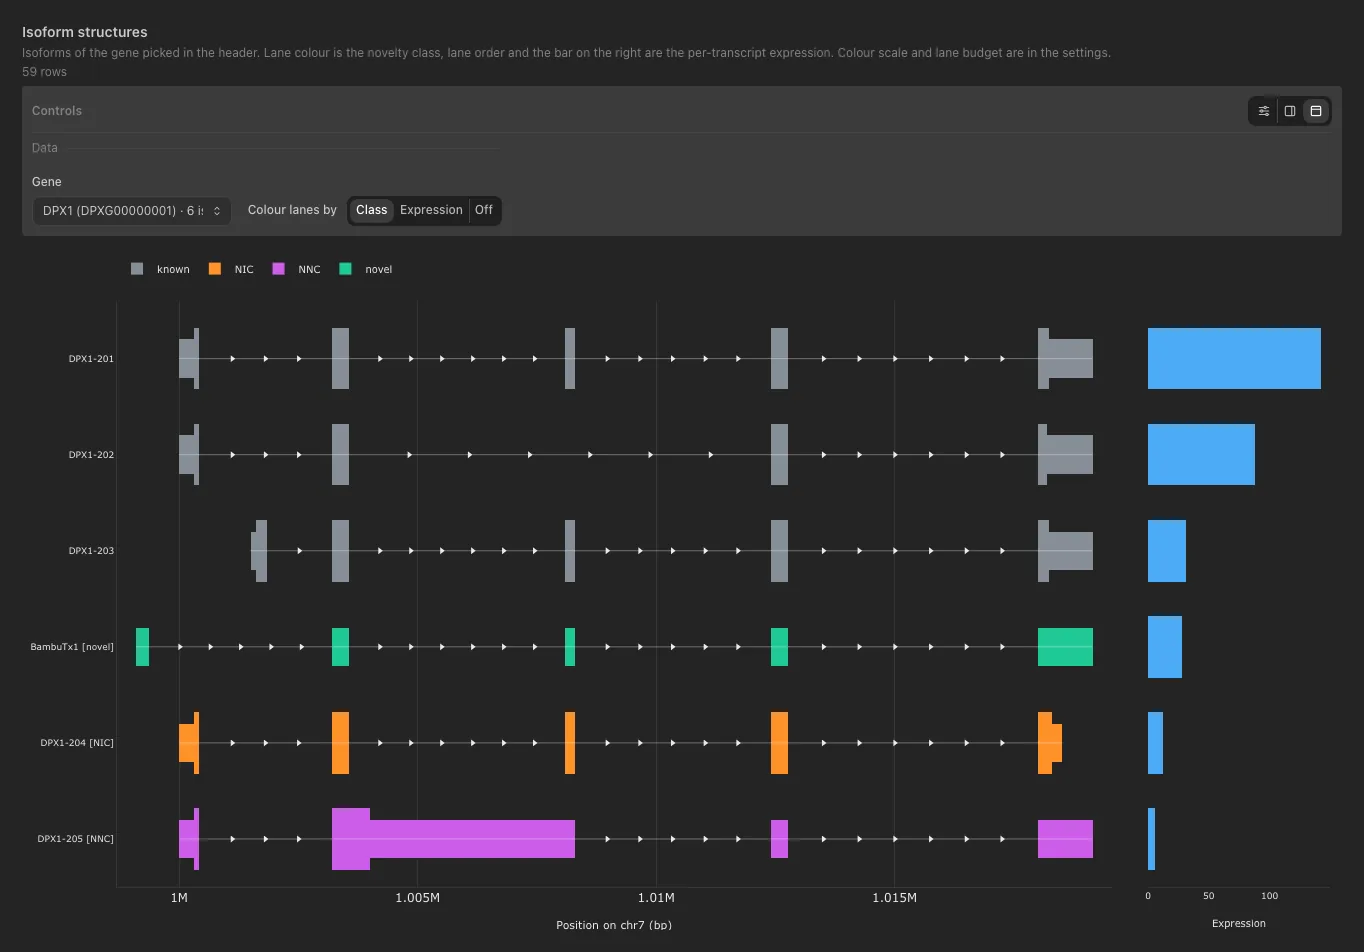
Input: one row per exon or CDS block.
| Column | Config key | Need | Type | Example |
|---|---|---|---|---|
transcript_id |
transcript_id_col |
required | String | ENST00000269305 |
gene_id |
gene_id_col |
required | String | ENSG00000141510 |
chrom |
chrom_col |
required | String | chr17 |
start |
start_col |
required | Numeric | 7661779 |
end |
end_col |
required | Numeric | 7662014 |
feature |
feature_col |
required | String | exon, CDS |
strand |
strand_col |
required | String | - |
transcript_class |
transcript_class_col |
optional, lane colour | String | known, novel |
sample |
sample_col |
optional | String | WT_REP1 |
gene_name |
gene_name_col |
optional | String | TP53 |
expression |
expression_col |
optional, bar beside each lane | Numeric | 12.4 |
Compatible inputs: StringTie or bambu GTF exon and CDS rows (nf-core/nanoseq, rnaseq).
Controls
- Primary: Gene, Sample, Colour lanes by
- Cosmetic: Colour scale, bar beside each lane, isoforms drawn
YAML
- tag: viz-transcript-structure
  component_type: advanced_viz
  workflow_tag: my_workflow
  data_collection_tag: transcript_blocks
  viz_kind: transcript_structure
  config:
    viz_kind: transcript_structure
    transcript_id_col: transcript_id
    gene_id_col: gene_id
    chrom_col: chrom
    start_col: start
    end_col: end
    feature_col: feature
    strand_col: strand
    transcript_class_col: transcript_class
Sashimi
v1.11.0+ viz_kind: sashimi
Splice junctions as arcs over a region, weighted by read support, with coverage and an exon model underneath.
Input: one row per junction and sample.
| Column | Config key | Need | Type | Example |
|---|---|---|---|---|
chrom |
chr_col |
required | String | chr17 |
start |
start_col |
required | Numeric | 7670715 |
end |
end_col |
required | Numeric | 7673534 |
count |
count_col |
required | Numeric | 412, 23 |
sample |
sample_col |
optional | String | WT_REP1 |
annotation |
annotation_col |
optional | String | known, novel |
Coverage (coverage_dc_tag, optional), one row per bin:
| Column | Config key | Need | Type | Example |
|---|---|---|---|---|
chrom |
coverage_chr_col |
required | String | chr17 |
start |
coverage_position_col |
required | Numeric | 7670700 |
depth |
coverage_value_col |
required | Numeric | 388 |
end |
coverage_end_col |
optional | Numeric | 7670750 |
sample |
coverage_sample_col |
optional, matches the junction sample |
String | WT_REP1 |
Compatible inputs: STAR SJ.out.tab junctions plus binned coverage (nf-core/rnaseq, rnafusion, nanoseq).
Controls
- Primary: View (Plotly, GenomeSpy), Locus
- Cosmetic: Junctions kept, zoom, read depth under the arcs, log depth axis, exon support, exon model lane, arc width and colour
YAML
- tag: viz-sashimi
  component_type: advanced_viz
  workflow_tag: my_workflow
  data_collection_tag: junctions
  viz_kind: sashimi
  config:
    viz_kind: sashimi
    chr_col: chrom
    start_col: start
    end_col: end
    count_col: count
    sample_col: sample
    annotation_col: annotation
    coverage_dc_tag: binned_coverage
    coverage_chr_col: chrom
    coverage_position_col: start
    coverage_end_col: end
    coverage_value_col: depth
    coverage_sample_col: sample
    views: [genomespy, plotly]
Gene arrow track
v1.11.0+ viz_kind: gene_arrow_track
One arrow per coding sequence along a contig, the way a gene cluster or a resistance cassette is read.
Input: one row per gene.
| Column | Config key | Need | Type | Example |
|---|---|---|---|---|
contig |
contig_col |
required | String | NODE_12_length_84211 |
feature_id |
feature_id_col |
required | String | PROKKA_01234 |
start |
start_col |
required | Numeric | 1200 |
end |
end_col |
required | Numeric | 2850 |
strand |
strand_col |
required | String | +, - |
gene_class |
class_col |
optional, arrow colour | String | biosynthetic |
label |
label_col |
optional, text above the arrow | String | ermB |
region_start |
region_start_col |
optional, the lane window | Numeric | 1000 |
region_end |
region_end_col |
optional, the lane window | Numeric | 25000 |
Compatible inputs: antiSMASH or nf-core/funcscan BGC calls, Prokka or Bakta annotations (nf-core/mag, bacass).
Controls
- Primary: Lanes shown, Lane order, Align lanes
- Cosmetic: Highlight region, feature labels, arrow height
YAML
- tag: viz-gene-arrow-track
  component_type: advanced_viz
  workflow_tag: my_workflow
  data_collection_tag: bgc_genes
  viz_kind: gene_arrow_track
  config:
    viz_kind: gene_arrow_track
    contig_col: contig
    feature_id_col: feature_id
    start_col: start
    end_col: end
    strand_col: strand
    class_col: gene_class
    label_col: label
Variants & rearrangements
Manhattan
v0.13.0+ viz_kind: manhattan
A score along the genome, chromosomes end to end. mode: rainfall plots the distance between variants instead, so mutation clusters sink.
Input: one row per variant.
| Column | Config key | Need | Type | Example |
|---|---|---|---|---|
chr |
chr_col |
required | String | chr1, chr19 |
pos |
pos_col |
required | Integer | 109274968 |
score |
score_col |
required, usually -log10(p) | Float | 12.4 |
feature |
feature_col |
optional | String | rs12740374 |
beta |
effect_col |
optional | Float | 0.21 |
Compatible inputs: PLINK .assoc, GWAS or QTL summary statistics, somatic VCFs (nf-core/sarek).
Controls
- Primary: Figure (Score, Rainfall), Colour by, Chromosomes, Threshold, Highlight
- Cosmetic: Top-N labels, marker size
YAML
Lollipop
v0.13.0+ viz_kind: lollipop
Variants as stems along a gene or protein, coloured by consequence. With selection_enabled a click also picks the residue for the protein tiles.
Input: one row per variant.
| Column | Config key | Need | Type | Example |
|---|---|---|---|---|
Hugo_Symbol |
feature_id_col |
required | String | TP53, KRAS |
Protein_position |
position_col |
required | Integer | 175 |
Variant_Classification |
category_col |
required | String | Missense_Mutation |
VAF |
effect_col |
optional | Float | 0.42 |
HGVSp_Short |
label_col |
optional, names the stem | String | p.R175H |
Compatible inputs: Mutation Annotation Format tables (maftools, vcf2maf) or VEP / snpEff annotated VCFs (nf-core/sarek).
Controls
- Primary: Gene, Sort genes
- Cosmetic: Point size, stem width, scale points by |effect|, show stems, marker outline, palette, label top-N
YAML
Oncoplot
v0.13.0+ viz_kind: oncoplot
A sample by gene mutation matrix, cells coloured by mutation type, with frequency strips.
Input: one row per mutation (sample and gene).
| Column | Config key | Need | Type | Example |
|---|---|---|---|---|
Tumor_Sample_Barcode |
sample_id_col |
required | String | TCGA-A1-A0SB-01 |
Hugo_Symbol |
gene_col |
required | String | TP53, PIK3CA |
Variant_Classification |
mutation_type_col |
required | String | Missense_Mutation |
Compatible inputs: Mutation Annotation Format tables: Tumor_Sample_Barcode, Hugo_Symbol, Variant_Classification (nf-core/sarek).
Controls
- Primary: Sort by mutation frequency
- Cosmetic: None
YAML
Genome chord
v1.13.0+ viz_kind: genome_chord
Chromosomes on a ring, one chord per link between two loci: fusions, breakends, translocations.
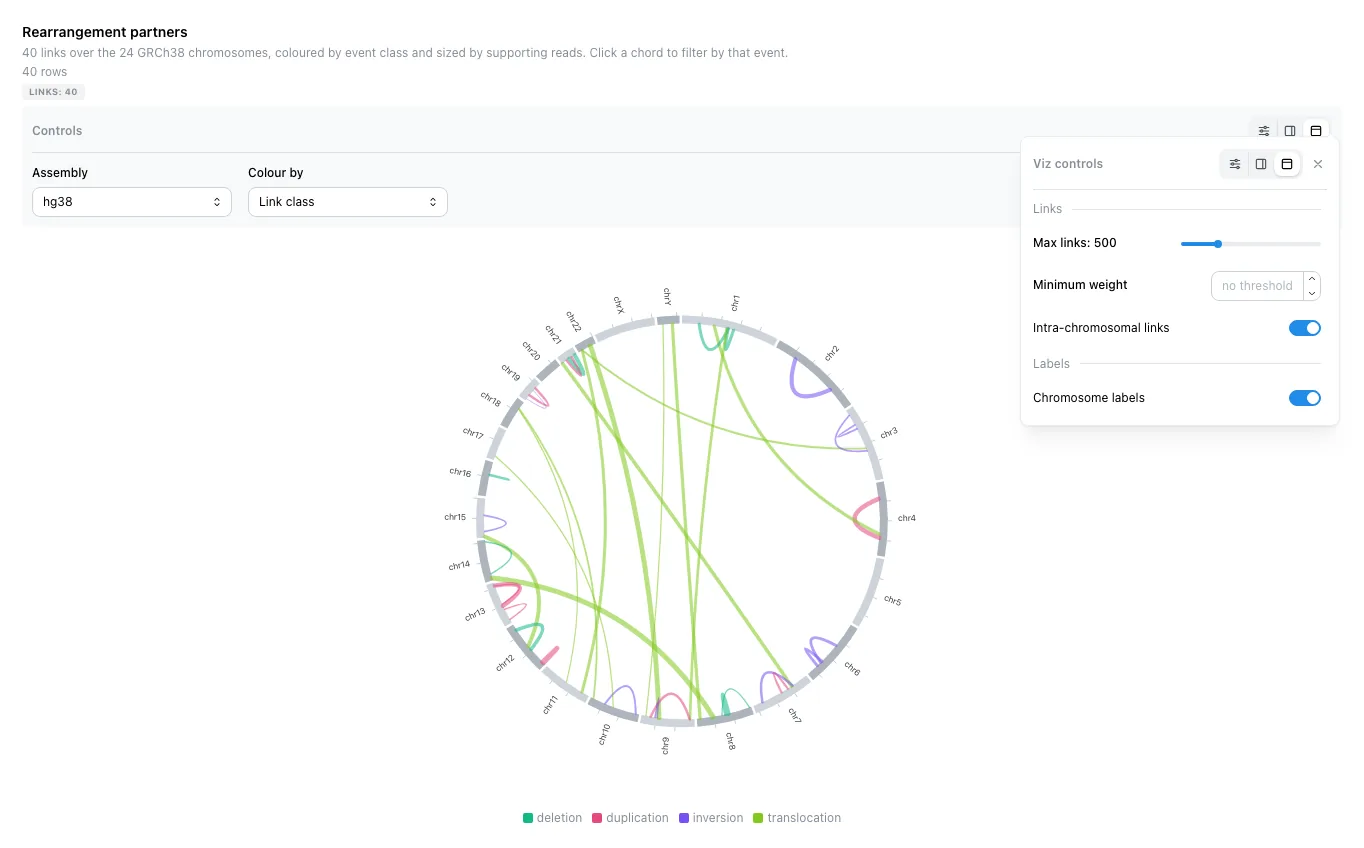
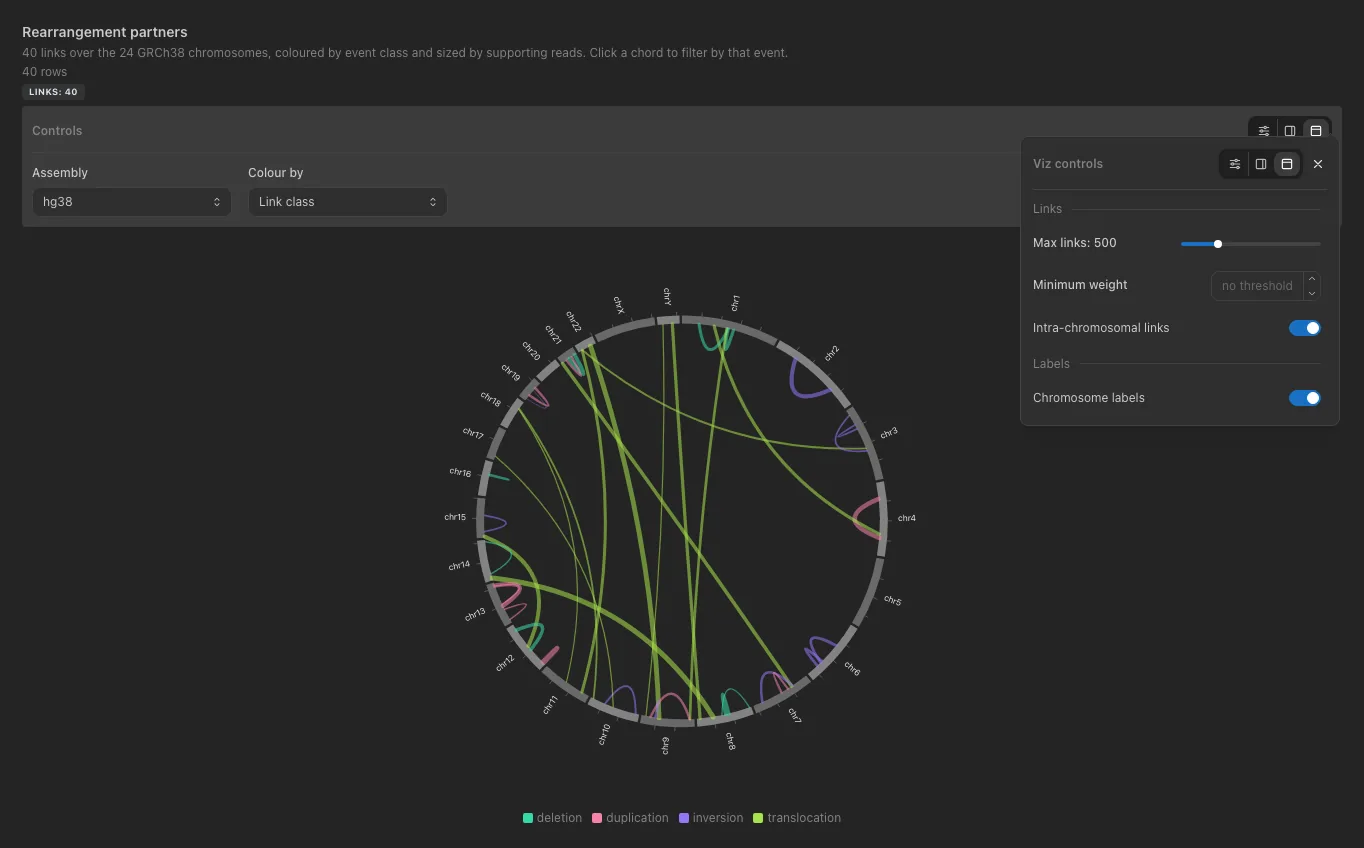
Input: one row per link between two loci.
| Column | Config key | Need | Type | Example |
|---|---|---|---|---|
chrom_a |
chrom_a_col |
required | String | chr9 |
pos_a |
pos_a_col |
required | Numeric | 130714000 |
chrom_b |
chrom_b_col |
required | String | chr22 |
pos_b |
pos_b_col |
required | Numeric | 23290000 |
support |
weight_col |
optional, link weight | Numeric | 54 |
sv_type |
category_col |
optional, colour by | String | BND, INV |
label |
label_col |
optional | String | BCR::ABL1 |
sample |
sample_col |
optional | String | TUMOUR_A |
Compatible inputs: Manta, TIDDIT or SvABA breakends (nf-core/sarek), arriba or STAR-Fusion fusions (nf-core/rnafusion).
Controls
- Primary: Assembly, Colour by
- Cosmetic: Links drawn, minimum weight, intra-chromosomal links, chromosome labels
YAML
Fusion structure
v1.11.0+ viz_kind: fusion_structure
A fusion drawn as its two partners, with the protein domains kept or lost at the breakpoint.
Input: one row per domain of each partner.
| Column | Config key | Need | Type | Example |
|---|---|---|---|---|
fusion_id |
fusion_id_col |
required | String | BCR::ABL1 |
partner |
partner_col |
required | String | BCR, ABL1 |
feature |
feature_col |
required | String | SH3 |
start |
start_col |
required | Numeric | 61 |
end |
end_col |
required | Numeric | 121 |
breakpoint |
breakpoint_col |
optional | Numeric | 426 |
retained |
retained_col |
optional, fraction kept, 0 to 1 | Numeric | 1.0, 0.4 |
source |
colour_by_col |
optional, domain colour | String | Pfam |
Compatible inputs: Arriba or STAR-Fusion calls (nf-core/rnafusion).
Controls
- Primary: Fusions (how many)
- Cosmetic: Bar height, mark the breakpoint, name each domain, position axis
YAML
- tag: viz-fusion-structure
  component_type: advanced_viz
  workflow_tag: my_workflow
  data_collection_tag: fusion_domains
  viz_kind: fusion_structure
  config:
    viz_kind: fusion_structure
    fusion_id_col: fusion_id
    partner_col: partner
    feature_col: feature
    start_col: start
    end_col: end
    breakpoint_col: breakpoint
    retained_col: retained
Signal & read profiles
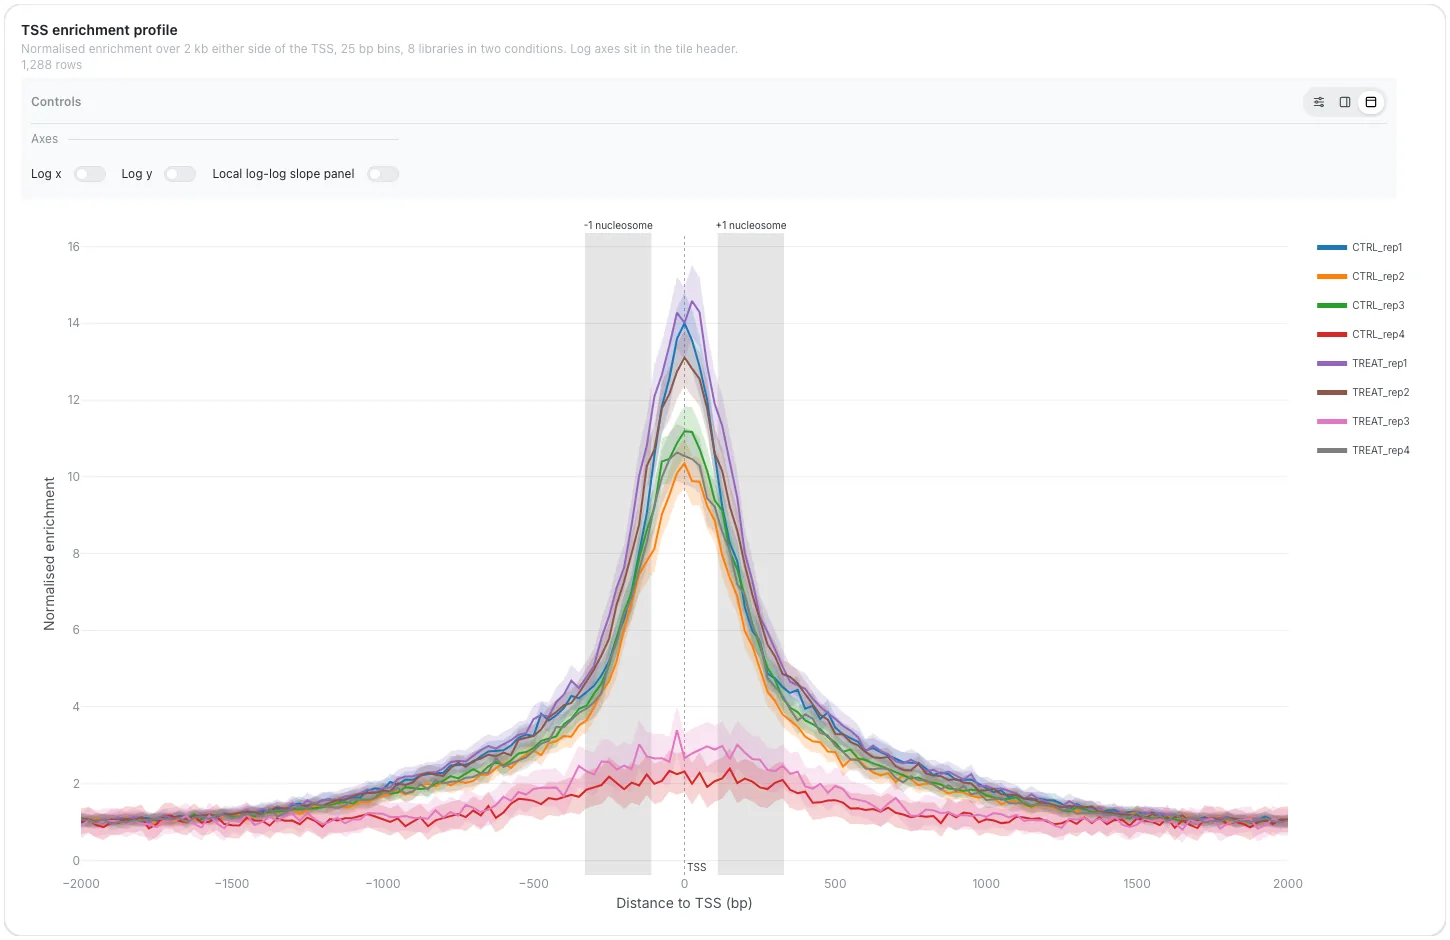
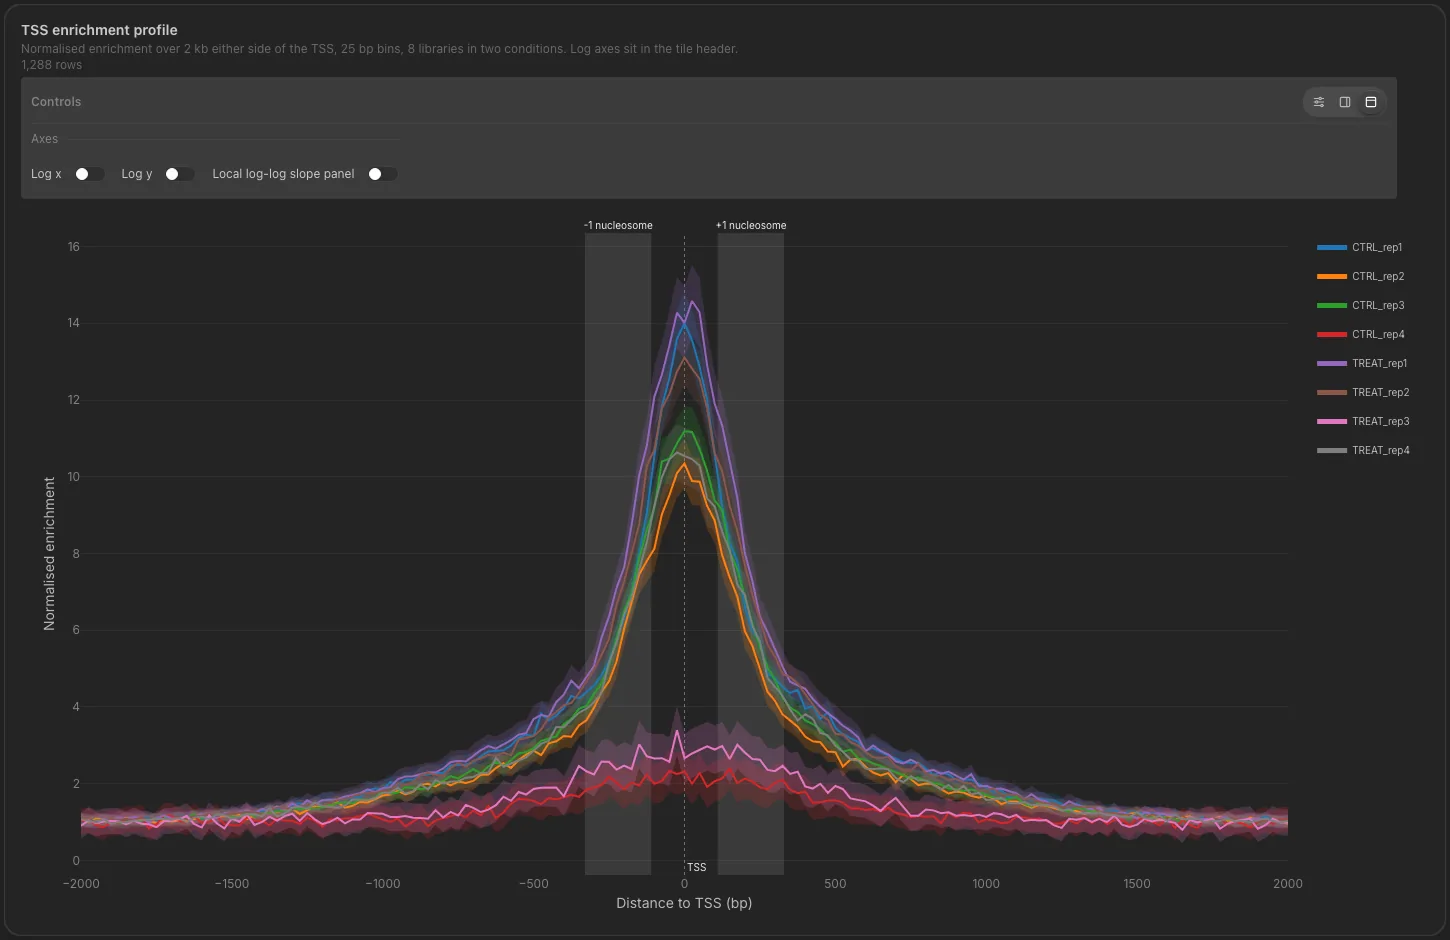
Profile
v1.11.0+ viz_kind: profile
One curve per series over an ordered numeric axis, with an optional band. A TSS profile, a fragment-length ladder or a per-residue pLDDT curve.
Input: one row per series and x value (long format).
| Column | Config key | Need | Type | Example |
|---|---|---|---|---|
sample |
series_col |
required | String | H3K4me3_rep1 |
distance |
x_col |
required | Numeric | -1000, 0 |
signal |
y_col |
required | Numeric | 6.41 |
lower |
lower_col |
optional, the band | Float | 5.90 |
upper |
upper_col |
optional, the band | Float | 6.92 |
Compatible inputs: deepTools profiles (nf-core/atacseq, chipseq), riboWaltz, crisprseq.
Controls
- Primary: Log x, Log y, Local log-log slope panel
- Cosmetic: Line width, band opacity, legend
YAML
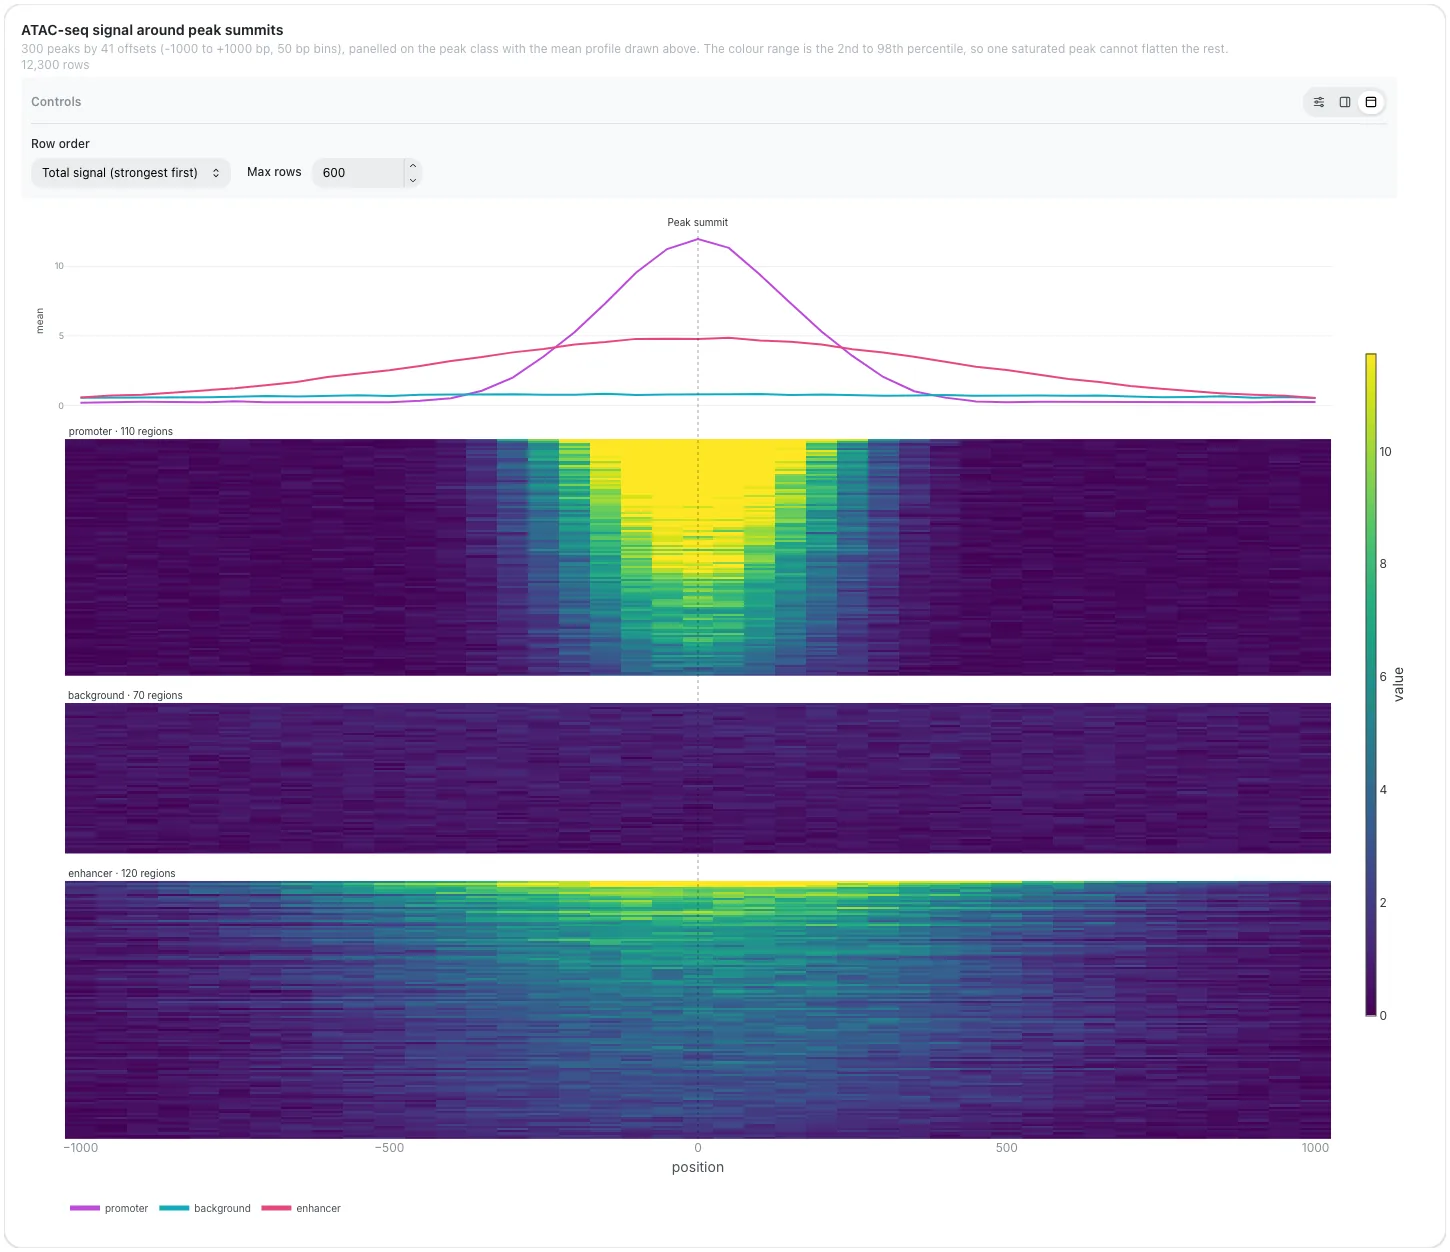
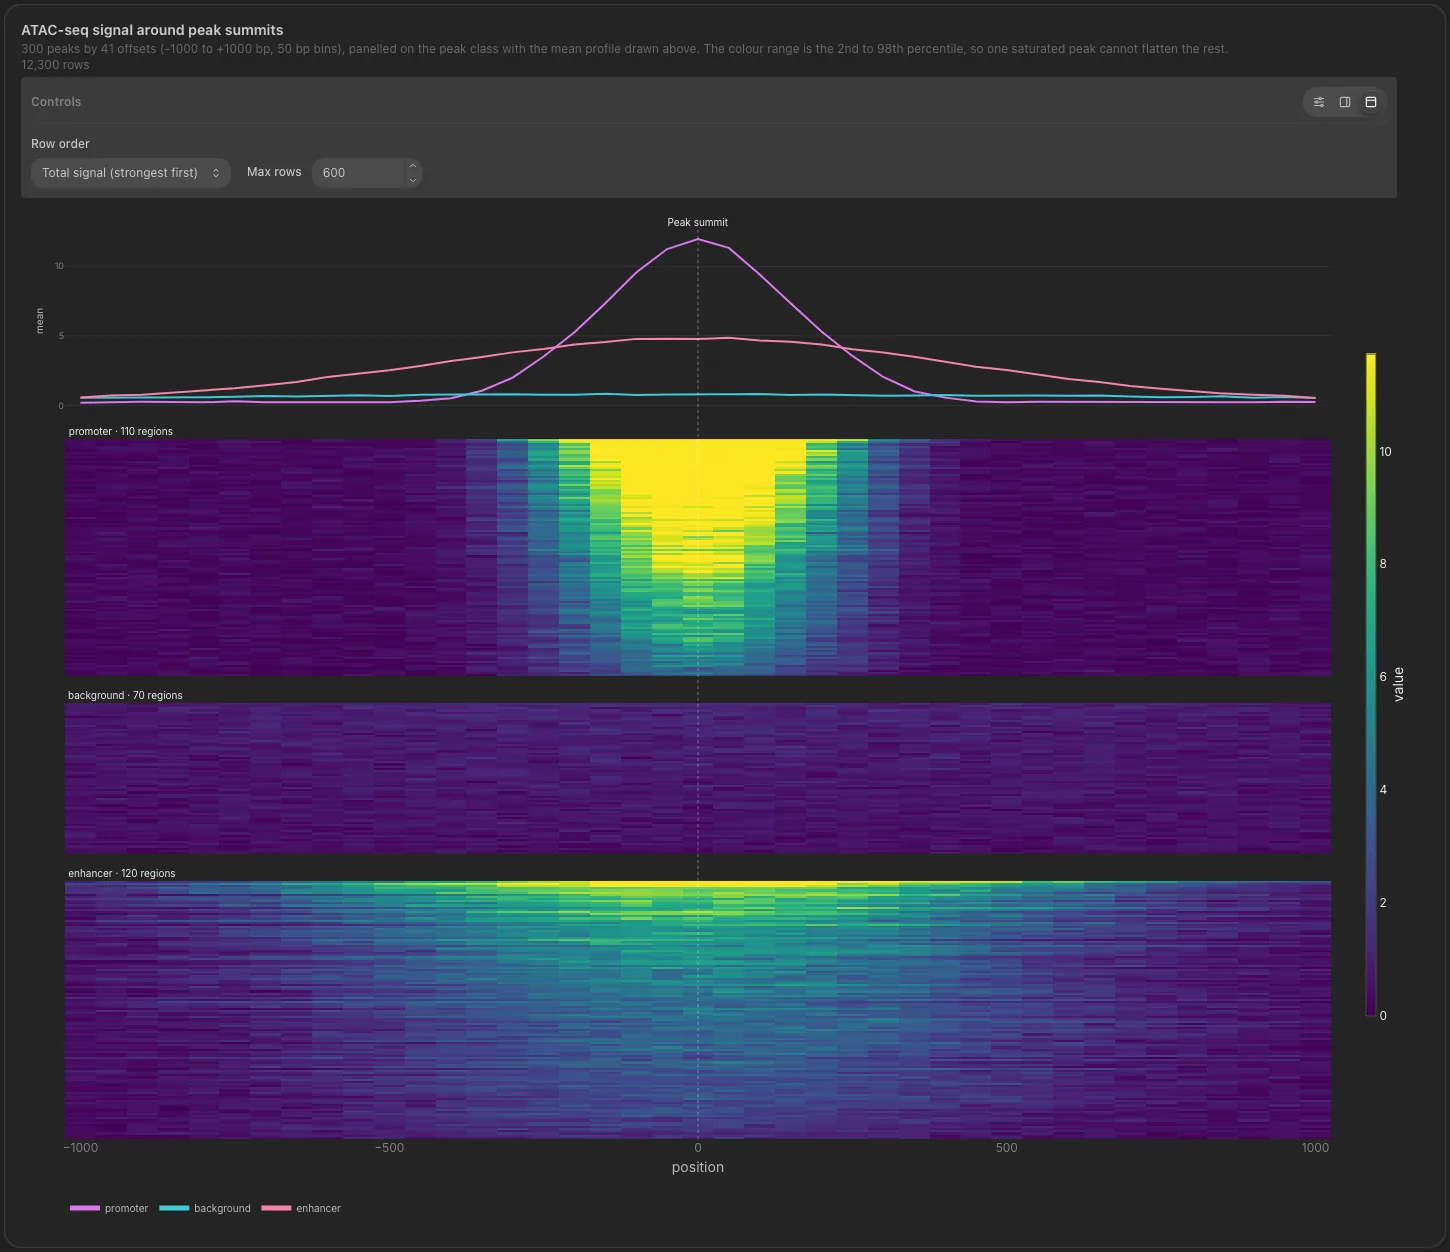
Signal matrix
v1.11.0+ viz_kind: signal_matrix
The heatmap under a profile: one row per region, one column per offset, rows ordered by signal.
Input: one row per region and offset (long format).
| Column | Config key | Need | Type | Example |
|---|---|---|---|---|
region_id |
region_id_col |
required | String | peak_00412 |
position |
position_col |
required | Numeric | -500, 0 |
value |
value_col |
required | Numeric | 8.7 |
group |
group_col |
optional | String | H3K27ac |
Compatible inputs: deepTools computeMatrix output in long form (nf-core/atacseq, chipseq, cutandrun).
Controls
- Primary: Row order, Max rows
- Cosmetic: Colour scale, mean profile above the matrix
YAML
Damage profile
v1.13.0+ viz_kind: damage_profile
Ancient-DNA misincorporation by distance from the read end. C>T at 5' and G>A at 3' are highlighted.
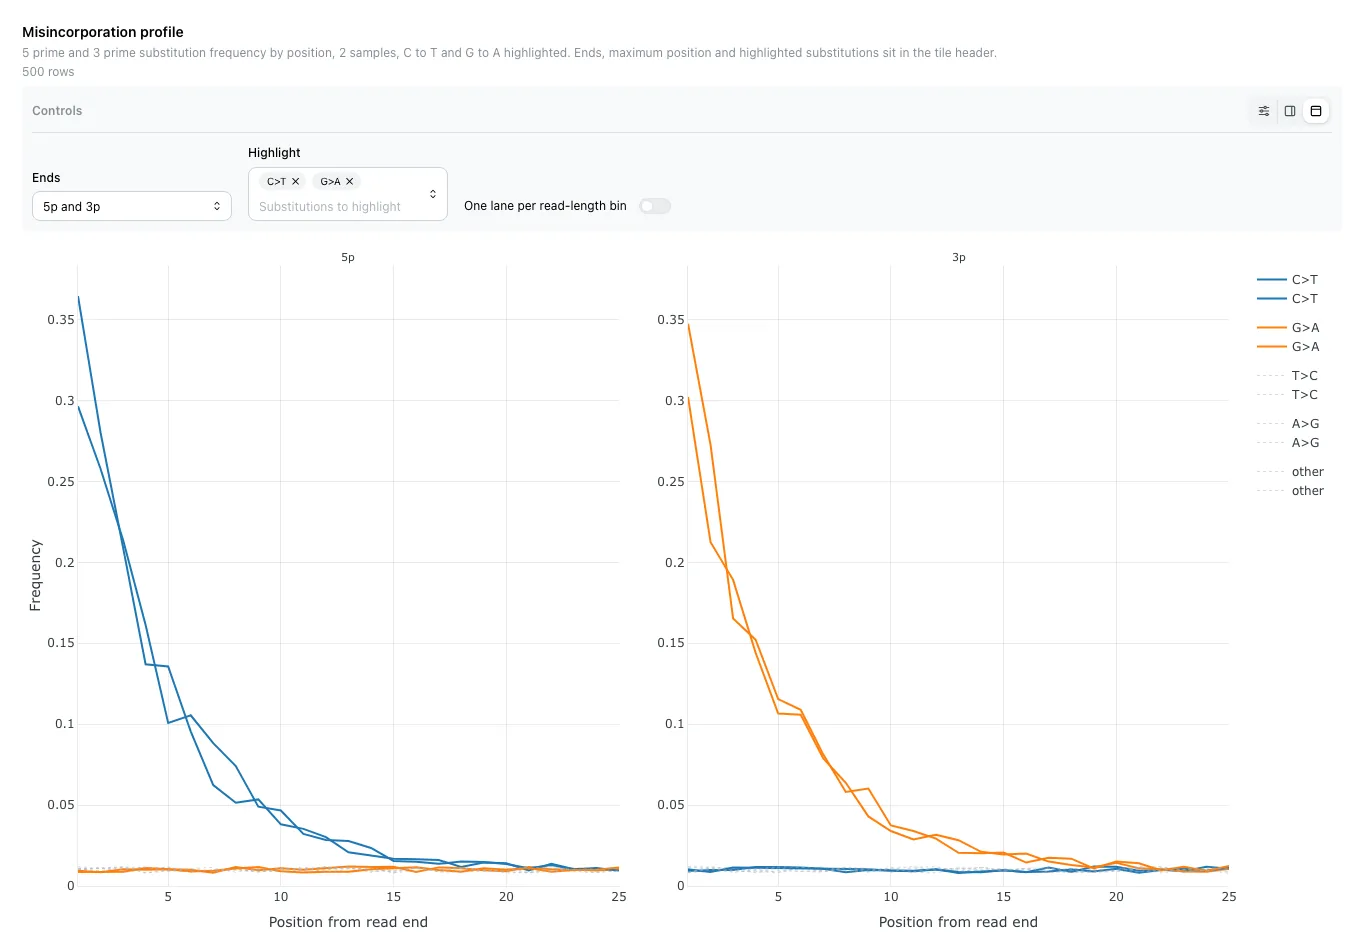
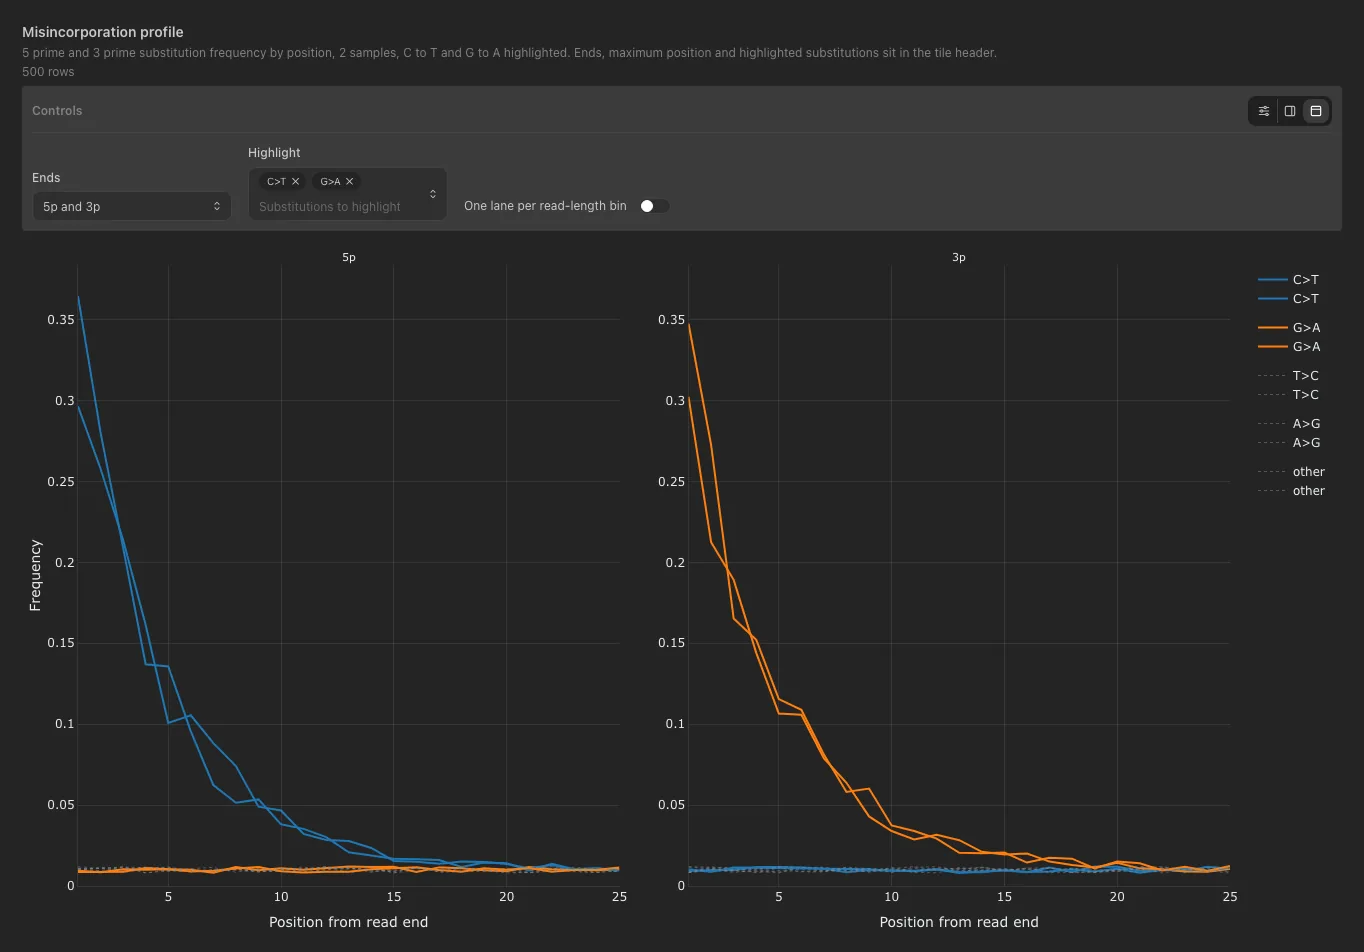
Input: one row per sample, read end, position and substitution.
| Column | Config key | Need | Type | Example |
|---|---|---|---|---|
sample |
sample_col |
required | String | Lib_01 |
end |
end_col |
required | String | 5p, 3p |
position |
position_col |
required | Numeric | 1 |
base_change |
base_change_col |
required | String | C>T, G>A |
frequency |
frequency_col |
required | Numeric | 0.231 |
length_bin |
length_bin_col |
optional, one lane per bin with facet_by: length_bin |
String | 30-49 |
Compatible inputs: DamageProfiler or mapDamage substitution tables (nf-core/eager).
Controls
- Primary: Ends, Highlight, One lane per read-length bin
- Cosmetic: Max position
YAML
Microbiome & ecology
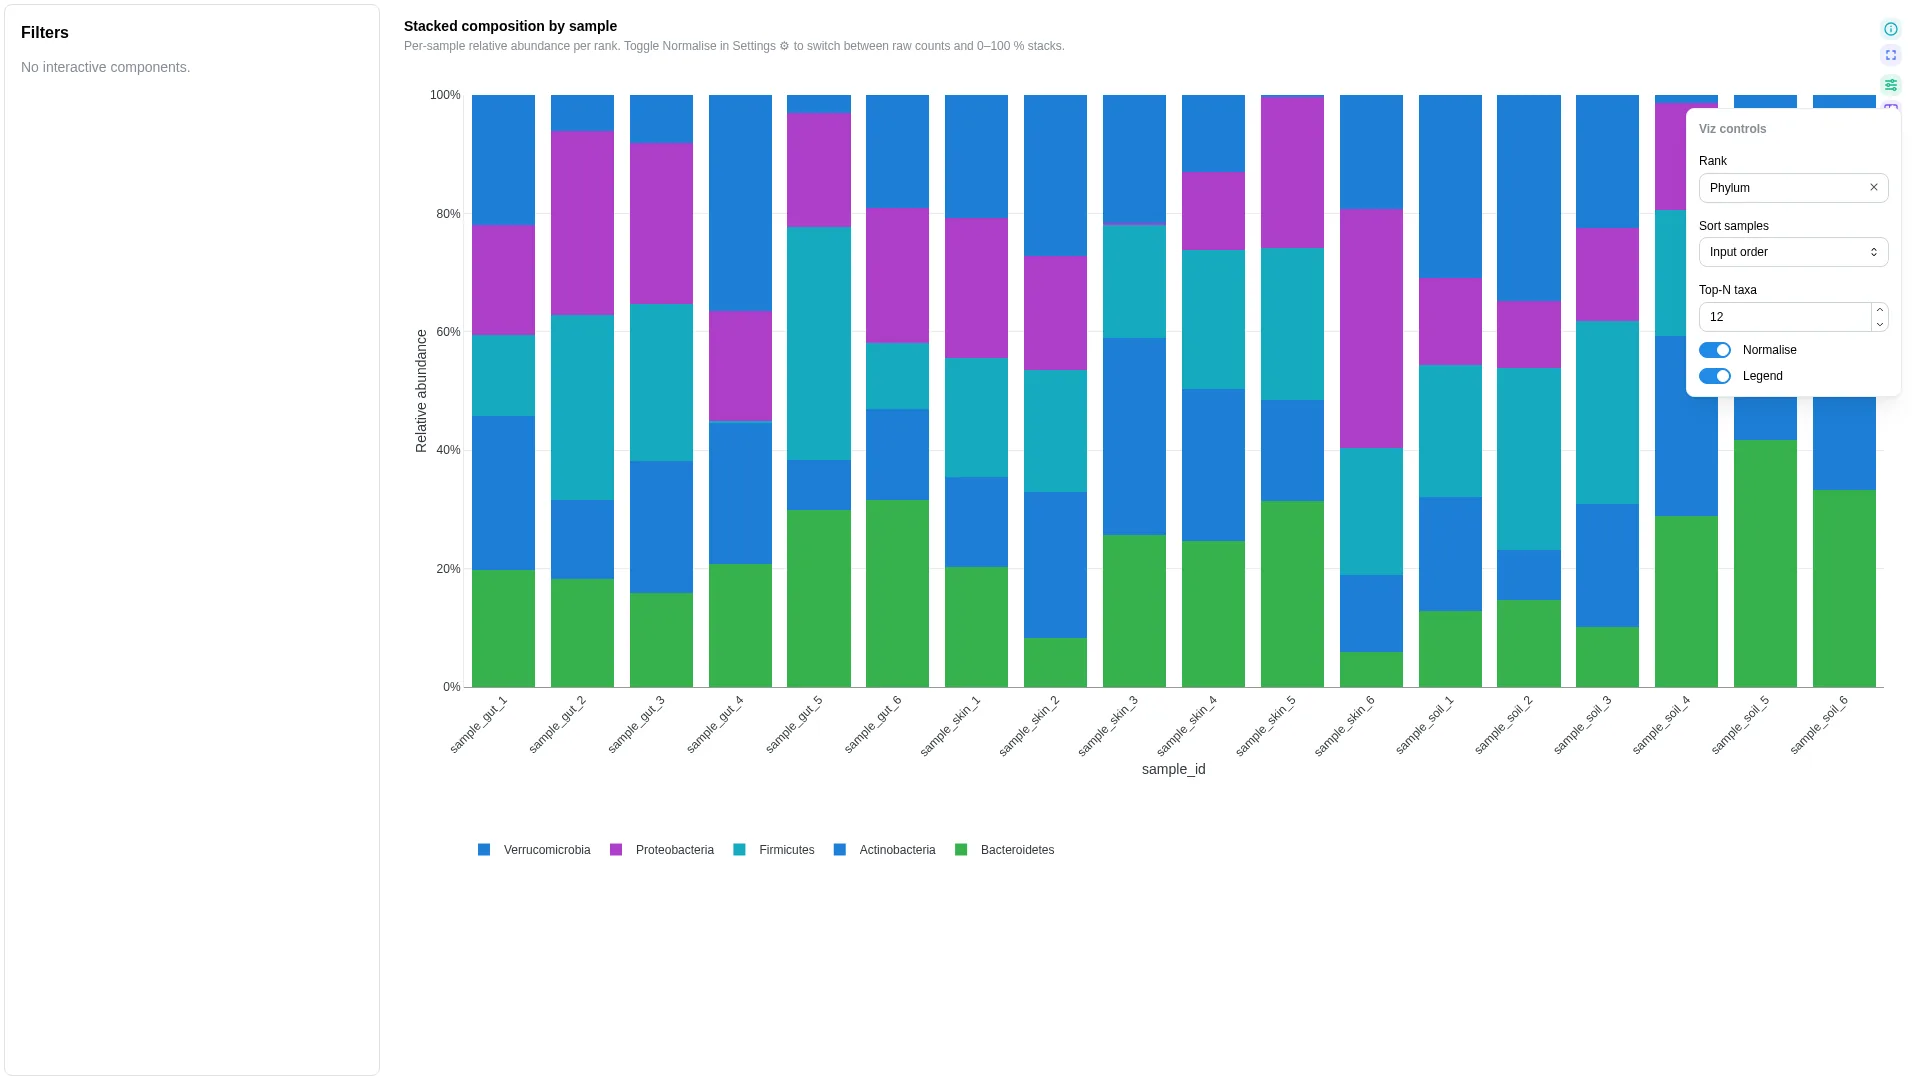
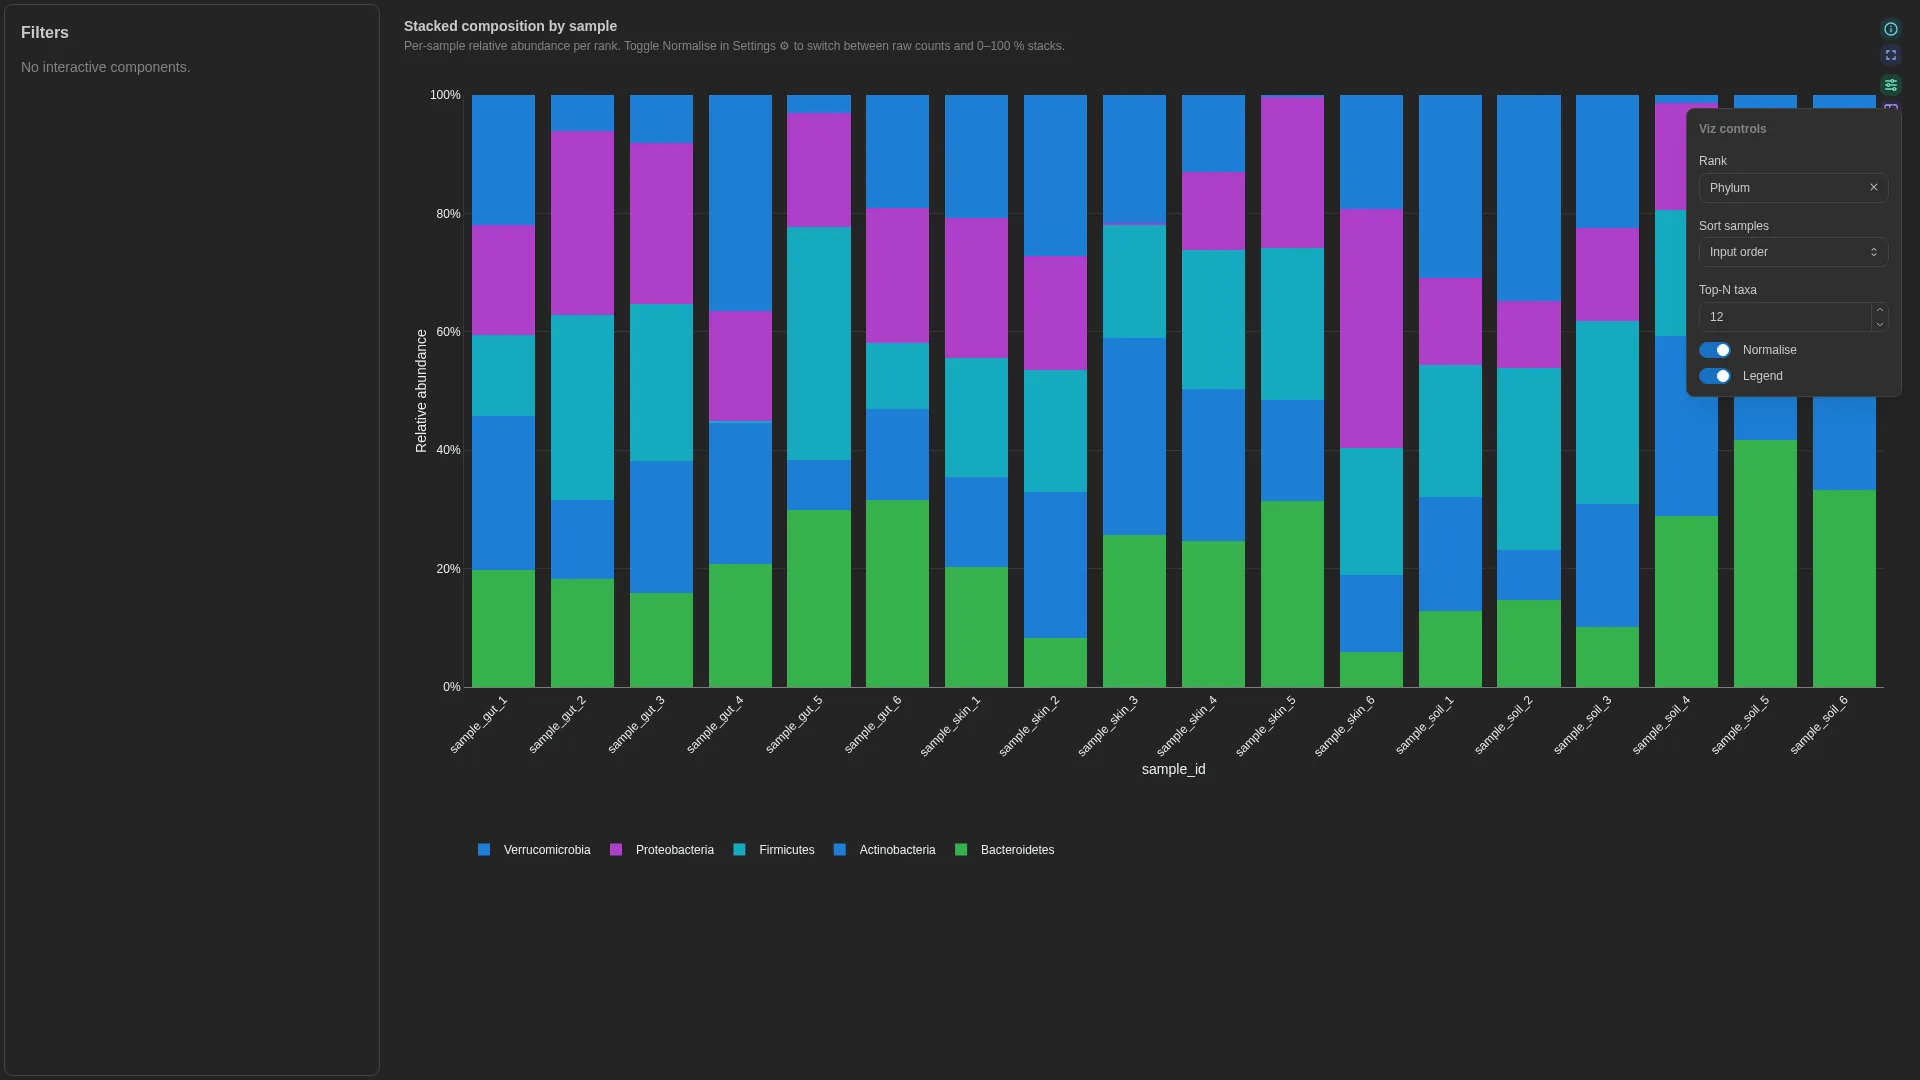
Stacked taxonomy
v0.13.0+ viz_kind: stacked_taxonomy
Per-sample composition at one taxonomic rank, the tail folded into Other, with optional metadata strips.
Input: one row per sample, taxon and rank (long format).
| Column | Config key | Need | Type | Example |
|---|---|---|---|---|
sample_id |
sample_id_col |
required | String | S01 |
taxon |
taxon_col |
required | String | Bacteroidota |
rank |
rank_col |
required | String | Phylum, Genus |
abundance |
abundance_col |
required | Numeric | 0.42 |
Compatible inputs: QIIME2 taxa-collapse tables (nf-core/ampliseq), taxprofiler or mag abundance tables.
Controls
- Primary: Rank, Top-N taxa, Sort samples, Normalise
- Cosmetic: Legend, log y
YAML
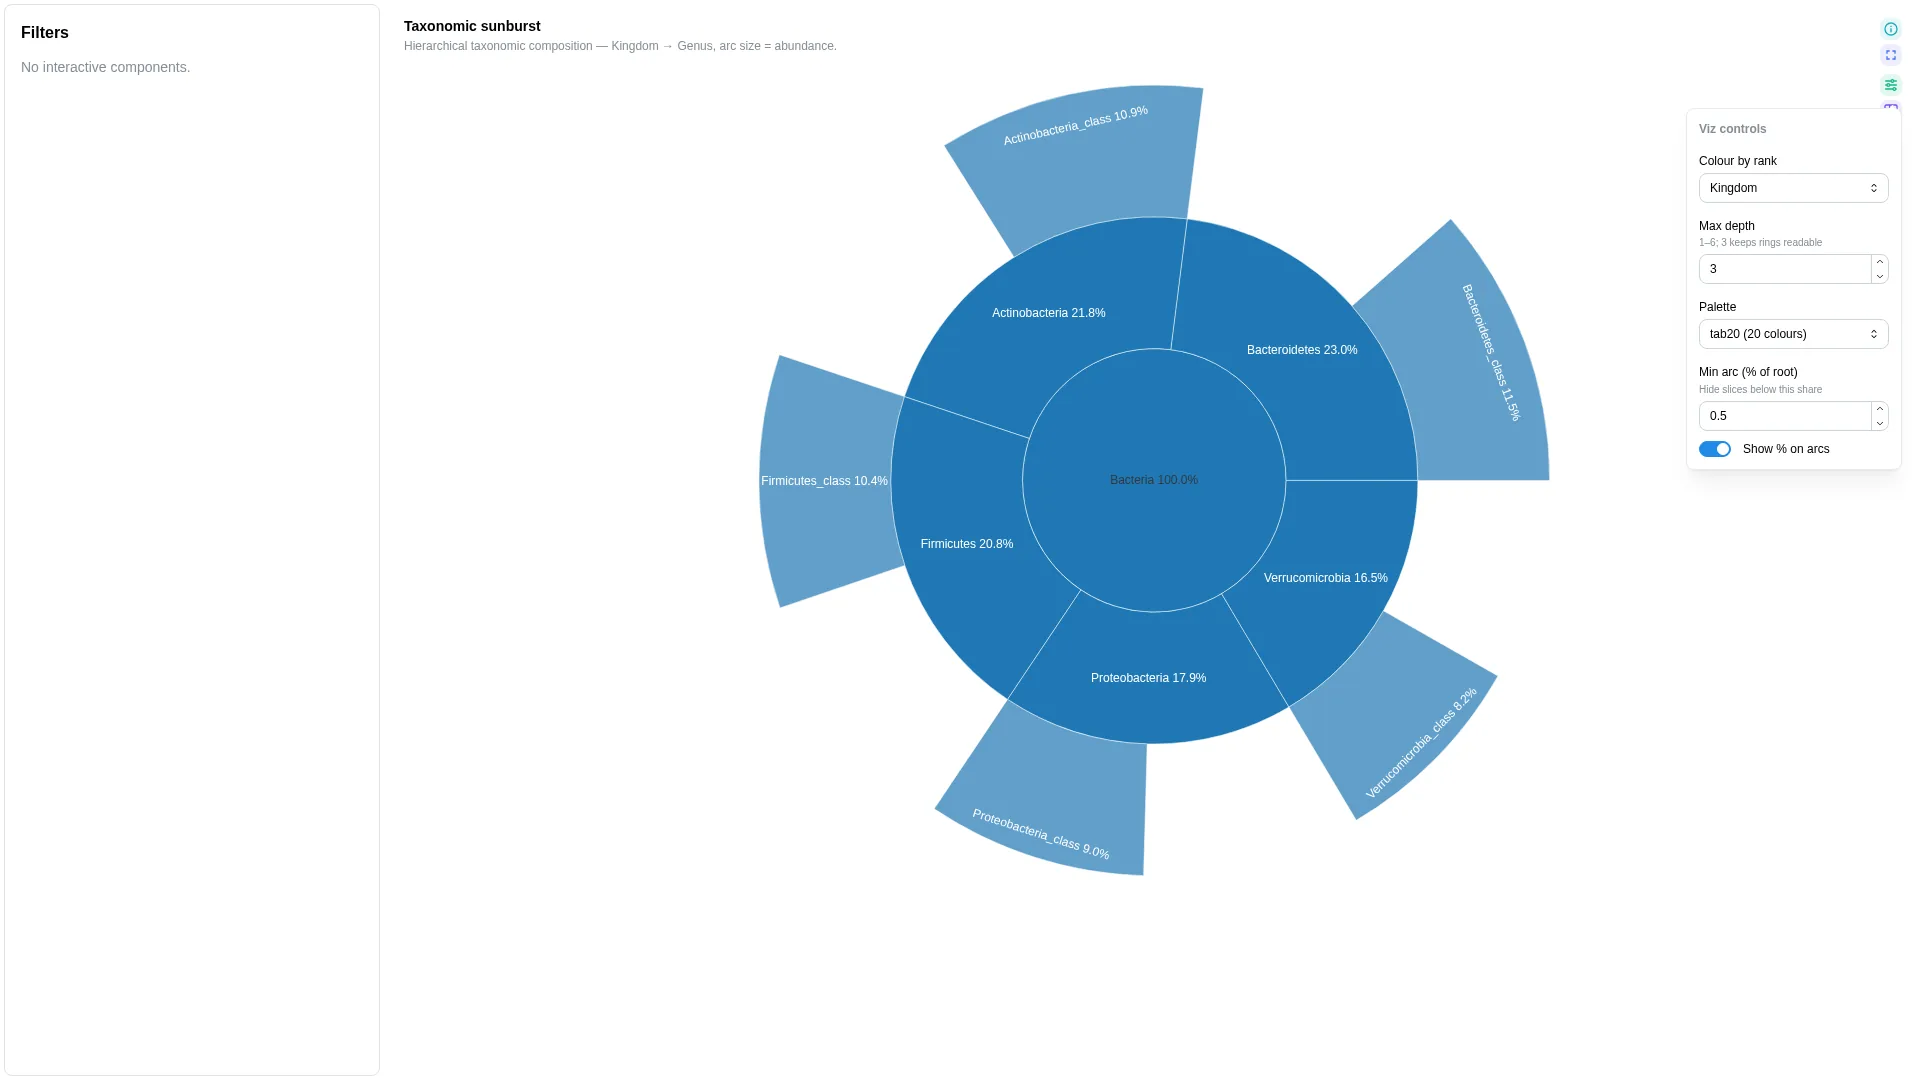
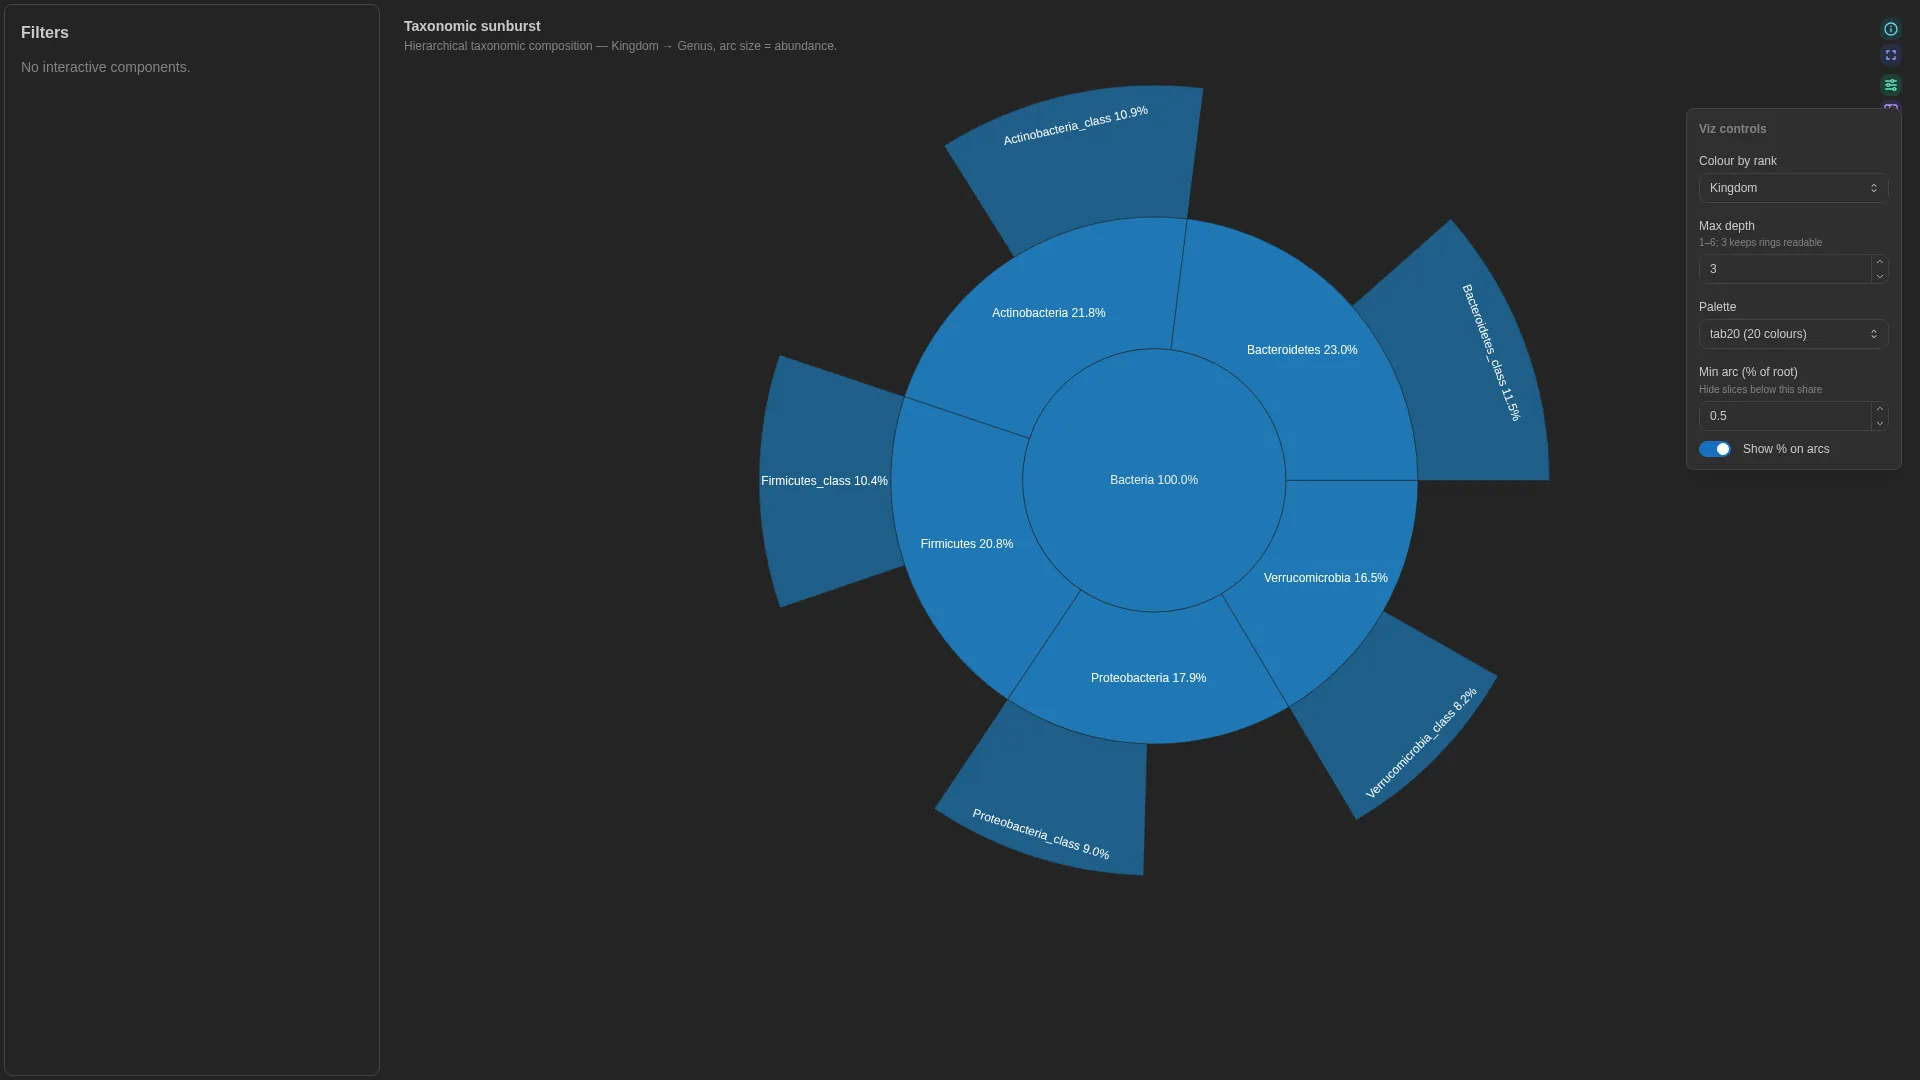
Sunburst
v0.13.0+ viz_kind: sunburst
A taxonomy or pathway hierarchy as rings from root to leaf, each ring a shade of its lineage.
Input: one row per leaf, one column per rank (wide format), root first.
| Column | Config key | Need | Type | Example |
|---|---|---|---|---|
Kingdom, Phylum, Class, Order, Family, Genus |
rank_cols |
required, root first | String | Bacteria, Bacteroides |
abundance |
abundance_col |
required | Numeric | 1520 |
Compatible inputs: Kraken2 .kreport pivoted to rank columns, nf-core/ampliseq or taxprofiler classifications.
Controls
- Primary: Start from rank, Max depth, Colour by rank
- Cosmetic: Palette, min arc (% of root), show % on arcs
YAML
Rarefaction
v0.13.0+ viz_kind: rarefaction
Alpha diversity against sequencing depth, one curve per sample, mean and SE over iterations.
Input: one row per sample, depth and iteration, one column per metric.
| Column | Config key | Need | Type | Example |
|---|---|---|---|---|
sample_id |
sample_id_col |
required | String | S01 |
depth |
depth_col |
required | Numeric | 1000 |
shannon |
metric_col |
required, the metric shown first | Numeric | 3.82 |
observed_features, faith_pd |
metric_options |
optional, the metric tabs | Numeric | 212 |
iter |
iter_col |
optional | Numeric | 1, 2 |
habitat |
group_col |
optional, group by | String | soil, marine |
Compatible inputs: QIIME2 alpha-rarefaction tables (nf-core/ampliseq).
Controls
- Primary: Metric tabs, Group by, Top-N samples
- Cosmetic: Error bars (±SE)
YAML
- tag: viz-rarefaction
  component_type: advanced_viz
  workflow_tag: my_workflow
  data_collection_tag: rarefaction_long
  viz_kind: rarefaction
  config:
    viz_kind: rarefaction
    sample_id_col: sample_id
    depth_col: depth
    metric_col: shannon
    metric_options: [shannon, observed_features, faith_pd]
    iter_col: iter
    group_col: habitat
Phylogenetic tree
v0.13.0+ viz_kind: phylogenetic
A Newick tree with tip metadata, five layouts, clade selection, filter and collapse. collapse_rank turns it into a summary by rank.
Summary by rank (View: Summary by rank, Collapse to: Genus, Top N: 12):
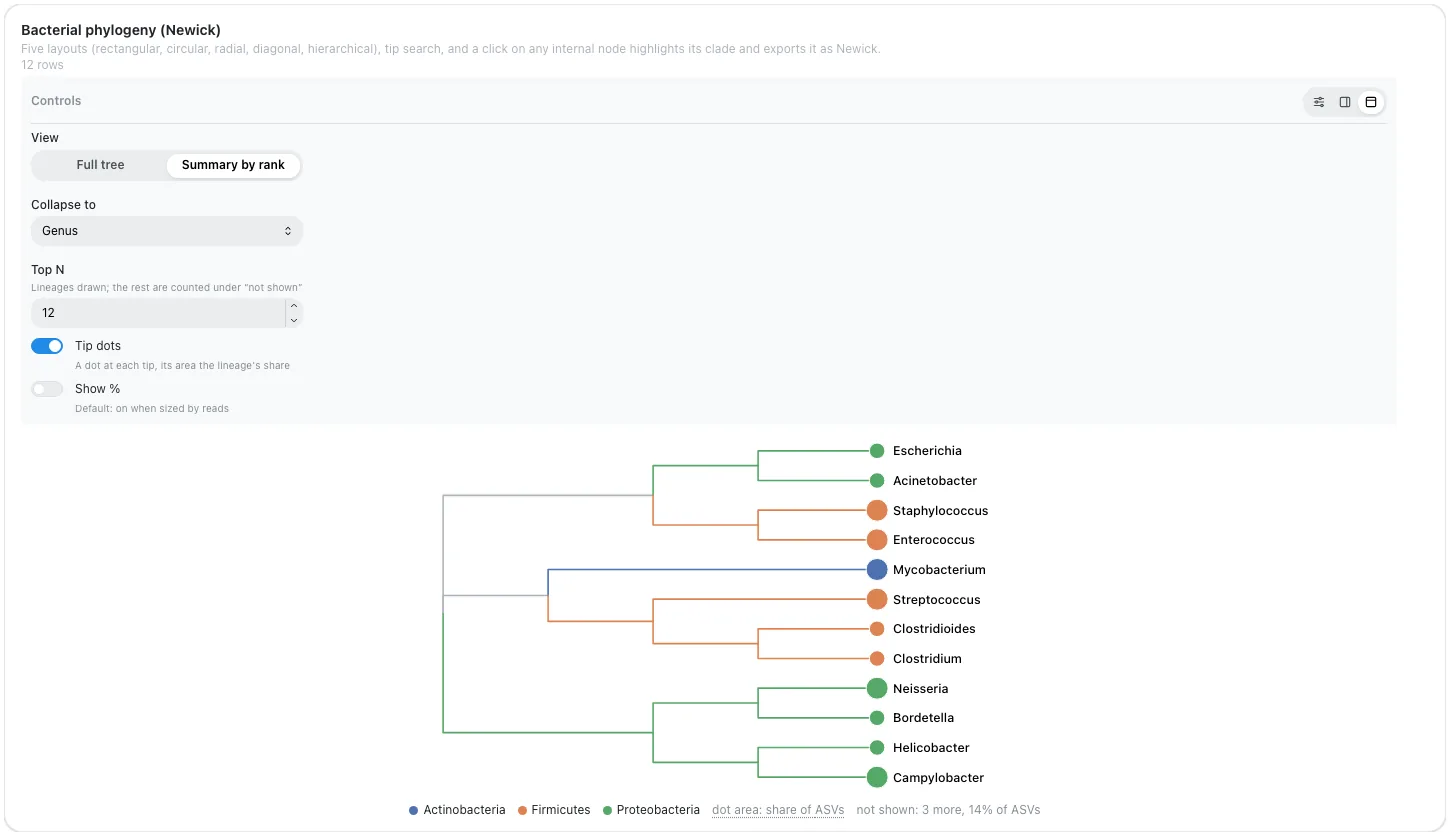
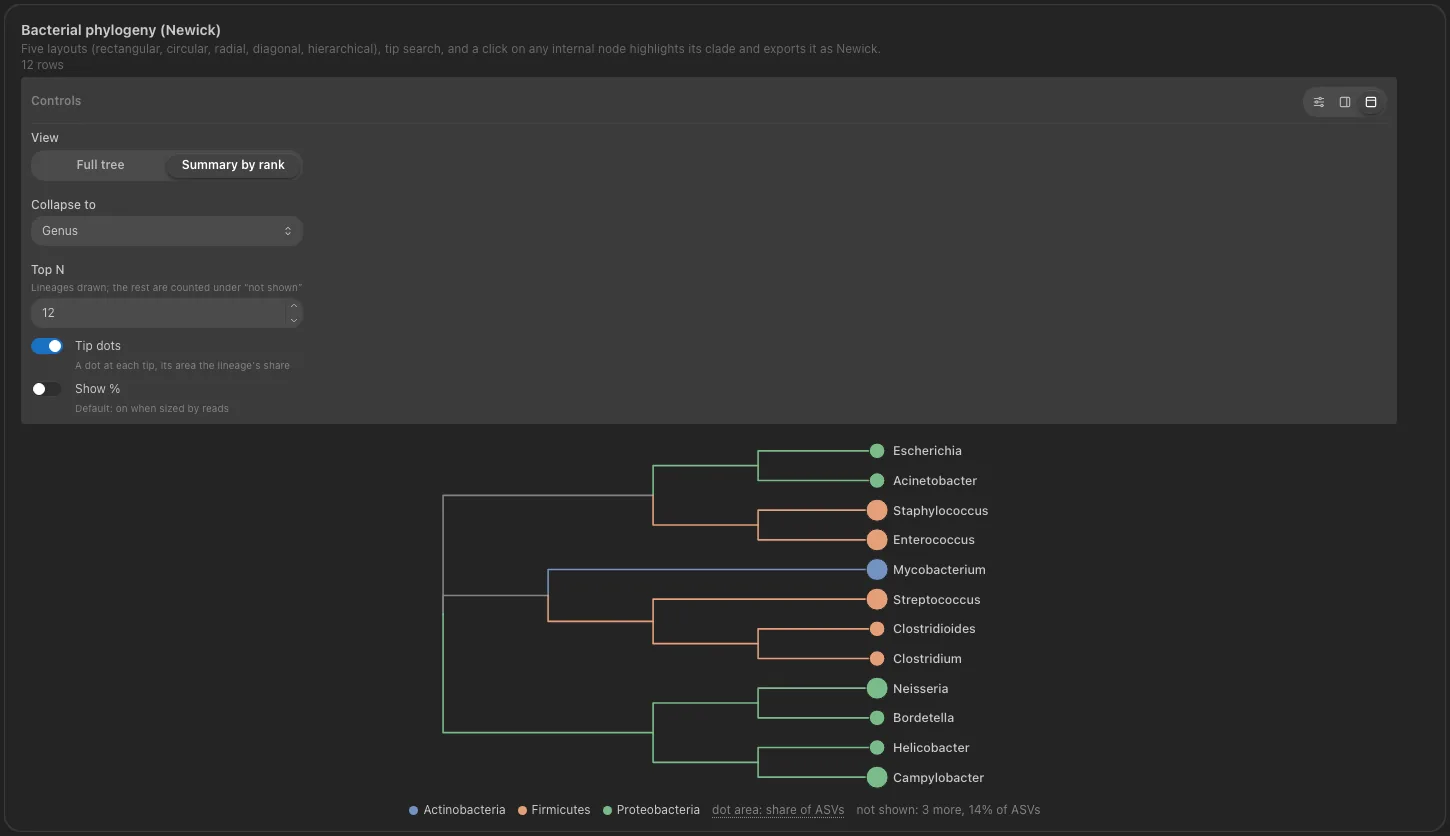
Input: two data collections, joined on the tree's tip labels, plus an optional third.
| Collection | DC type | Config key | Content |
|---|---|---|---|
| Tree | phylogeny, a special DC: the Newick or Nexus file is read as is, never turned into a table |
tree_dc_tag |
one tree, tips labelled ASV_0001, ASV_0002... |
| Tip metadata | table |
metadata_dc_tag (the tile's data_collection_tag) |
one row per tip, columns below |
| Abundance, optional | table |
abundance_dc_tag |
one row per tip and sample, sizes the summary by reads |
The project declares the phylogeny DC with a link to its metadata table, see Phylogeny DCs and their metadata table.
Tip metadata columns:
| Column | Config key | Need | Type | Example |
|---|---|---|---|---|
taxon |
taxon_col |
required, matches the tree's tip labels | String | ASV_0001 |
Phylum |
color_col |
optional, tip colour | Numeric or String | Bacteroidota |
Genus |
label_col |
optional, shown beside the tip label | String | Bacteroides |
Class, Order |
extra_color_cols |
optional, more Colour by choices | String | Bacteroidia |
Abundance table columns are bound by abundance_col and abundance_sample_col.
Compatible inputs: IQ-TREE or FastTree Newick plus a tip metadata table (nf-core/bactmap, pathogensurveillance, ampliseq).
Controls
- Primary: View (Full tree, Summary by rank), Colour by, Search tip, Layout, Ladderise; summary: Collapse to, Top N
- Cosmetic: Label by, metadata strips, legend, support values, scale bar; toolbar: undo, redo, zoom and pan, reset, focus mode
YAML
- tag: viz-phylogenetic
  component_type: advanced_viz
  workflow_tag: my_workflow
  data_collection_tag: tree_metadata
  viz_kind: phylogenetic
  config:
    viz_kind: phylogenetic
    tree_wf_id: 646b0f3c1e4a2d7f8e5b8ca3   # placeholder ids, rewritten
    tree_dc_id: 646b0f3c1e4a2d7f8e5b8cdb   # from tree_dc_tag at import
    tree_dc_tag: phylogenetic_tree
    metadata_dc_tag: tree_metadata
    taxon_col: taxon
    color_col: Phylum
Samples & specimens
Allele grid
v1.20.0+ viz_kind: allele_grid
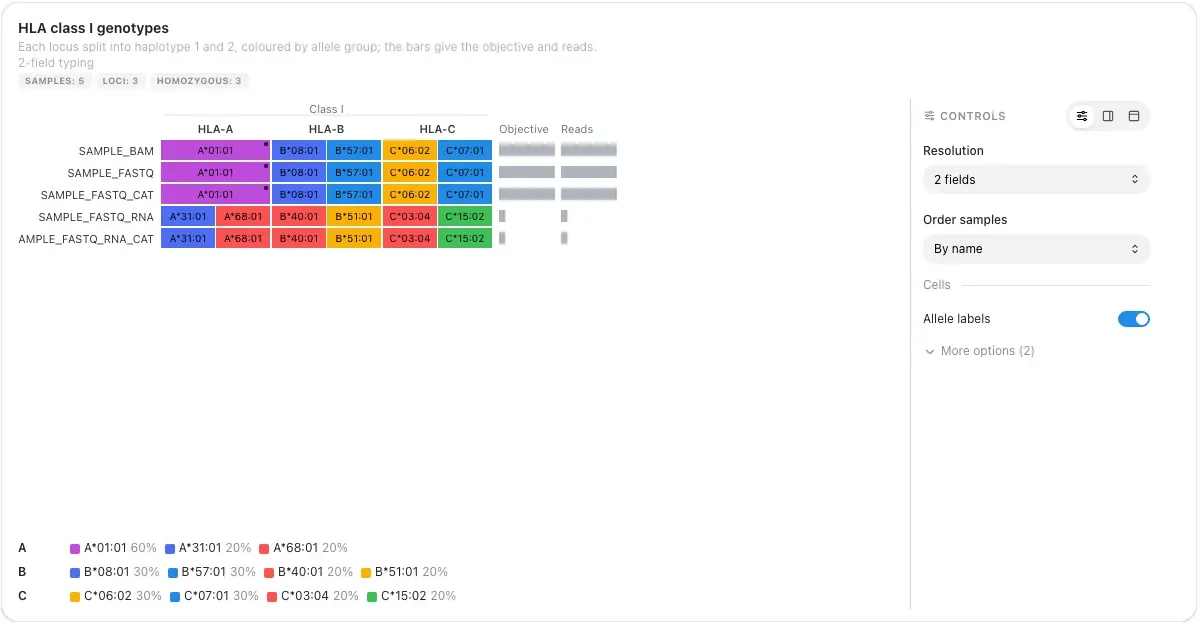
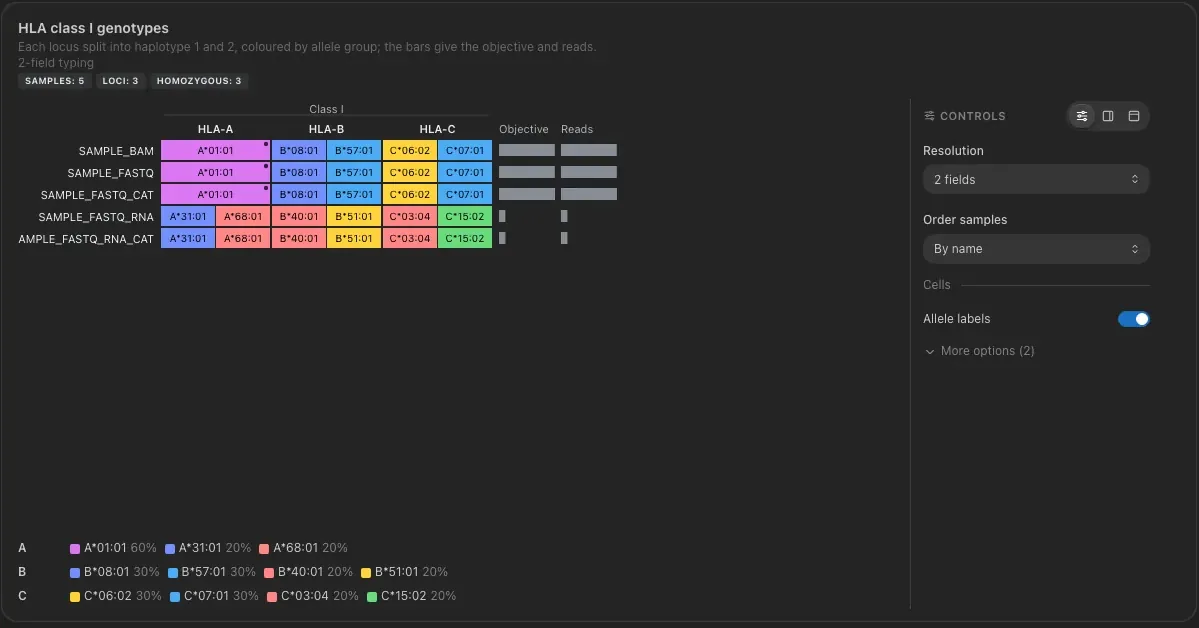
A sample by locus grid of diploid genotypes (HLA typing). Each cell is split into its two haplotypes and coloured by allele, one hue family per allele group, and a homozygous locus is one merged cell. With selection_enabled, a click on an allele filters the dashboard to the rows carrying it.
Input: one row per allele call (sample, locus, haplotype), melted long.
| Column | Config key | Need | Type | Example |
|---|---|---|---|---|
sample_id |
sample_id_col |
required | String | SAMPLE_BAM |
locus |
locus_col |
required | String | HLA-A, HLA-B |
allele |
allele_col |
required | String | HLA-A*02:01 |
haplotype |
haplotype_col |
optional, 1 or 2; else table order | Integer | 1 |
hla_class |
category_col |
optional, groups the loci under a header | String | Class I |
objective |
value_col |
optional, side bar | Numeric | 1108.68 |
reads |
reads_col |
optional, side bar or cell opacity | Numeric | 1129 |
Compatible inputs: OptiType genotypes (nf-core/hlatyping), reshaped to one row per call; LILAC and arcasHLA calls as they are written.
Controls
- Primary: Resolution, Order samples (and the Locus to order by)
- Cosmetic: Allele labels, fade cells by read support, side bars
YAML
- tag: viz-allele-grid
  component_type: advanced_viz
  workflow_tag: my_workflow
  data_collection_tag: hla_genotypes
  viz_kind: allele_grid
  config:
    viz_kind: allele_grid
    sample_id_col: sample_id
    locus_col: locus
    allele_col: allele
    haplotype_col: haplotype
    category_col: hla_class
    value_col: objective
    reads_col: reads
    resolution: 2
    selection_enabled: true
    selection_column: allele
Pedigree
v1.20.0+ viz_kind: pedigree
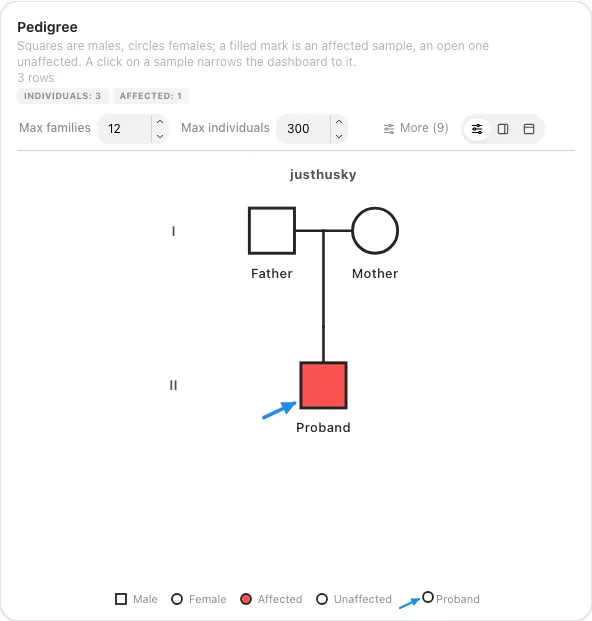
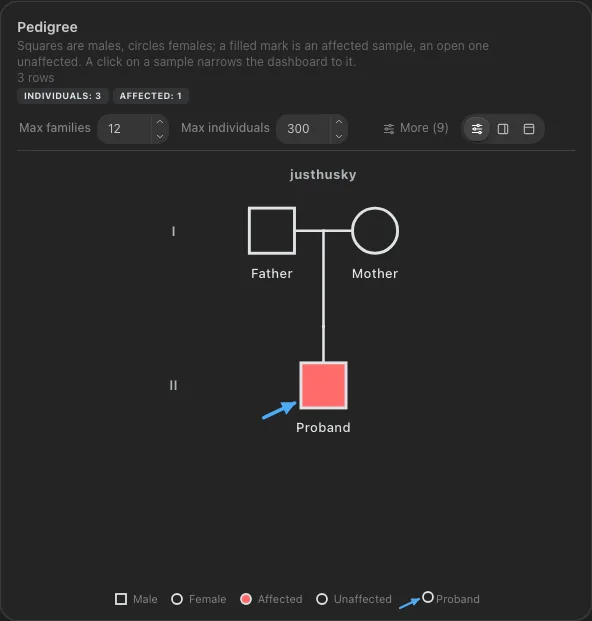
A family tree from a PED-style table: generations top to bottom, couple and sibship lines, a square, circle or diamond by sex, filled when affected. With selection_enabled, a click on an individual filters the dashboard to it.
Input: one row per individual. Parents are 0, empty or null for a founder; sex is 1 / 2 / 0 or a word, status 2 / 1 / 0 or a word.
| Column | Config key | Need | Type | Example |
|---|---|---|---|---|
individual |
individual_col |
required | String or Integer | F1_I1 |
father |
father_col |
required | String or Integer | 0, F1_I1 |
mother |
mother_col |
required | String or Integer | 0, F1_I2 |
sex |
sex_col |
required | Numeric or String | 1, female |
status |
status_col |
required, affected status | Numeric or String | 2, unaffected |
family |
family_col |
optional, one tree per value | String or Integer | FAM001 |
label |
label_col |
optional, text under each symbol | String | I-1, Proband |
deceased |
deceased_col |
optional, diagonal slash | Boolean or String | 1 |
proband |
proband_col |
optional, arrow; else the first affected child | Boolean or String | proband |
Compatible inputs: A PED or samplesheet table with family, sample, father, mother, sex and phenotype columns, such as the one nf-core/raredisease reads.
Controls
- Primary: Family, Families with an affected member only, Max families, Max individuals
- Cosmetic: Labels under symbols, label text, symbol size, generation spacing, generation numerals, family names, colour affected by, legend
YAML
- tag: viz-pedigree
  component_type: advanced_viz
  workflow_tag: my_workflow
  data_collection_tag: samples
  viz_kind: pedigree
  config:
    viz_kind: pedigree
    individual_col: individual
    father_col: father
    mother_col: mother
    sex_col: sex
    status_col: status
    family_col: family
    label_col: label
    selection_enabled: true
    selection_column: individual
Ideogram
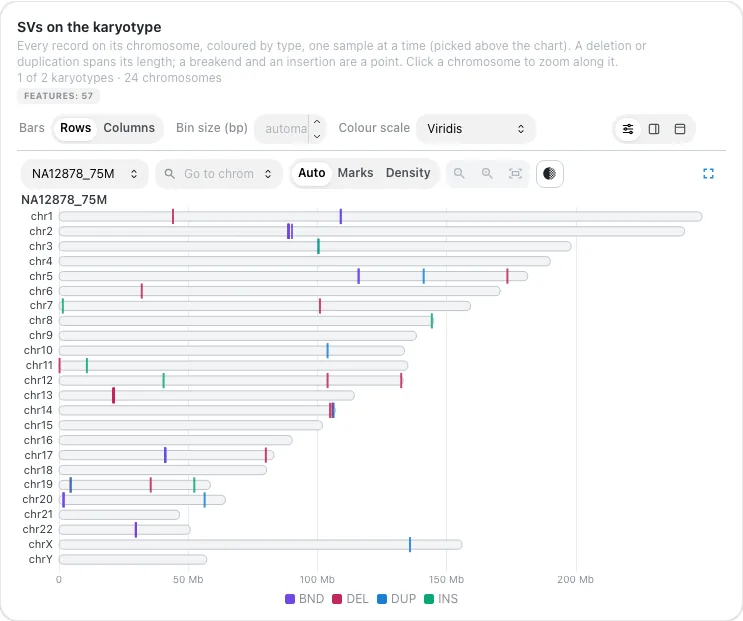
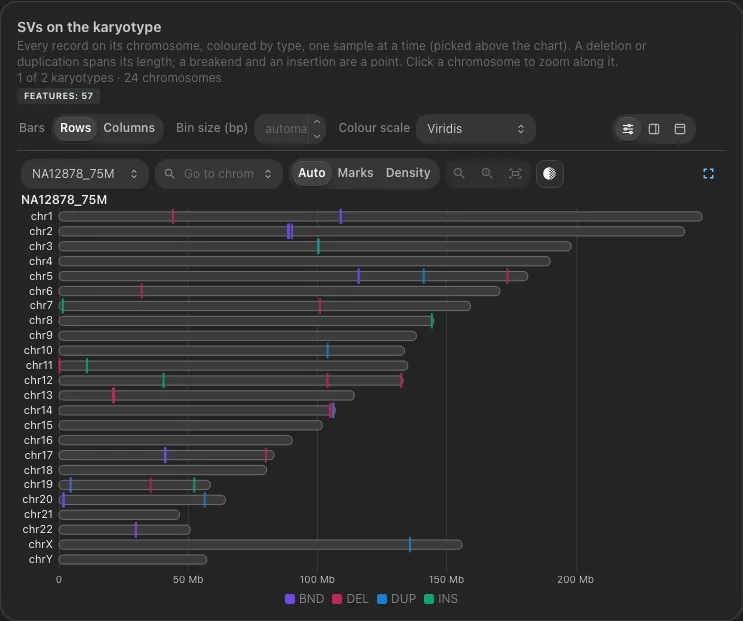
v1.20.0+ viz_kind: ideogram
A karyotype: one bar per chromosome scaled to its length, with a glyph per feature or density bins on it, one karyotype per genome or sample. Click a chromosome to open it with its own bins, a bp axis and zoom; from there the dashboard can be filtered to the chromosome or the visible range.
Input: one row per feature or window, on a chromosome.
| Column | Config key | Need | Type | Example |
|---|---|---|---|---|
chrom |
chrom_col |
required | String | chr1, X |
start |
start_col |
required | Numeric | 1000000 |
end |
end_col |
required | Numeric | 2000000 |
value |
value_col |
optional, density on a colour scale | Numeric | 12.4 |
svtype |
category_col |
optional, categorical colour | String | DEL, complete |
sample |
sample_col |
optional, one karyotype per value | String | NA12878_75M |
label |
label_col |
optional, hover name | String | DEL |
sequence_length |
chrom_length_col |
optional, else assembly, else the last feature |
Numeric | 248956422 |
Compatible inputs: Structural variants from nf-core/sarek, BUSCO placements and telomeric repeats from nf-core/genomeqc, variant density per window from a VCF.
Controls
- Primary: Genome, Go to chromosome, Draw features as (Auto, Marks, Density)
- Cosmetic: Assembly, Bars (rows or columns), Colour (category or value), bin size, colour scale, feature opacity
YAML
- tag: viz-ideogram
  component_type: advanced_viz
  workflow_tag: my_workflow
  data_collection_tag: sv_calls
  viz_kind: ideogram
  config:
    viz_kind: ideogram
    chrom_col: chrom
    start_col: pos
    end_col: end
    category_col: svtype
    sample_col: sample
    label_col: svtype
    assembly: hg38
    mode: auto
    orientation: horizontal
Spatial cells
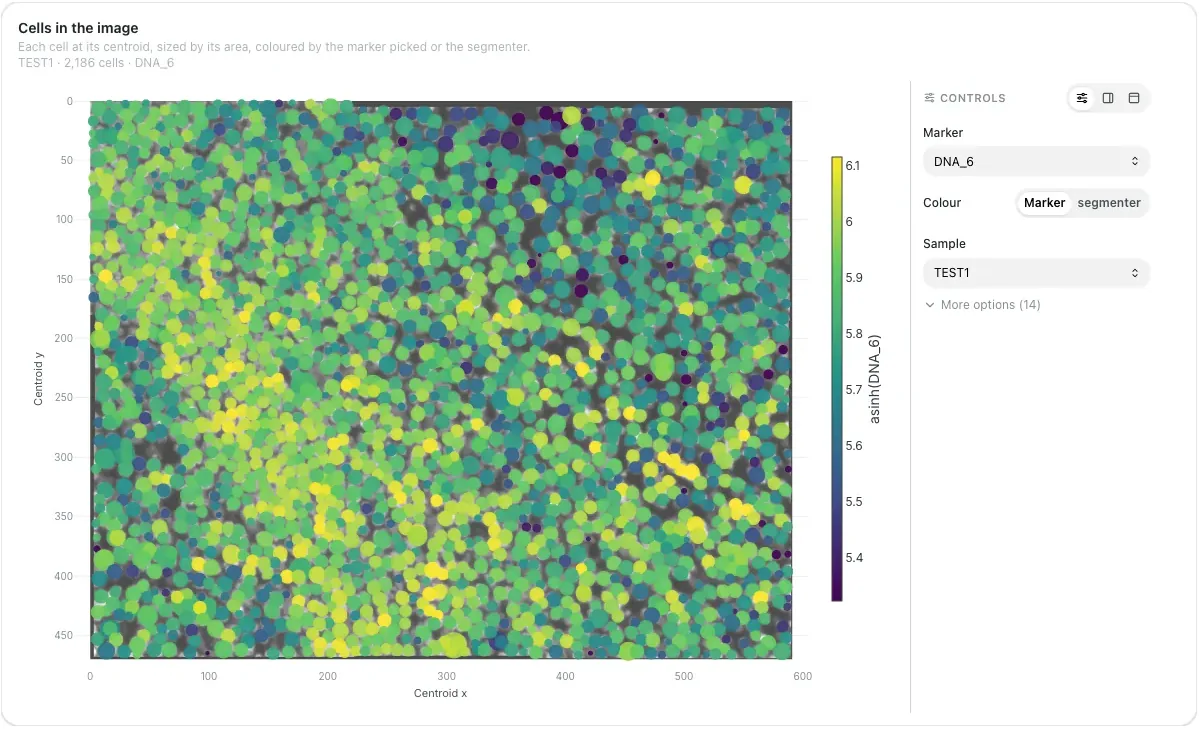
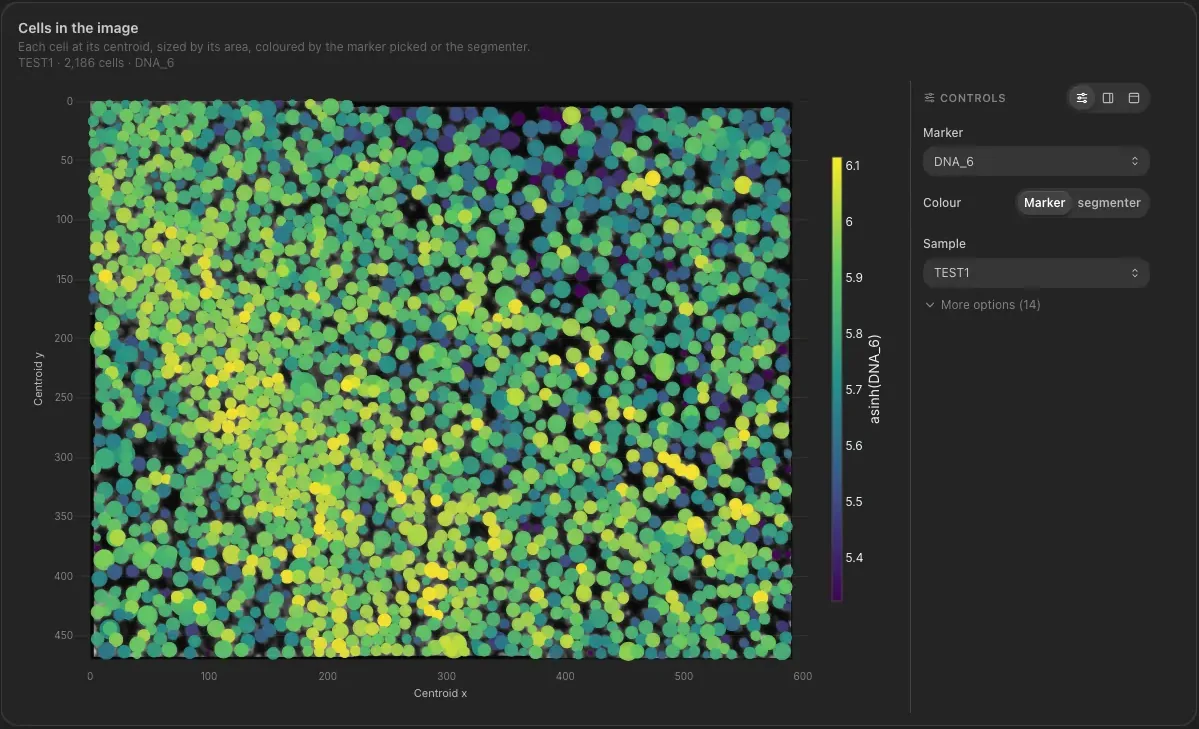
v1.20.0+ viz_kind: spatial_cells
Segmented cells where they sit in the image: one marker per cell at its centroid, sized by its area, coloured by a marker picked in the panel or by cell type, optionally over an image of the sample. A lasso selects cells.
Input: one row per segmented cell, wide: one intensity column per marker.
| Column | Config key | Need | Type | Example |
|---|---|---|---|---|
cell_key |
cell_id_col |
required, unique across samples | String or Integer | TEST1\|Cellpose\|1 |
X_centroid |
x_col |
required | Numeric | 395.4 |
Y_centroid |
y_col |
required, grows downwards | Numeric | 16.8 |
DNA_6, CD45, ... |
value_columns or value_columns_pattern |
optional, the markers to pick from | Numeric | 14242.9 |
segmenter |
category_col |
optional, categorical colour | String | Cellpose |
sample |
sample_col |
optional, one image each | String | TEST1 |
Area |
area_col |
optional, sizes the marker | Numeric | 180 |
Compatible inputs: MCQUANT cell tables.
Controls
- Primary: Marker, Colour (marker or category), Sample, Transform (Linear, asinh, log1p)
- Cosmetic: Clip low and high, asinh cofactor, colour scale, reverse scale, size by area, size, opacity, Y axis, Samples (one or side by side), image underlay and opacity, legend, hover columns
YAML
- tag: viz-spatial-cells
  component_type: advanced_viz
  workflow_tag: my_workflow
  data_collection_tag: mcquant_cells
  viz_kind: spatial_cells
  config:
    viz_kind: spatial_cells
    cell_id_col: cell_key
    x_col: X_centroid
    y_col: Y_centroid
    category_col: segmenter
    sample_col: sample
    area_col: Area
    value_columns: [DNA_6, CD45, CD57]
    color_by: value
    transform: asinh
    selection_enabled: true
    selection_column: cell_key
General purpose
Scatter (X/Y)
v1.11.0+ viz_kind: scatter_xy
Numeric against numeric, with a size column, a reference line, log axes and a selection key.
Input: one row per point.
| Column | Config key | Need | Type | Example |
|---|---|---|---|---|
rep_a |
x_col |
required | Numeric | 812.4, 15.2 |
rep_b |
y_col |
required | Numeric | 790.1, 22.8 |
gene |
label_col |
optional, hover and selection label | String | GAPDH |
mean_expression |
size_col |
optional, marker size | Numeric | 801.3 |
biotype |
color_col |
optional, marker colour | String | protein_coding |
Compatible inputs: Any table with two numeric columns: replicate concordance, QC metric pairs.
Controls
- Primary: Cloud (Points, Density), Log x, Log y, Reference line, Reference value, Highlight
- Cosmetic: Marker size, opacity, marker outline, top-N labels, colourscale, legend
YAML
Hierarchical heatmap
v0.13.0+ viz_kind: complex_heatmap
A clustered matrix with dendrograms and annotation tracks, computed on the server.
Input: one row per sample, one numeric column per gene (wide format).
| Column | Config key | Need | Type | Example |
|---|---|---|---|---|
sample_id |
index_column |
required | String | ctrl_1, treat_1 |
TP53, EGFR, ... |
value_columns |
required, every numeric column when unset | Numeric | 9.81, 7.42 |
condition |
row_annotation_cols |
optional, annotation strip | String | control, treated |
Compatible inputs: A normalised count matrix such as DESeq2 vst() (nf-core/rnaseq, differentialabundance).
Controls
- Primary: Normalisation, Clustering method, Cluster rows, Cluster columns
- Cosmetic: Row annotations, column annotations
Height v1.19.3+: max_rows (3 to 16) lets the tile grow to fit a large matrix, up to that many grid rows; unset, it keeps its layout height and only shrinks for a small matrix. min_cell_px (2 to 40, 12 when unset) is the shortest row height the tile asks the grid for.
YAML
UpSet
v0.13.0+ viz_kind: upset_plot
Set intersections as bars over a dot matrix: the readable alternative to a Venn diagram.
Input: one row per item, one 0/1 column per set.
| Column | Config key | Need | Type | Example |
|---|---|---|---|---|
contrastA, contrastB, contrastC |
set_columns |
required, the 0/1 columns when unset | Integer (0/1) | 1, 0 |
Compatible inputs: Any binary membership table: features called per contrast, taxa per site.
Controls
- Primary: Sort by, Order, Min intersection size, Colour intersections by
- Cosmetic: Show annotations, set-size bars, intersection count labels, annotation tracks
YAML
Sankey
v0.13.0+ viz_kind: sankey
Categorical flow across ordered levels, such as sample to lineage to clade.
Input: one row per item, one categorical column per level, in order.
| Column | Config key | Need | Type | Example |
|---|---|---|---|---|
qc_status, lineage, clade |
step_cols |
required, 2 or more, in order | String | pass, XBB.1.5 |
count |
value_col |
optional, link weight; unset counts rows | Numeric | 12 |
Compatible inputs: Any tidy table with ordered categorical columns (nf-core/viralrecon QC, Pangolin and Nextclade).
Controls
- Primary: Depth, Colour links by, Sort nodes
- Cosmetic: Link opacity, node labels, min link value
YAML
Parallel coordinates
v1.13.0+ viz_kind: parallel_coordinates
One polyline per sample across many metric axes. A brush on an axis becomes a range filter.
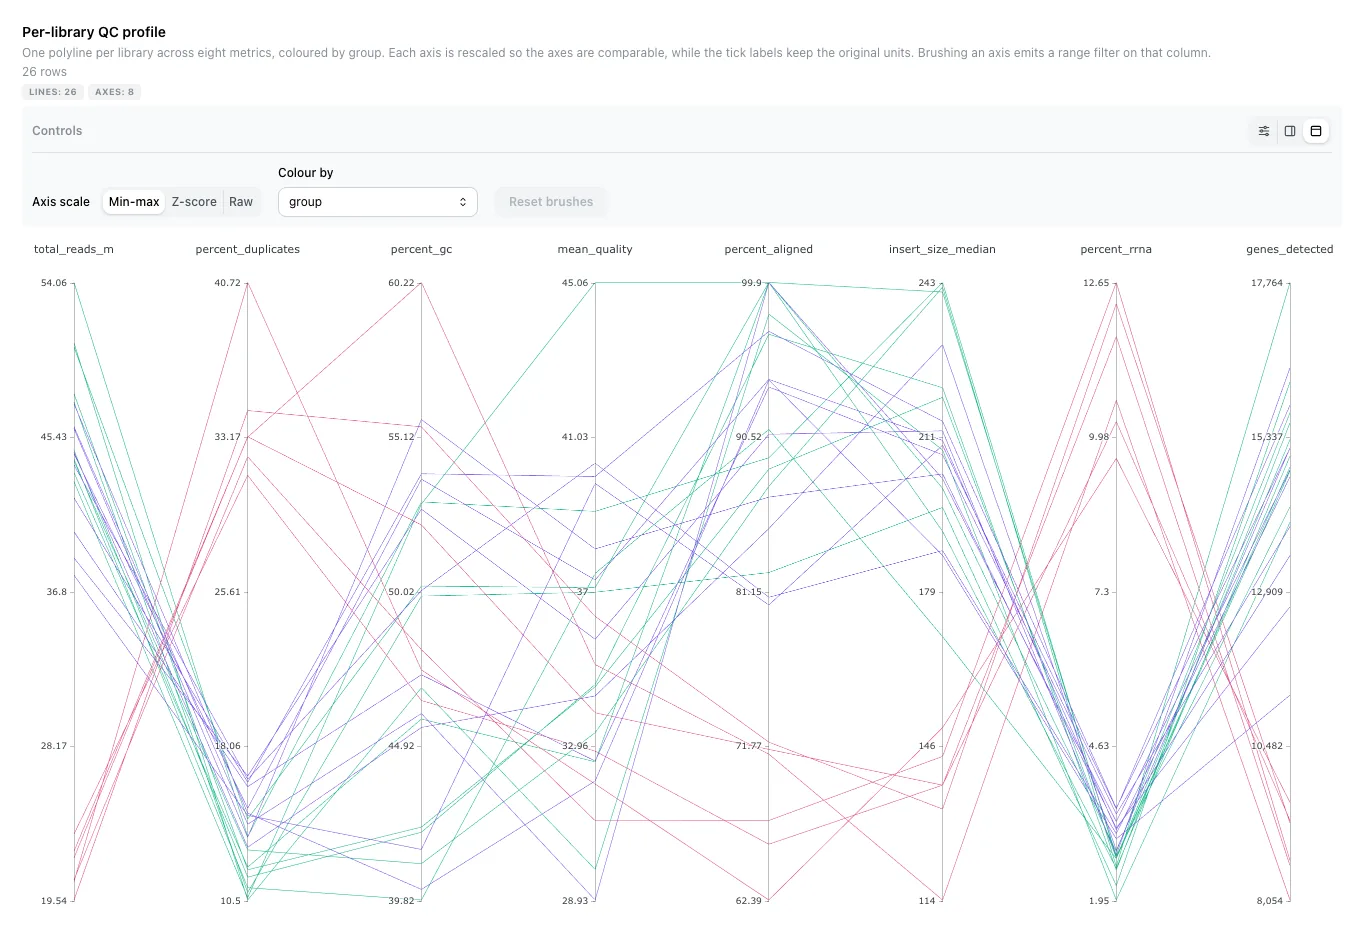
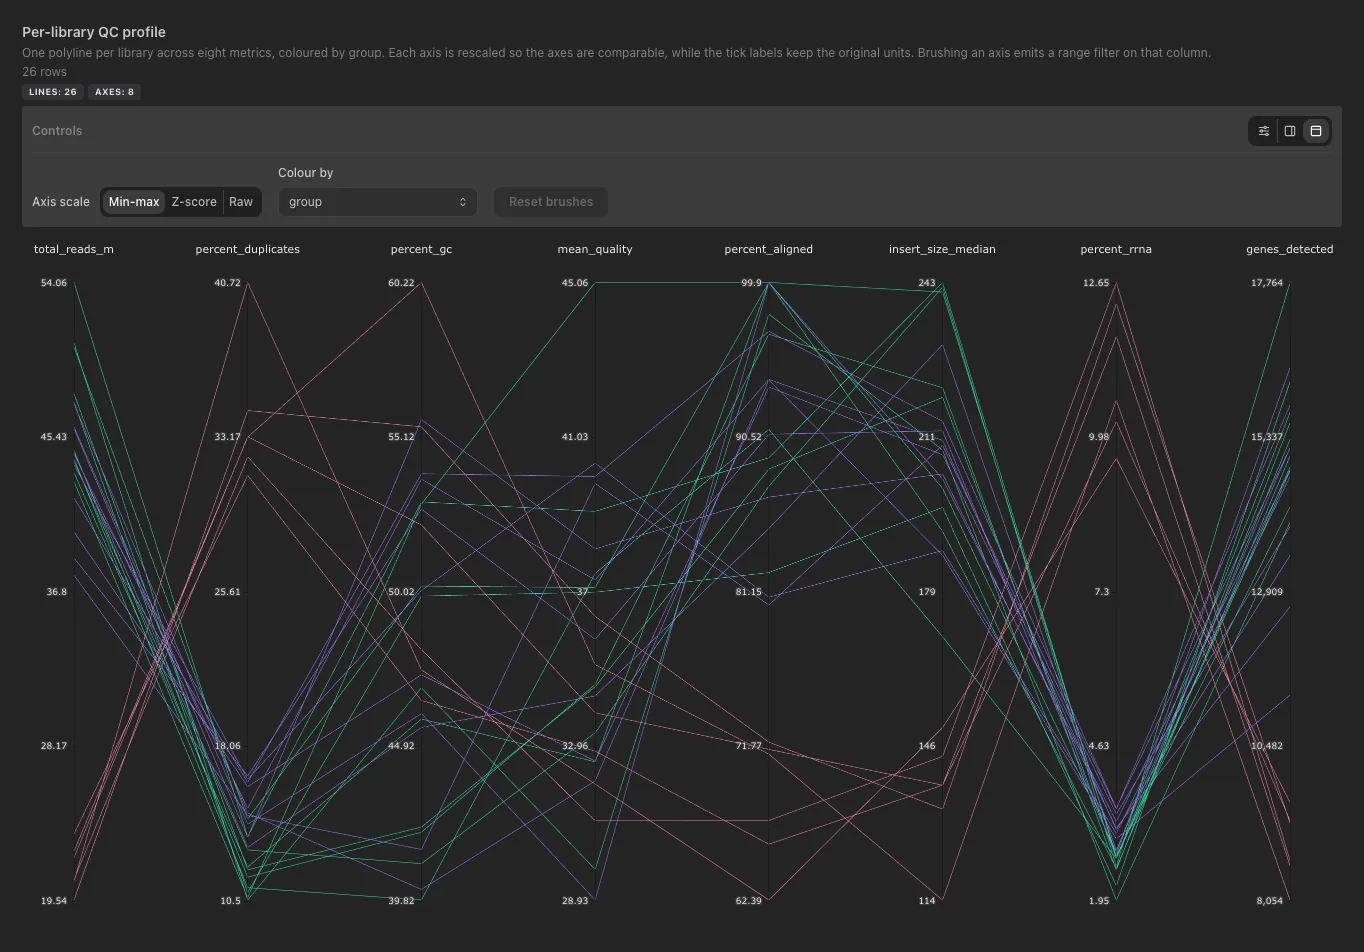
Input: one row per sample.
| Column | Config key | Need | Type | Example |
|---|---|---|---|---|
sample |
sample_col |
required | String | WT_REP1 |
total_reads, percent_duplicates, percent_gc, percent_aligned |
metric_cols |
required, every numeric column when unset | Numeric | 24813402, 18.2 |
group |
group_col |
optional, line colour | String | WT, KO |
Compatible inputs: Any per-sample QC table, such as MultiQC general statistics.
Controls
- Primary: Axis scale, Colour by, Reset brushes
- Cosmetic: Colourscale, line opacity
YAML
- tag: viz-parallel-coordinates
  component_type: advanced_viz
  workflow_tag: my_workflow
  data_collection_tag: qc_metrics
  viz_kind: parallel_coordinates
  config:
    viz_kind: parallel_coordinates
    sample_col: sample
    group_col: group
    metric_cols: [total_reads, percent_duplicates, percent_gc, percent_aligned]
Record card
v1.13.0+ viz_kind: record_card
One row of a collection as labelled fields and links, following a selection made in another tile.
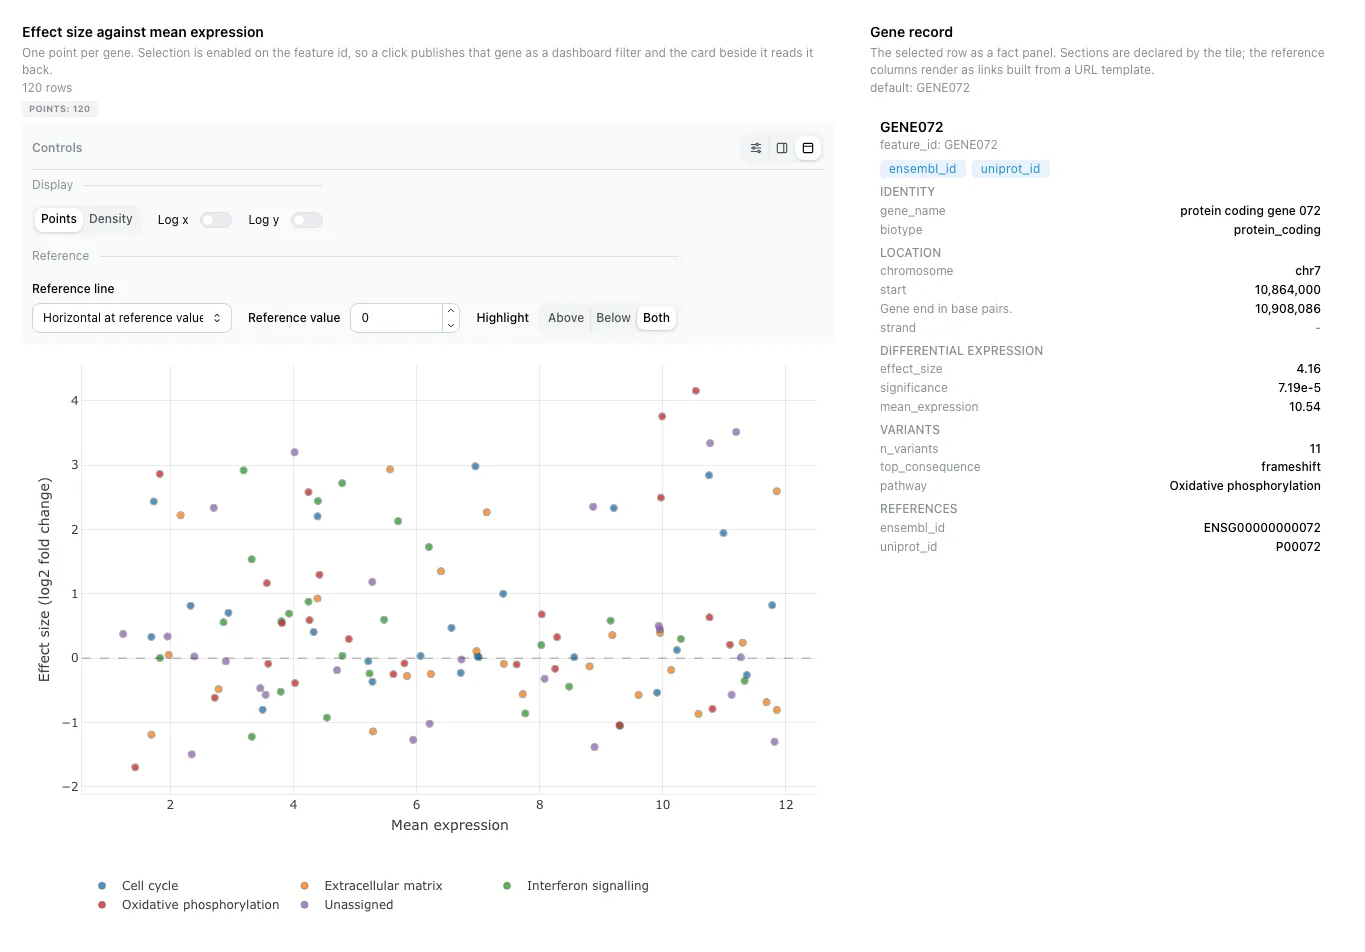
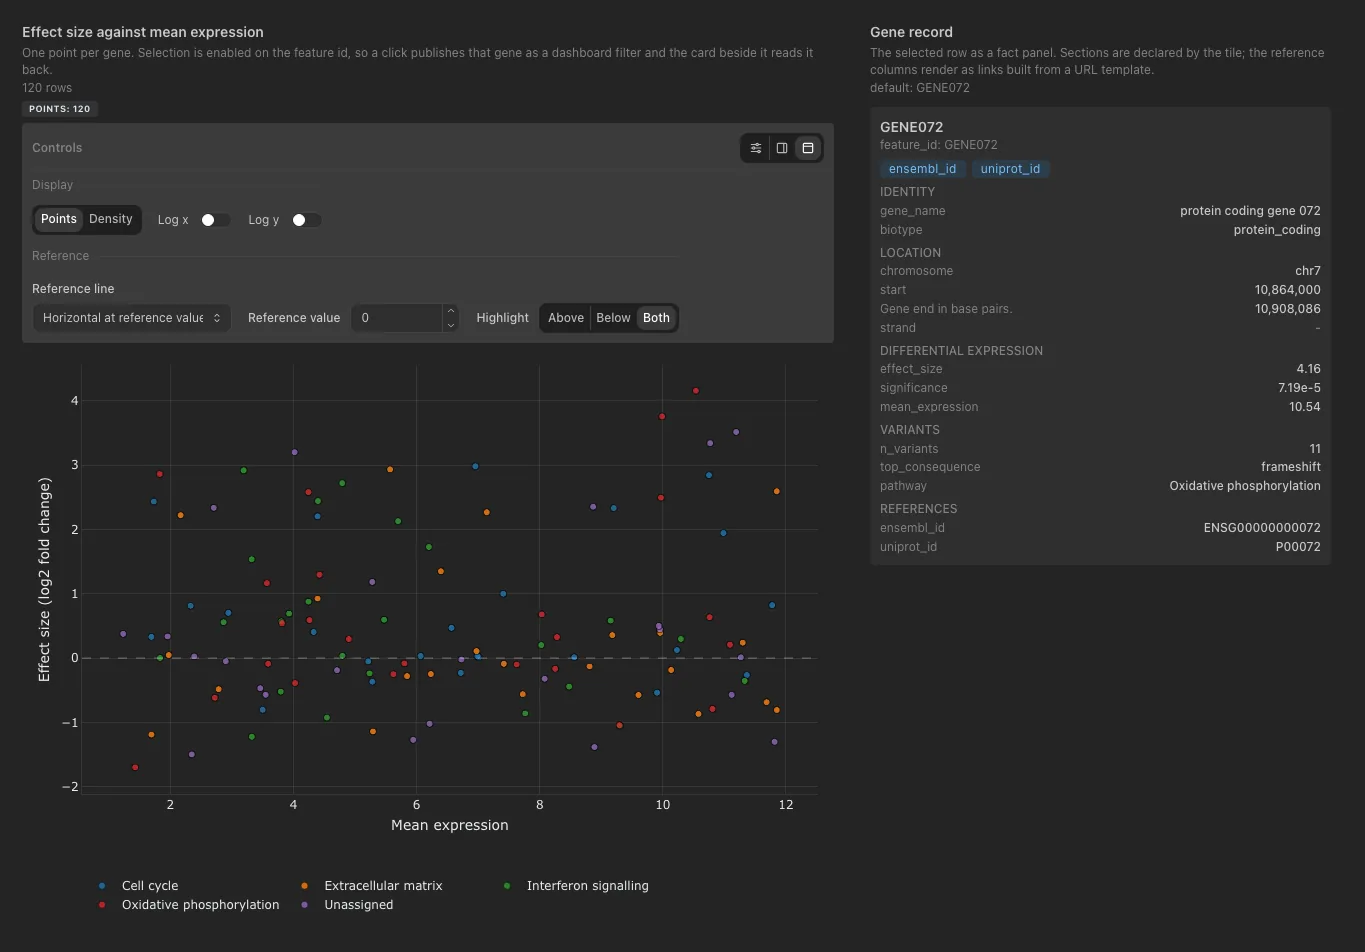
Input: one row per record.
| Column | Config key | Need | Type | Example |
|---|---|---|---|---|
feature_id |
id_col |
required, matched against the selection | String | ENSG00000141510 |
gene_symbol |
title_col |
optional, card heading | String | TP53 |
Every other column (biotype, chromosome, start, end) is a field; sections groups them, link_templates turns one into a link.
Compatible inputs: Any table with an identifier column.
Controls
- Primary: Record picker (when a selection holds several records)
- Cosmetic: Fields per card
YAML
- tag: viz-record-card
  component_type: advanced_viz
  workflow_tag: my_workflow
  data_collection_tag: gene_summary
  viz_kind: record_card
  config:
    viz_kind: record_card
    id_col: feature_id
    title_col: gene_symbol
    linked_component: viz-scatter-xy
    sections:
      Identity: [gene_symbol, biotype]
      Location: [chromosome, start, end]
    link_templates:
      feature_id: "https://www.ensembl.org/id/{value}"
Ranked table
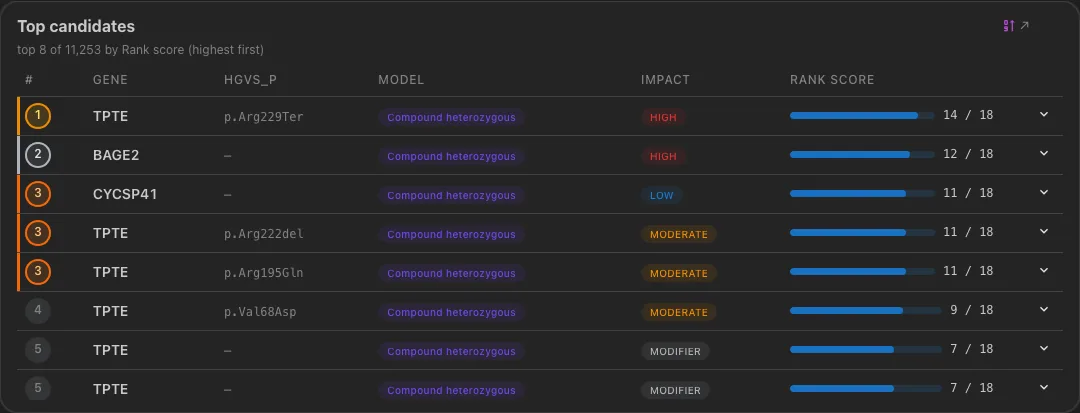
v1.20.0+ viz_kind: ranked_table
A leaderboard of candidates ordered by a score: medals on the first three, badges coloured by value and bars in the cells, the fields behind a row in a hover popover. With selection_enabled, a click on a row filters the dashboard to it.
Input: one row per candidate (a variant, a gene). Every other column is named in the config (columns, popover_columns), not bound as a role.
| Column | Config key | Need | Type | Example |
|---|---|---|---|---|
gene |
title_col |
required, bold row name | String or Integer | TPTE |
rank_score |
score_col |
required, orders the rows | Numeric | 14 |
hgvs_p |
subtitle_col |
optional, monospace beside the title | String | p.Arg229Ter |
rank |
rank_col |
optional, shown in the medal | Numeric | 1 |
Compatible inputs: Ranked variants (nf-core/raredisease), outlier genes (nf-core/drop), somatic variants by priority (nf-core/sarek).
Controls
- Primary: Top N, Min score, Filter by, Sort by, First (highest or lowest)
- Cosmetic: Hide columns, Medals, Compact rows, Open family details
columns sets how each cell is drawn: text, mono, badge, bar or number. family_dc_tag adds a pedigree of the family to the pinned popover, see Pedigree.
YAML
- tag: viz-ranked-table
  component_type: advanced_viz
  workflow_tag: my_workflow
  data_collection_tag: ranked_variants
  viz_kind: ranked_table
  config:
    viz_kind: ranked_table
    title_col: gene
    subtitle_col: hgvs_p
    score_col: rank_score
    columns:
      - {column: impact, label: Impact, display: badge}
      - {column: rank_score, label: Rank score, display: bar, decimals: 0}
    popover_columns: [consequence, gnomad_af, cadd]
    top_n: 8
    selection_enabled: true
    selection_column: variant_key
Ranked distribution
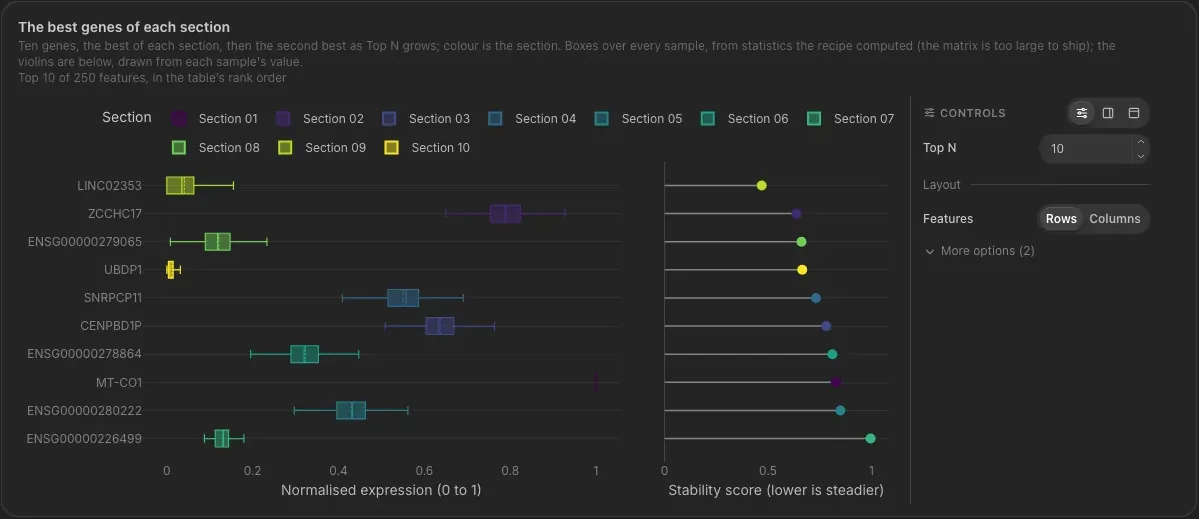
v1.20.0+ viz_kind: ranked_distribution
The top-N features ranked by a score, each with its distribution across samples as a box or violin beside a lollipop of the score, on one shared feature axis. Used for gene stability and housekeeping-gene panels.
Input: one row per feature, with box statistics (pre-aggregated, boxes only), or one row per feature and sample (long form, boxes or violins). Bind one shape, not both.
| Column | Config key | Need | Type | Example |
|---|---|---|---|---|
gene_id |
feature_id_col |
required | String | ENSG00000198804 |
stability_score |
score_col |
required, ranks the features | Numeric | 0.83 |
section_rank |
rank_col |
optional, else ranked by the score | Numeric | 1 |
gene_name |
label_col |
optional, axis label | String | MT-CO1 |
section |
group_col |
optional, colour | String | Section 01 |
value |
value_col |
long form | Numeric | 0.9994 |
q1, median, q3 |
q1_col, median_col, q3_col |
pre-aggregated, all three together | Numeric | 0.9996, 0.9998, 0.9999 |
lower, upper, mean |
lower_col, upper_col, mean_col |
optional, pre-aggregated | Numeric | 0.999, 1.0 |
Compatible inputs: Gene stability ranking and per-sample values from nf-core/stableexpression.
Controls
- Primary: Top N, Draw (Box, Violin; long form only), First (lowest or highest)
- Cosmetic: Features (rows or columns), log value axis
YAML
- tag: viz-ranked-distribution
  component_type: advanced_viz
  workflow_tag: my_workflow
  data_collection_tag: stable_gene_distribution
  viz_kind: ranked_distribution
  config:
    viz_kind: ranked_distribution
    feature_id_col: gene_id
    score_col: stability_score
    rank_col: section_rank
    label_col: gene_name
    group_col: section
    q1_col: q1
    median_col: median
    q3_col: q3
    top_n: 10
    ascending: true
    distribution: box
    selection_enabled: true
Benchmarking
PR benchmark
v1.10.0+ viz_kind: pr_benchmark
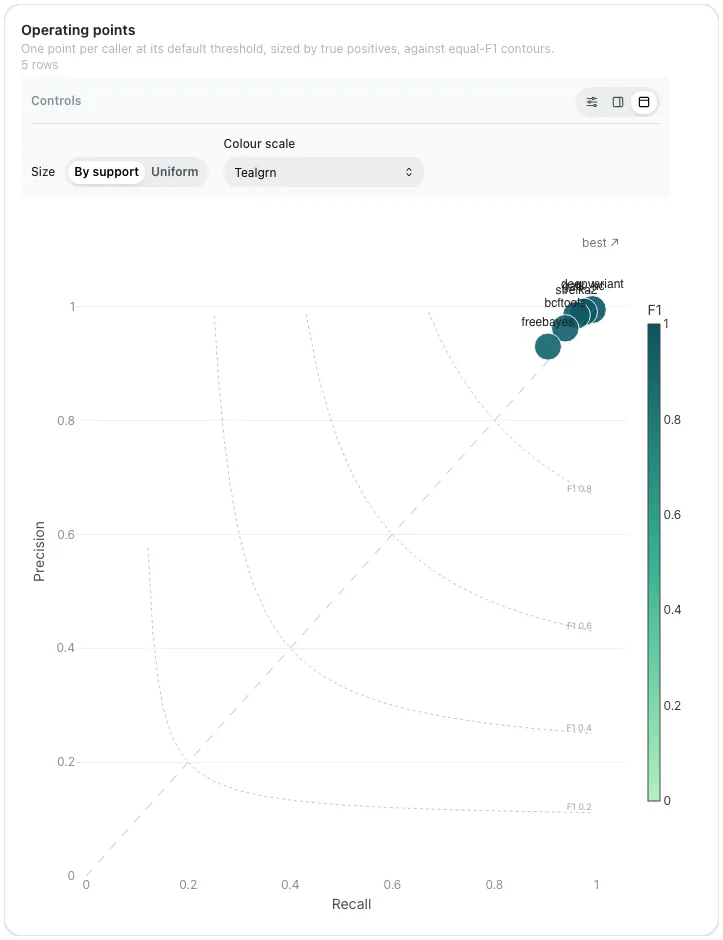
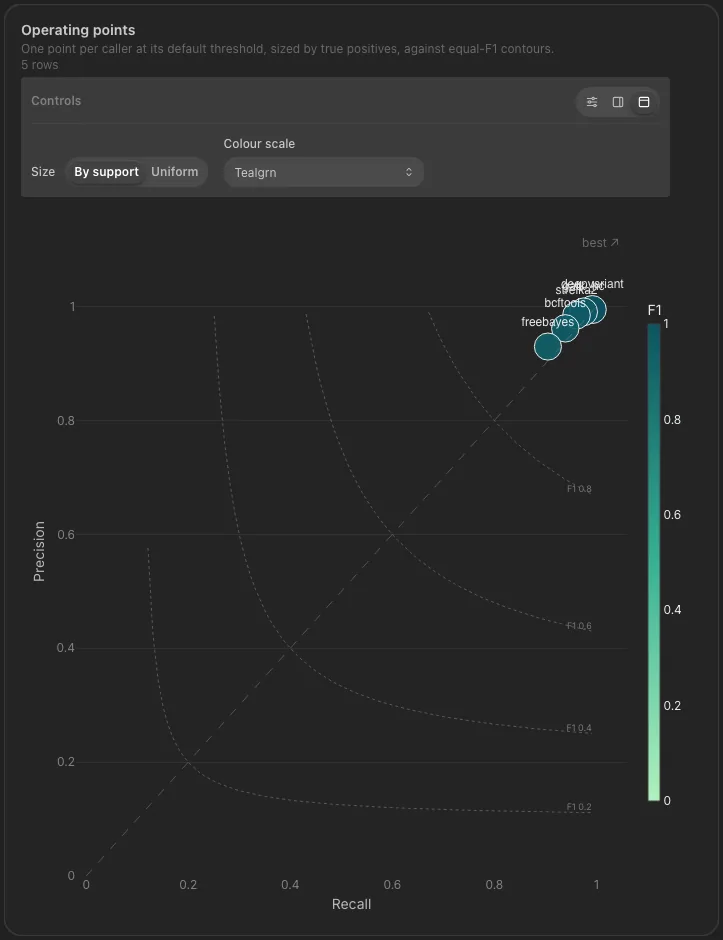
Each callset at its precision and recall, with F1 contours. The roc view sweeps a threshold into curves.
Input: one row per callset.
| Column | Config key | Need | Type | Example |
|---|---|---|---|---|
tool |
label_col |
required | String | DeepVariant |
recall |
recall_col |
required | Float | 0.9962 |
precision |
precision_col |
required | Float | 0.9978 |
f1 |
f1_col |
required | Float | 0.9970 |
tp |
support_col |
optional, point size | Numeric | 3891204 |
variant_type |
category_col |
optional | String | SNP, INDEL |
threshold |
threshold_col |
optional, the roc and both views (one row per callset and threshold) |
Numeric | 0.5 |
fpr |
fpr_col |
optional, ROC x axis | Float | 0.002 |
sample |
group_col |
optional, one curve per group | String | HG002 |
Compatible inputs: hap.py or RTG vcfeval summaries (nf-core/variantbenchmarking, sarek).
Controls
- Primary: View (PR, ROC, both), Size, Colour scale
- Cosmetic: F1 iso-contours, y = x diagonal, fixed 0-1 axes, marker size, colour bar, point labels; curves: legend, markers, shade area, show AUC
YAML
Confusion matrix
v1.10.0+ viz_kind: confusion_matrix
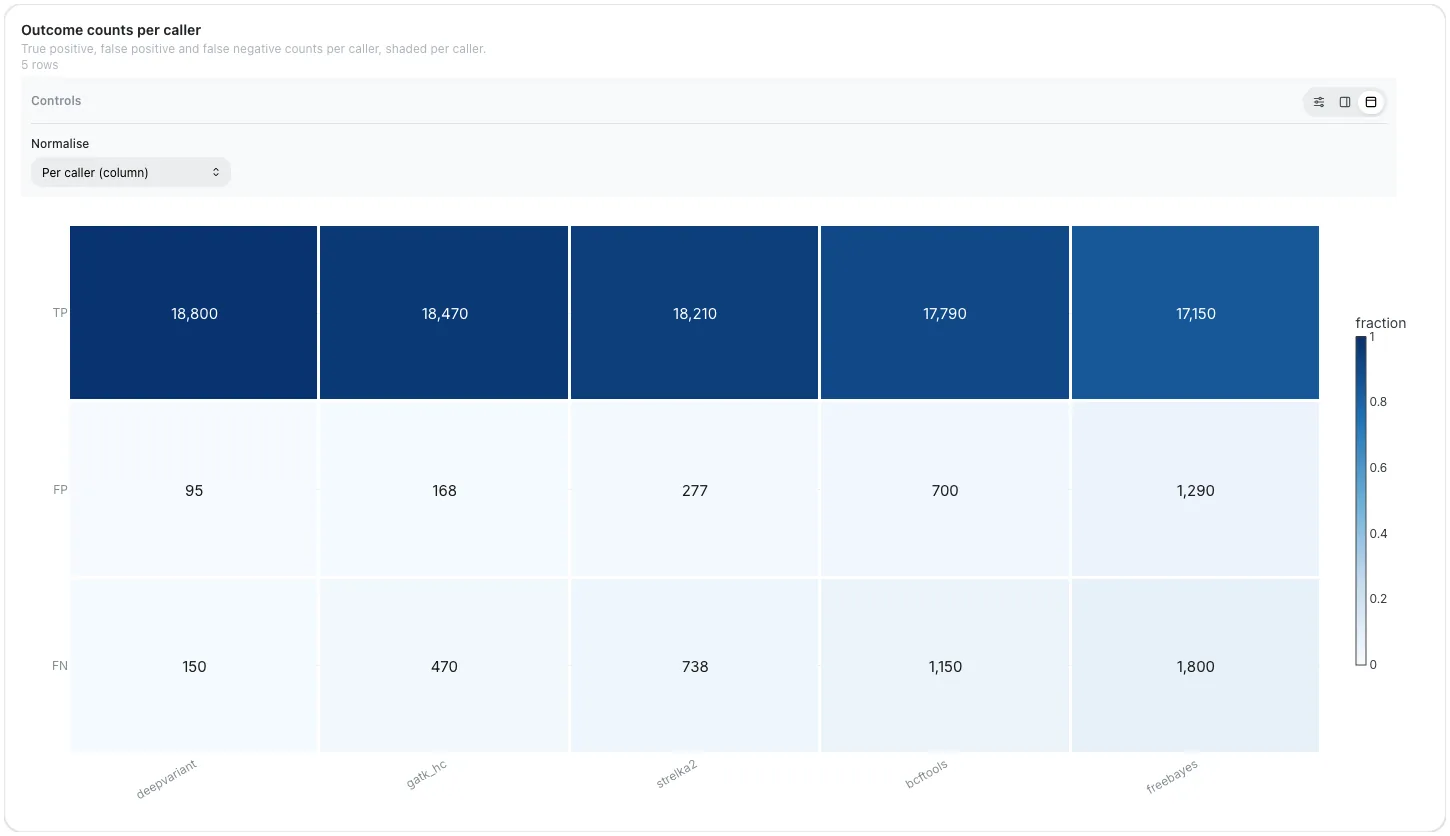
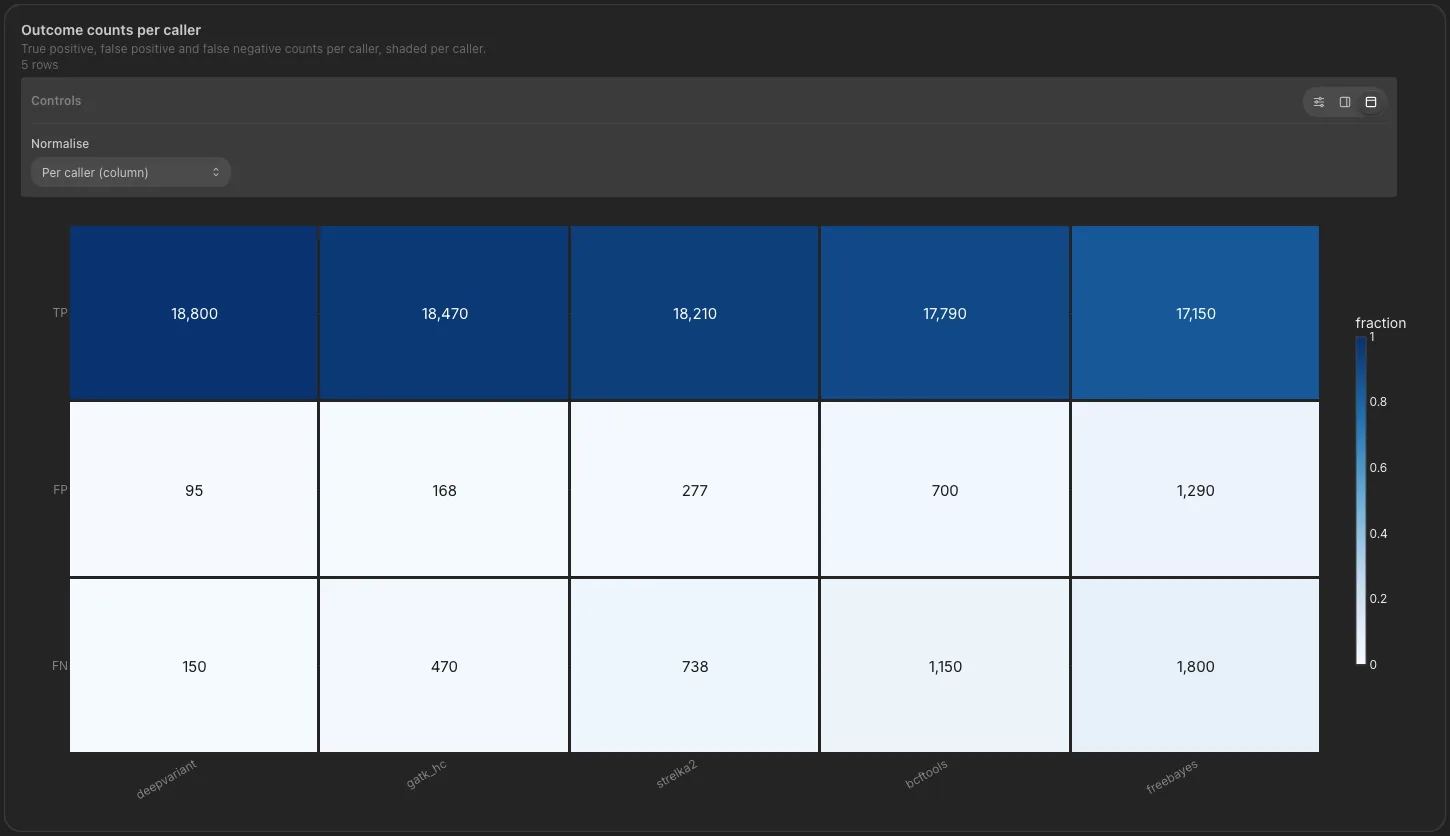
True positives, false positives and false negatives per callset as a heatmap.
Input: one row per callset.
| Column | Config key | Need | Type | Example |
|---|---|---|---|---|
tool |
label_col |
required | String | DeepVariant |
tp |
tp_col |
required | Numeric | 3891204 |
fp |
fp_col |
required | Numeric | 8592 |
fn |
fn_col |
required | Numeric | 14810 |
tn |
tn_col |
optional | Numeric | 120533 |
Compatible inputs: Benchmark counts as nf-core/variantbenchmarking reports them.
Controls
- Primary: Normalise
- Cosmetic: Colour scale, colour bar, show fractions, font size
YAML
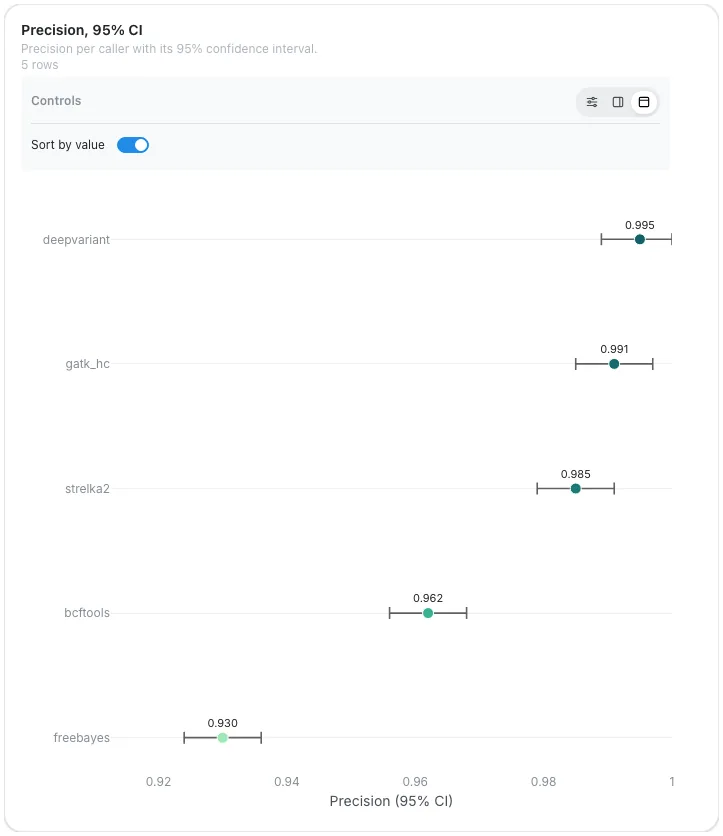
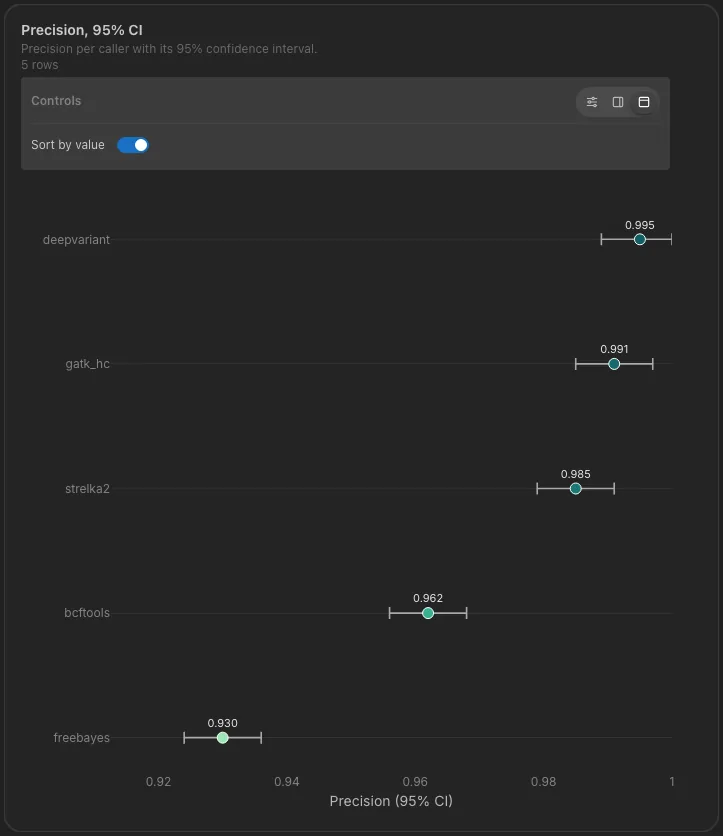
Metric with CI
v1.10.0+ viz_kind: metric_ci_bars
One metric per callset with its 95% confidence interval, as a forest plot.
Input: one row per callset.
| Column | Config key | Need | Type | Example |
|---|---|---|---|---|
tool |
label_col |
required | String | DeepVariant |
precision |
value_col |
required | Float | 0.9978 |
precision_lower |
lower_col |
required | Float | 0.9976 |
precision_upper |
upper_col |
required | Float | 0.9980 |
Compatible inputs: Precision or recall intervals from hap.py, som.py or vcfeval counts (nf-core/variantbenchmarking).
Controls
- Primary: Sort by value
- Cosmetic: Value labels, colour scale, point size
YAML
Proteins
Structure prediction, protein annotation and protein family runs publish a model, the alignment behind it and per-residue facts. Eight kinds draw them and stay linked by residue. The tables they read, the structure resolver and the numbering check are on the Proteins page. The nf-core proteinfold, proteinannotator and proteinfamilies templates are built on them.
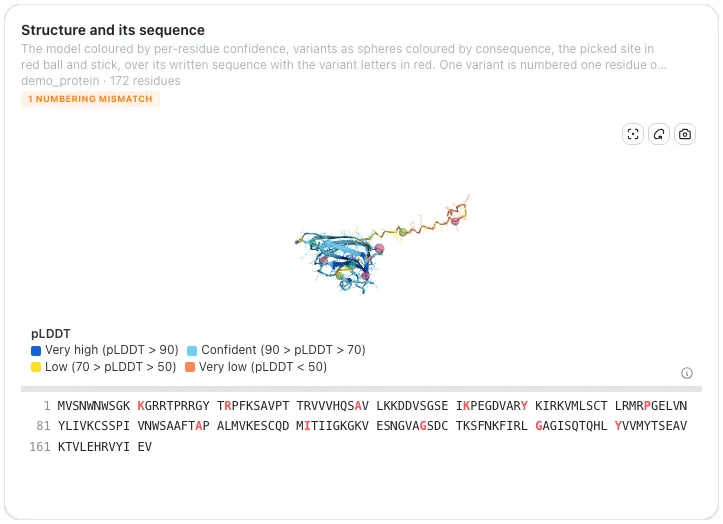
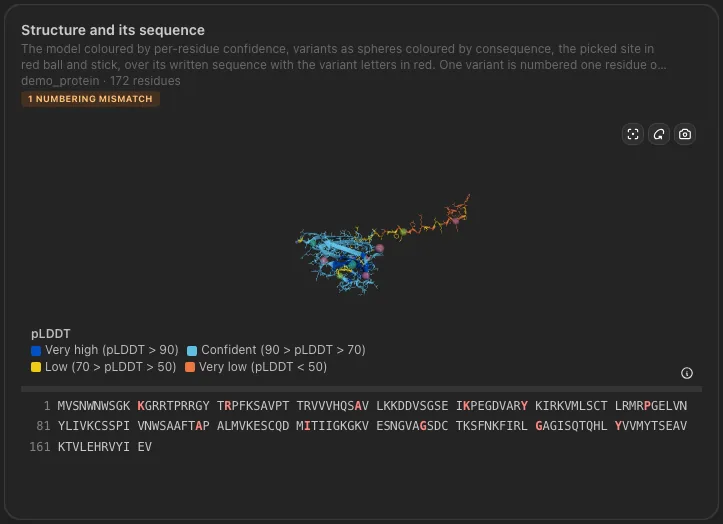
3D structure
v1.19.0+ viz_kind: molecule_3d
The model in 3Dmol.js, coloured by confidence, chain or a value, variants as spheres. A click picks a residue, shift-click a range.
Input: one PDB or mmCIF file per protein (structure_dc_tag, pLDDT in the B-factor column), plus a residue table, one row per residue.
| Column | Config key | Need | Type | Example |
|---|---|---|---|---|
position |
position_col |
required | Numeric | 175, 858 |
entity |
entity_col |
optional, the protein of the row | String | P04637 |
chain |
chain_col |
optional | String | A |
conservation |
value_col |
optional, color_mode: value |
Numeric | 0.82 |
domain |
category_col |
optional, color_mode: category |
String | DNA-binding |
ref_aa |
ref_aa_col |
optional, variant spheres | String | R |
alt_aa |
alt_aa_col |
optional, variant spheres | String | H |
label |
label_col |
optional | String | p.R175H |
uniprot |
uniprot_col |
optional, structure_source: resolve, no file needed |
String | P04637 |
gene |
gene_col |
optional, structure_source: resolve |
String | TP53 |
sequence |
sequence_col |
optional, structure_source: resolve (ESMFold) |
String | MEEPQSDPSV |
See The data.
Compatible inputs: AlphaFold, ColabFold or ESMFold PDB / mmCIF (nf-core/proteinfold), or a model from AlphaFold DB.
Controls
- Primary: Protein, Colour by, Style, Layout (structure alone, with sequence, alignment or text)
- Cosmetic: Colour scale, variants, labels, follow selection, spin
YAML
Floating structure
v1.19.1+ placement: floating
The 3D tile leaves the grid and floats over every tab, as a card you drag, resize, fold or
dock. Only molecule_3d floats.
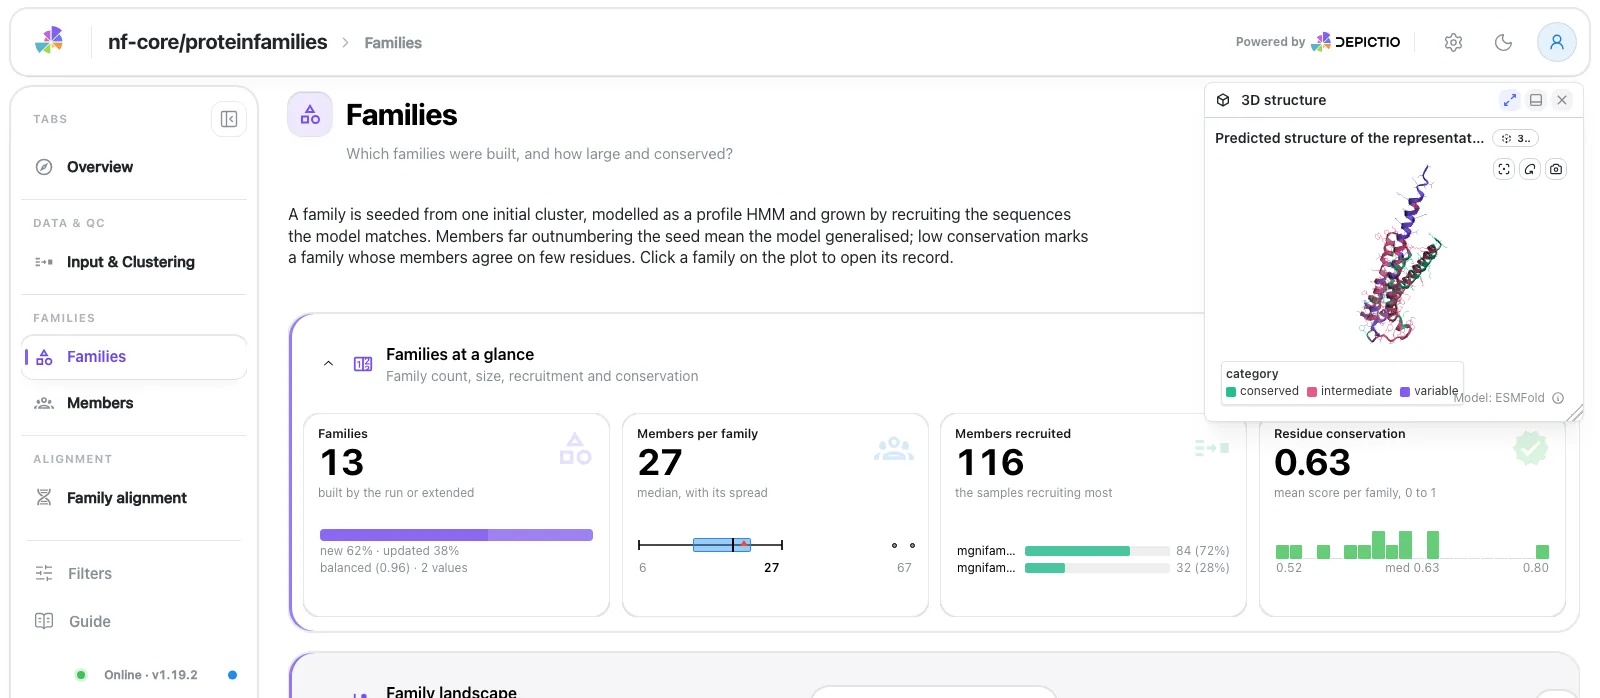
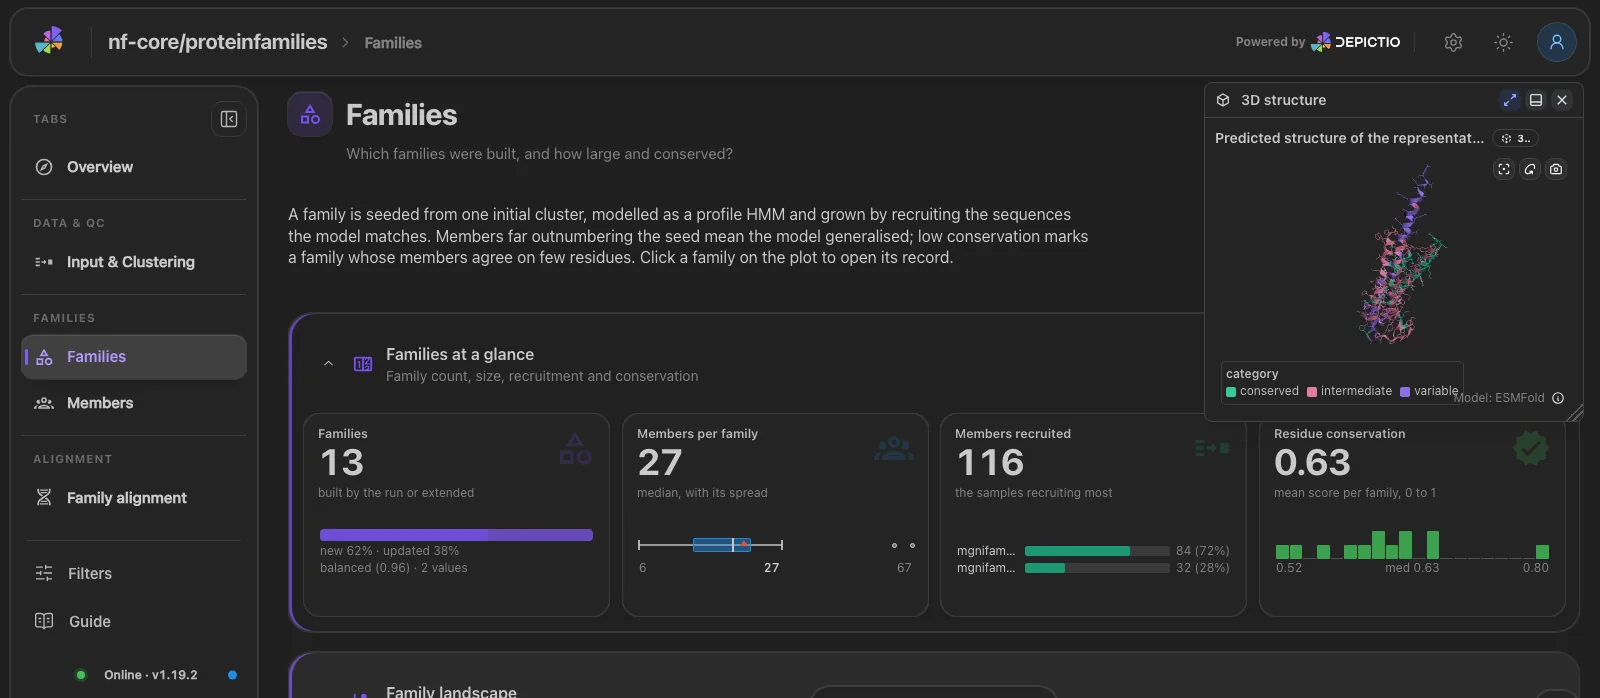
placement: floating             # grid (default) or floating
floating_initial_state: compact # compact, expanded, docked or hidden
Alignment
v1.19.0+ viz_kind: msa
A multiple sequence alignment with consensus and conservation rows. A row click selects a sequence, a column brush picks residues.
Input: one row per aligned sequence; rows of one msa_id have the same length.
| Column | Config key | Need | Type | Example |
|---|---|---|---|---|
msa_id |
msa_id_col |
required | String | P04637 |
seq_id |
seq_id_col |
required | String | query, UniRef90_P02340 |
aligned_sequence |
sequence_col |
required | String | MEEPQSDLSVEPPLSQETFS-LWKLL |
rank |
rank_col |
optional, 0 is the query | Numeric | 0, 1 |
identity |
identity_col |
optional | Numeric | 0.92 |
Compatible inputs: proteinfold MSAs, A3M, Stockholm or aligned FASTA.
Controls
- Primary: Alignment, Colour scheme, Sort rows
- Cosmetic: Column width, consensus row, conservation bars, max rows
YAML
Sequence track
v1.19.0+ viz_kind: sequence_track
The sequence on a ruler with a value lane, secondary structure, domains and variants. One strip per chain on a complex.
Input: a residue table, one row per residue.
| Column | Config key | Need | Type | Example |
|---|---|---|---|---|
position |
position_col |
required | Numeric | 1, 2 |
entity |
entity_col |
optional | String | P04637 |
residue |
residue_col |
optional, the letters | String | M, E |
plddt |
value_col |
optional, the value lane | Numeric | 41.2 |
region |
category_col |
optional | String | disordered |
A domains table (domains_dc_tag: start, end, label) and a variants table (variants_dc_tag: position, label, category) add their lanes, as in The data.
Compatible inputs: Per-residue tables built from a structure (pLDDT), S4PRED or domain hits.
Controls
- Primary: Entity, Chain
- Cosmetic: Residue width, letters, value colours
YAML
- tag: viz-sequence-track
  component_type: advanced_viz
  workflow_tag: my_workflow
  data_collection_tag: residues
  viz_kind: sequence_track
  config:
    viz_kind: sequence_track
    entity_col: entity
    position_col: position
    residue_col: residue
    value_col: plddt
    value_label: pLDDT
    domains_dc_tag: domains
    selection_enabled: true
HMM logo
v1.19.0+ viz_kind: hmm_logo
The logo of a profile HMM with insert and occupancy lanes, and where hmmsearch hits land on it. profile_source: msa computes it from an alignment instead.
Input: one row per match state and letter (long format).
| Column | Config key | Need | Type | Example |
|---|---|---|---|---|
hmm_position |
state_col |
required | Numeric | 1, 2 |
hmm_letter |
letter_col |
required | String | A, C |
emission |
emission_col |
required | Float | 0.031 |
hmm_name |
model_col |
optional, one logo per model | String | Pkinase |
entity |
entity_col |
optional | String | P00533 |
position |
position_col |
optional, residue on the reference | Numeric | 712 |
insert_prob |
insert_prob_col |
optional, read when present | Float | 0.02 |
insert_length |
insert_length_col |
optional, read when present | Float | 1.4 |
occupancy |
occupancy_col |
optional, read when present | Float | 0.98 |
consensus |
consensus_col |
optional, read when present | String | l |
rf |
rf_col |
optional, read when present | String | x |
cs |
cs_col |
optional, read when present | String | E |
The hits (hits_dc_tag) are a domain hit table with hmm_from and hmm_to. profile_source: msa reads an alignment table instead.
Compatible inputs: HMMER hmmbuild profiles and hmmsearch domain tables (hits_dc_tag), nf-core/proteinfamilies.
Controls
- Primary: Heights, Colour scheme
- Cosmetic: State width, consensus and insert rows, shown tracks, state window, fold below (bits), hits E-value, max hits
YAML
Domain architecture
v1.19.0+ viz_kind: domain_architecture
The domains of many proteins, one row each, or grouped by architecture. A partial match has a zigzag edge.
Input: one row per domain hit.
| Column | Config key | Need | Type | Example |
|---|---|---|---|---|
entity |
entity_col |
required | String | P00533 |
start |
start_col |
required | Numeric | 712 |
end |
end_col |
required | Numeric | 968 |
label |
label_col |
required | String | Pkinase_Tyr |
protein_length |
protein_length_col |
optional, backbone to scale | Numeric | 1210 |
hmm_from |
hmm_from_col |
optional, partial-match edge | Numeric | 1 |
hmm_to |
hmm_to_col |
optional, partial-match edge | Numeric | 259 |
hmm_length |
hmm_length_col |
optional | Numeric | 259 |
hmm_coverage |
hmm_coverage_col |
optional | Float | 0.96 |
i_evalue |
evalue_col |
optional, tooltip | Float | 3.1e-45 |
source |
source_col |
optional, color_by: source |
String | Pfam |
description |
description_col |
optional, tooltip | String | Protein tyrosine kinase |
accession |
accession_col |
optional | String | PF07714 |
Every optional column is read when present.
Compatible inputs: InterProScan or hmmsearch domain hits (nf-core/proteinannotator, proteinfamilies).
Controls
- Primary: View (Proteins, Architectures), Colour by
- Cosmetic: Sources, scale, residue width, architectures, max proteins
YAML
- tag: viz-domain-architecture
  component_type: advanced_viz
  workflow_tag: my_workflow
  data_collection_tag: domain_hits
  viz_kind: domain_architecture
  config:
    viz_kind: domain_architecture
    entity_col: entity
    start_col: start
    end_col: end
    label_col: label
    protein_length_col: protein_length
    view: proteins
Secondary structure
v1.19.0+ viz_kind: secondary_structure
Helices, strands and coil as a ribbon, with the probabilities behind the call and the agreement between sources.
Input: one row per residue, and per source when several are compared.
| Column | Config key | Need | Type | Example |
|---|---|---|---|---|
position |
position_col |
required | Numeric | 110, 111 |
ss_code |
state_col |
required, a DSSP or S4PRED code | String | C, E |
entity |
entity_col |
optional | String | P04637 |
ss_source |
source_col |
optional, one ribbon per source | String | S4PRED |
residue |
residue_col |
optional | String | S |
p_helix |
p_helix_col |
optional | Float | 0.08 |
p_strand |
p_strand_col |
optional | Float | 0.83 |
p_coil |
p_coil_col |
optional | Float | 0.13 |
confidence |
confidence_col |
optional, ribbon shading | Float | 0.71 |
Compatible inputs: S4PRED .ss2 predictions.
Controls
- Primary: Entity, Reference
- Cosmetic: Residue width, ribbon height, letters, confidence shading, coil segments, min segment, colours
YAML
- tag: viz-secondary-structure
  component_type: advanced_viz
  workflow_tag: my_workflow
  data_collection_tag: ss_calls
  viz_kind: secondary_structure
  config:
    viz_kind: secondary_structure
    entity_col: entity
    position_col: position
    state_col: ss_code
    source_col: ss_source
    reference_source: S4PRED
    p_helix_col: p_helix
    p_strand_col: p_strand
    p_coil_col: p_coil
Predicted aligned error
v1.19.0+ viz_kind: pae_matrix
A model's PAE matrix with pLDDT strips. A low-error block on the diagonal is a confident domain. A brush picks the scored range.
Input: one PAE file per protein (a pae file collection, pae_dc_tag), plus a residue table, one row per residue.
| Column | Config key | Need | Type | Example |
|---|---|---|---|---|
position |
position_col |
required | Numeric | 1, 2 |
entity |
entity_col |
optional, picks the PAE file | String | P04637 |
plddt |
value_col |
optional, the pLDDT strips | Numeric | 41.2 |
chain |
chain_col |
optional, chain boundaries | String | A |
See The data.
Compatible inputs: proteinfold PAE TSV, AlphaFold DB or ColabFold JSON.
Controls
- Primary: Entity, Colours
- Cosmetic: pLDDT strips, brush (diagonal, rectangle)
YAML
Ramachandran
v1.19.0+ viz_kind: ramachandran
Backbone phi and psi of the model, computed in the browser from the 3D tile's file. The favoured regions are a guide, not MolProbity contours.
Input: the structure file of the 3D structure tile, plus a residue table, one row per residue.
| Column | Config key | Need | Type | Example |
|---|---|---|---|---|
position |
position_col |
required | Numeric | 175, 858 |
entity |
entity_col |
optional | String | P04637 |
chain |
chain_col |
optional | String | A |
conservation |
value_col |
optional, point colour | Numeric | 0.82 |
domain |
category_col |
optional, point colour | String | DNA-binding |
uniprot |
uniprot_col |
optional, structure_source: resolve |
String | P04637 |
gene |
gene_col |
optional, structure_source: resolve |
String | TP53 |
sequence |
sequence_col |
optional, structure_source: resolve |
String | MEEPQSDPSV |
Compatible inputs: The structure file the 3D tile reads.
Controls
- Primary: Protein, Colour by, Residue classes
- Cosmetic: Approximate favoured regions, marker size, follow selection