

The nascent template follows an nf-core/nascent run from run-on libraries (GRO-seq, PRO-seq) to the genes and genomic windows that respond over a time course:
- Overview: the run in four key figures, live findings and four figures, each linked to the tab that explains it
- Library QC: reads in genes, genes detected and strand balance of each library, in time order
- Gene dynamics: induced and repressed genes, by the phase of their peak, with the genes that move most
- Sample similarity: how far each time point has moved from the baseline
- Genome signal: the strand-specific signal along the genome, linked to a genome browser
- Signal dynamics: the 250 kb windows that gain or lose signal over time
The persistent sample filters (group, library, time point) sit in the left panel
and narrow every tab; a pick reaches the per-library collections by sample and
the per-gene and per-window calls by the time point of their peak.
Without replicates, a call is a rule
A gene or window is called induced or repressed when its peak change against the baseline is at least twofold and at least two time points move that way. Time courses are rarely replicated, so this is a fold-change rule on consecutive time points, not a statistical test: read a gene's trajectory before trusting its class.
Quick start
depictio ingest /path/to/nascent_results \
  --template nf-core/nascent/latest \
  --var METADATA_FILE=/path/to/design.tsv
The results directory is the only required value. nascent publishes neither a
sample sheet nor a design table; the optional design gives each library its
hours. Without it, a library id ending in a duration (<name>_30min,
<name>_2h) still gets its time point, and a library with neither drops out of
the time-course panels while its QC stays on Library QC.
| Variable | Default | Role |
|---|---|---|
METADATA_FILE |
unset (reference: {DATA_ROOT}/input/design.tsv) |
design table: the library id in sample, the hours in TIME_COL, a time_point label and any factor |
TIME_COL |
time_h |
design column holding each library's hours |
GROUP_COL |
first factor column of the design | column the dashboard groups and filters libraries by |
TRACKS_URI |
unset | s3:// or https:// folder holding the run's results: the browser reads the bigWigs in place instead of uploading them from DATA_ROOT |
GENOME |
hg38 |
UCSC assembly of the genome tracks' axis and gene lane |
depictio config nextflow --install     # once per machine
nextflow run nf-core/nascent -r 2.3.0 -profile docker --outdir results
No depictio ingest, and no template named: the pipeline ingests its own
output directory when it finishes and resolves this template from its own
manifest. See Nextflow trigger. The
trigger passes no --var, so put a design table at results/input/design.tsv
before the run if the library ids do not carry their duration.
Reference
The template reads the featureCounts gene matrix, the strand coverage written
as bedGraph and bigWig, and the run parameters. The strand bedGraphs (4 to 10
million intervals each on a human genome) are never ingested whole: two recipes
stream them into 250 kb windows and per-library totals. The bigWigs are range-read
by the browser for the region in view. The BAMs, the dreg.bedGraph, the QC
reports and the transcript identification outputs are not read, and the template
has no MultiQC tab.
On the time axis, log2(1 + hours) keeps the first hour from taking a few pixels.
The baseline is the earliest time point, and the later ones are split into
Early, Mid and Late by rank. An expressed gene has at least 10 reads in at
least half of the libraries. A library keeps one colour on every tab, a ramp along
the time course (the later, the darker).
Self-adapting layout
The dashboard adapts to whatever the run actually produced: components bound to pruned or unparsed data collections are hidden, tabs left with no real visualizations are dropped entirely, and the remaining components are re-packed so there are no empty rows. A run without the strand coverage drops Genome signal and Signal dynamics.
Template variables
Variables you provide when running the template: DATA_ROOT is the results directory given to depictio ingest, the others are set with --var NAME=value:
| Variable | Required | Description |
|---|---|---|
DATA_ROOT |
✓ | Root directory of one nascent run (quantification/, coverage_graphs/, pipeline_info/). |
METADATA_FILE |
— | Optional design table (TSV): library id in a column named sample (or the first column), the hours of each library in TIME_COL, a time_point label, and any factor. Enables the group filter and colours. |
METADATA_ID_COL |
— | Design table library-id column. Auto-detected as the first column; defaults to 'sample'. |
GROUP_COL |
— | Design column the dashboards group, colour and filter libraries by. Auto-detected as the first factor column of METADATA_FILE. |
TIME_COL |
— | Design column holding each library's time in hours. Without it (or without a design table) the time is read off a library id ending in a duration (30min, 2h, 1d). |
GENOME |
— | UCSC name of the assembly the run aligned to (--genome; hg38, mm10): the axis and gene lane of the genome tracks. |
TRACKS_URI |
— | s3:// or https:// folder holding the run's results (the folder DATA_ROOT mirrors), to read the genome-browser bigWigs in place instead of uploading them from DATA_ROOT. |
Auto-detected (set from the run's metadata / params.json; the route flags drive Conditional routes below): GROUP_COL_DISPLAY, ANNOTATION_COLS
Data collections
20 data collections — 10 required 10 optional · 3 direct 17 derived.
Origin tells you whether a collection is real pipeline data or a reshape of it: direct = a pipeline output (scanned, or a recipe that reads raw files); derived = a recipe that reshapes one or more direct collections into the layout a visualization needs (no new measurement). Reads shows what produces it: a recipe .py transform, or a raw file scanned off disk. (A direct collection can still have a recipe — one that merely parses/cleans the raw file; derived means the recipe reshapes another collection.)
| Tag | Origin | Type | Reads | Status |
|---|---|---|---|---|
metadata |
direct | Table | file |
optional |
subread_gene_counts |
direct | Table | recipe |
required |
subread_library_summary |
derived | Table | recipe |
required |
subread_correlation |
derived | Table | recipe |
required |
bedgraph_strand_index |
direct | Table | file |
optional |
bedtools_strand_windows |
derived | Table | recipe |
optional |
bedtools_strand_summary |
derived | Table | recipe |
optional |
samples |
derived | Table | recipe |
required |
bedtools_strand_bins |
derived | Table | recipe |
optional |
gene_dynamics |
derived | Table | recipe |
required |
gene_trajectories |
derived | Table | recipe |
required |
top_gene_trajectories |
derived | Table | recipe |
required |
top_gene_heatmap |
derived | Table | recipe |
required |
sample_similarity |
derived | Table | recipe |
required |
sample_drift |
derived | Table | recipe |
required |
signal_window_dynamics |
derived | Table | recipe |
optional |
signal_window_series |
derived | Table | recipe |
optional |
signal_window_heatmap |
derived | Table | recipe |
optional |
chromosome_signal |
derived | Table | recipe |
optional |
tracks |
derived | genomic_tracks | recipe |
optional |
Conditional routes
Rows are data collections; columns are the variables you set or params.json flags auto-detected from the run. Each filled cell is the effect of setting that variable; an empty cell means that variable leaves the collection unchanged. (18 collections are unaffected by any variable — present on every run.)
+ included− removed⇄ repointed
| Data collection | METADATA_FILE |
TRACKS_URI |
|---|---|---|
metadata |
+ | |
tracks |
⇄ |
Cross-DC links
20 links — selecting a value in the source collection filters the target. The join column is shown after the source.
| Source · column | Target | Filters | |
|---|---|---|---|
samples · sample |
→ | subread_gene_counts |
Filter the gene counts by the libraries picked in the left panel |
samples · sample |
→ | subread_library_summary |
Filter the library summary by the libraries picked in the left panel |
samples · sample |
→ | subread_correlation |
Filter the rows of the library correlation matrix by the libraries picked |
samples · sample |
→ | bedtools_strand_bins |
Filter the binned strand coverage by the libraries picked |
samples · sample |
→ | bedtools_strand_summary |
Filter the strand coverage totals by the libraries picked |
samples · sample |
→ | sample_similarity |
Filter the library PCA and correlations by the libraries picked |
samples · time_point |
→ | sample_drift |
Filter the correlation curves to the time points of the libraries picked |
samples · time_point |
→ | chromosome_signal |
Filter the chromosome shares to the time points of the libraries picked |
samples · time_point |
→ | gene_dynamics |
Narrow the gene calls to the genes peaking at the time points of the libraries picked |
samples · time_point |
→ | signal_window_dynamics |
Narrow the window calls to the windows peaking at the time points of the libraries picked |
gene_dynamics · gene_id |
→ | gene_trajectories |
Narrow the gene trajectories, and the response curves drawn from them, to the genes in scope |
gene_dynamics · gene_id |
→ | top_gene_trajectories |
Keep the top genes that are in scope |
gene_dynamics · gene_id |
→ | top_gene_heatmap |
Keep the heatmap rows of the genes in scope |
signal_window_dynamics · window_id |
→ | signal_window_series |
Narrow the window trend curves to the windows in scope |
signal_window_dynamics · window_id |
→ | signal_window_heatmap |
Keep the heatmap rows of the windows in scope |
bedtools_strand_bins · chromosome |
→ | chromosome_signal |
Narrow the per-chromosome shares to the chromosomes picked |
samples · sample |
→ | tracks |
Show the genome tracks of the libraries picked |
sample_similarity · sample |
→ | samples |
Narrow the sample hub to the libraries selected on the embedding |
subread_library_summary · sample |
→ | samples |
Narrow the sample hub to the libraries selected on the library summary |
tracks · sample |
→ | samples |
Narrow the sample hub to the libraries picked in the genome browser |
Recipes
Each recipe reshapes raw pipeline output into a tidy table. The name links to its source; Output lists the validated OUTPUT_SCHEMA columns.
| Recipe | Transforms | Output |
|---|---|---|
bedtools/strand_bins.py |
Strand-split coverage in 250 kb windows, one row per library per window. | sample, chromosome, start, end, position, plus_rpm, minus_rpm, signal_rpm, log2_signal, plus_share_pct |
bedtools/strand_summary.py |
Per-library totals of the strand-split coverage bedGraphs. | sample, plus_read_bases, minus_read_bases, total_read_bases, covered_mb, max_depth, plus_share_pct, mito_pct, off_main_pct, hotspot_share_pct |
nf-core/nascent/chromosome_signal.py |
Each chromosome's share of the nascent signal, per time point. | chromosome, time_point, time_h, time_order, time_axis, phase, share_pct, plus_share_pct, contig_order, log2_ratio, abs_log2_ratio |
nf-core/nascent/gene_dynamics.py |
Per gene: how far its nascent transcription moves over the time course, and when. | gene_id, chromosome, start, end, strand, length, baseline_log2_cpm, mean_log2_cpm, dynamic_range, peak_log2fc, abs_peak_log2fc, last_log2fc, peak_time_point, peak_time_h, peak_phase, n_changed, direction, response, rank |
nf-core/nascent/gene_trajectories.py |
Per gene and time point: nascent transcription and its change from the baseline. | gene_id, time_point, time_h, time_order, time_axis, phase, log2_cpm, log2fc, direction, response |
nf-core/nascent/sample_drift.py |
How far transcription has moved at each time point, as two curves over time. | comparison, time_point, time_h, time_order, time_axis, correlation |
nf-core/nascent/sample_similarity.py |
Where each library sits among the others: a PCA and its correlation along the time course. | sample, time_point, time_h, time_order, time_axis, phase, pc1, pc2, pc3, pc1_variance, pc2_variance, pc3_variance, corr_to_baseline, corr_to_previous |
nf-core/nascent/samples.py |
The nf-core/nascent sample hub: one row per library, its time point and its QC. | sample, time_point, time_h, time_order, time_axis, phase, assigned_reads, genes_detected, genes_detected_pct, top100_share_pct, total_read_bases, plus_share_pct, mito_pct, off_main_pct, hotspot_share_pct, strand_skew_pct |
nf-core/nascent/signal_window_dynamics.py |
Per 250 kb window: how far its nascent signal moves over the time course, and when. | window_id, chromosome, start, end, position, mean_rpm, baseline_log2_signal, dynamic_range, peak_log2fc, abs_peak_log2fc, last_log2fc, peak_time_point, peak_time_h, peak_phase, n_changed, trend, rank |
nf-core/nascent/signal_window_heatmap.py |
The windows that change most, as a window x time point matrix for a heatmap. | window_id, trend |
nf-core/nascent/signal_window_series.py |
Each compared window's log2 fold change at every time point, with its trend. | window_id, chromosome, trend, time_point, time_h, time_order, time_axis, phase, log2fc |
nf-core/nascent/strand_bins.py |
The binned strand windows with their libraries in time order. | sample, chromosome, start, end, position, plus_rpm, minus_rpm, signal_rpm, log2_signal, plus_share_pct |
nf-core/nascent/top_gene_heatmap.py |
The most dynamic genes as a gene x time point matrix, for a heatmap. | gene_id, response |
nf-core/nascent/top_gene_trajectories.py |
The trajectories of the genes that move most, one curve per gene. | gene_id, time_point, time_h, time_order, time_axis, log2_cpm, log2fc, response, rank |
nf-core/nascent/tracks.py |
Genome-browser track manifest: one row per strand-coverage bigWig the run published. | track_id, sample, time_point, time_order, format, uri, name, category, order |
subread/correlation.py |
Library correlation matrix over the features a featureCounts run detects. | sample |
subread/gene_counts.py |
featureCounts count matrix as a long table, one row per feature per library. | gene_id, chromosome, start, end, strand, length, sample, counts, cpm, log2_cpm |
subread/library_summary.py |
Per-library depth and complexity from a featureCounts count matrix. | sample, assigned_reads, genes_detected, genes_detected_pct, top100_share_pct, median_log2_cpm |
Dashboard tabs
One dashboard: the Overview, then five child tabs in two groups, read from the quality of each library to where along the genome transcription changes. Each tab below carries the same icon and colour the dashboard gives it, so the page and the app read alike.
| Group | Tabs |
|---|---|
| Data & QC | Library QC |
| Time course | Gene dynamics, Sample similarity, Genome signal, Signal dynamics |
Each child tab opens with a short intro and a strip of four cards, then at most three open sections; tables follow, collapsed. The Sample sheet is pinned, collapsed, to the bottom of every child tab.
Nascent transcription over a time course, from run-on reads to responding genes.
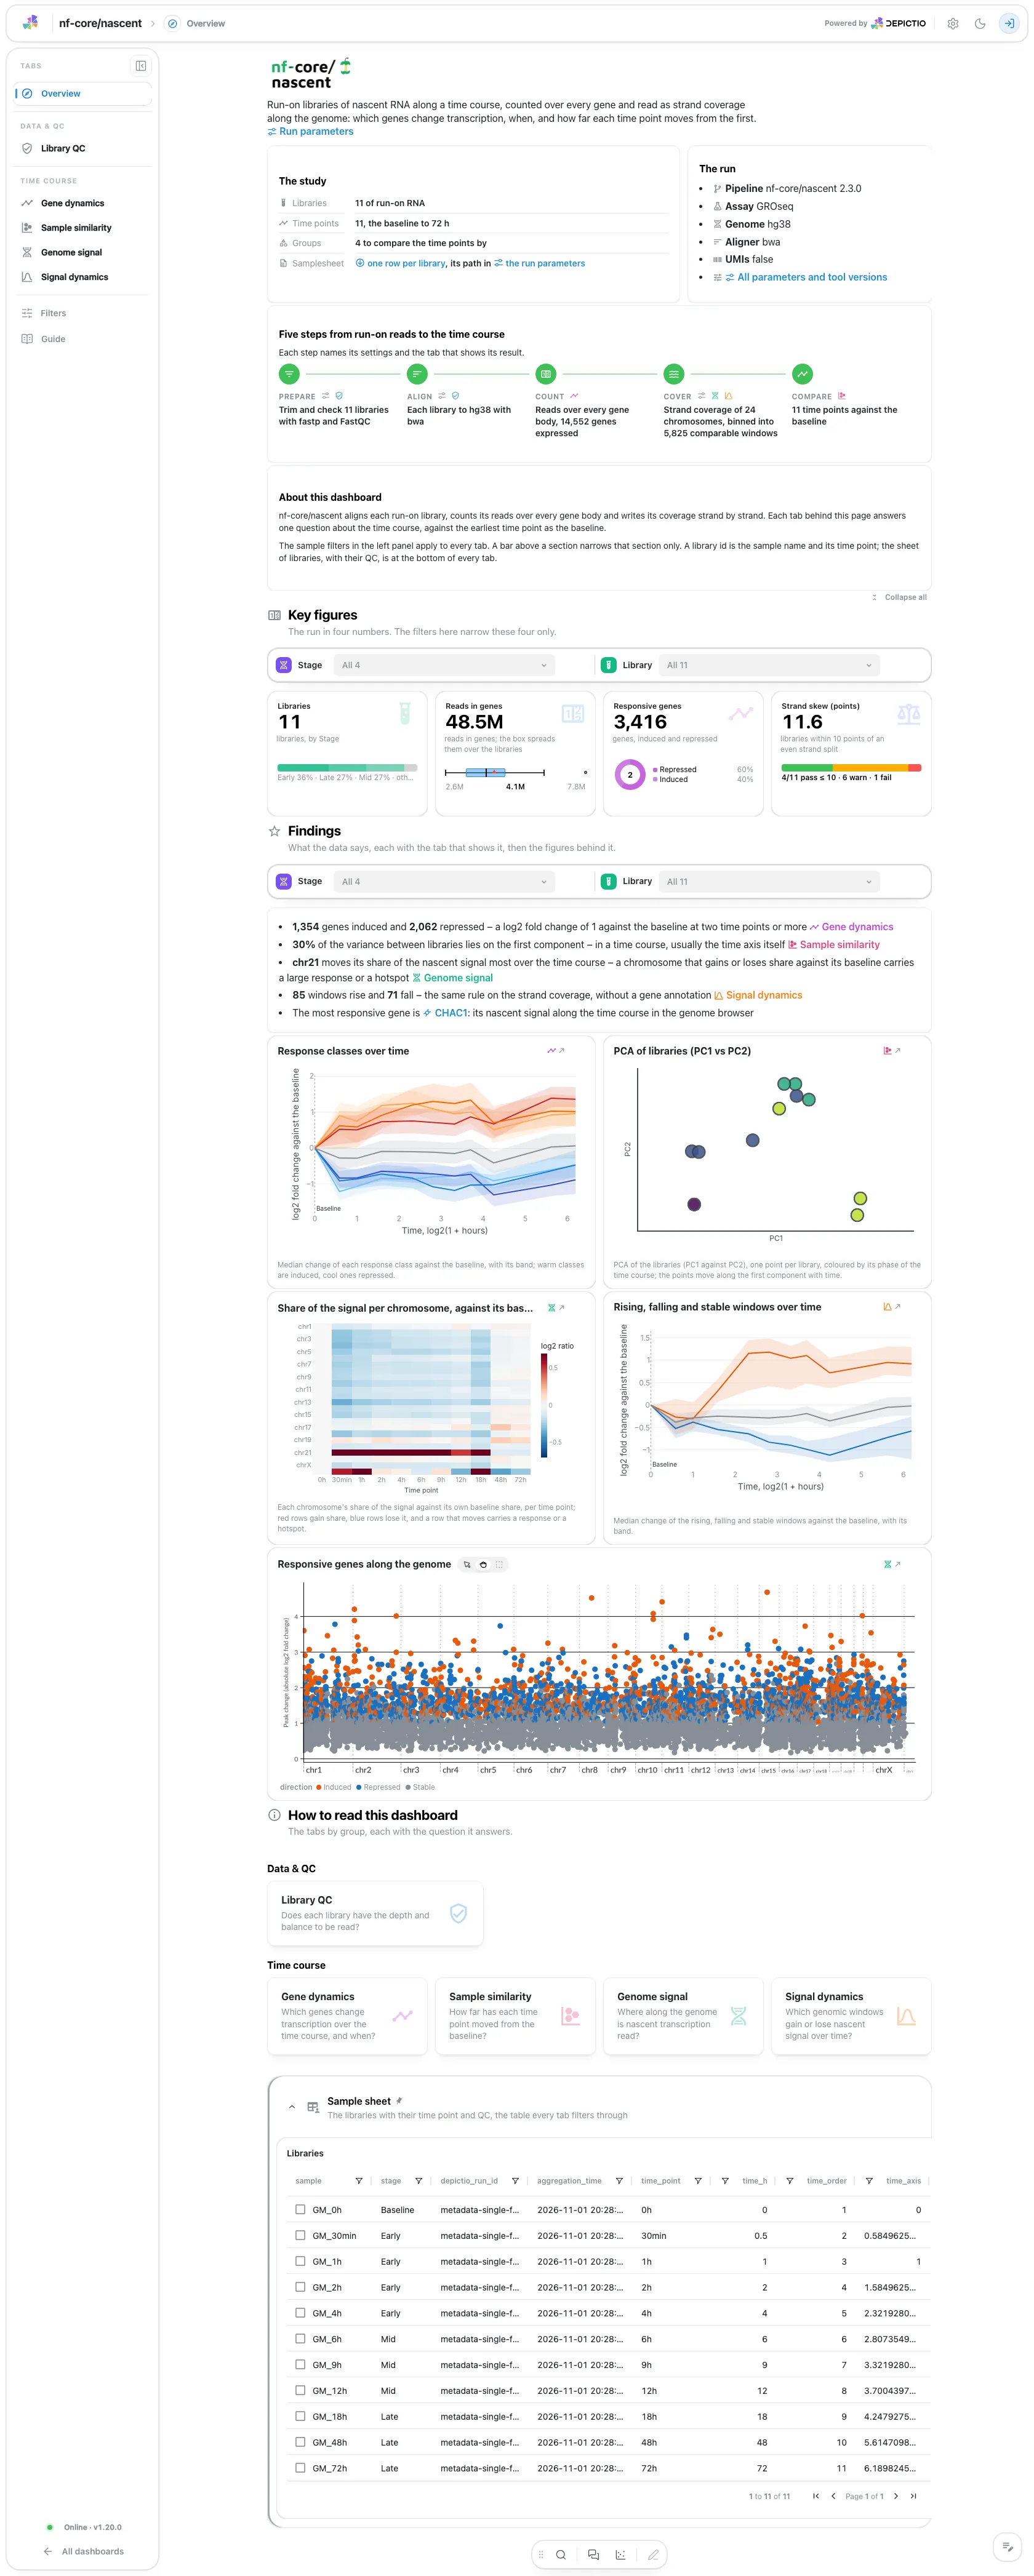
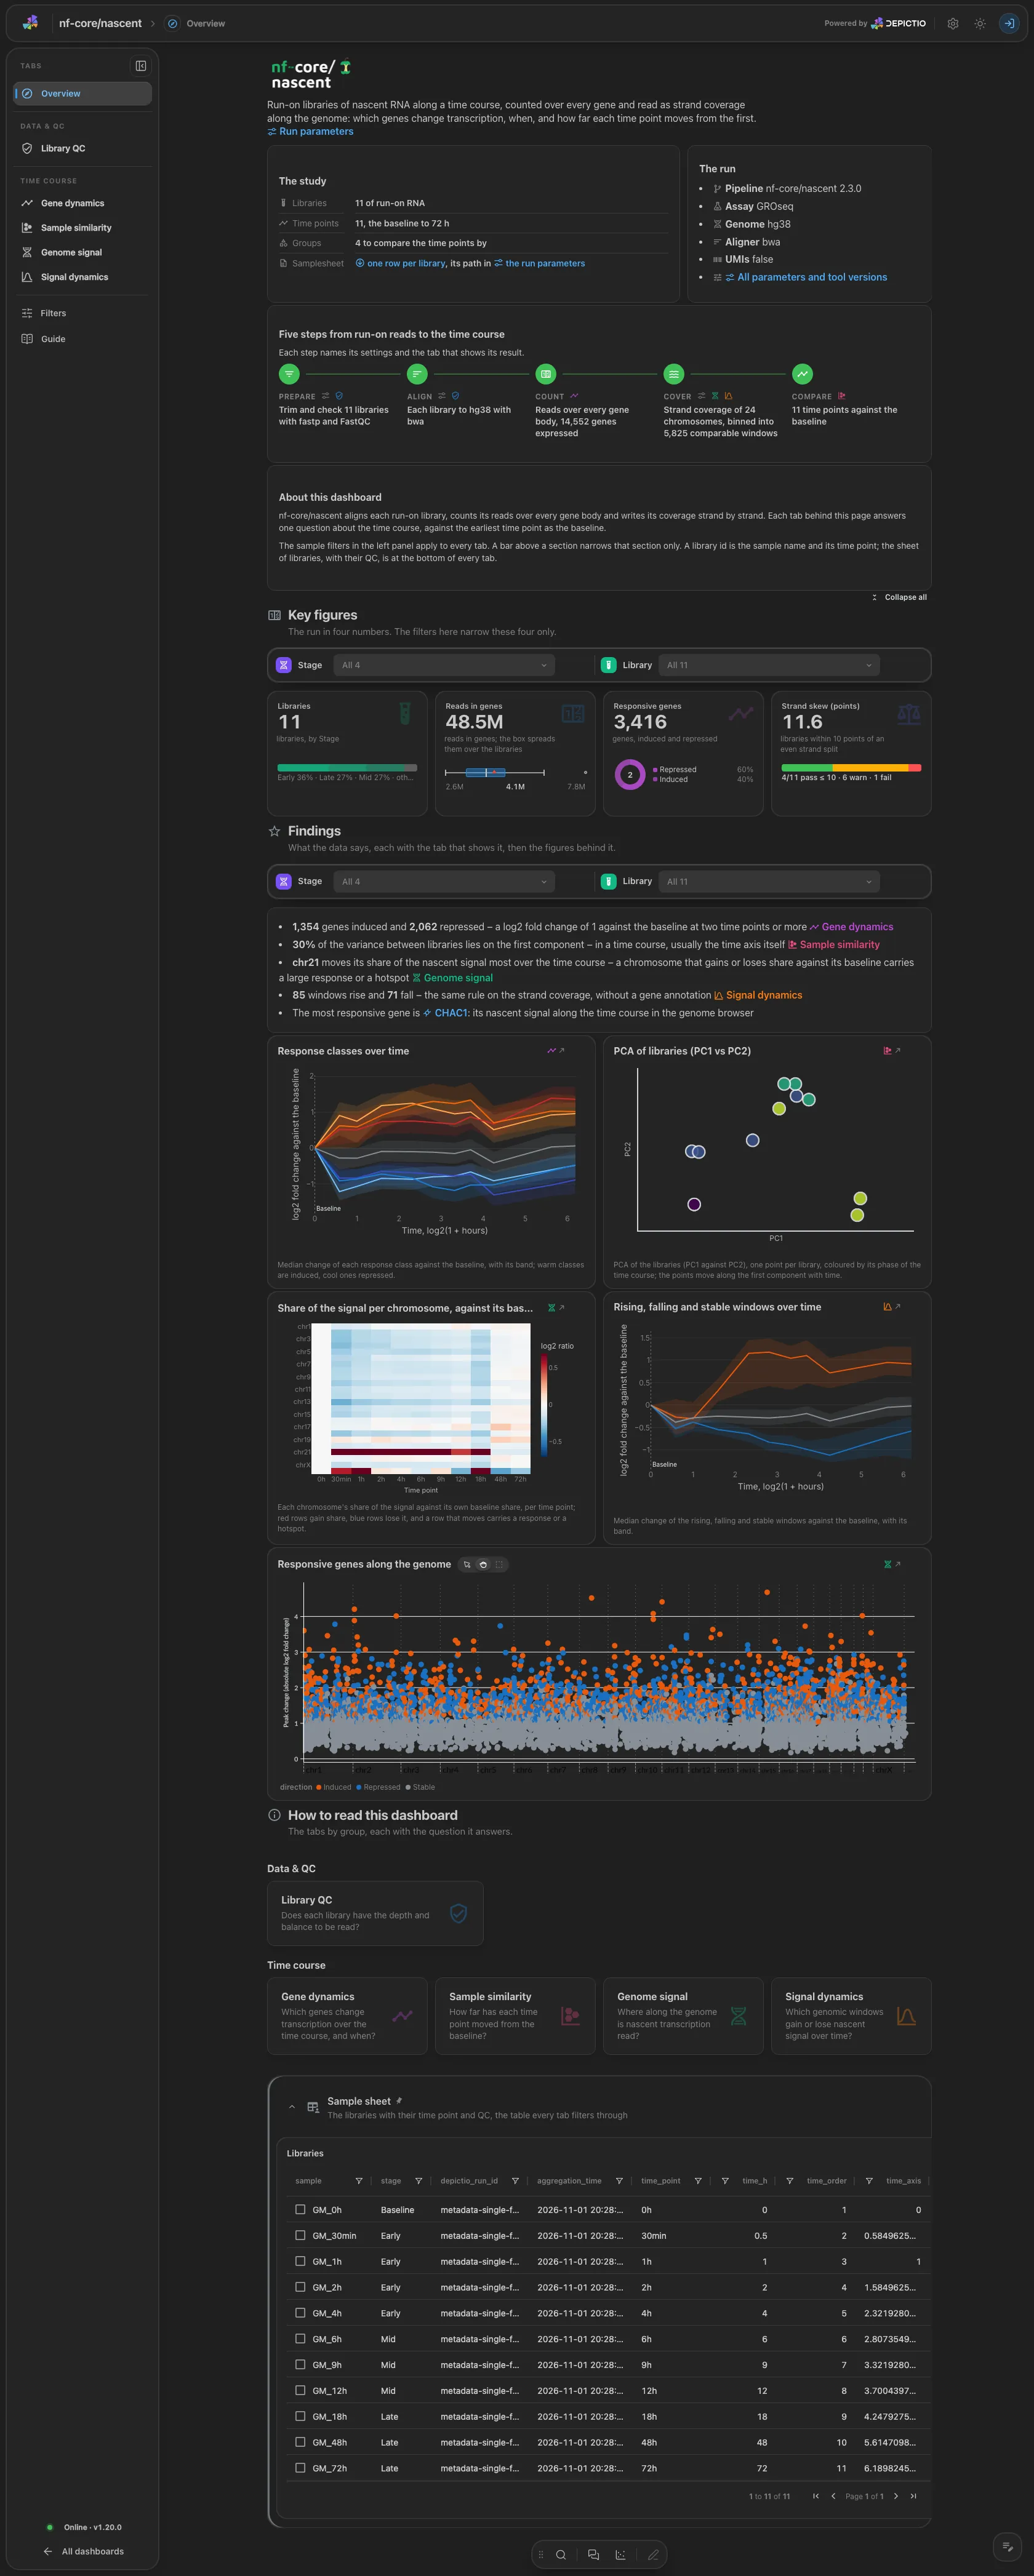
Hero, About and run cards and a five-step pipeline flow. Four key figures: the libraries, the reads in genes, the responsive genes and the strand skew (pass, warn and fail against 10 and 15 points). Four findings, each with a highlight, the third naming the chromosome whose share of the signal moves most against its baseline.
Data & QC · Does each library have the depth and balance to be read?
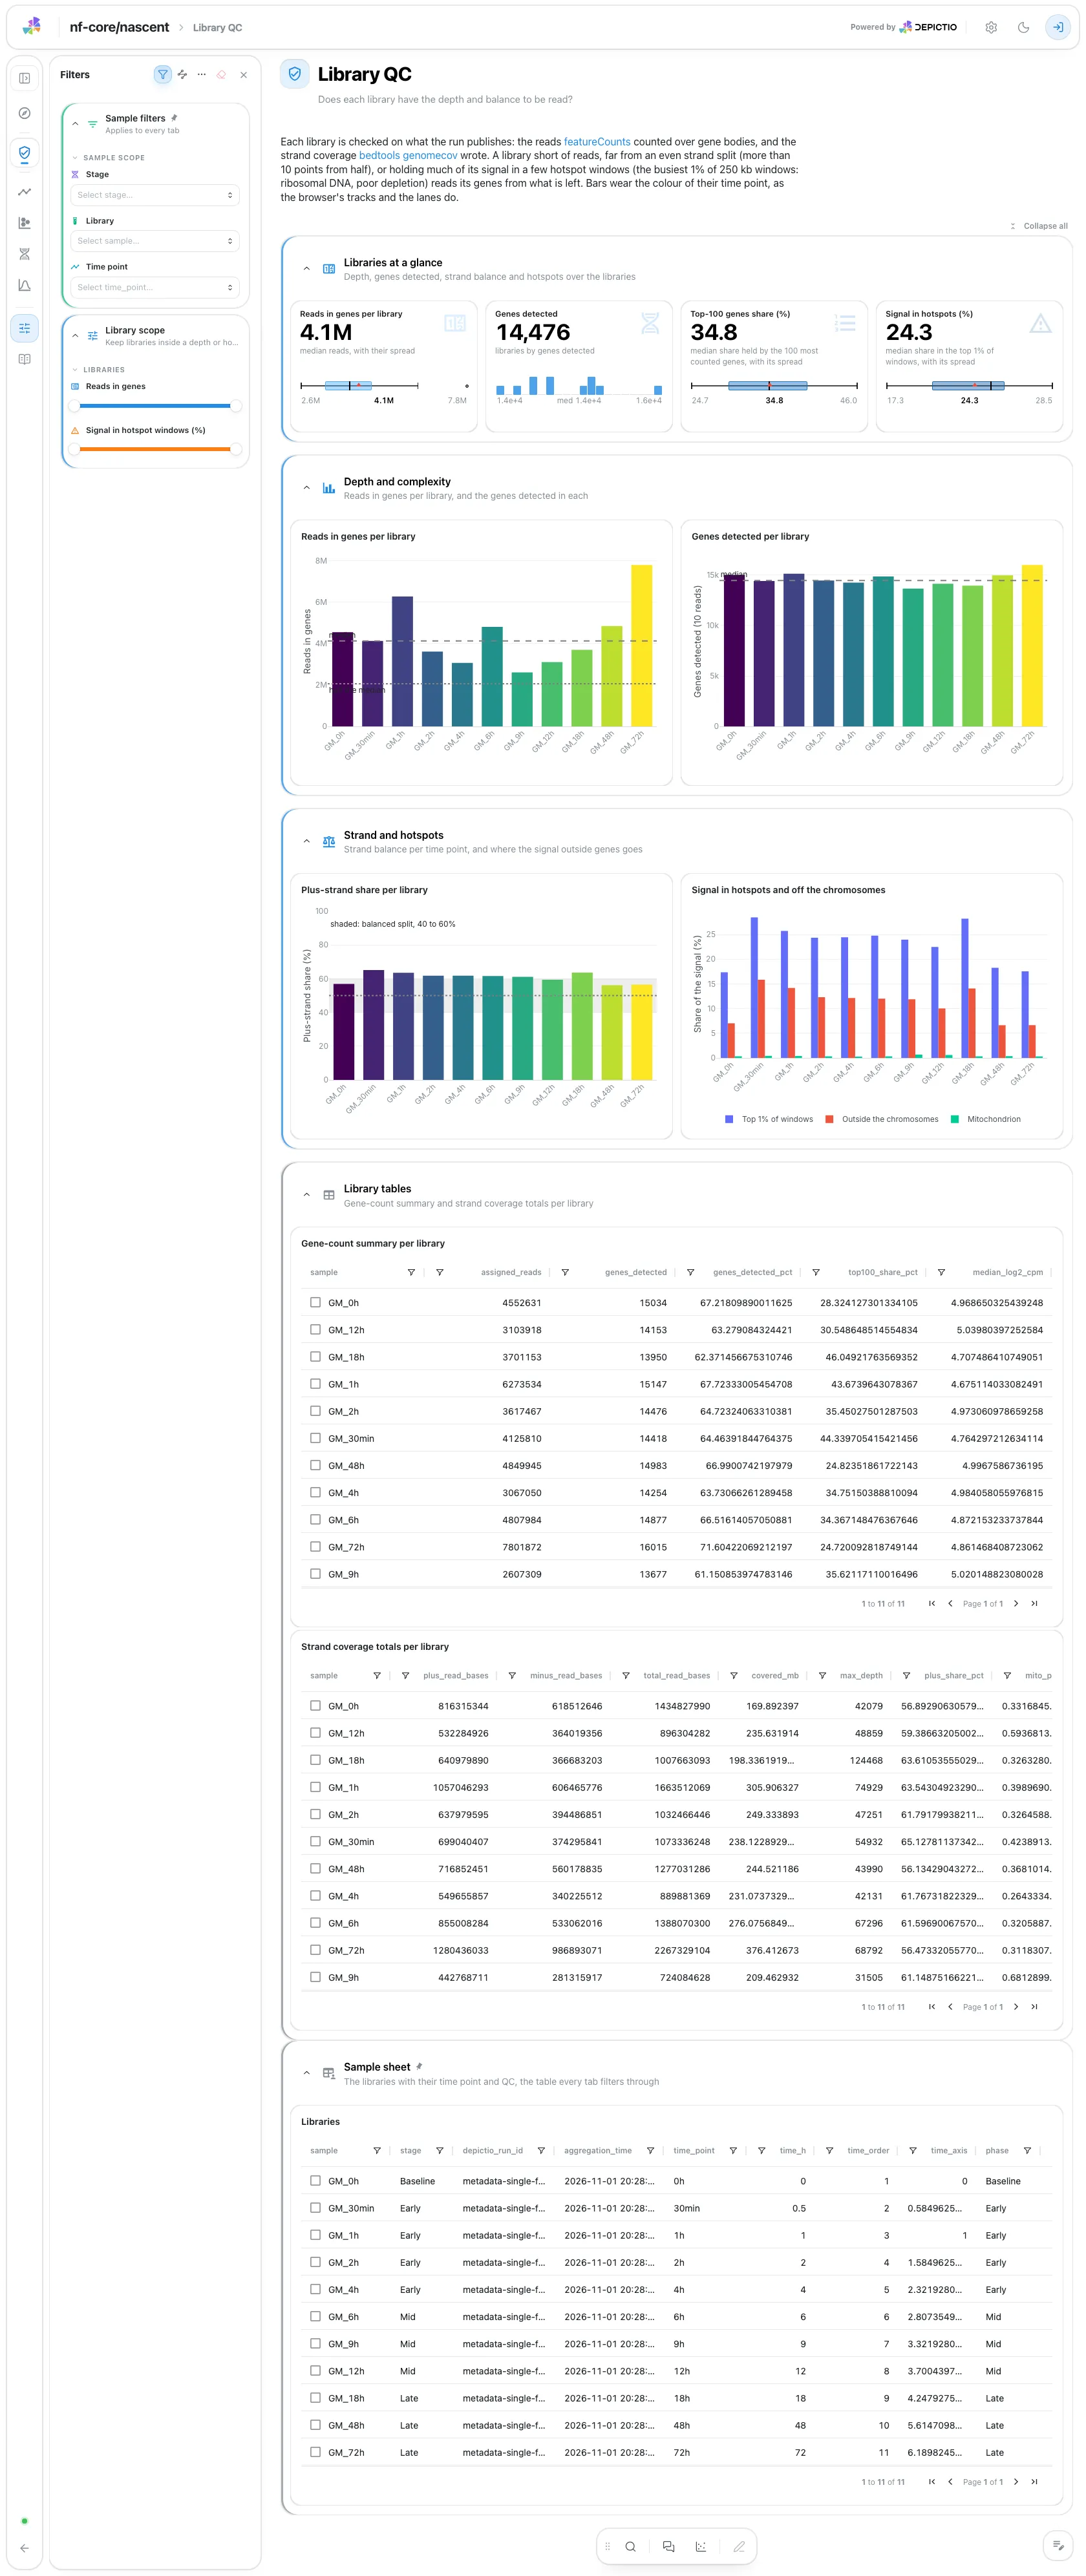
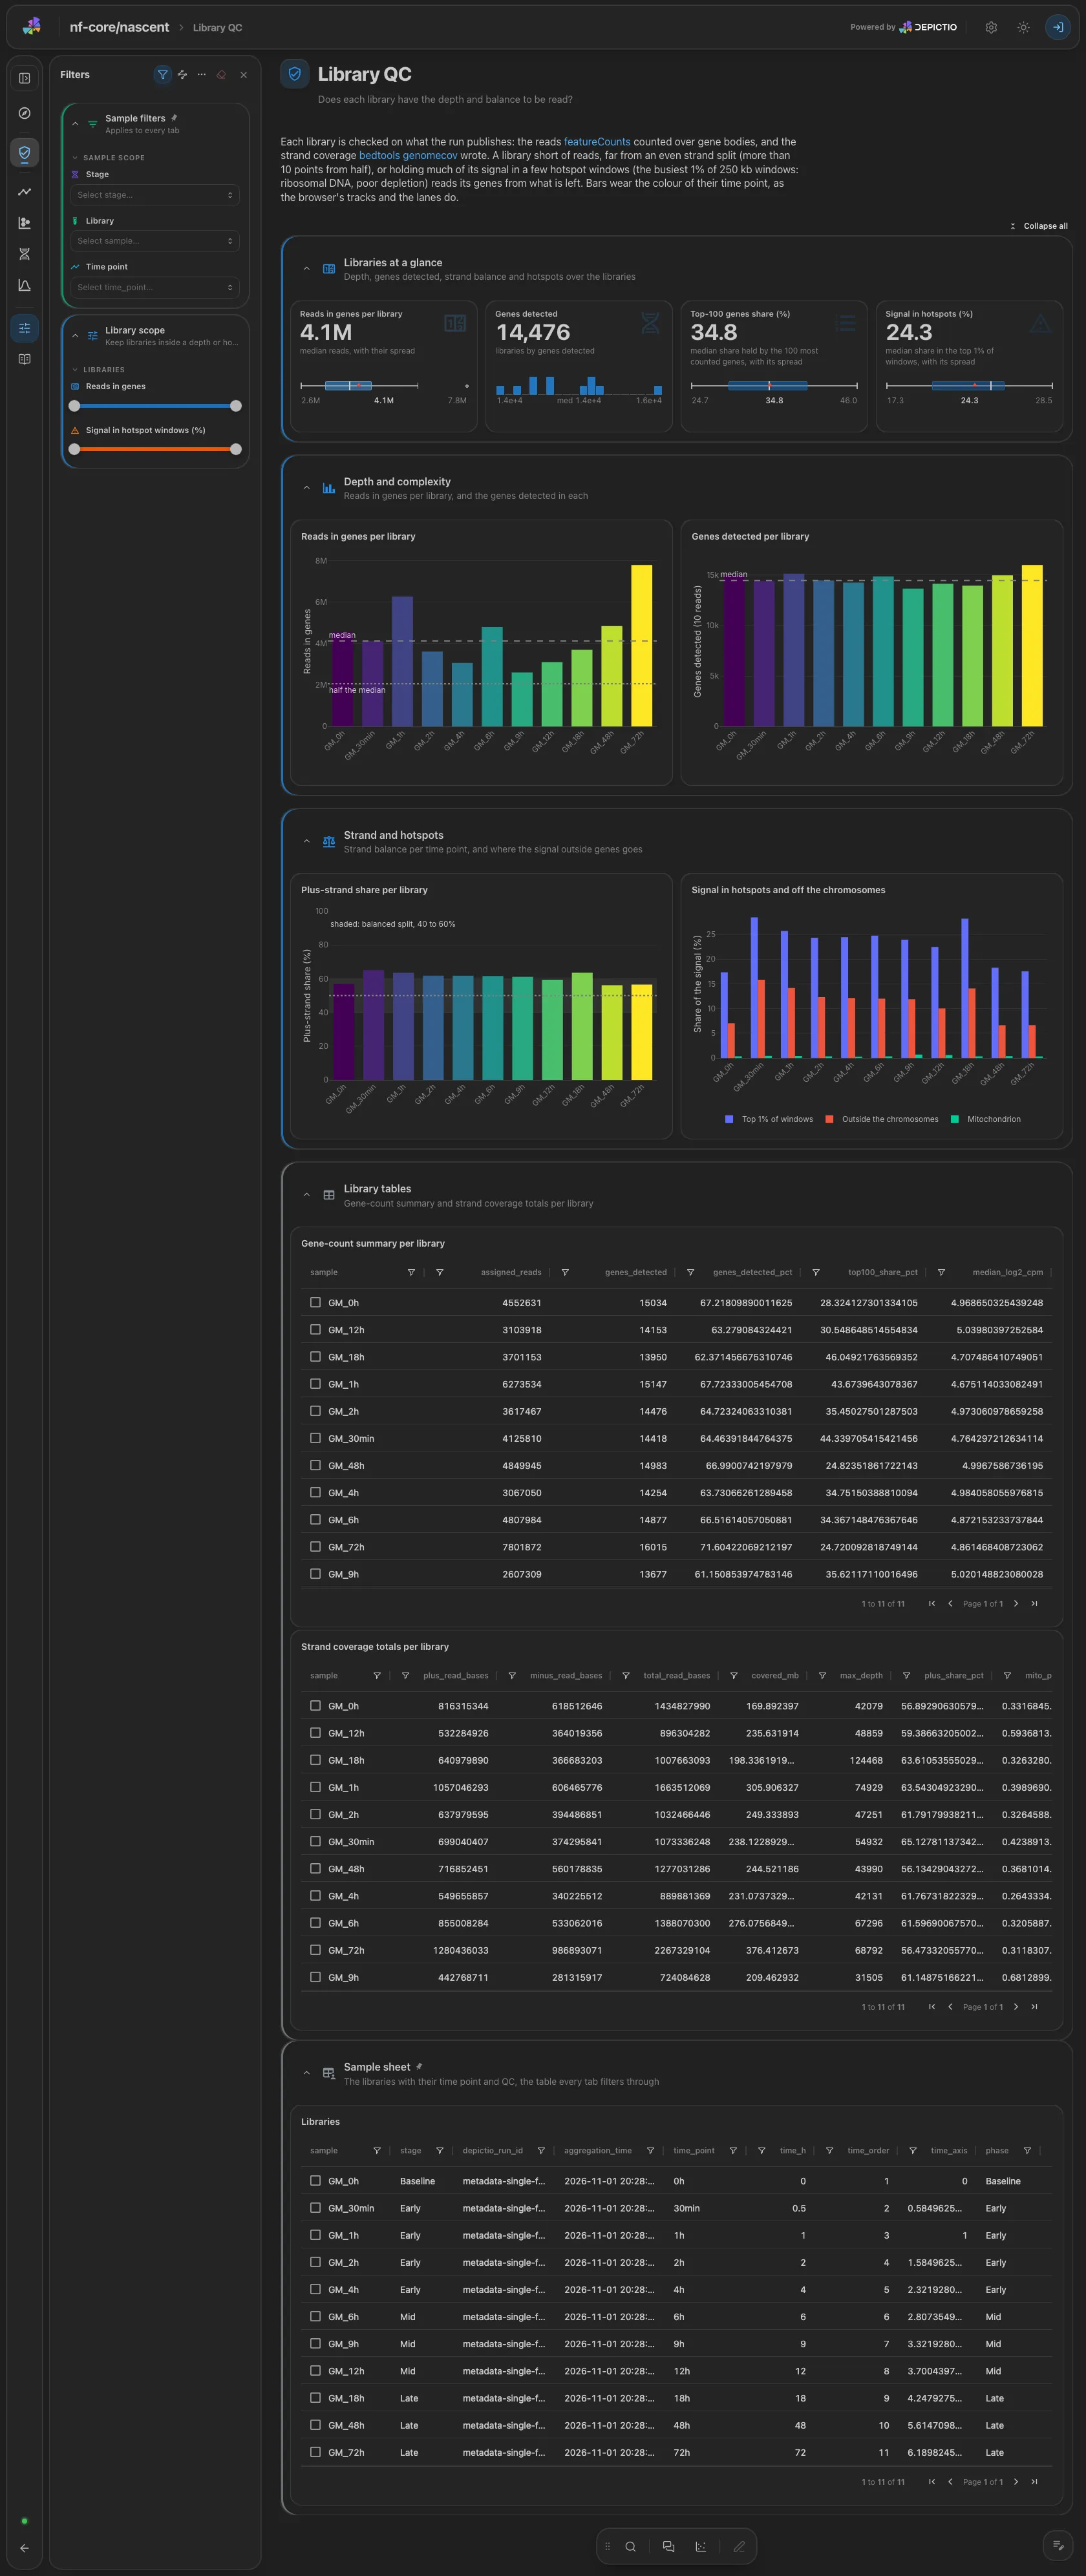
Reads in genes and genes detected per library in time order, against their median (a bar under half the typical depth is shallow; a click narrows the other tiles). The plus-strand share per library against the even split, with the balanced band (40 to 60%) shaded, and the hotspot, off-chromosome and mitochondrial shares. The gene-count and strand tables are collapsed.
Time course · Which genes change transcription over the time course, and when?
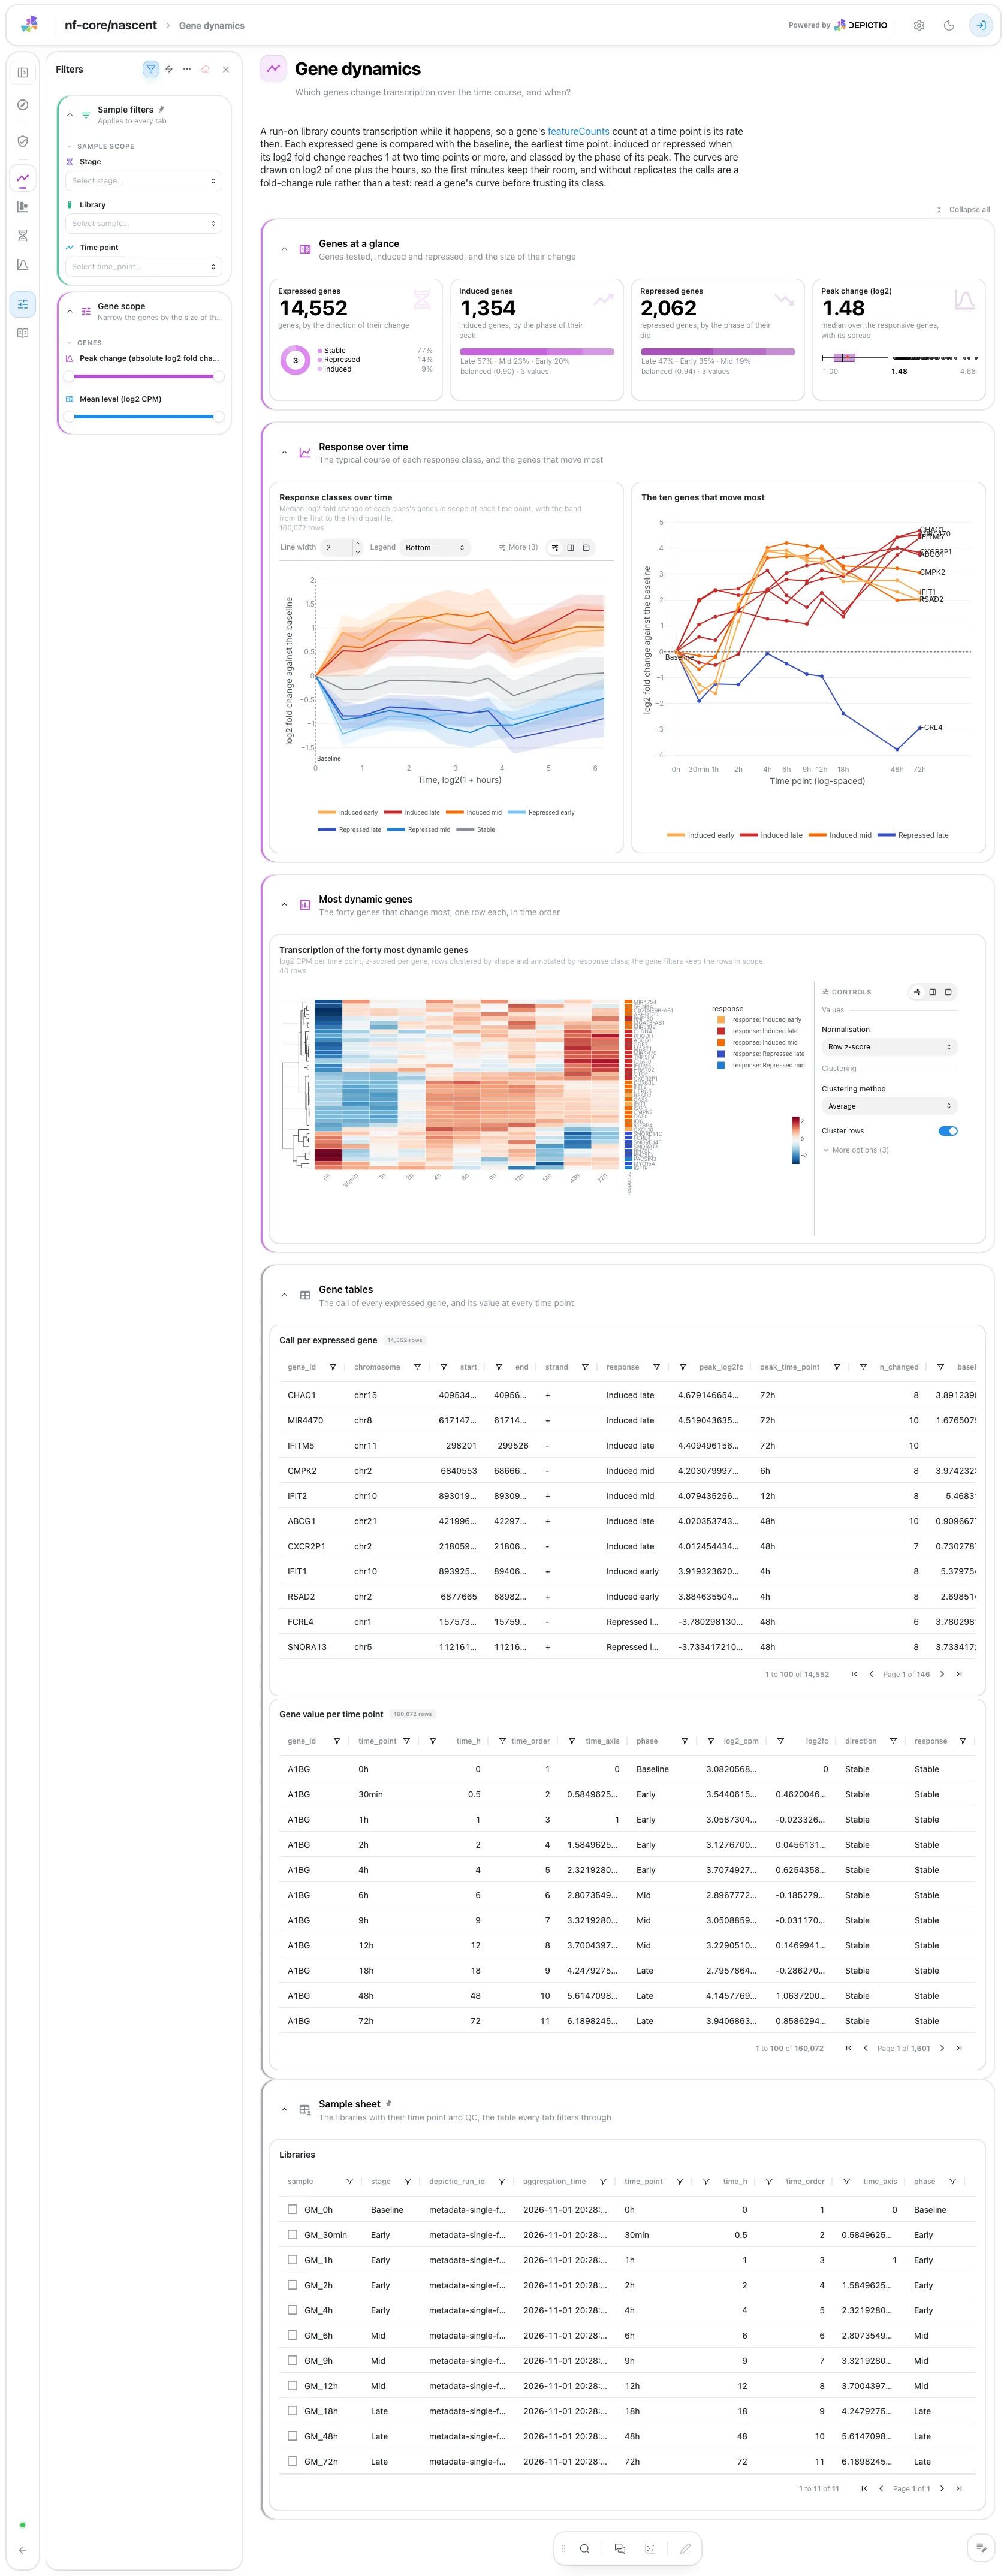
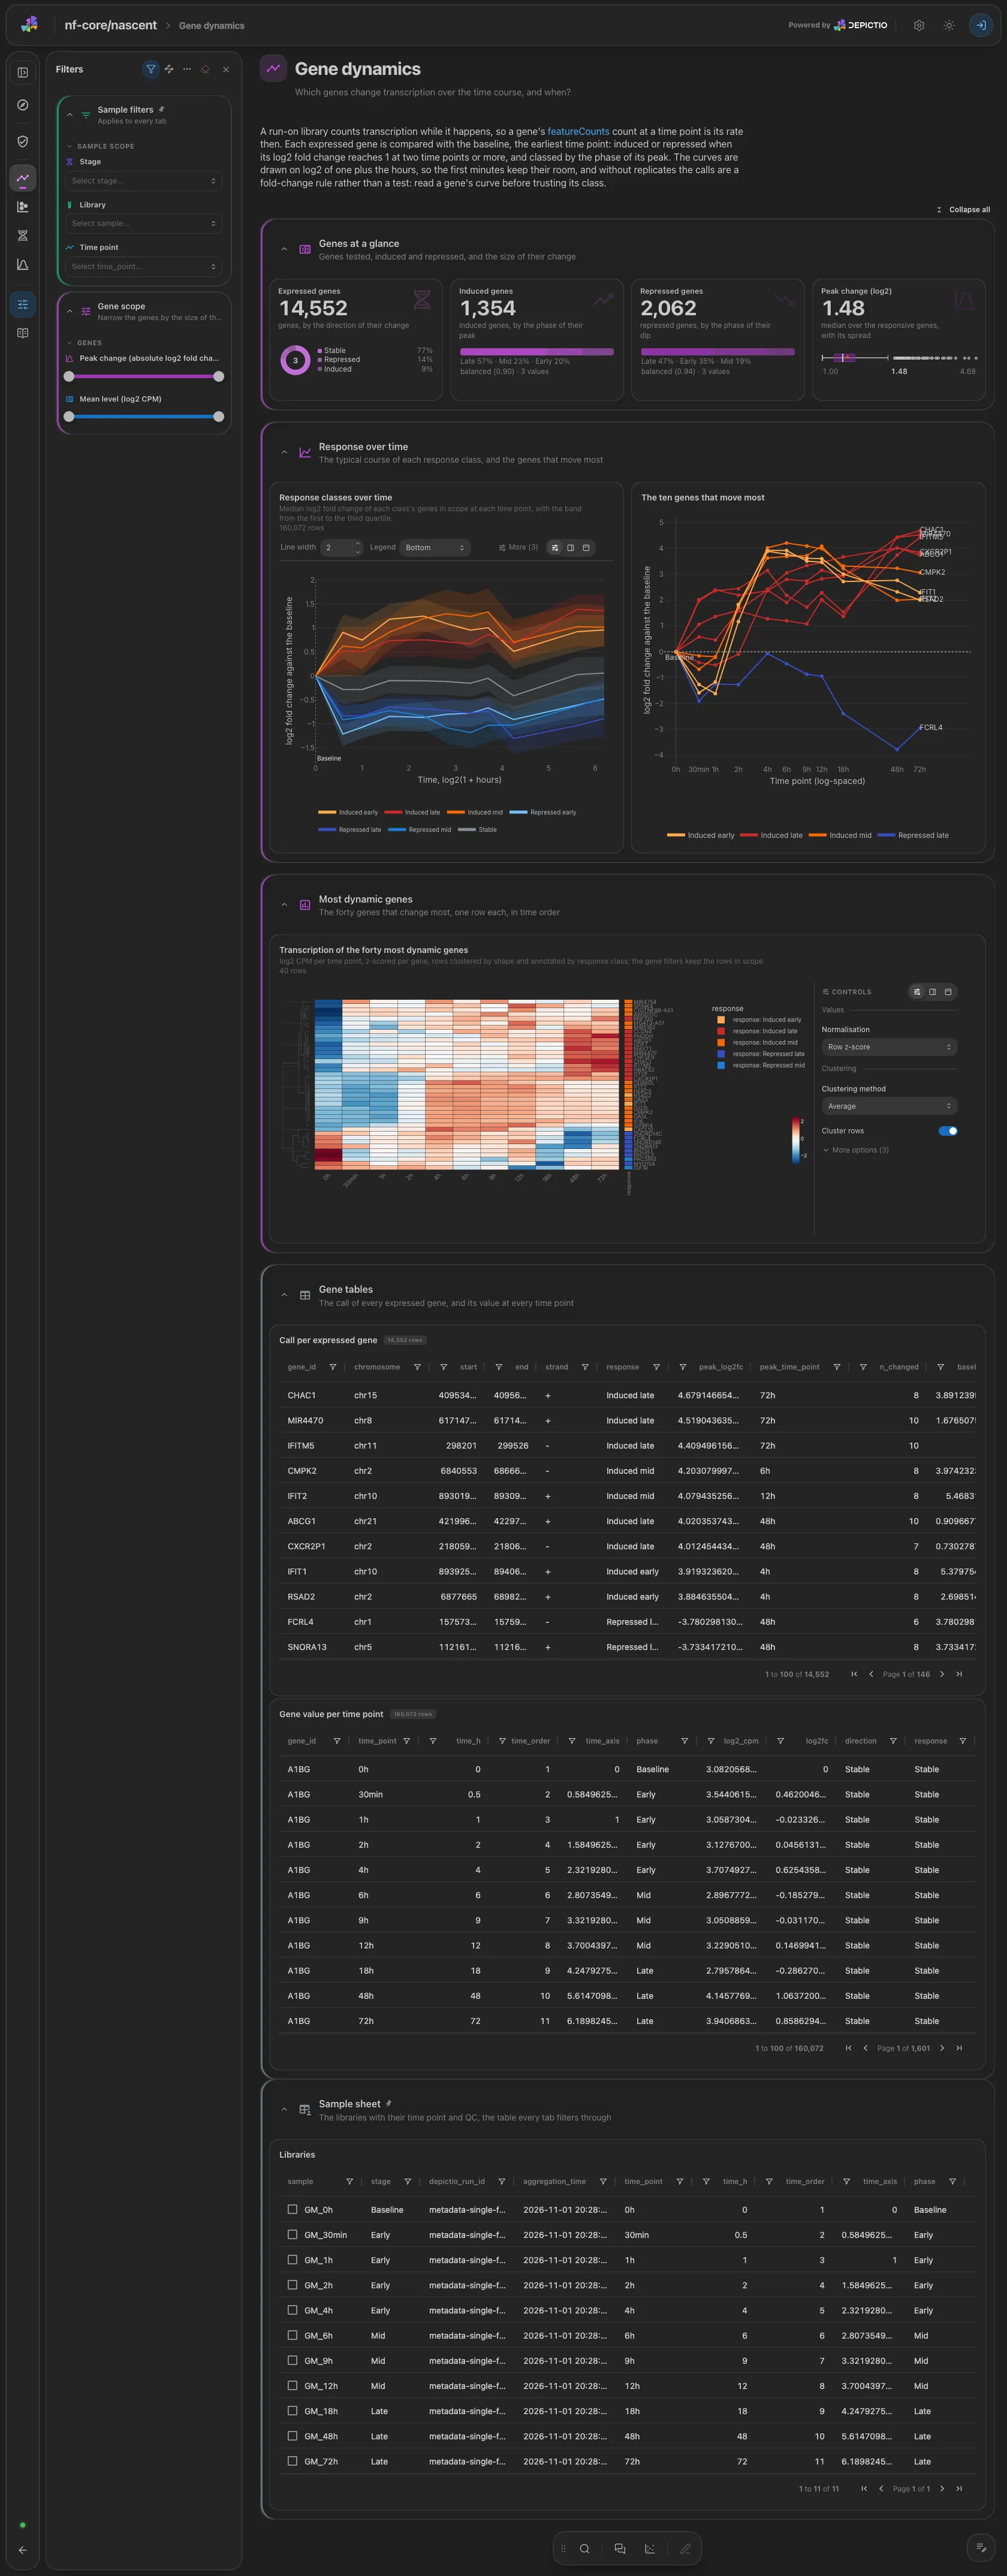
The median trajectory of each response class with its quartile band, the ten genes
that move most, and the forty most dynamic genes as a heatmap in time order. A
response class is a direction with the phase of the peak (Induced early to
Repressed late). The call per gene and the value per time point are collapsed.
Time course · How far has each time point moved from the baseline?
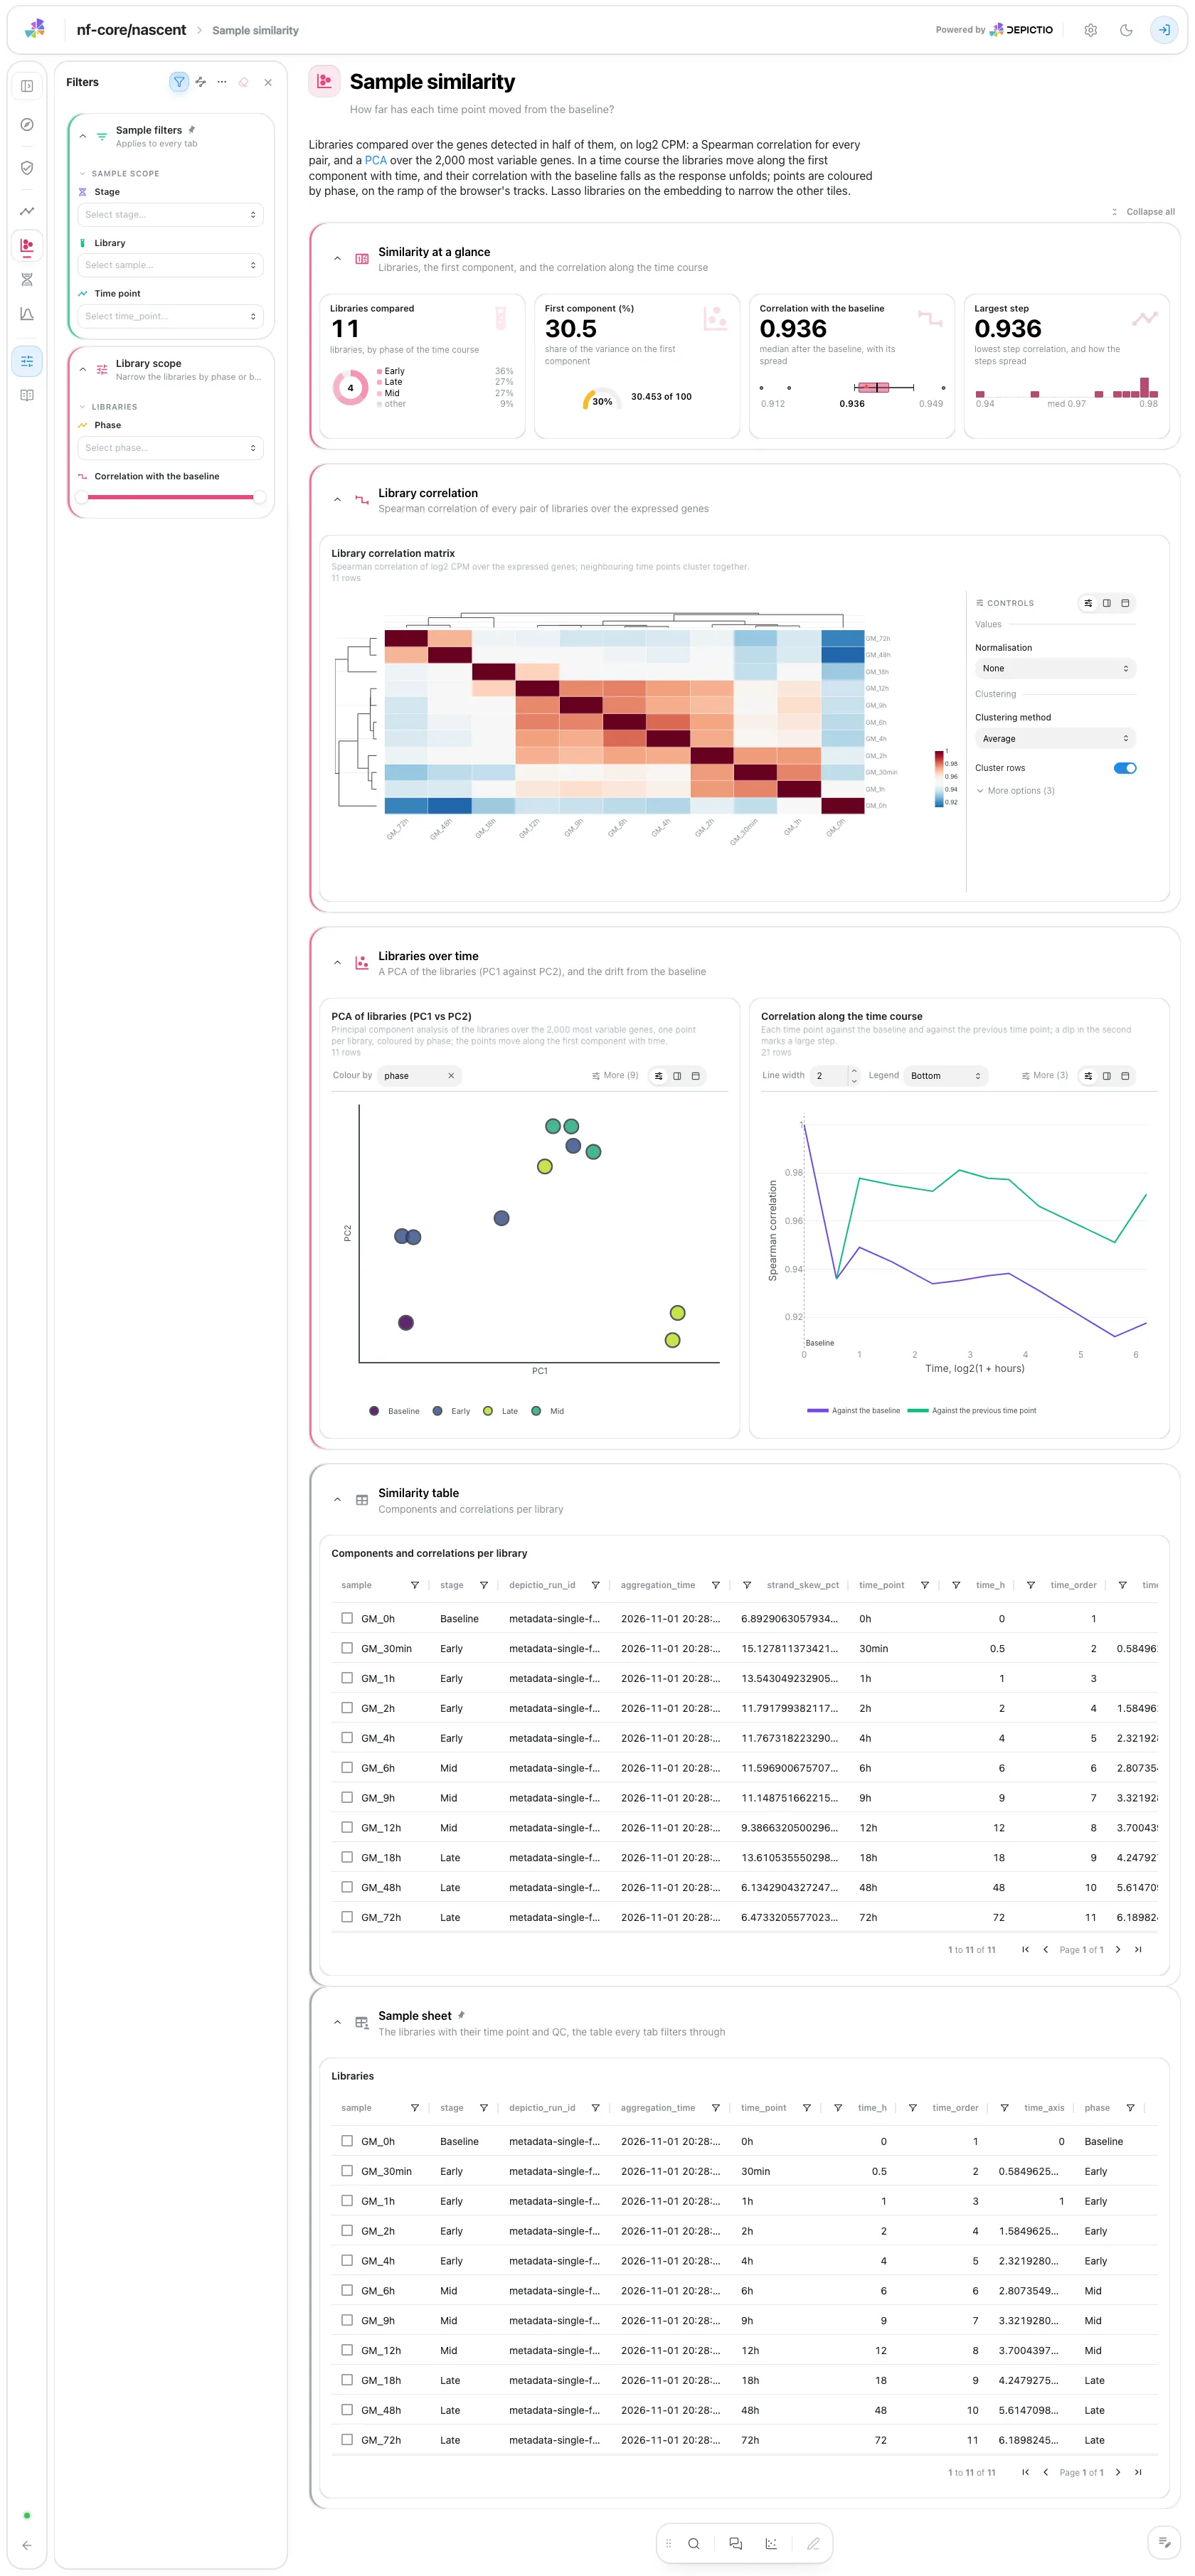
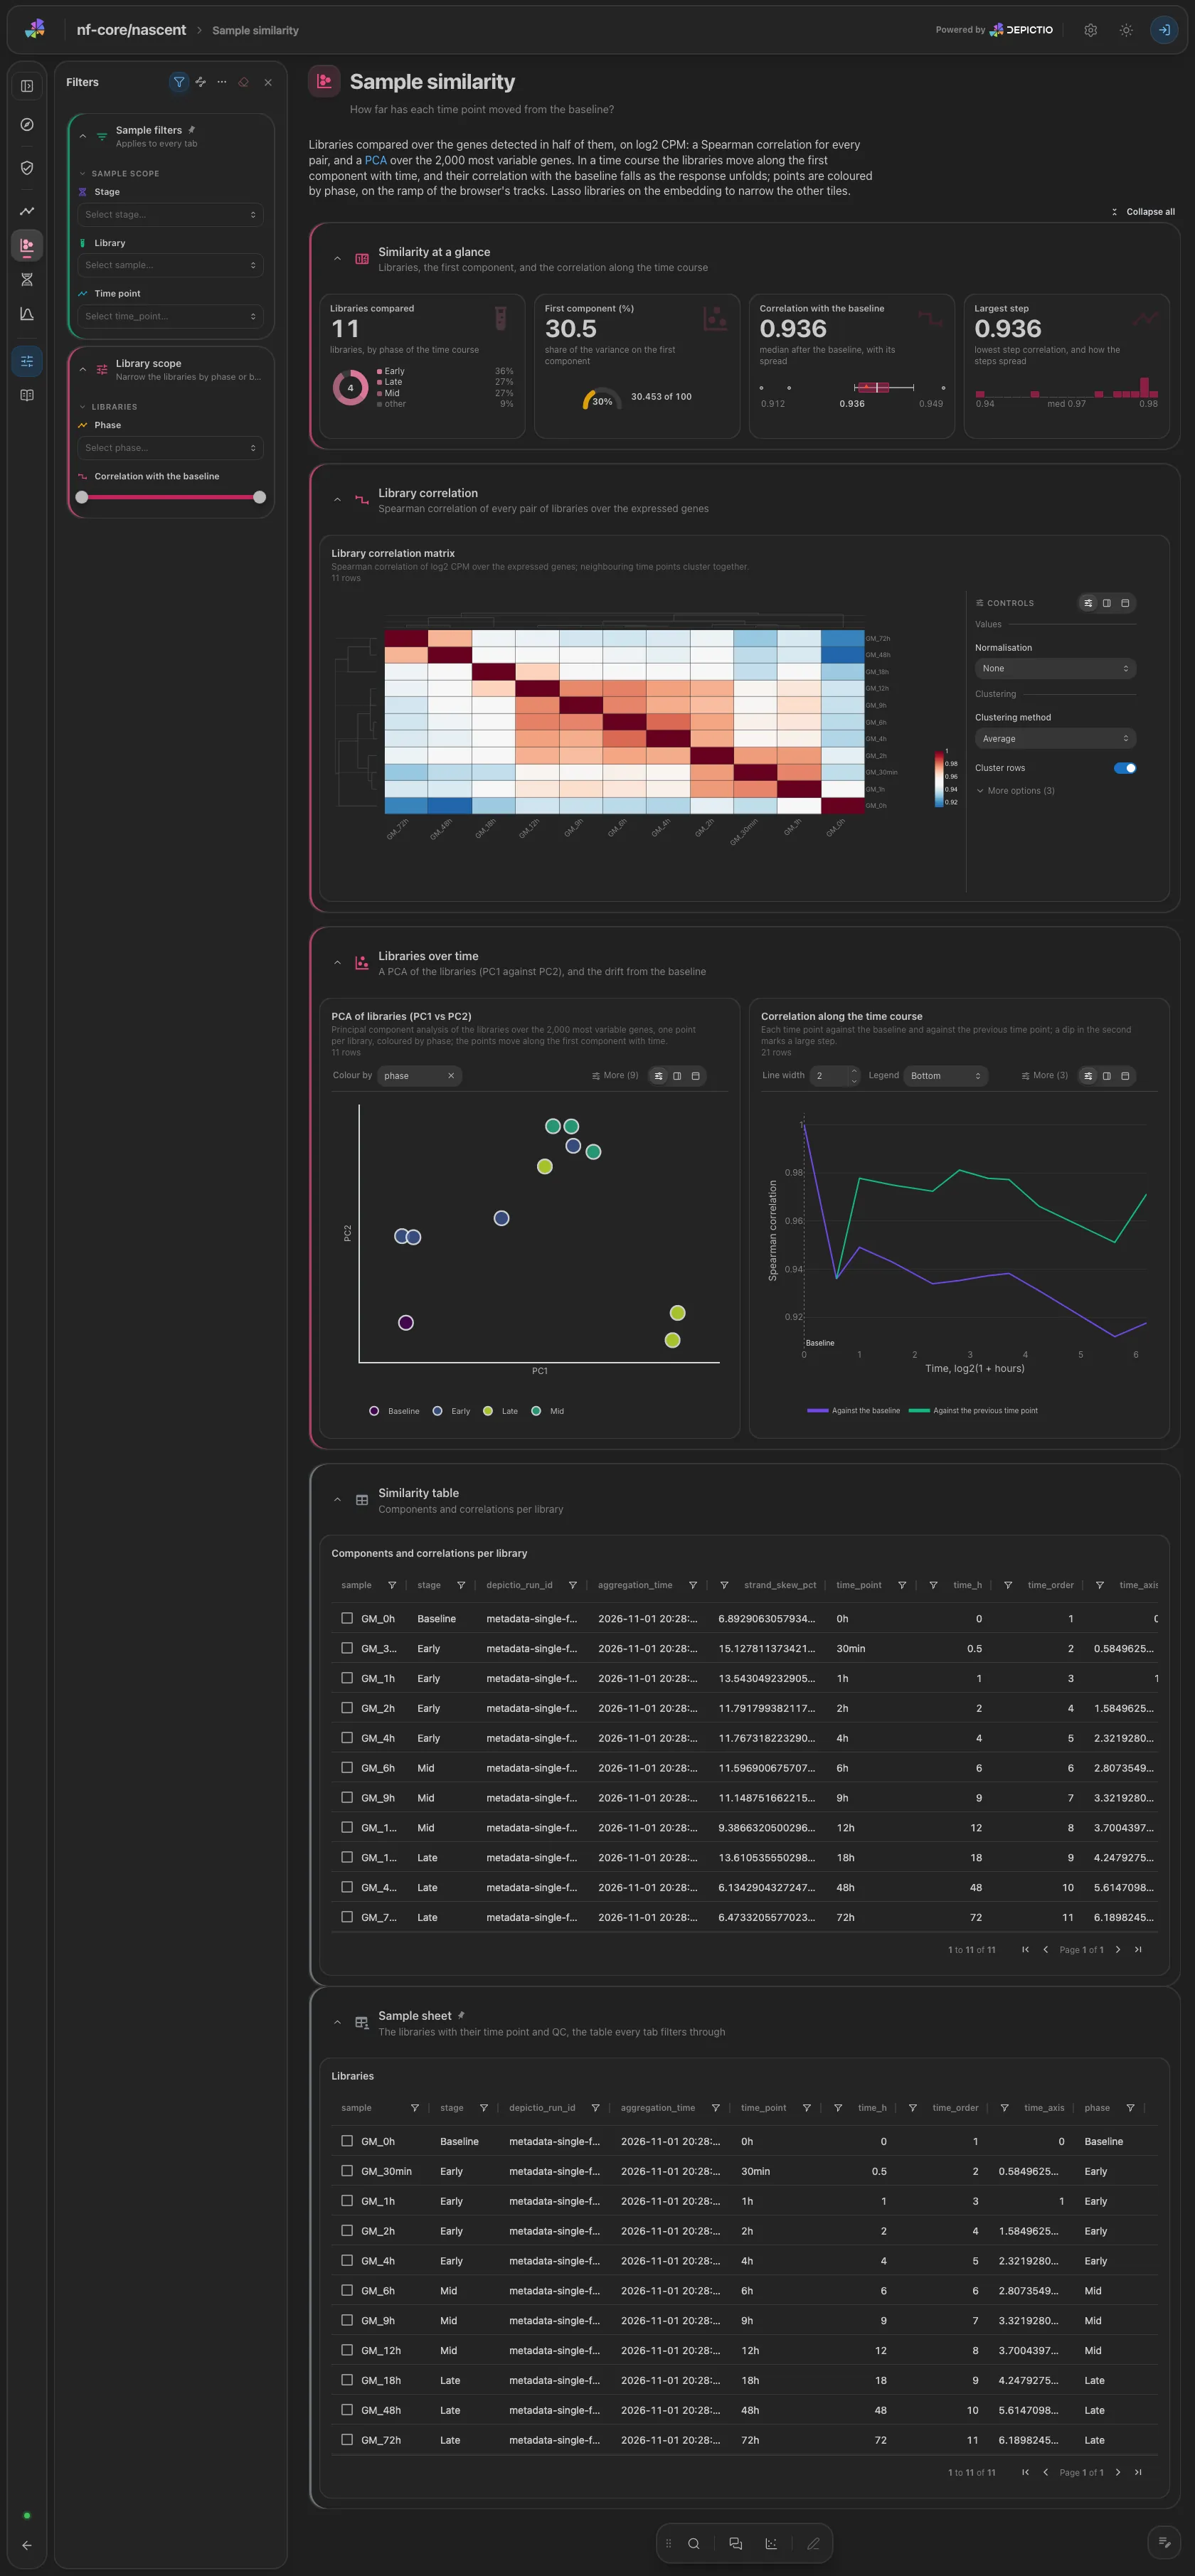
The library correlation matrix, a PCA of the libraries coloured by phase, and the correlation of each time point with the baseline and with the previous one. A course moves along the first components in time order: a library off that line is a candidate outlier rather than biology.
Time course · Where along the genome is nascent transcription read?
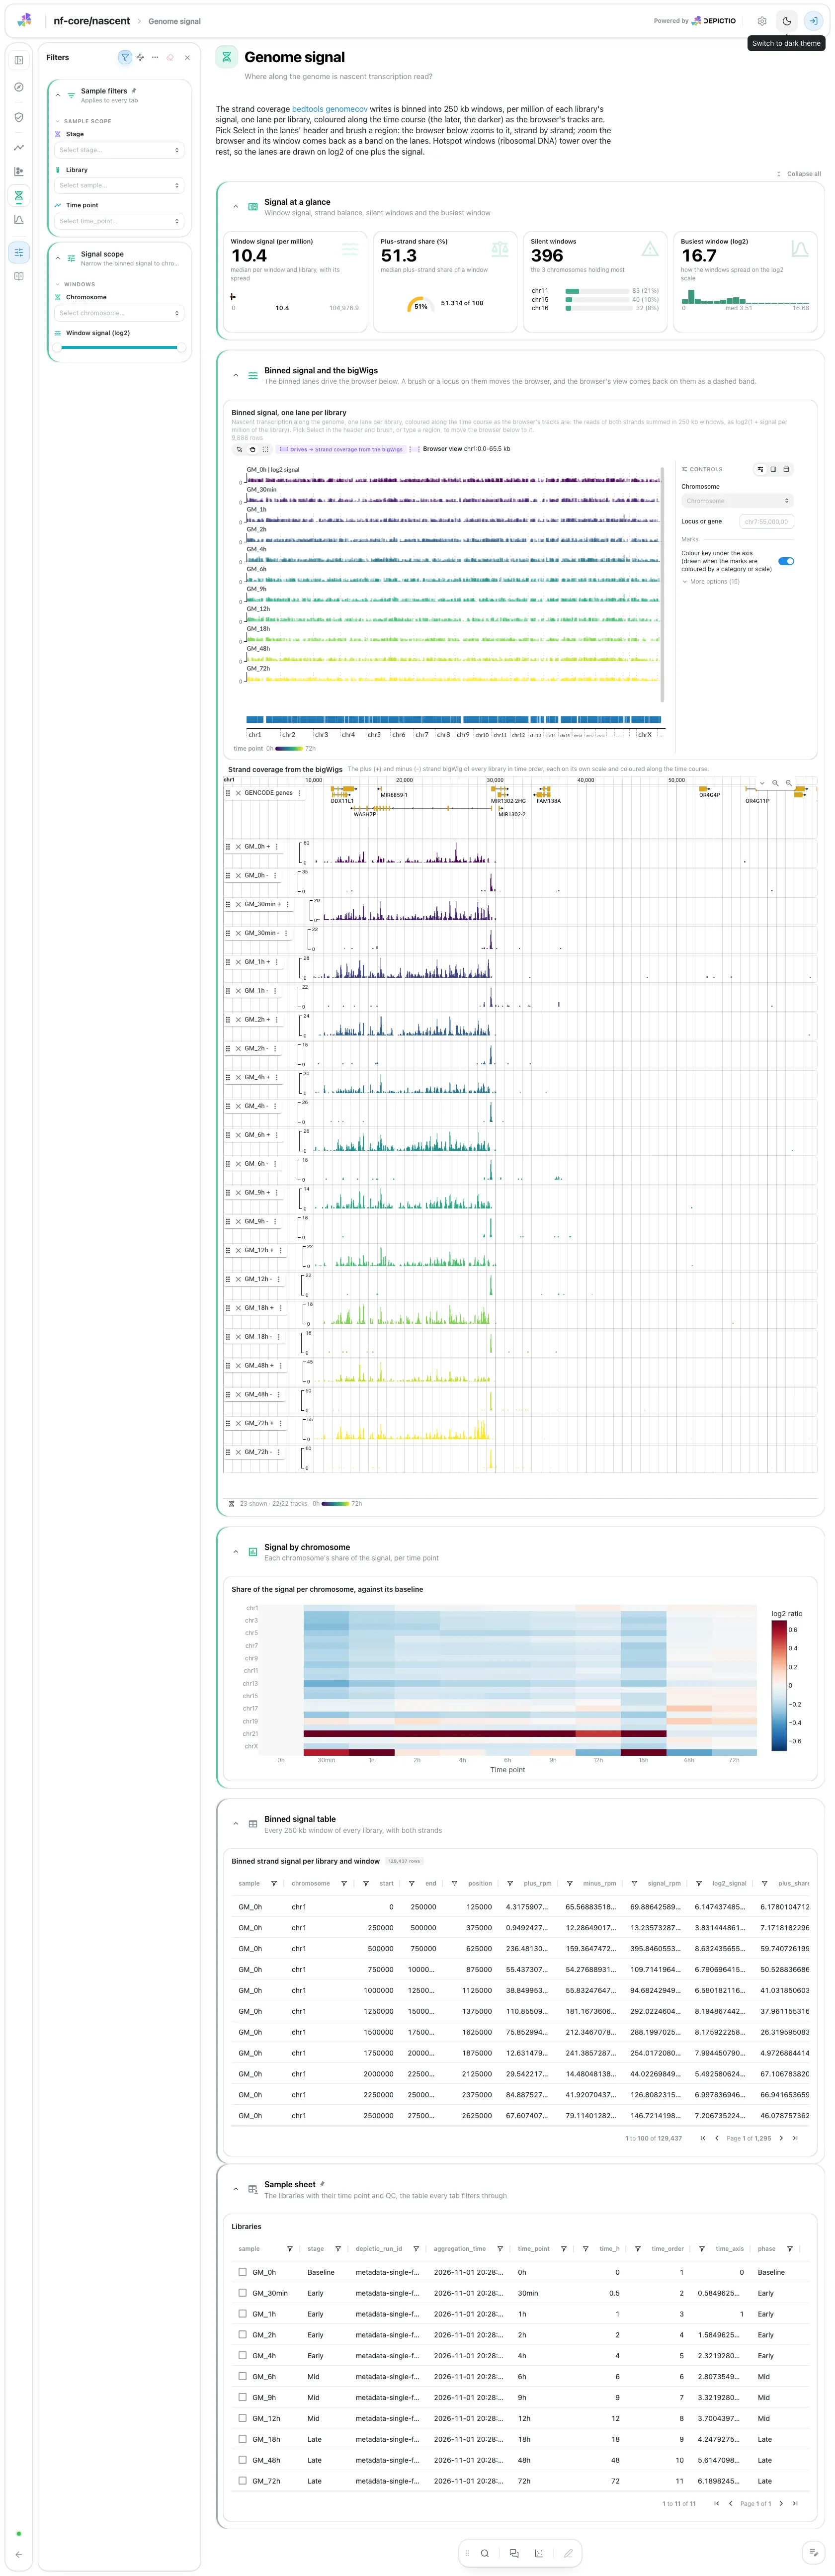
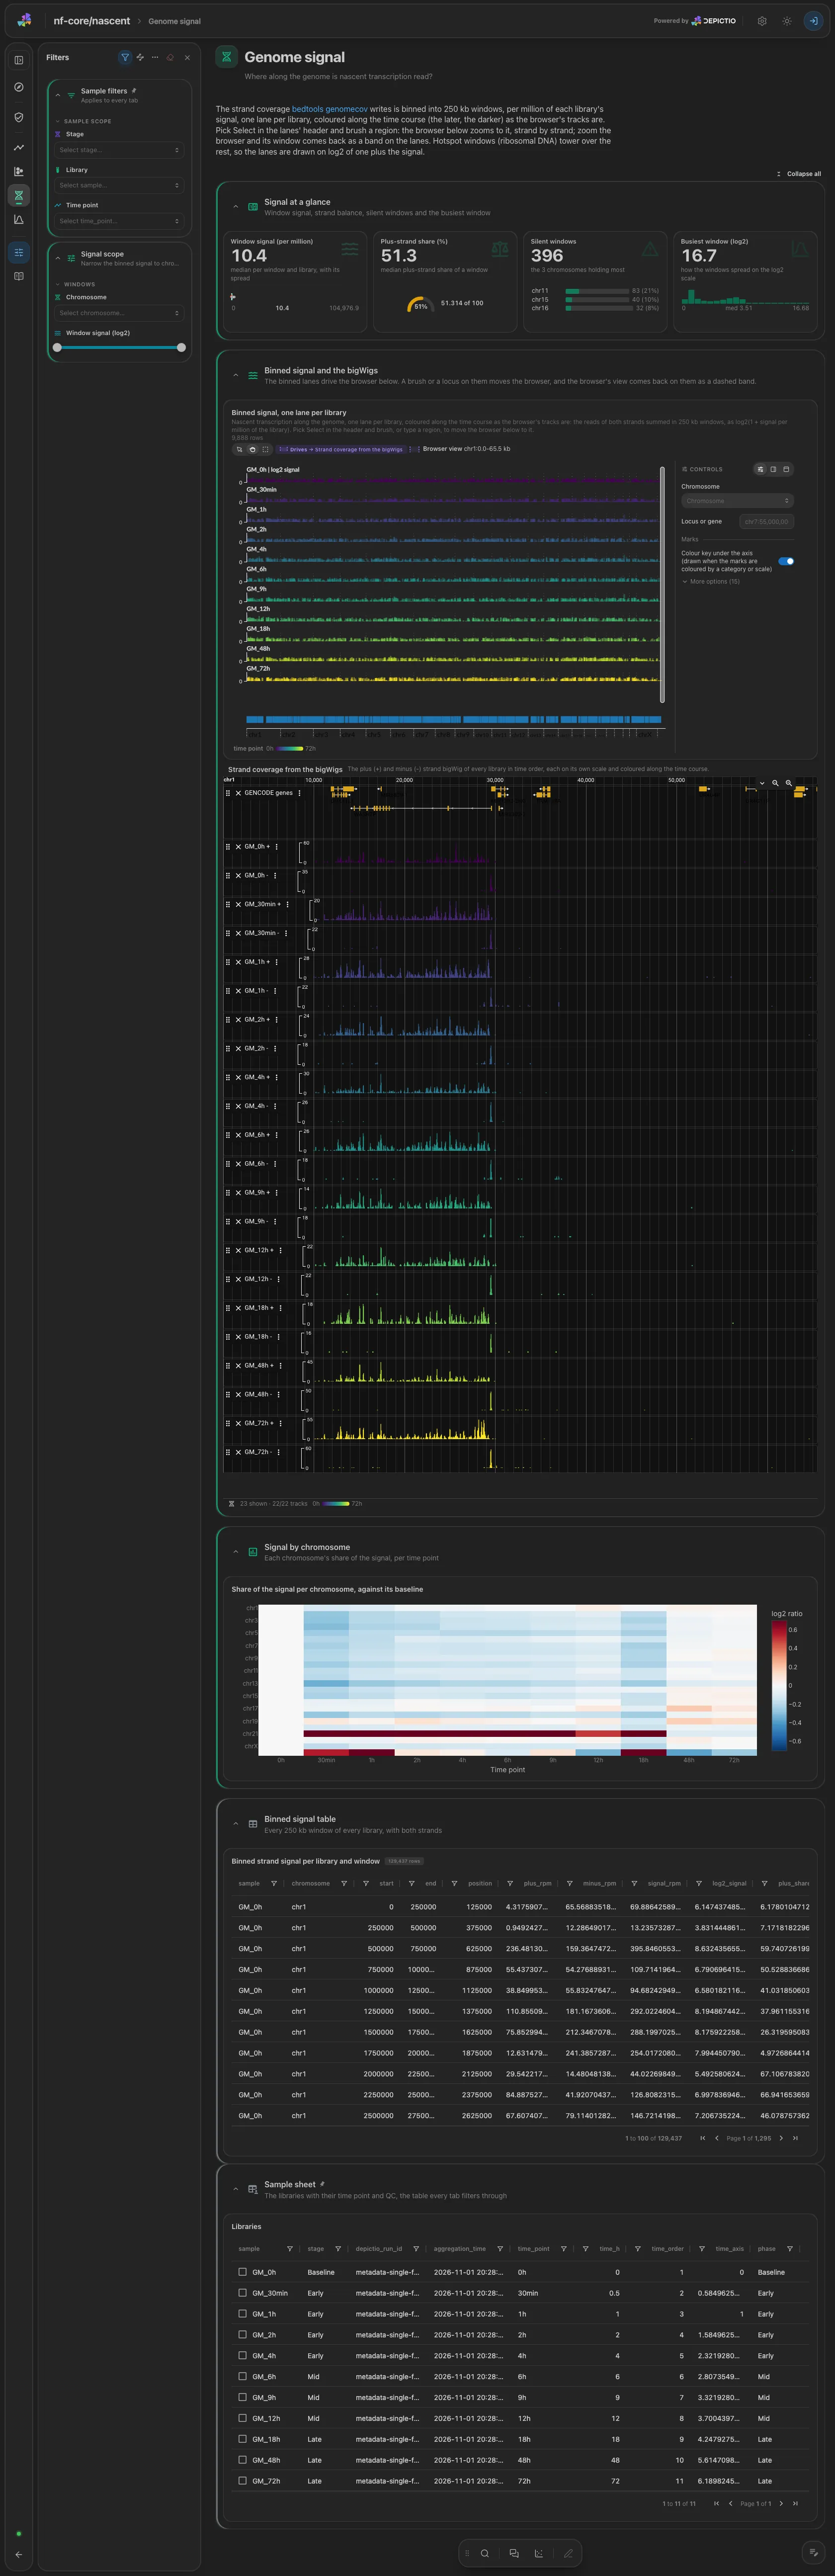
The binned signal, one thin lane per library, linked to a genome browser with the plus and minus bigWigs: brush a region or type one and the browser zooms to it. The cards follow the region in view, and the lanes and tracks are coloured along the time course. Below, each chromosome's share of the signal against its baseline share, per time point. The lanes are on log2 of the signal, so the ribosomal DNA hotspot does not tower over everything.
Time course · Which genomic windows gain or lose nascent signal over time?
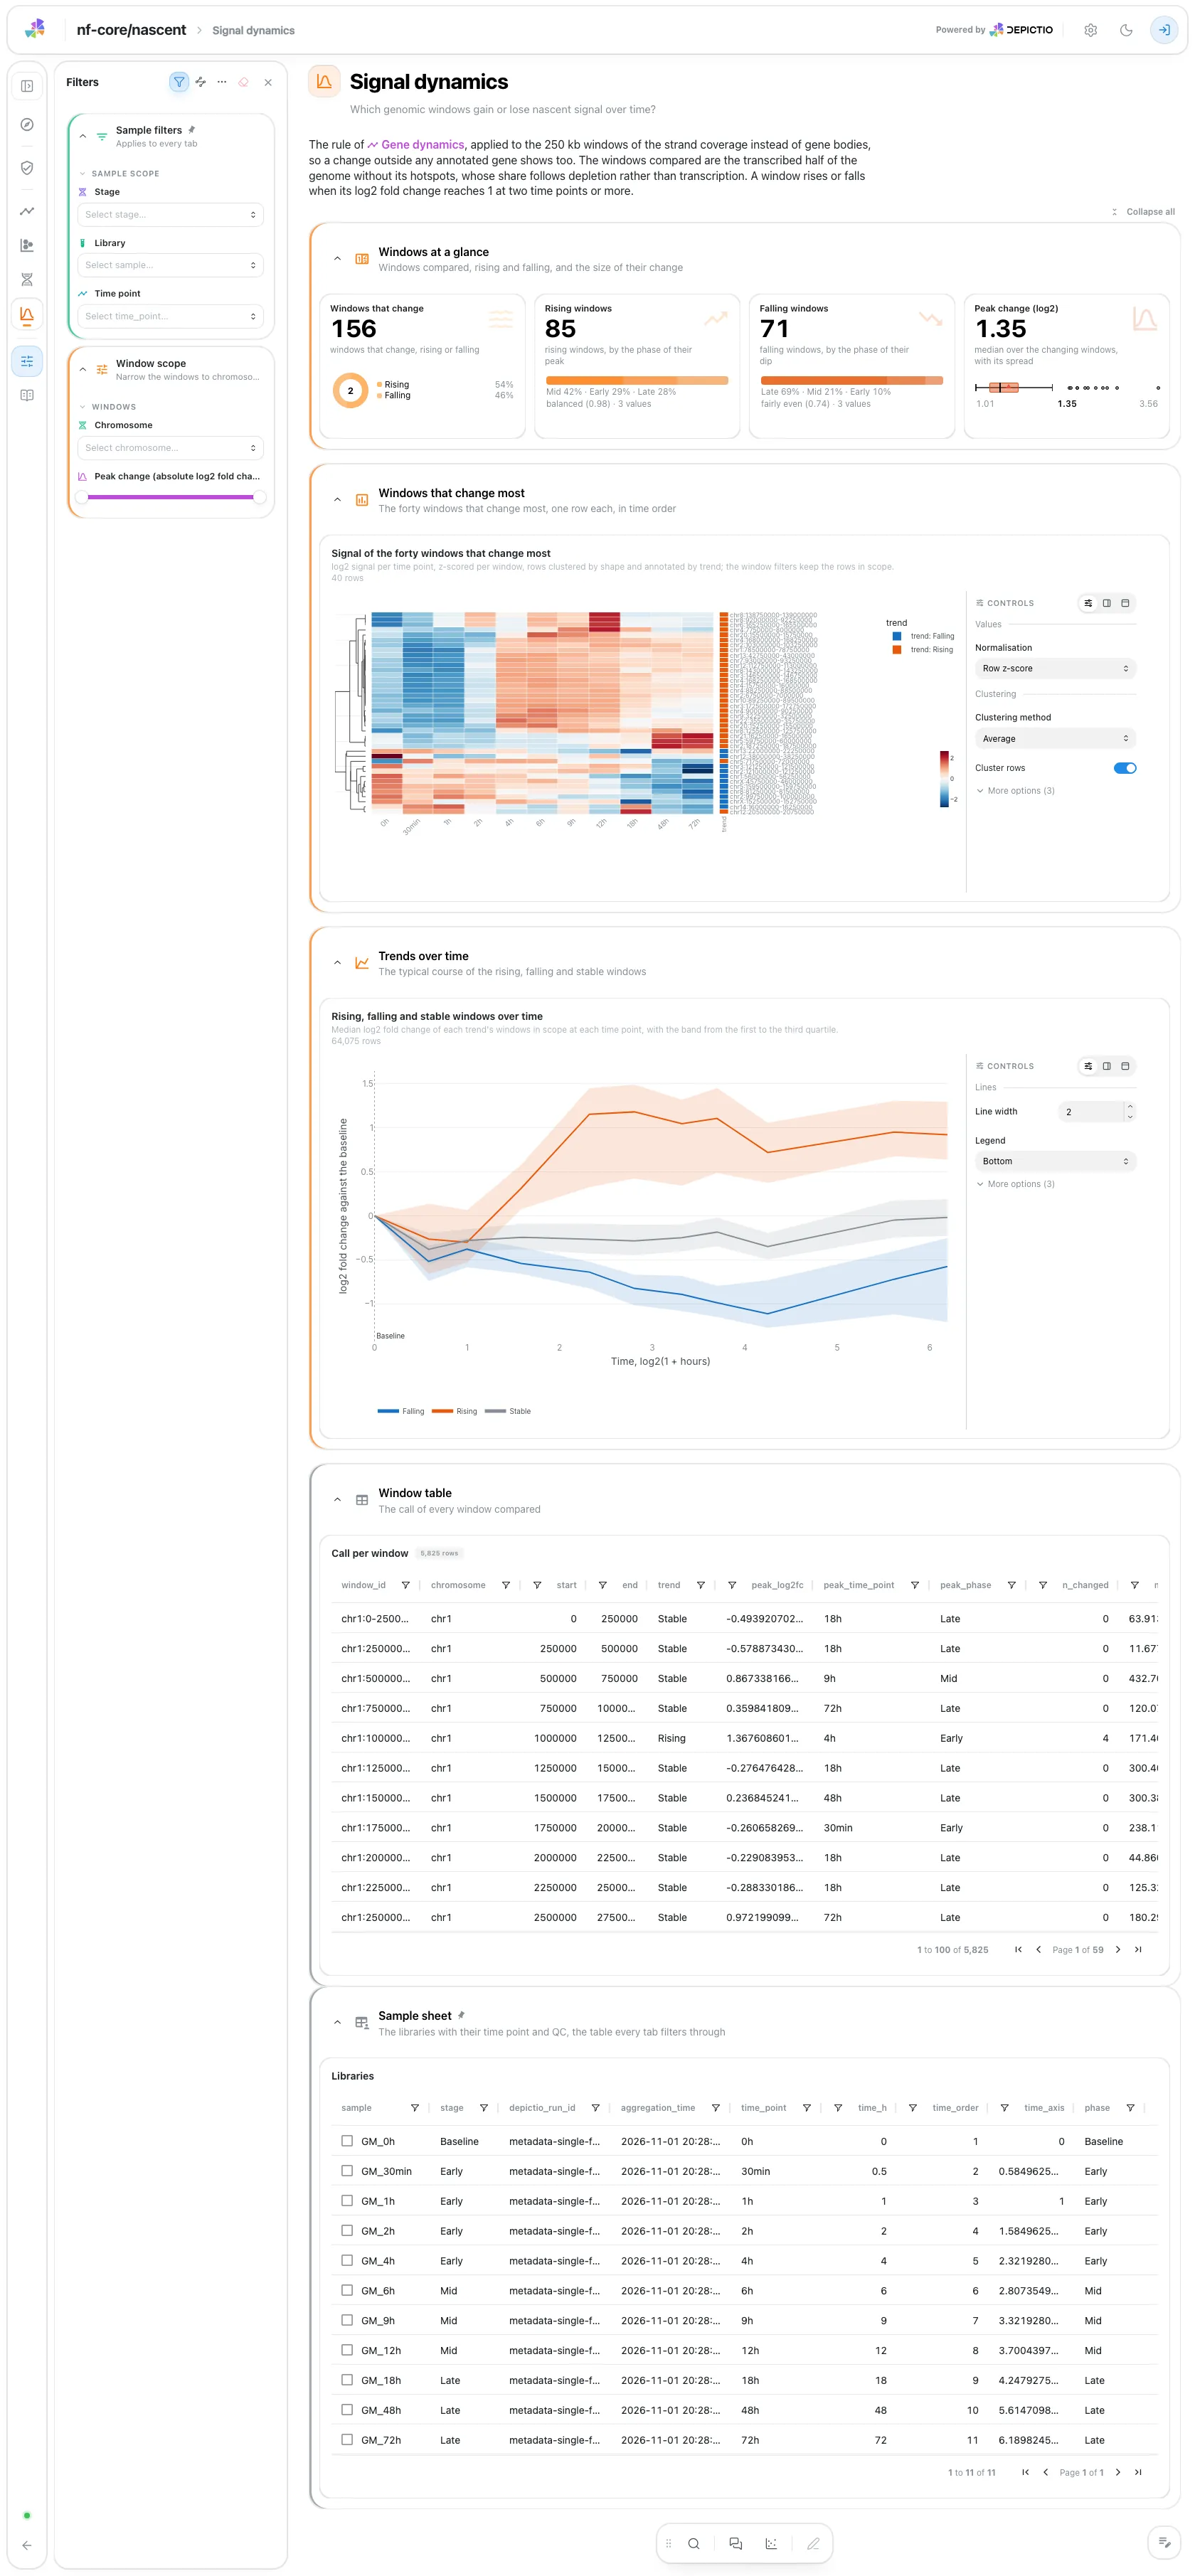
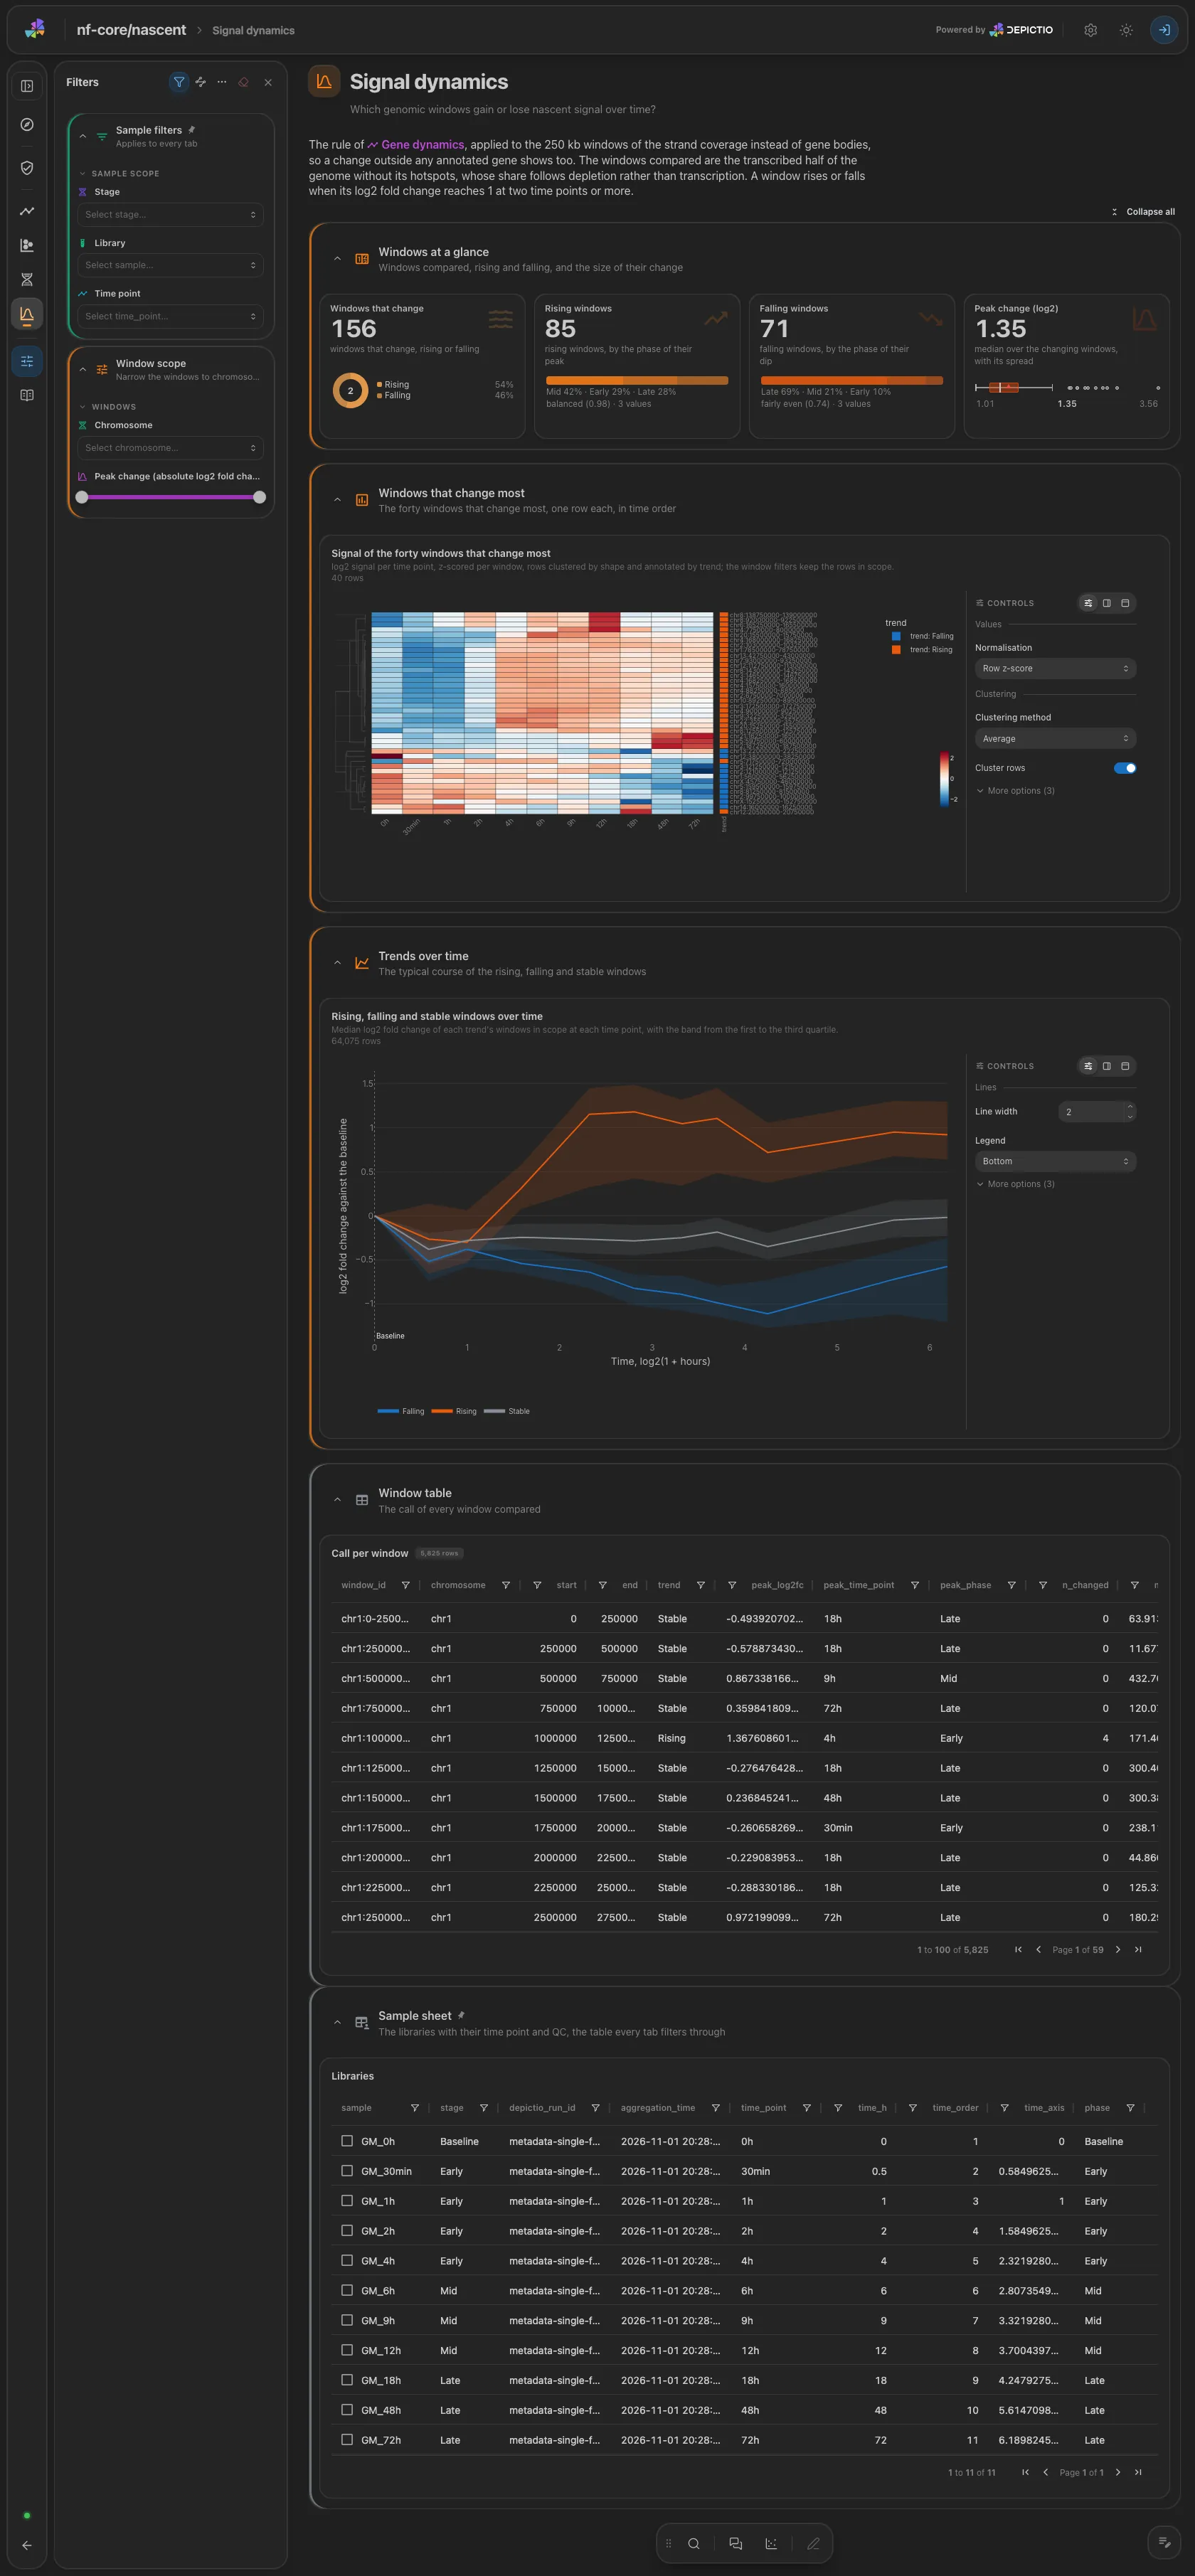
The gene rule applied to the comparable 250 kb windows, so a change outside annotated genes shows too: the windows that change (rising or falling), by phase of the peak, the forty windows that change most as a heatmap, and the median course of each trend. The window table is collapsed.
The gene and window trajectories (and so the median curves and the heatmaps) follow the calls in scope, not the picked time points, so each keeps its whole course. The baseline never peaks: picking only the baseline library leaves no gene or window in scope.
Running the pipeline
Depictio reads the output of nf-core/nascent, it does not run the pipeline. Run the pipeline first:
nextflow run nf-core/nascent -r 2.3.0 \
  --input samplesheet.csv \
  --outdir results \
  -profile docker
Then point Depictio at the results, with the design table that gives the hours:
See nf-co.re/nascent/usage for full pipeline documentation.
Required data structure
Point depictio ingest at the directory holding the pipeline output. Depictio scans
recursively and matches on file name.
<DATA_ROOT>/
├── input/
│   └── design.tsv                              # --var METADATA_FILE (optional, not published)
├── pipeline_info/
│   ├── params_*.json
│   └── *software*versions*.yml
├── quantification/gene/<group>.featureCounts.txt
└── coverage_graphs/
    ├── <sample>.{plus,minus}.bedGraph          # streamed into 250 kb windows
    └── <sample>.{plus,minus}.bigWig            # range-read by the genome browser
Validation runs
The repository ships
download_test_data.sh,
which fetches the subset of nf-core's AWS megatest run that the template needs and
copies the vendored sample sheet and design table into input/:
bash depictio/projects/nf-core/nascent/2.3.0/download_test_data.sh \
  /tmp/nascent_test
depictio ingest /tmp/nascent_test \
  --template nf-core/nascent/latest \
  --var METADATA_FILE=/tmp/nascent_test/input/design.tsv
The run is
s3://nf-core-awsmegatests/nascent/results-7d4fe61975015f652c271886e661764b05cfd3bf/,
the 2.3.0 test_full profile: one GRO-seq time course of 11 single-end libraries,
0 h to 72 h. The download is about 5.2 GB, 4.8 GB of it the strand bedGraphs. That
run did not finish its transcript identification and wrote no MultiQC report, which
is why the template has no Transcripts or MultiQC tab.
Additional resources
- nf-co.re/nascent: official pipeline documentation
- nf-co.re/nascent/results: AWS test results
- Template System Reference: YAML format, variables, conditionals
- Recipes: how to read, test, and write recipes
Authorship
 weber8thomas
Reviewing a template on your own data, or taking over a role here, is a contribution in itself: the contributing guide says what each one involves.