

A modern open-source platform that transforms bioinformatics workflow outputs into interactive dashboards.
Build, share, and explore data visualizations with or without writing code.
Bioinformatics pipelines produce more output than anyone reads. Depictio turns that output into dashboards you can hand to a collaborator, from any execution engine: Nextflow, Snakemake, Galaxy or a shell script.
Workflow Ecosystem
Connect with standardized bioinformatics workflows from various platforms.




Depictio in numbers
42
nf-core pipeline templates




















































































135tools · 465 outputs
in the Tools Catalog

- salmon
 deseq2

- star
- samtools
 pangolin
- bcftools
 nextclade
- kallisto

- busco

- metaphlan
 edger
- macs2

- cellranger

- snpeff


 dexseq
- mosdepth
 cellbender
- picard

- deeptools
 simpleaf
- arriba

- cnvkit
 cooltools
- nanoplot
 damageprofiler
- bismark
2,176
ready-made renders
- Card 942
- Advanced viz 414
- Table 391
- Figure 245
- Interactive 123
- MultiQC 61
56
advanced visualizations
Each with its own controls and views
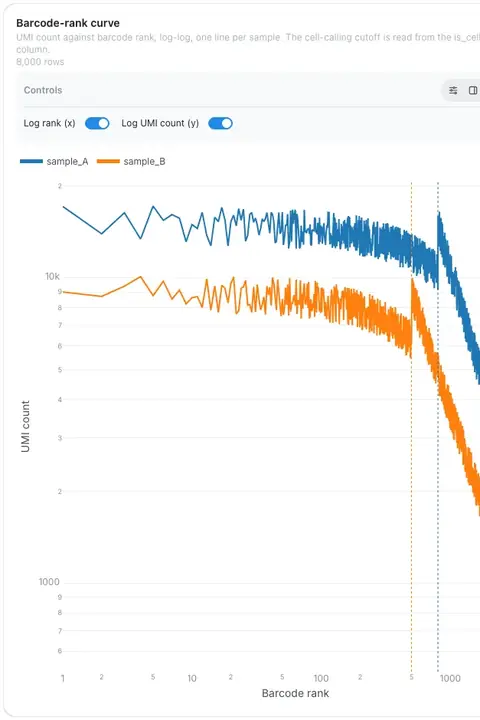
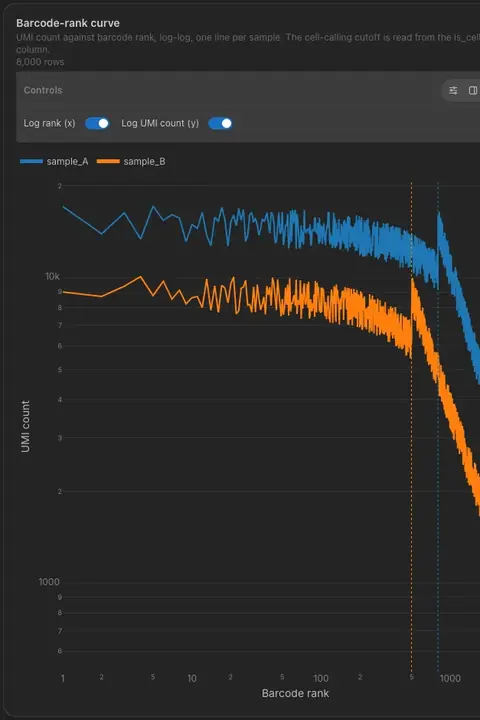
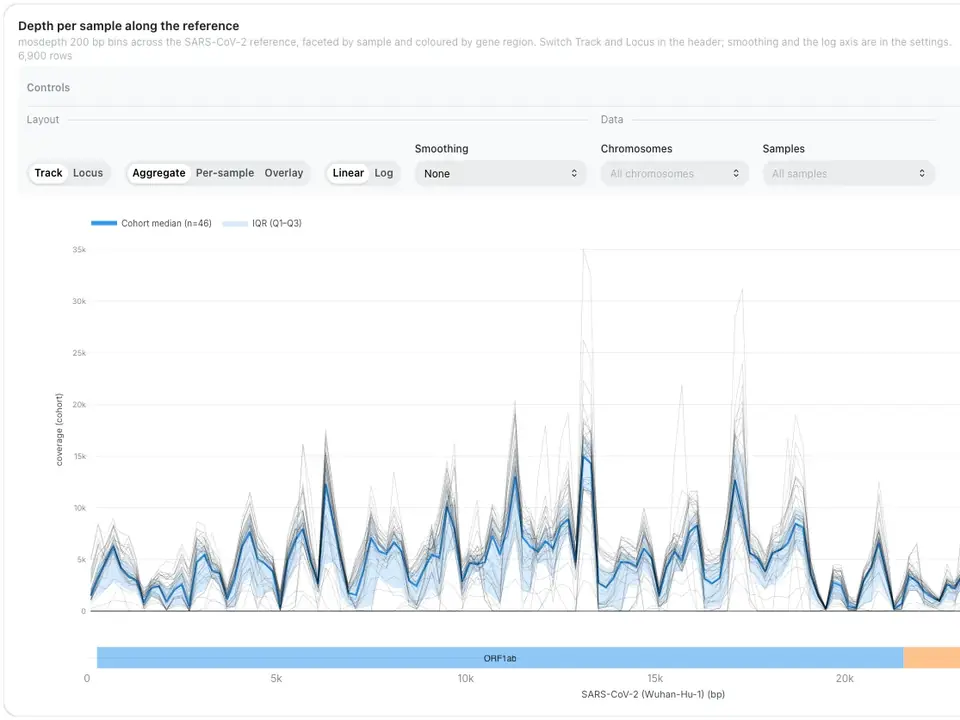
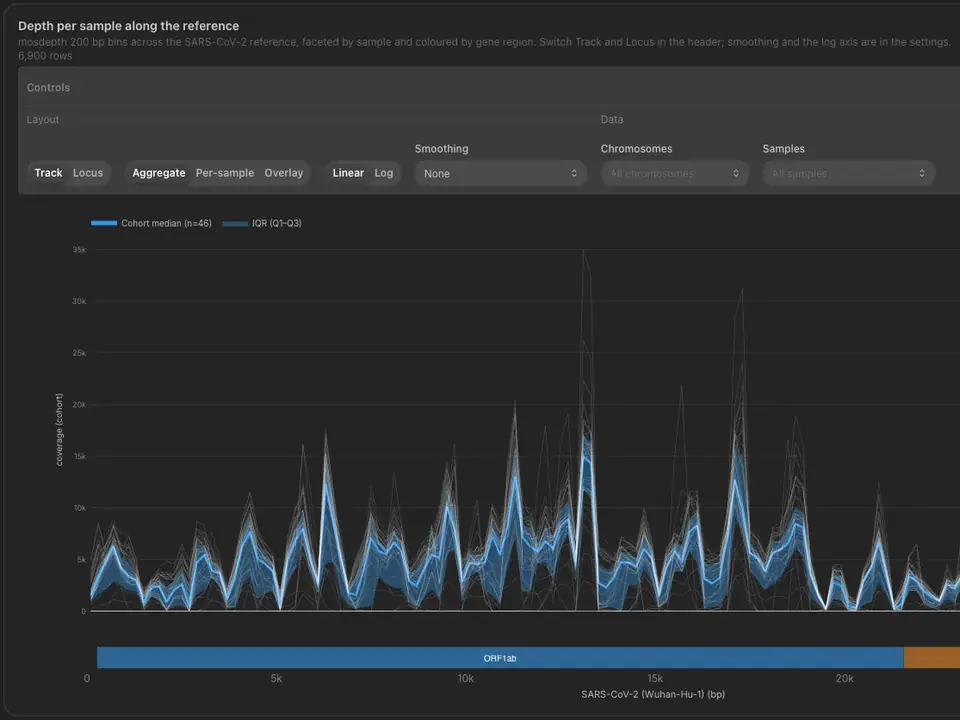
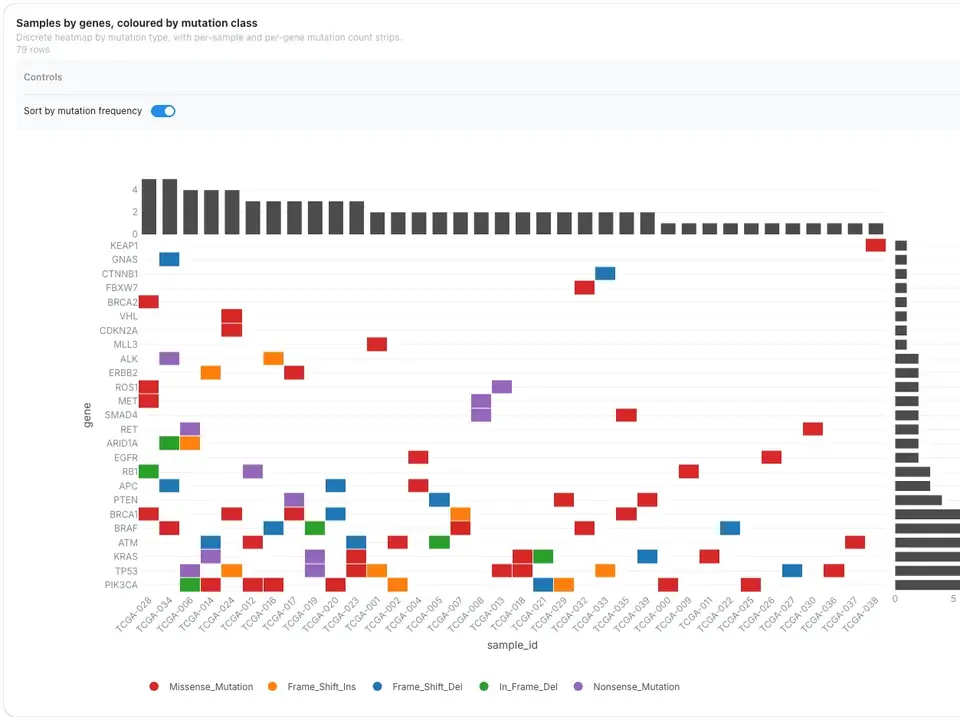
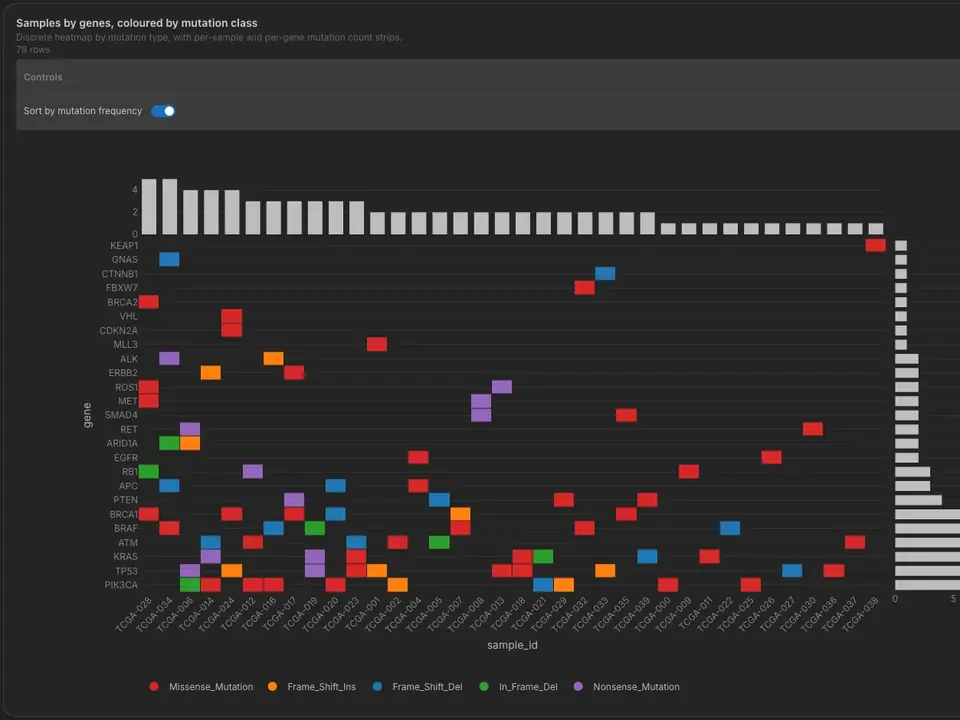
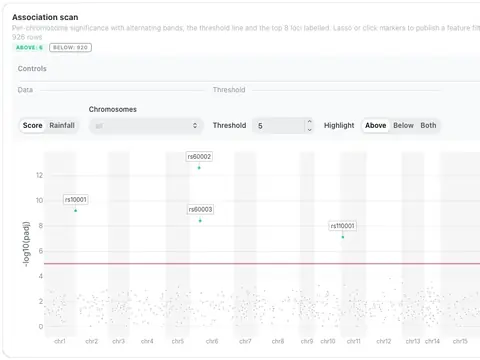
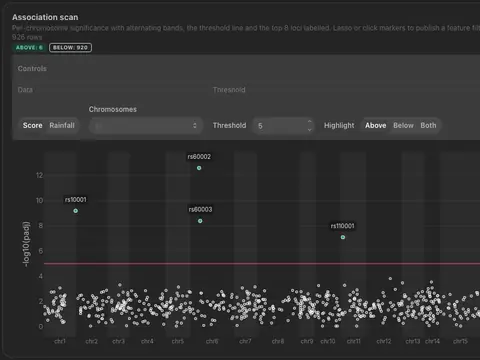
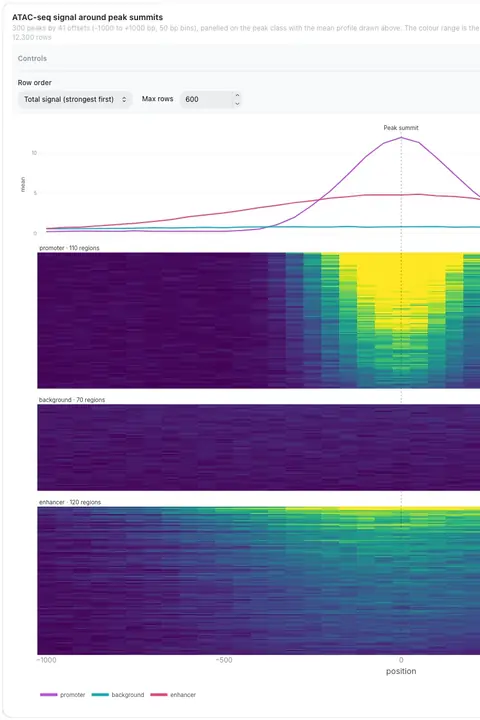
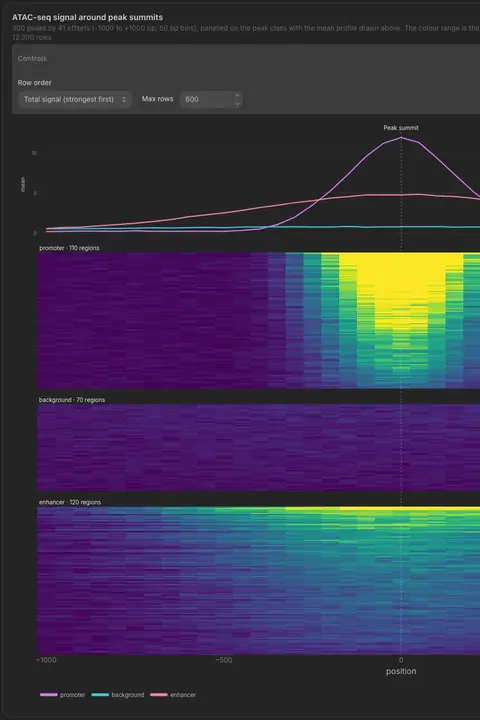
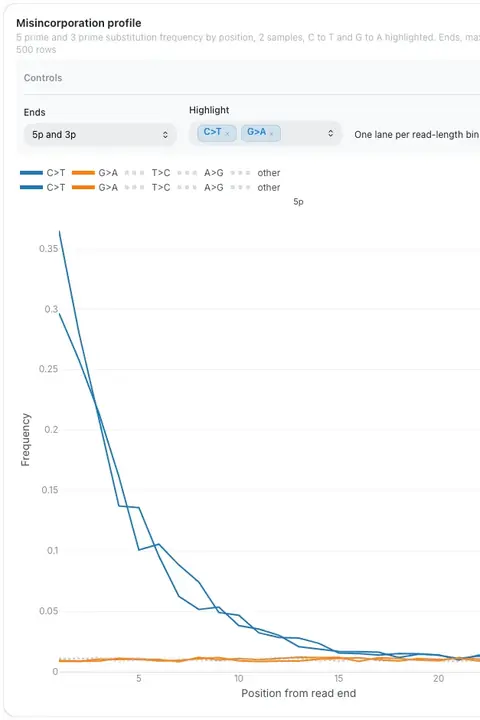
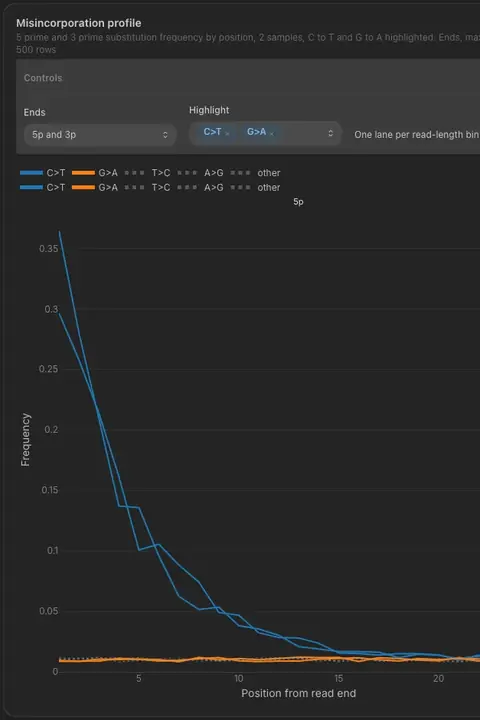
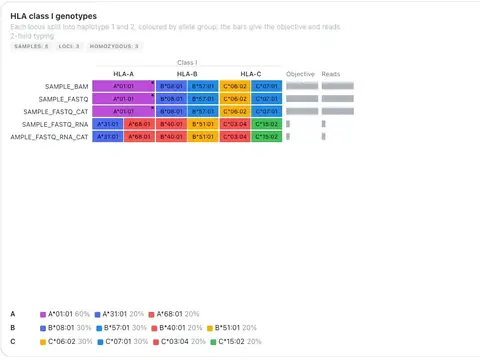
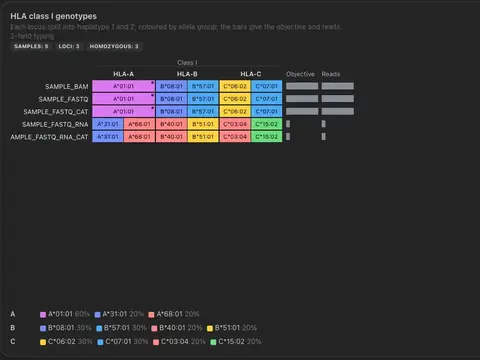
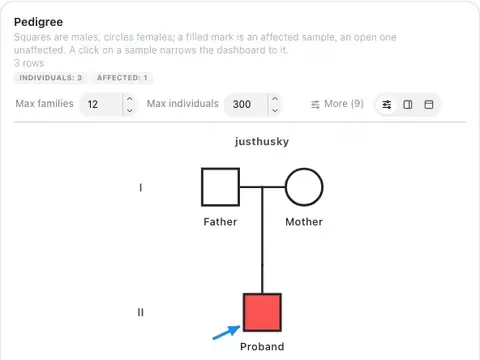
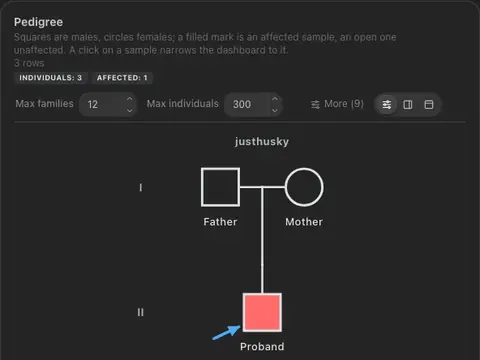
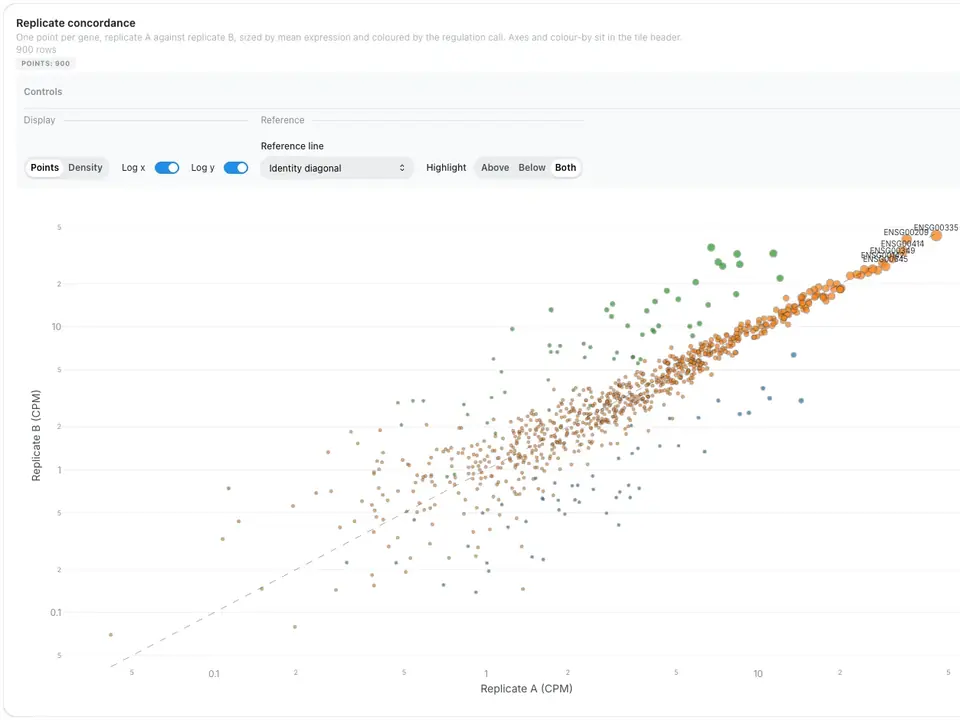
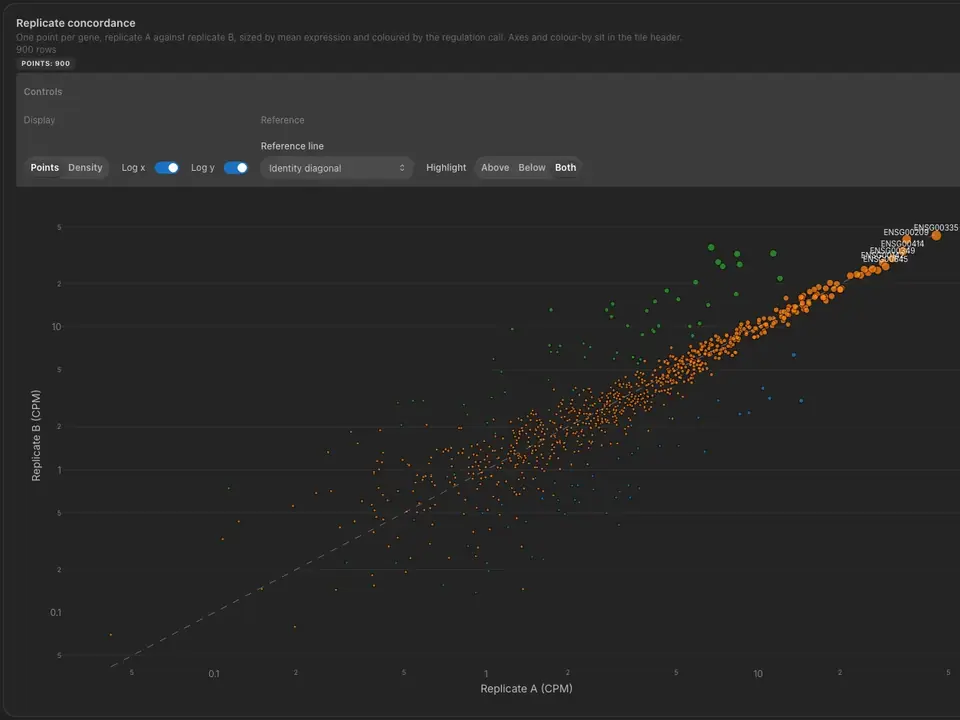
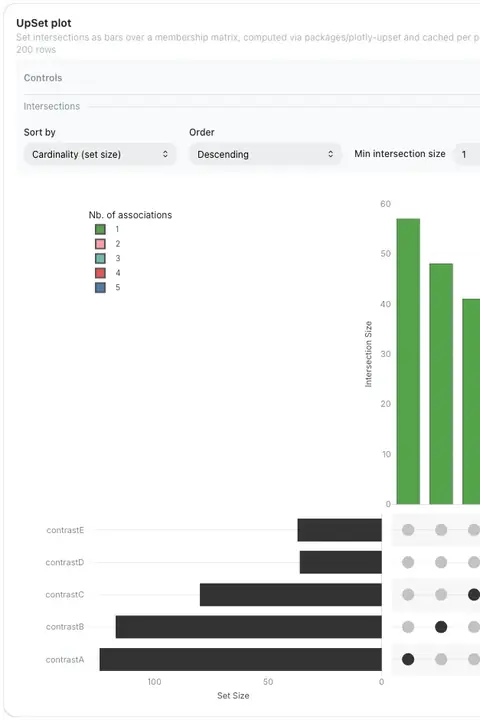
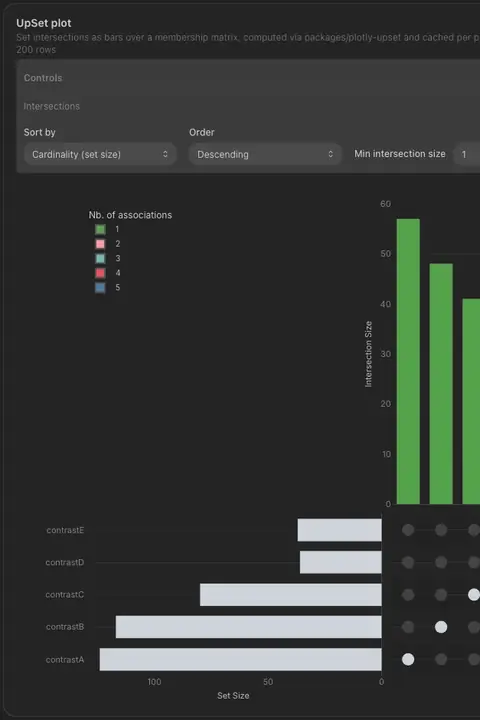
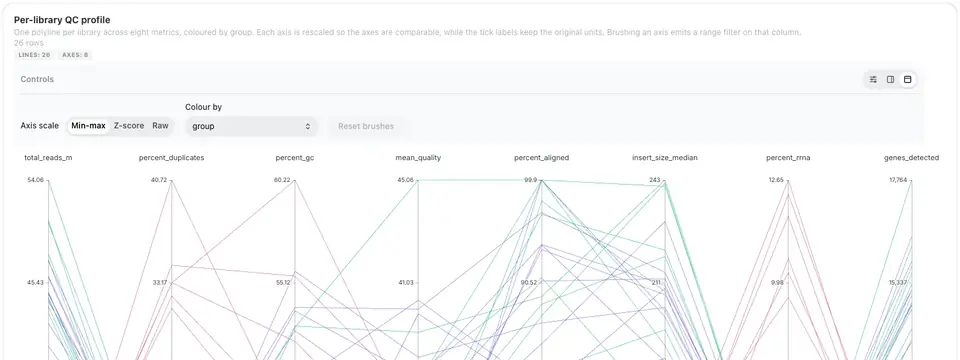
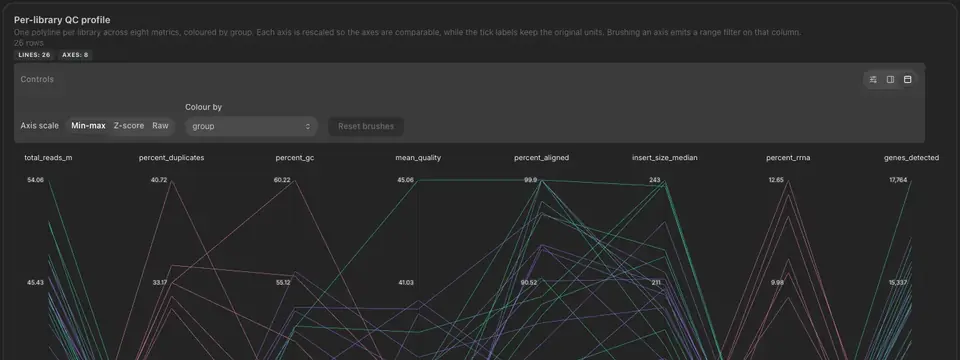
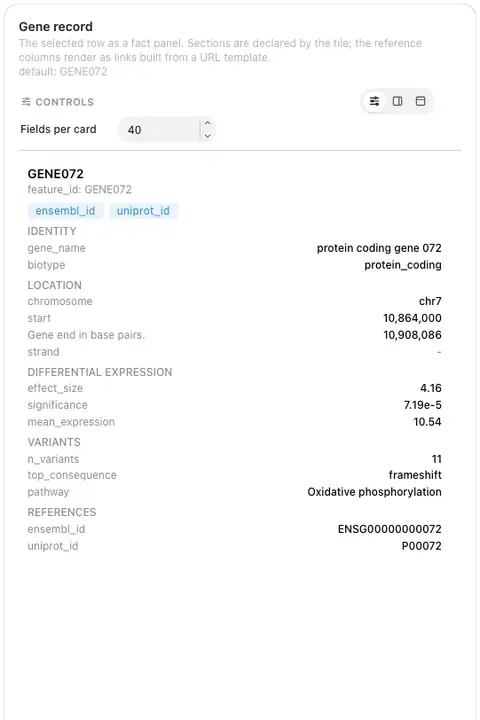
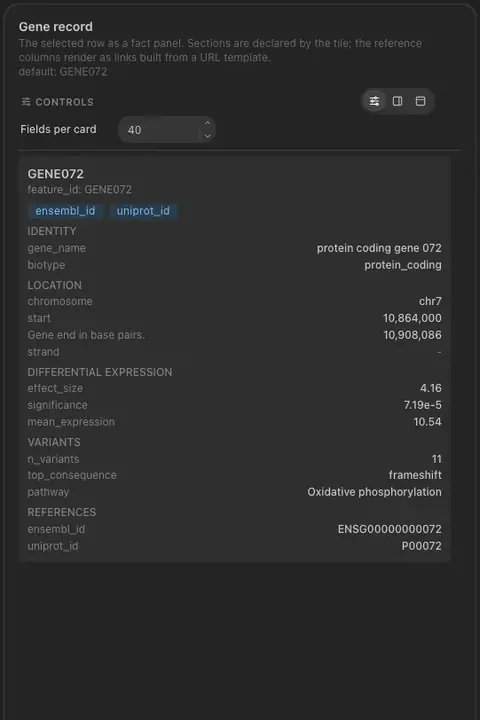
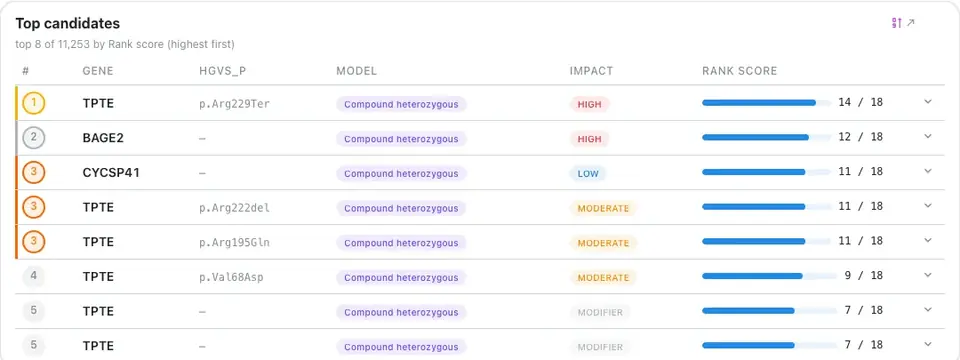
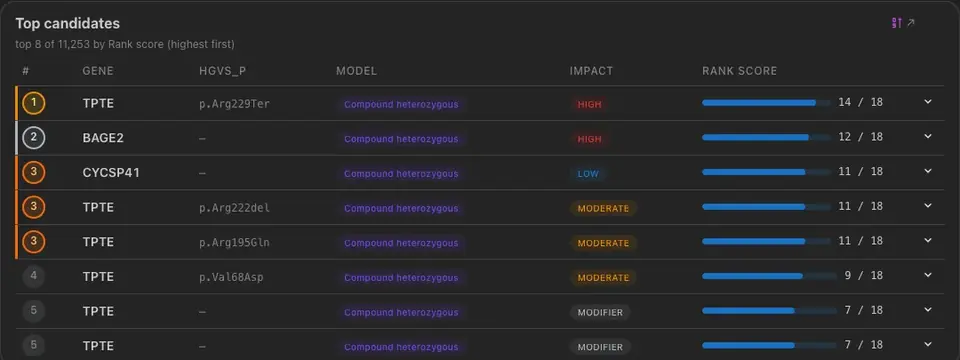
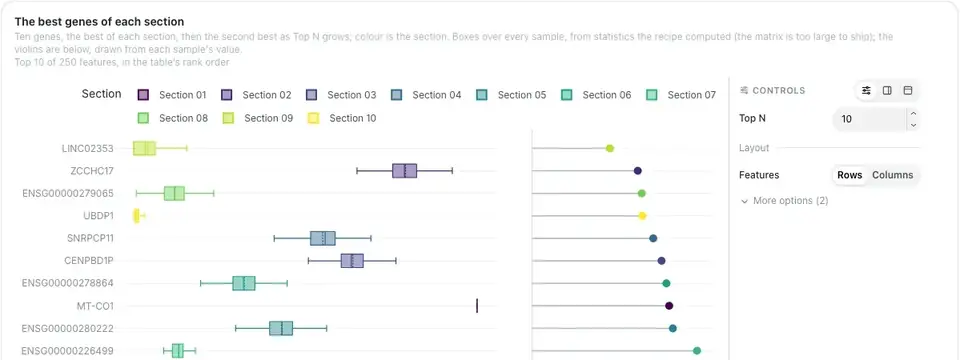
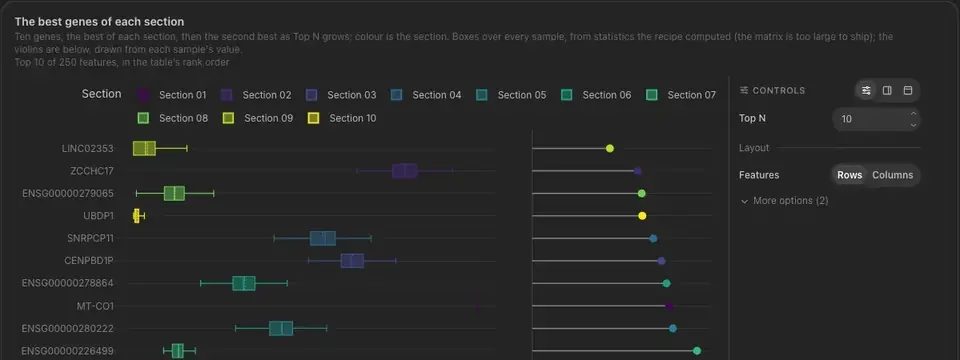
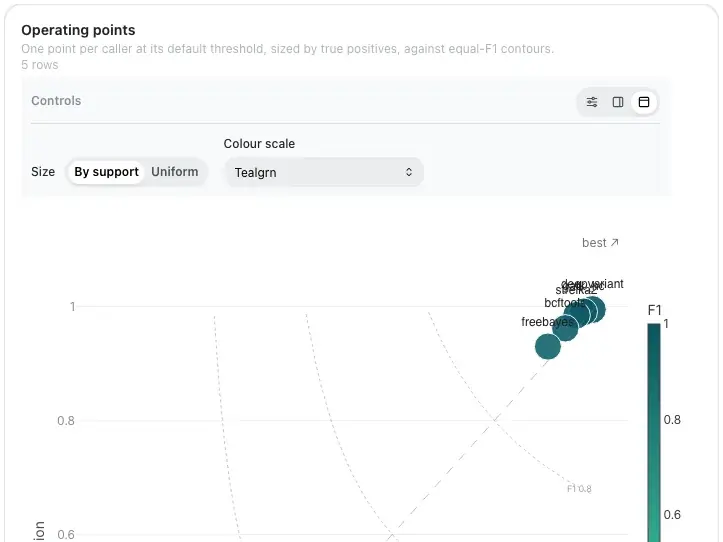
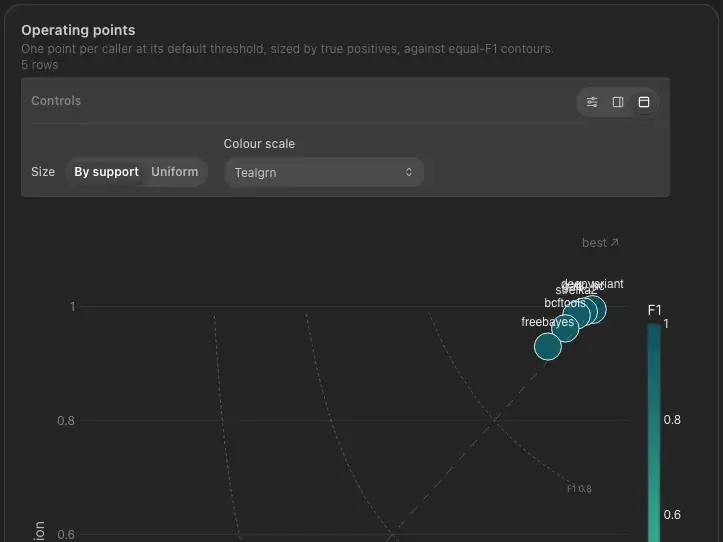
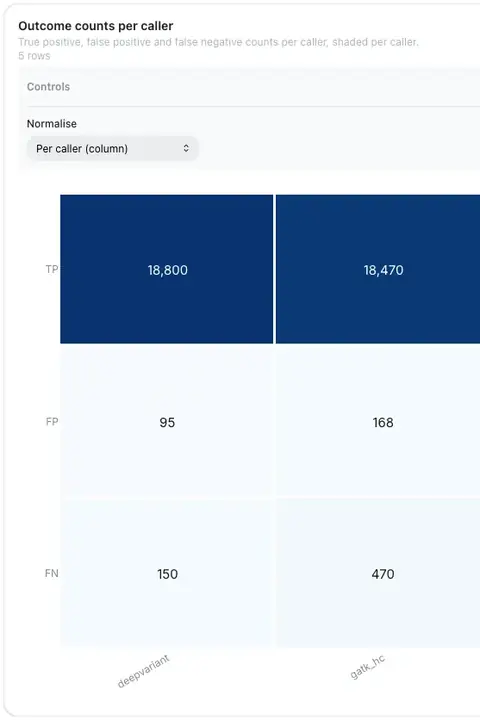
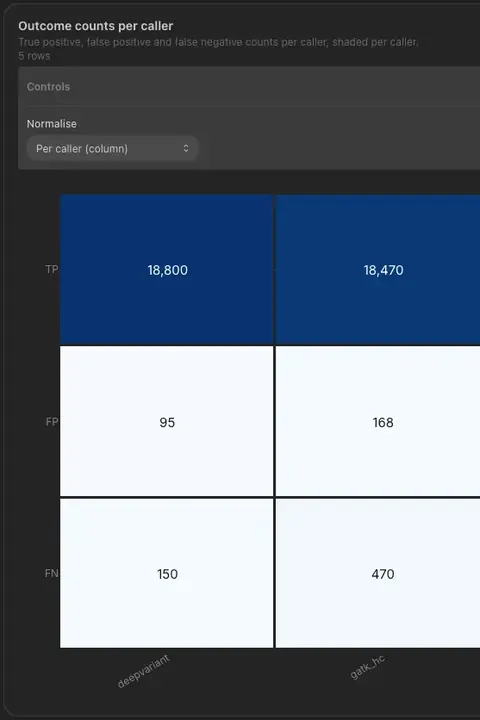
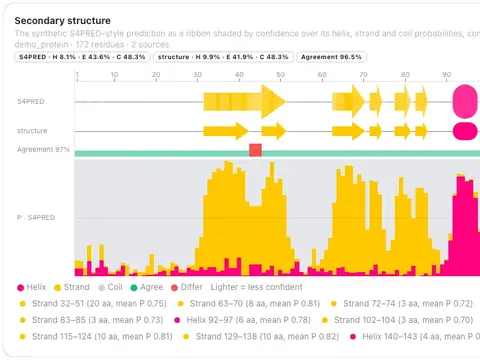
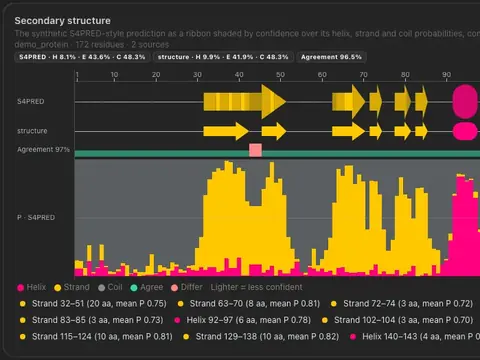
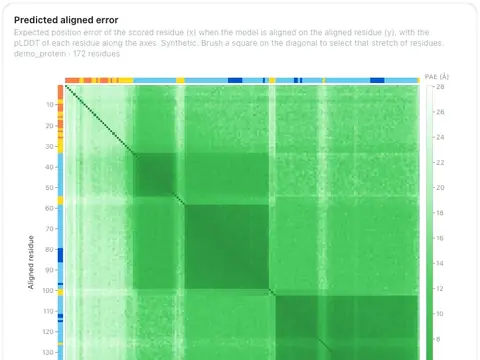
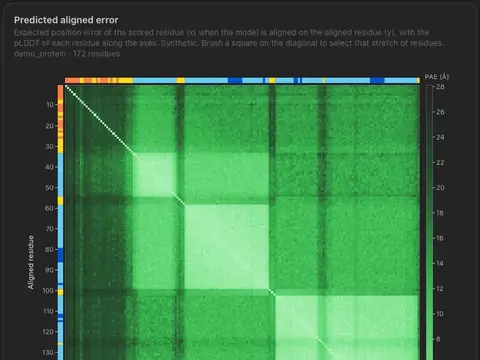
As of v1.20.0
Dashboard Components
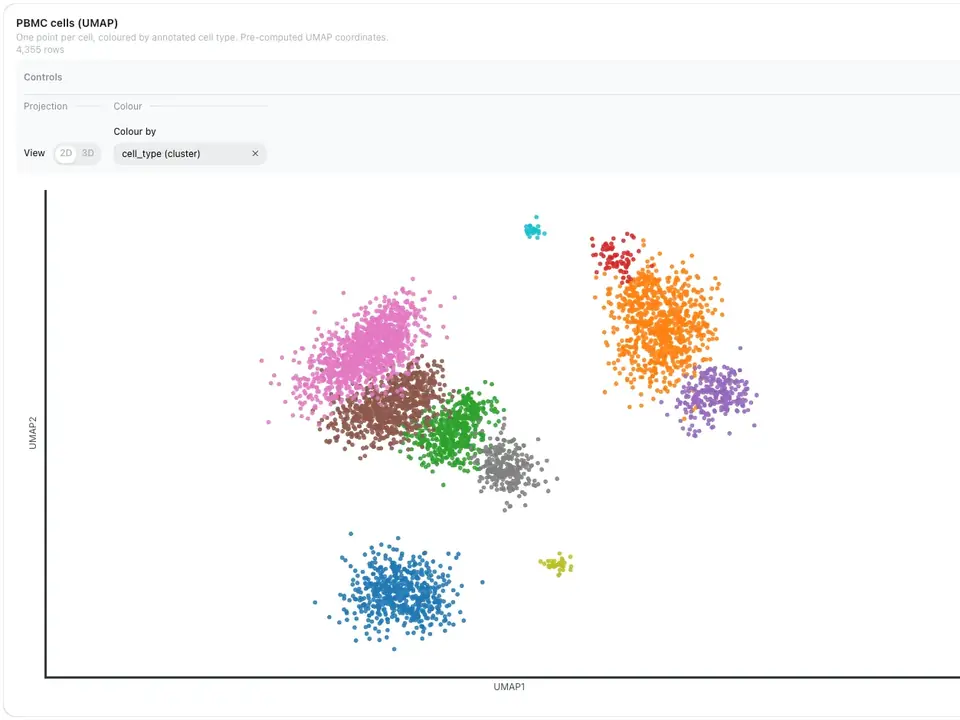
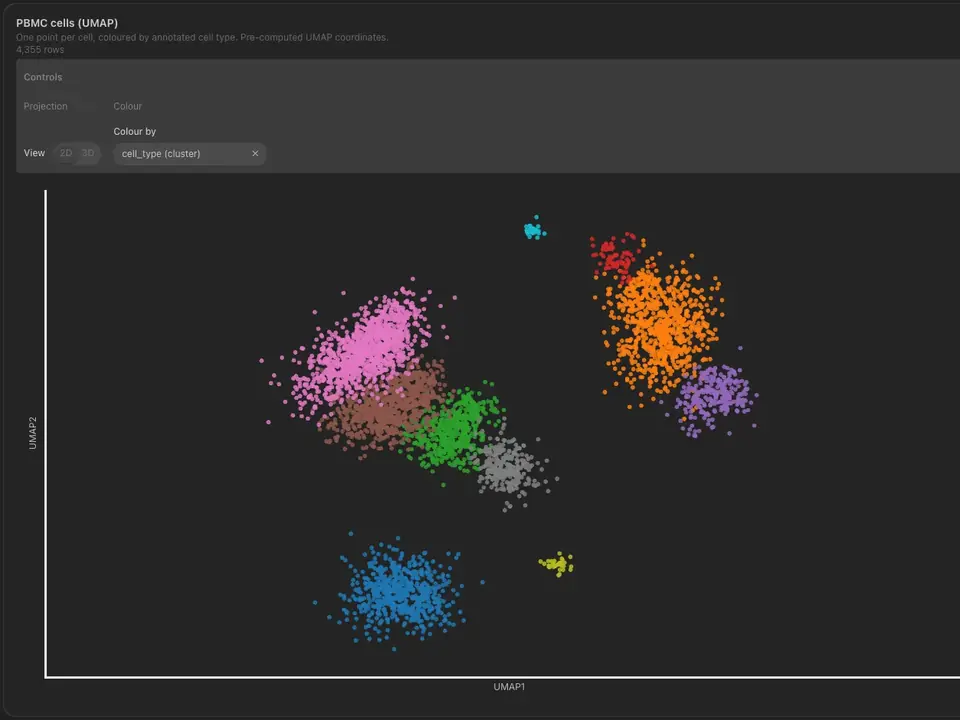
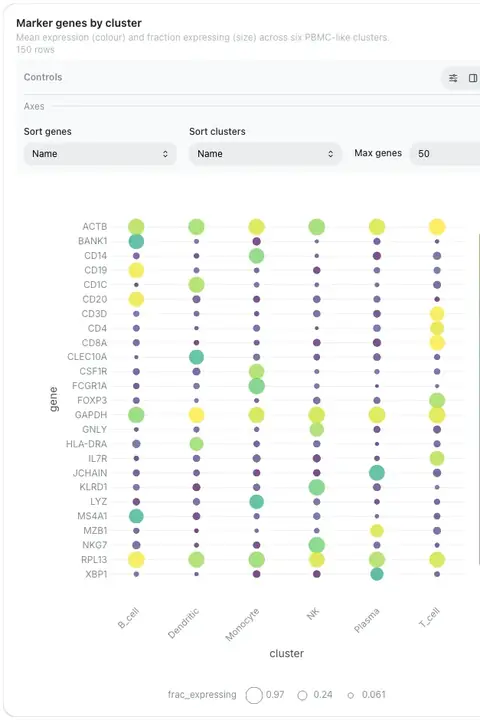
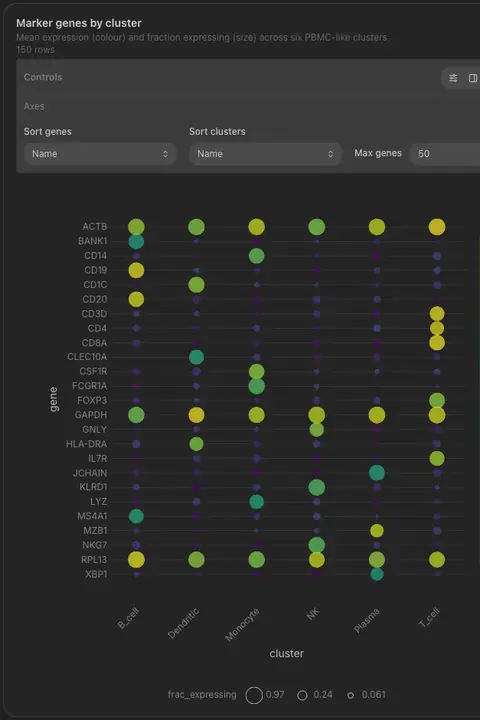
Pick a component to see a few examples from real dashboards. Most are live: hover, zoom and use their controls.
Figure
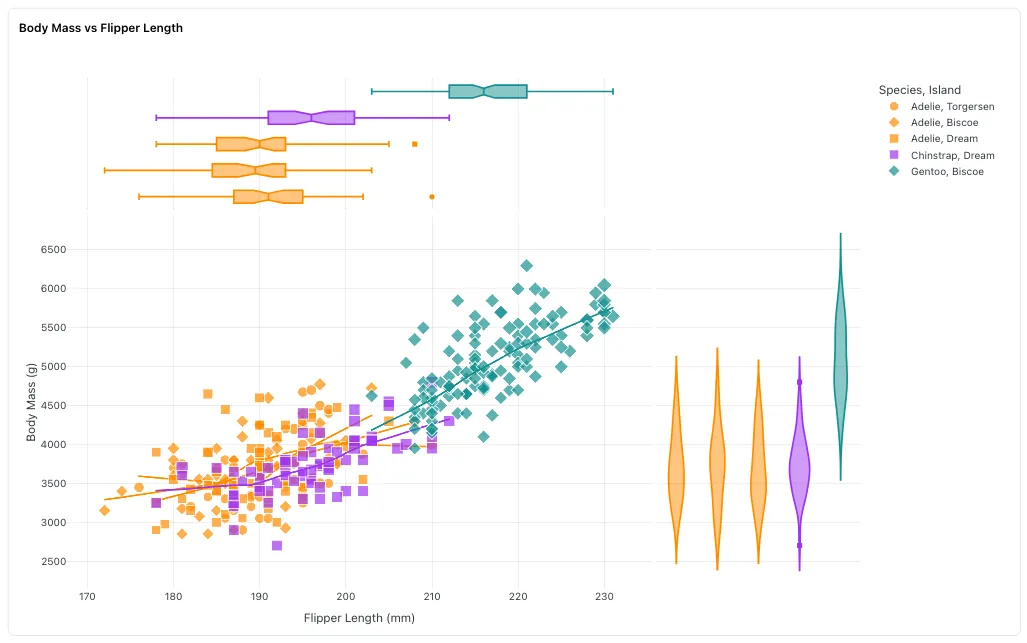
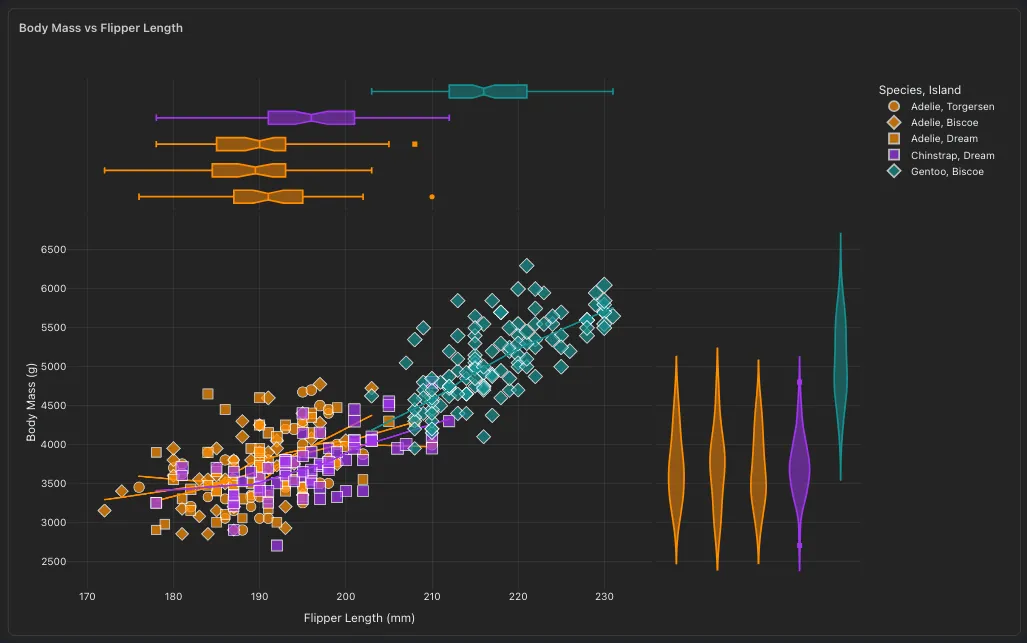
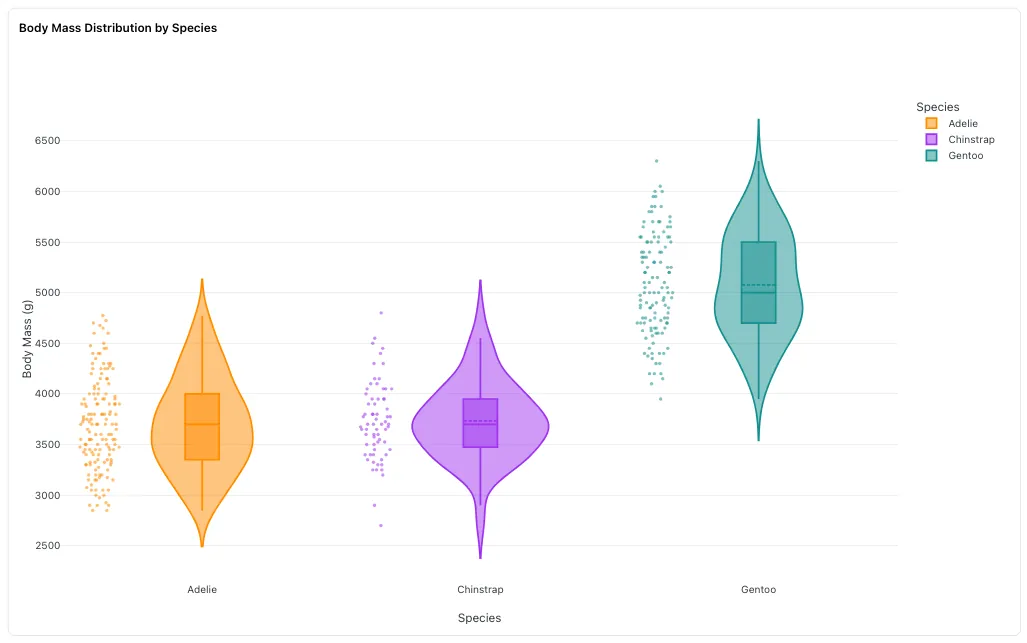
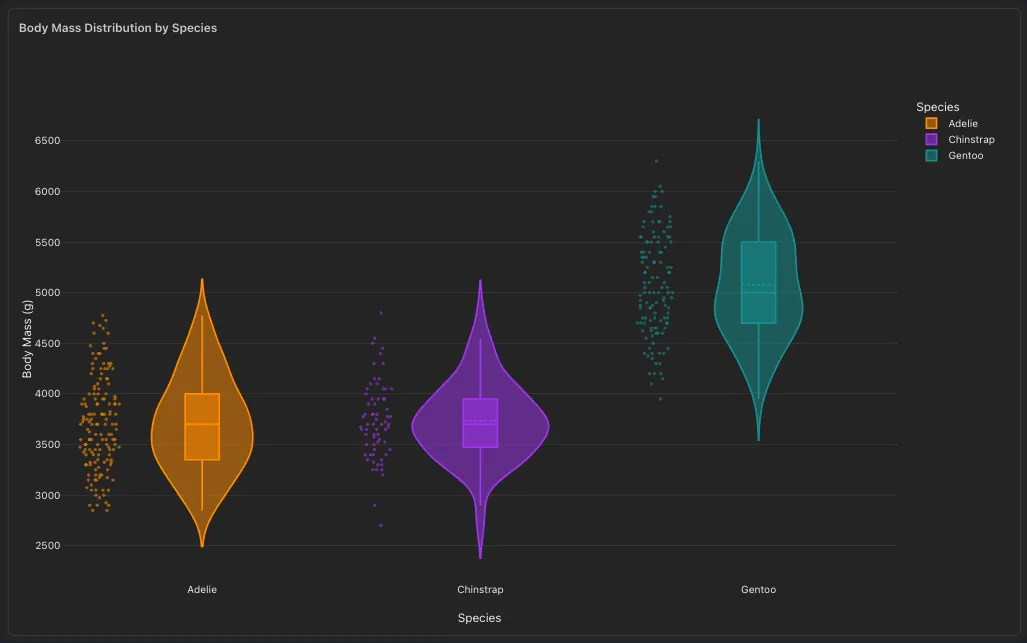
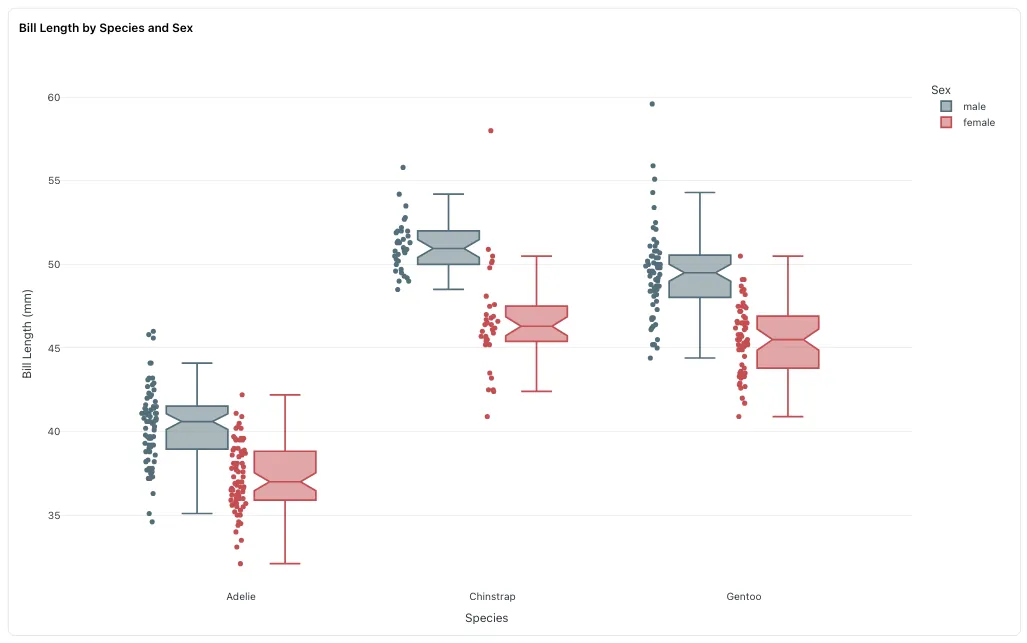
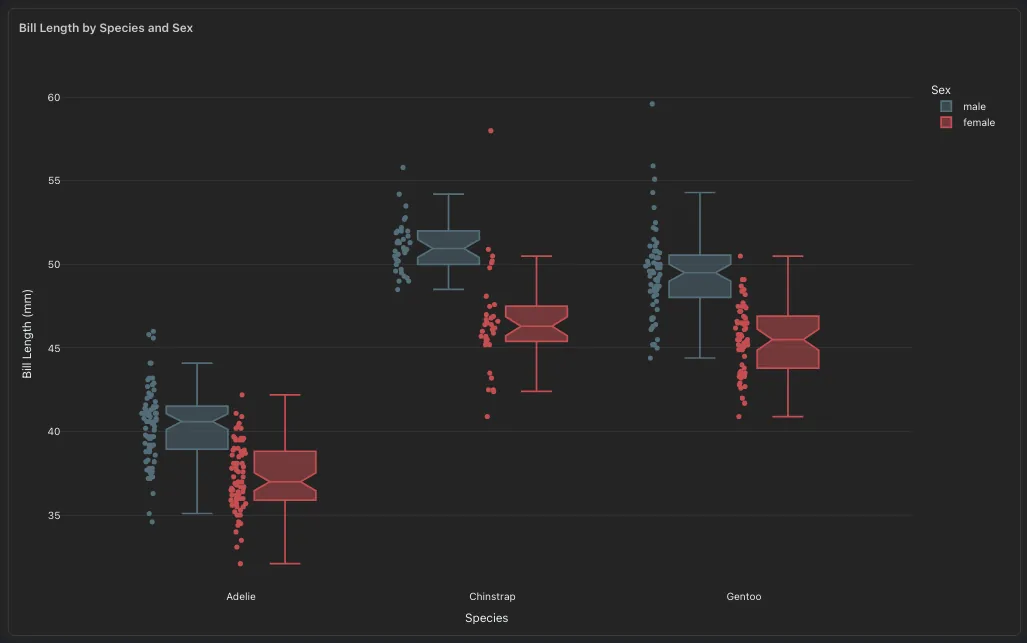
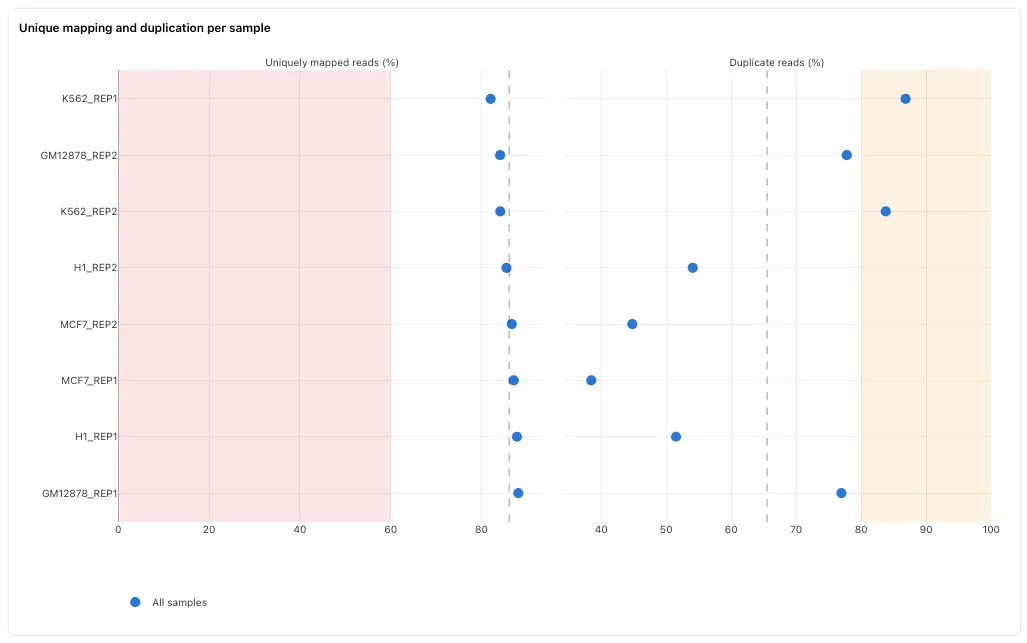
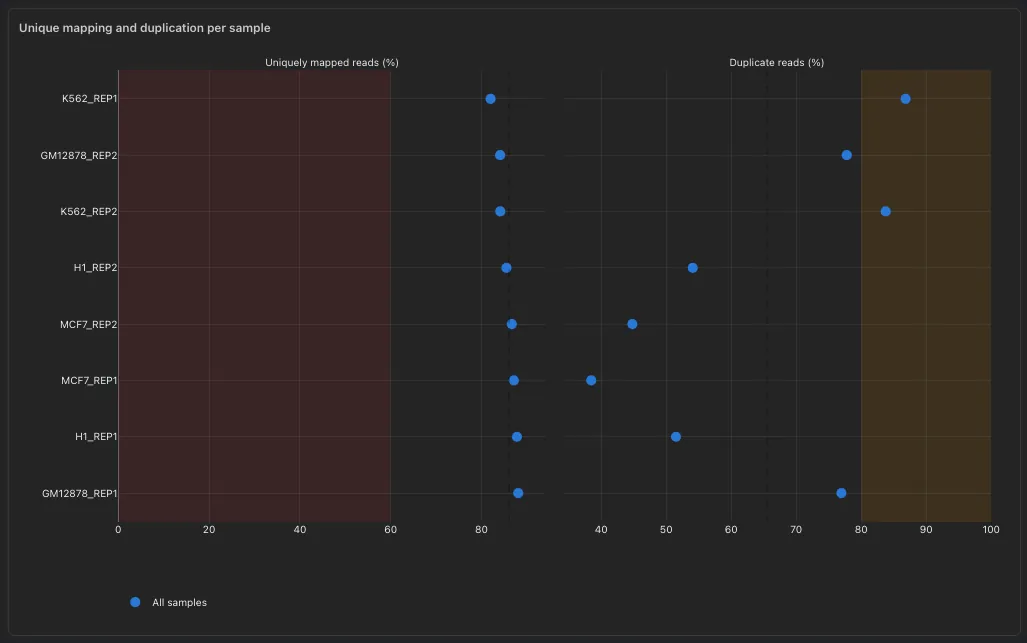
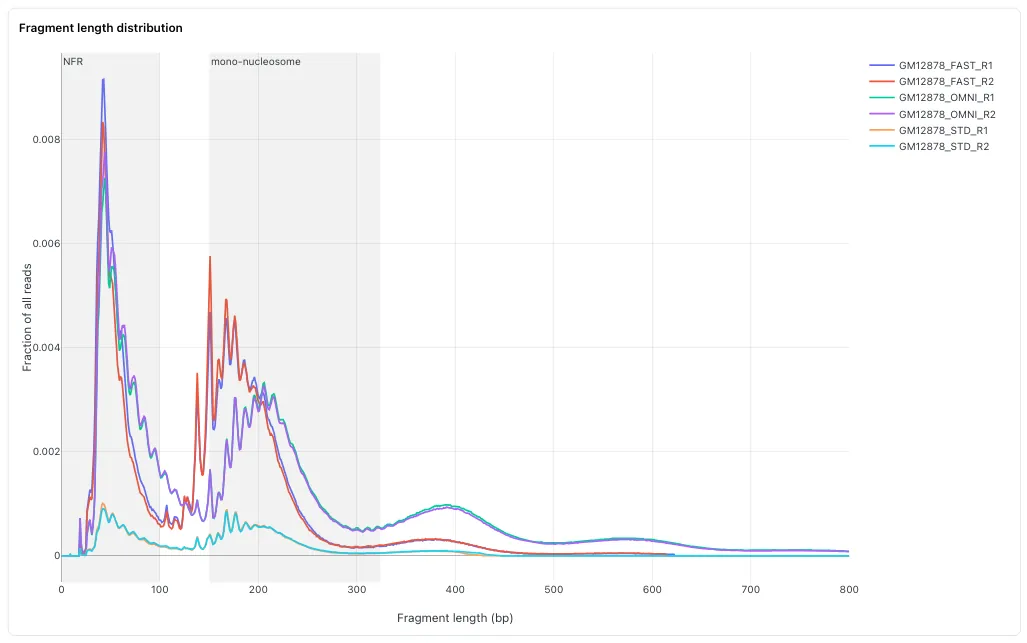
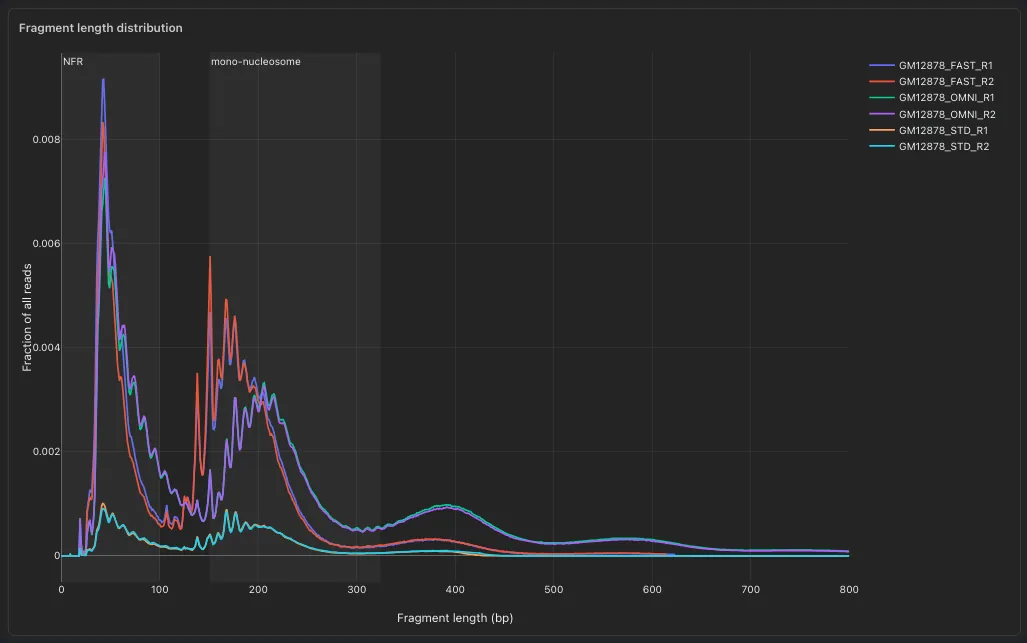
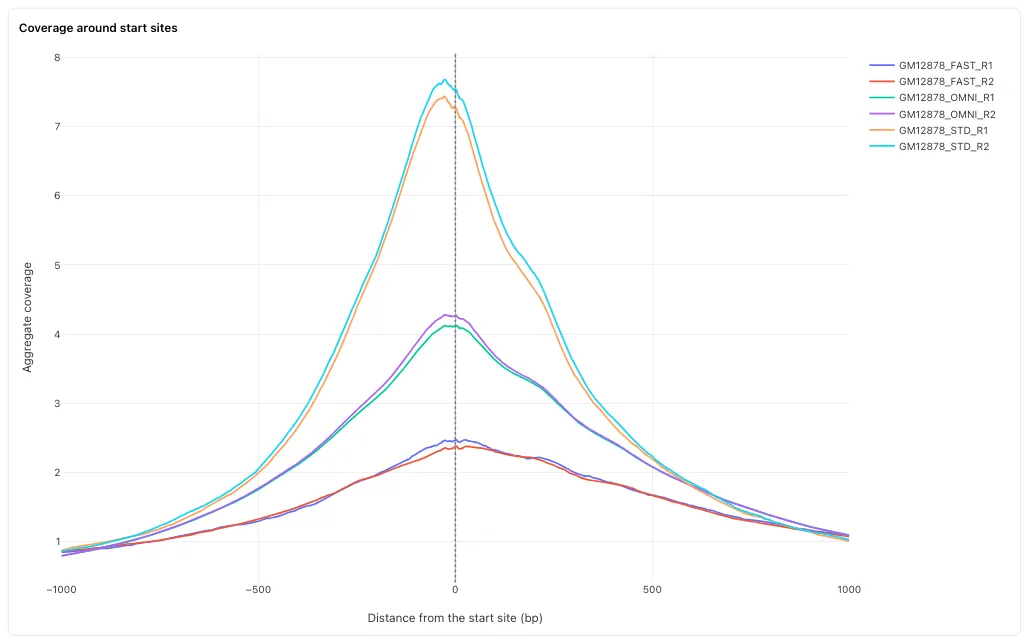
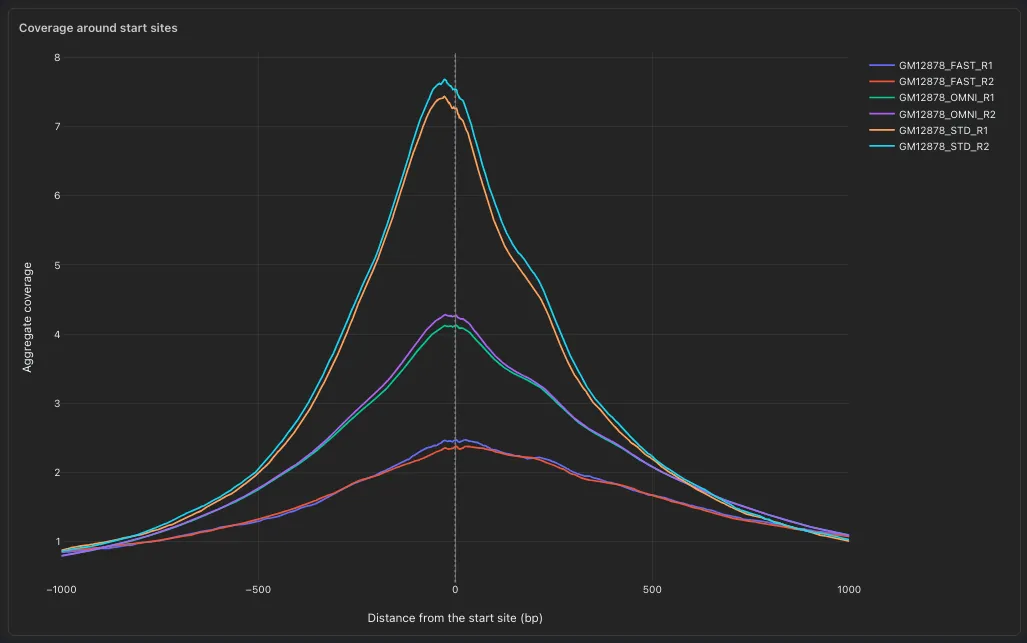
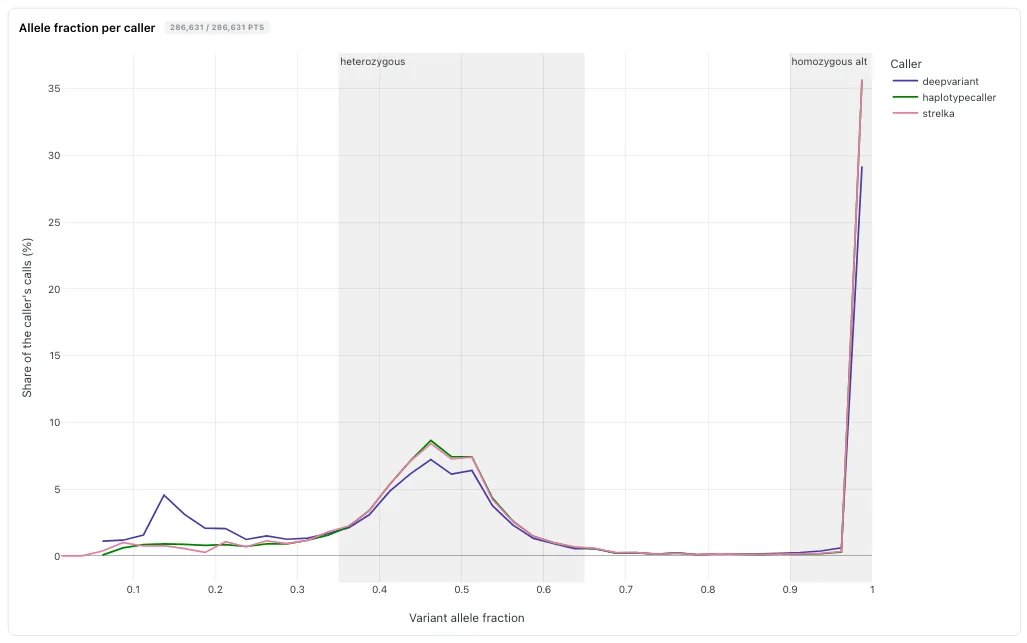
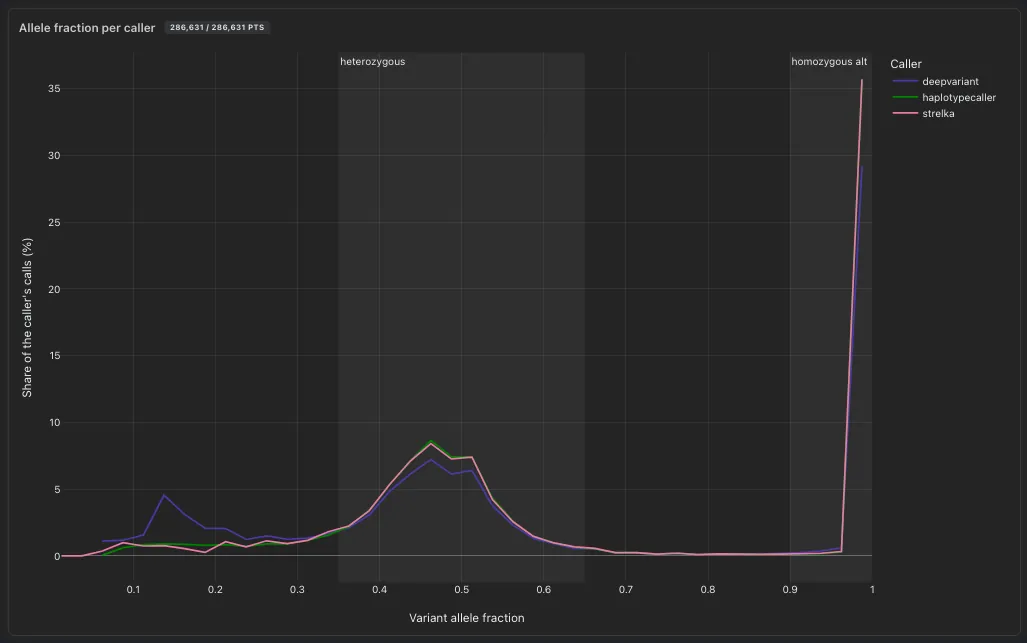
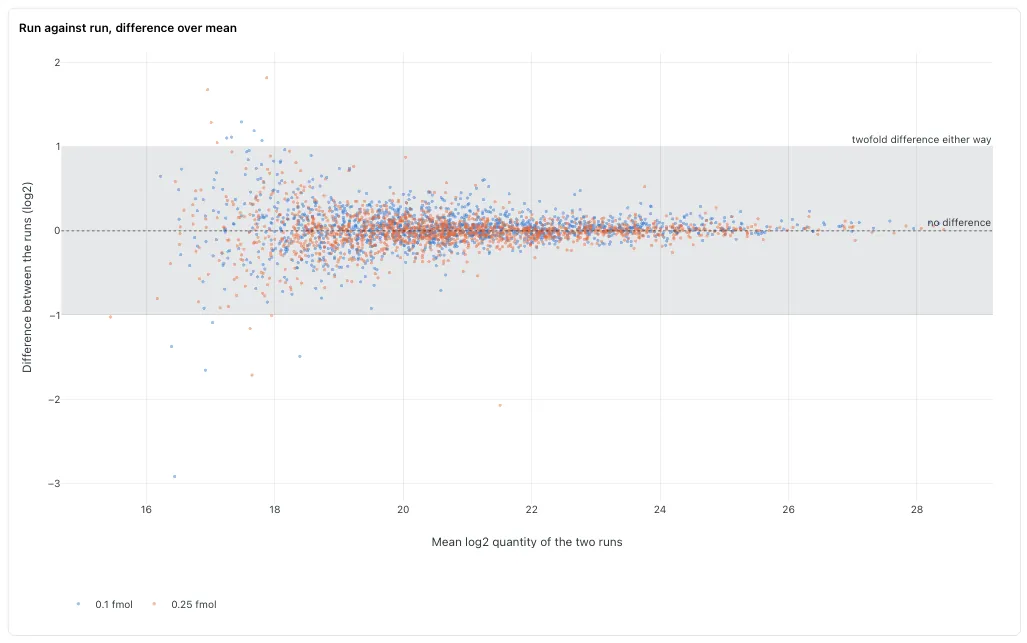
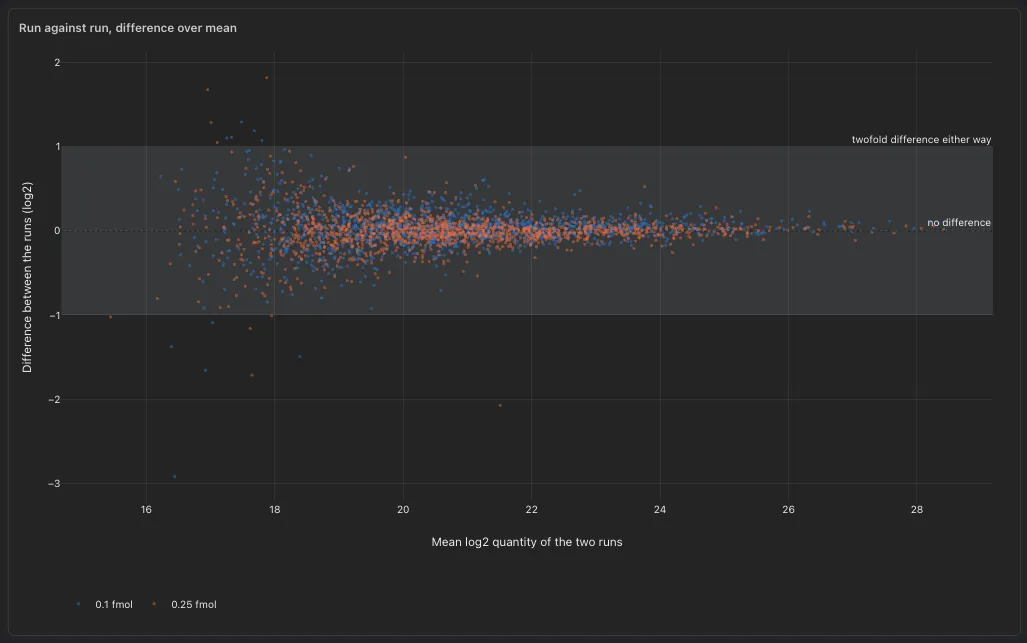
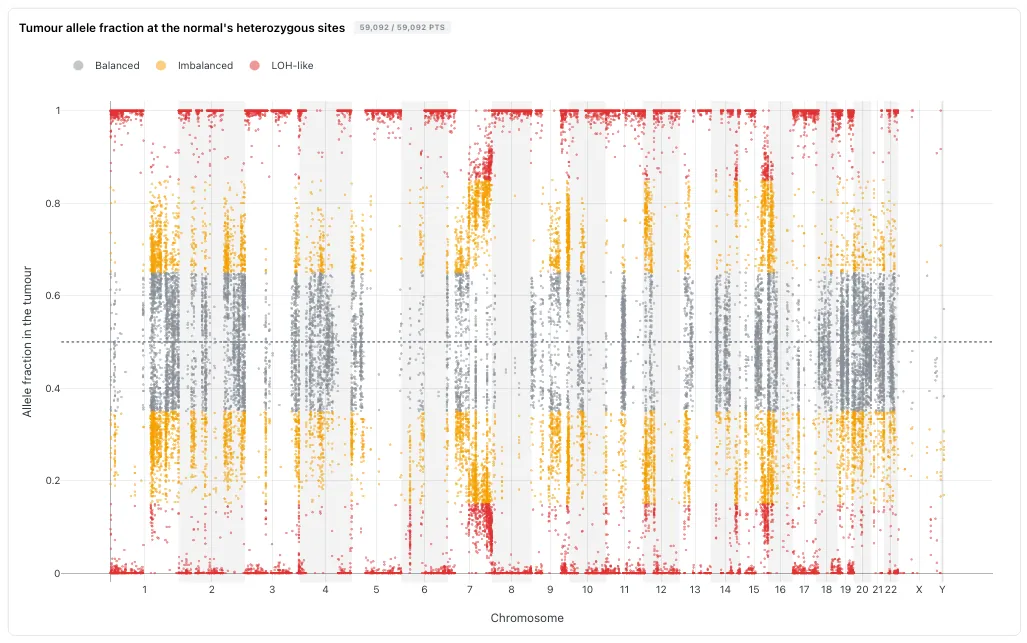
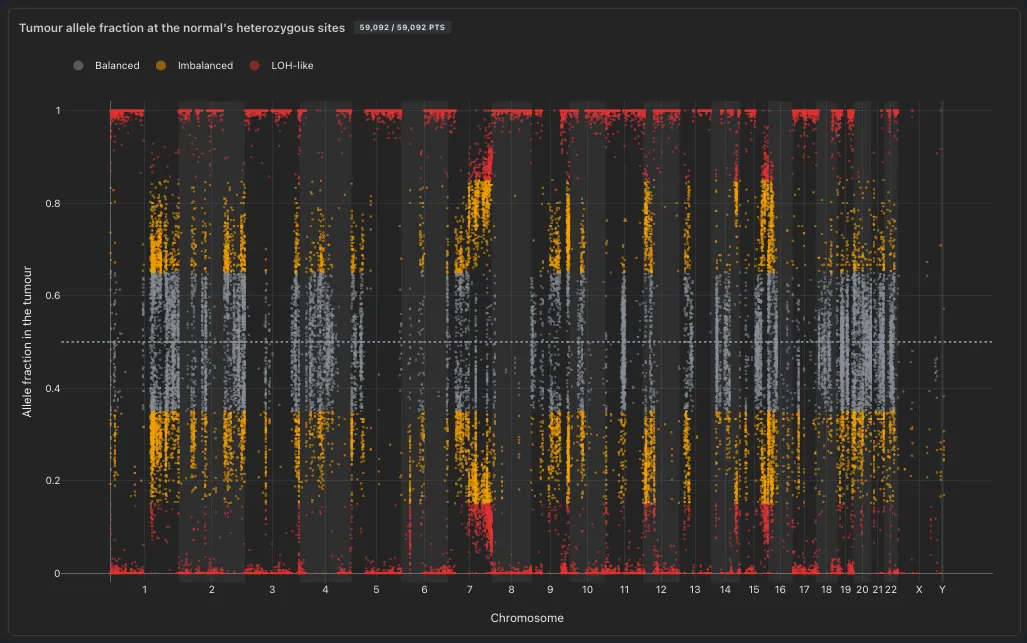
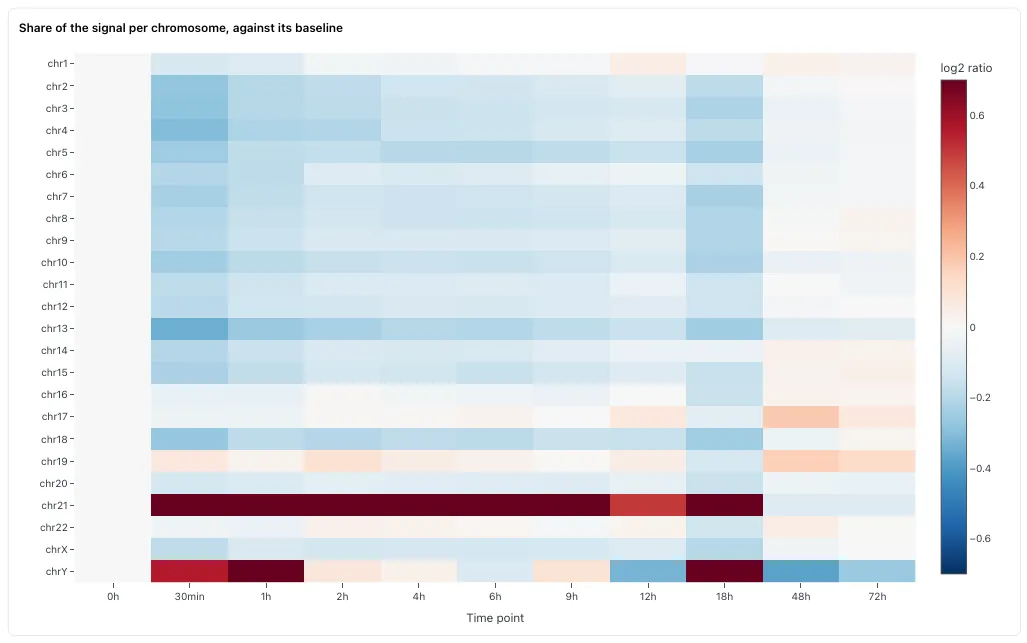
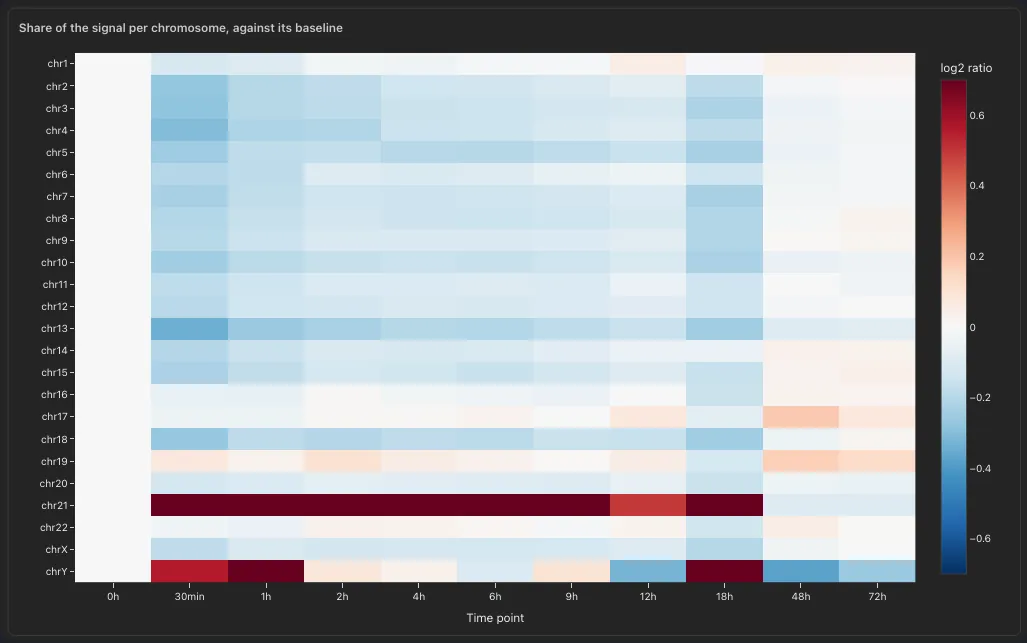
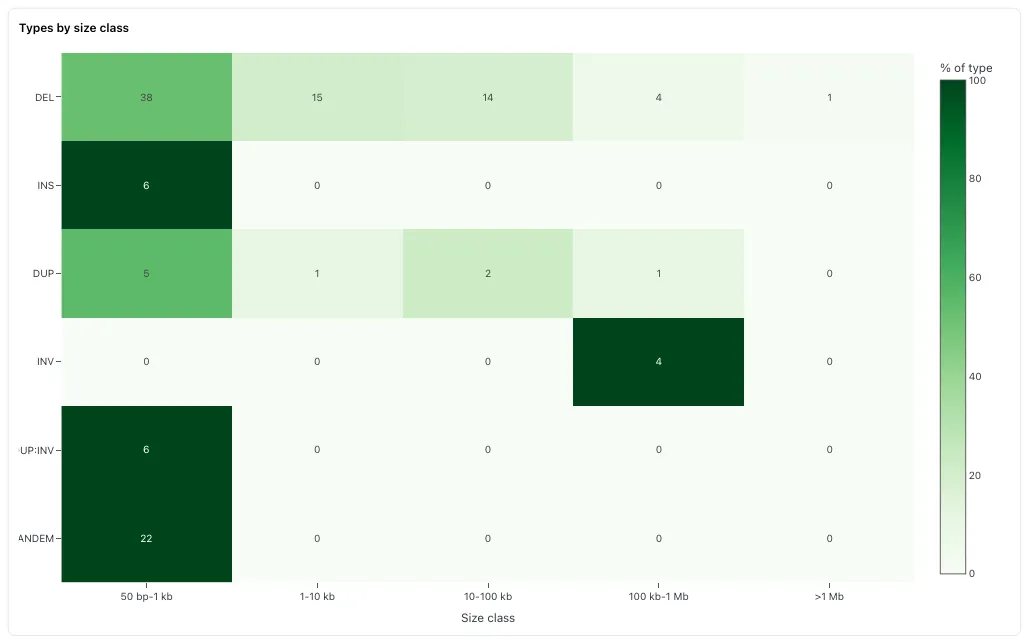
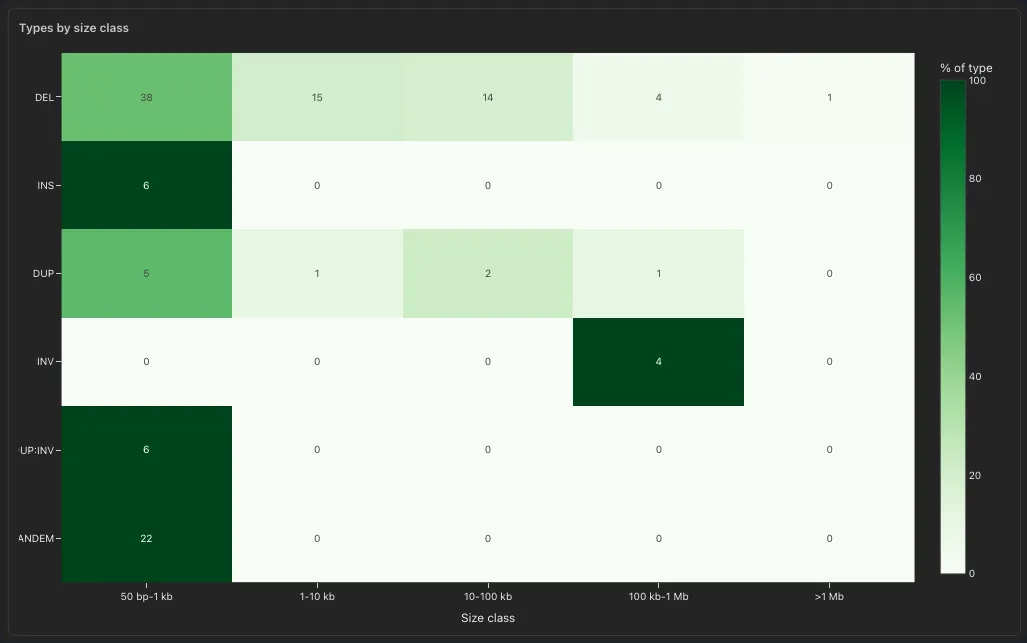
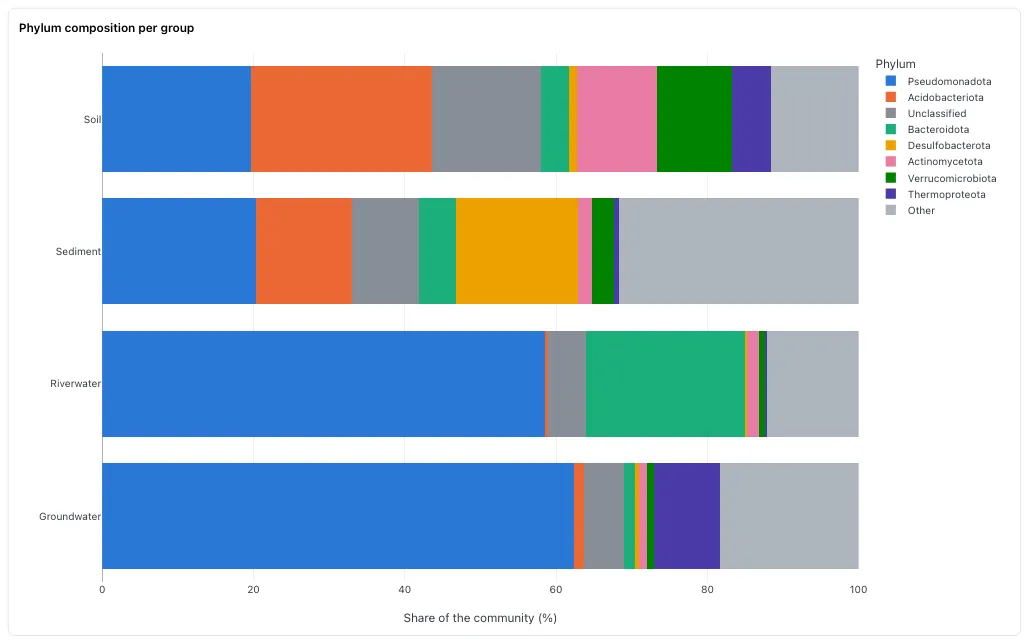
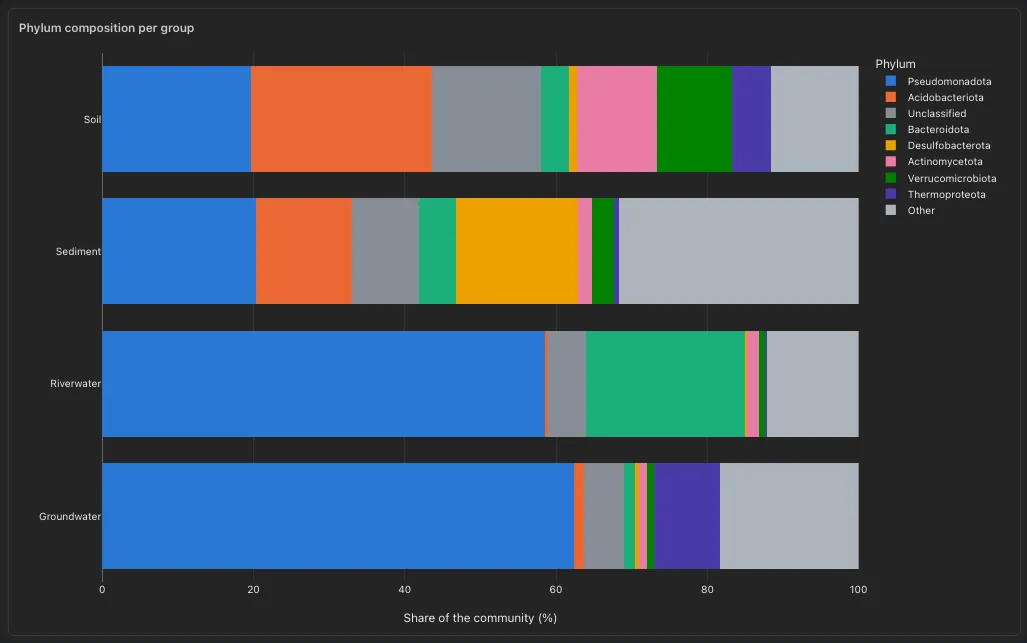
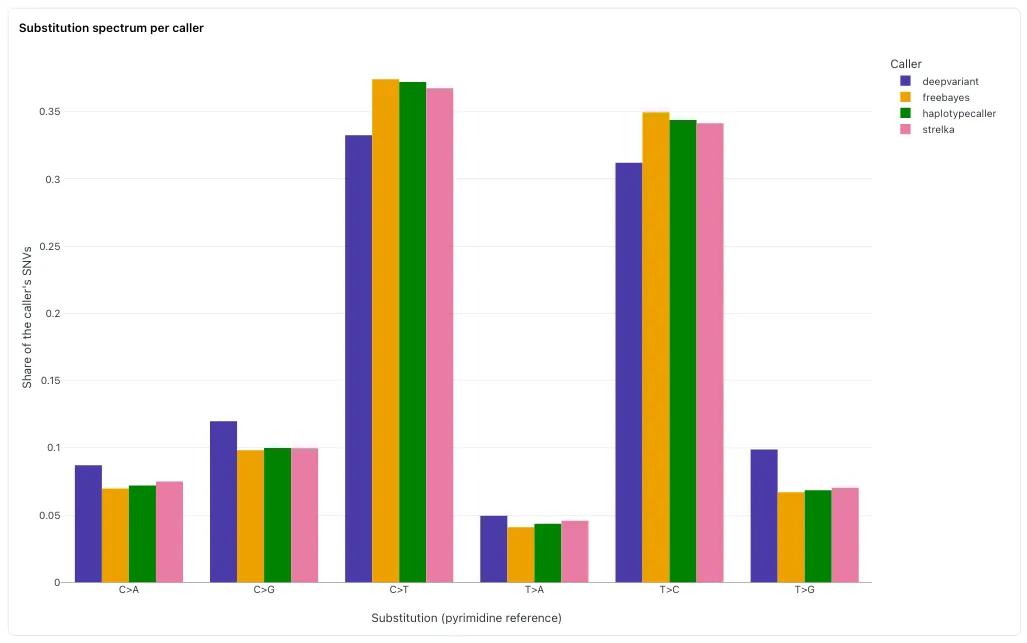
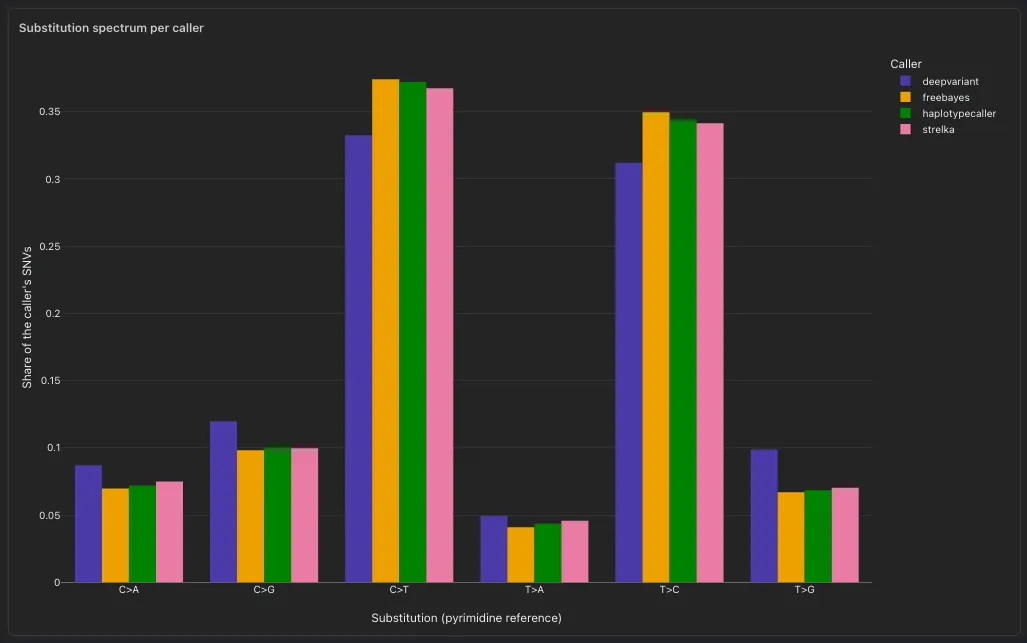
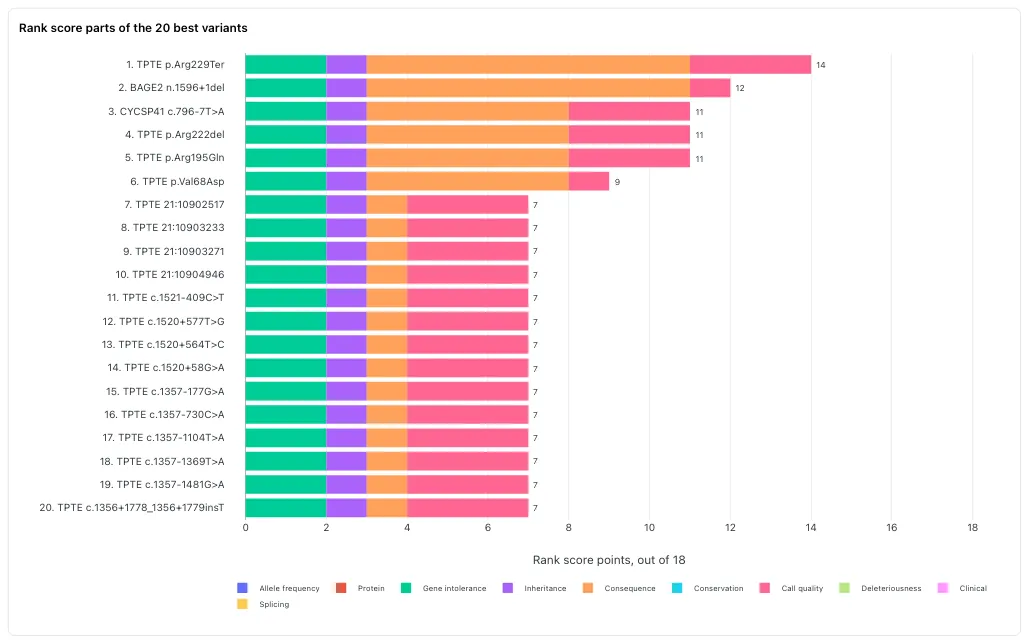
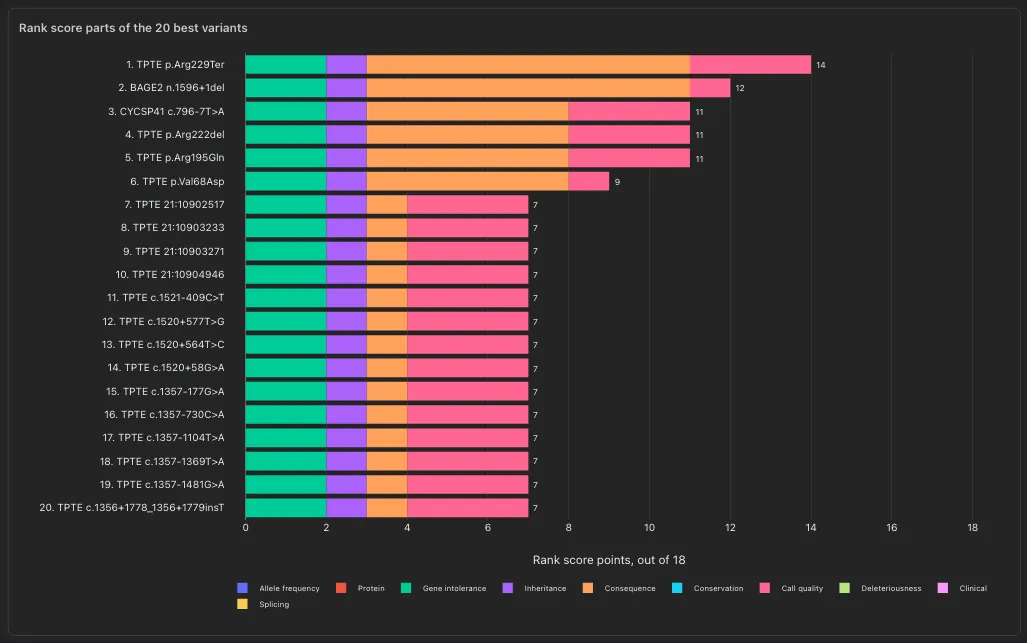
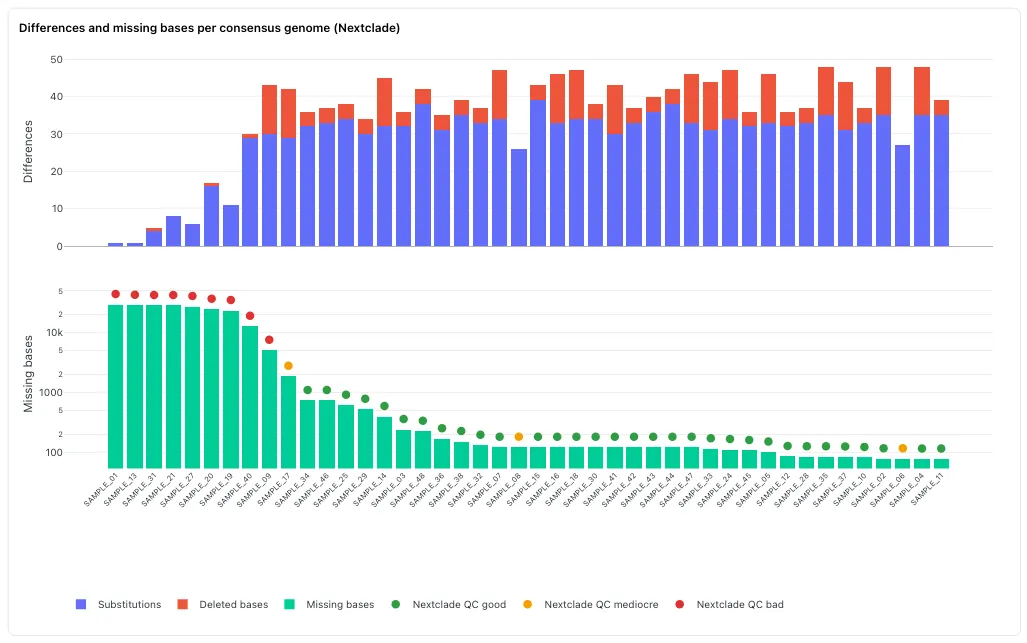
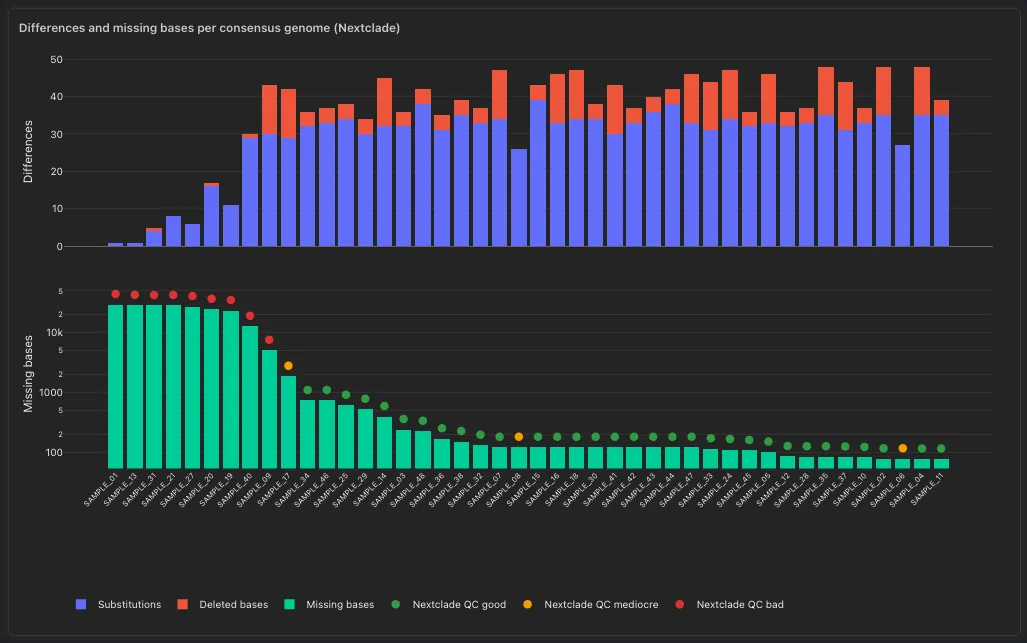
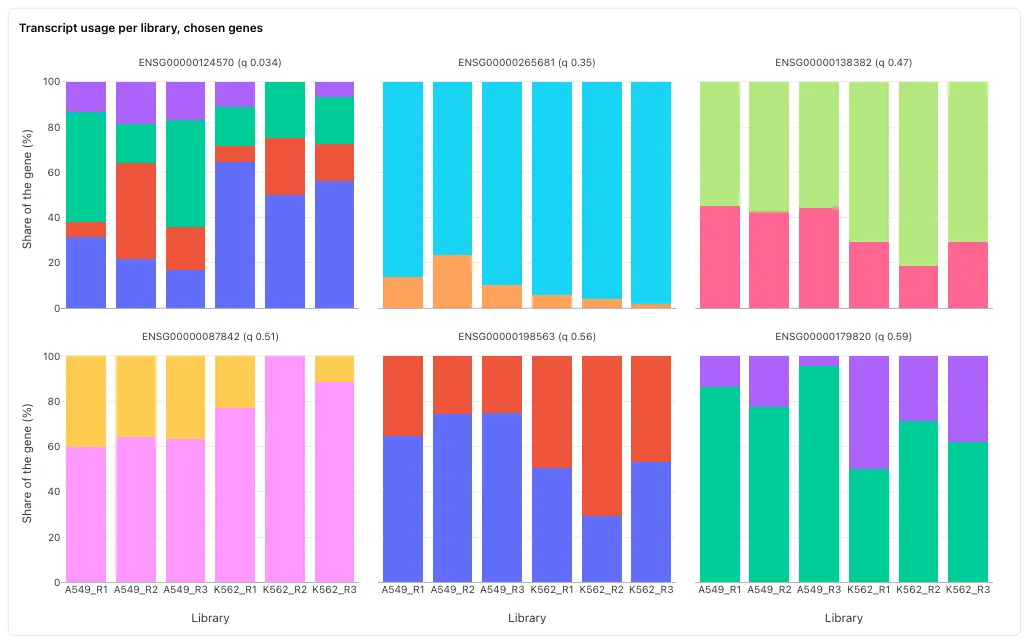
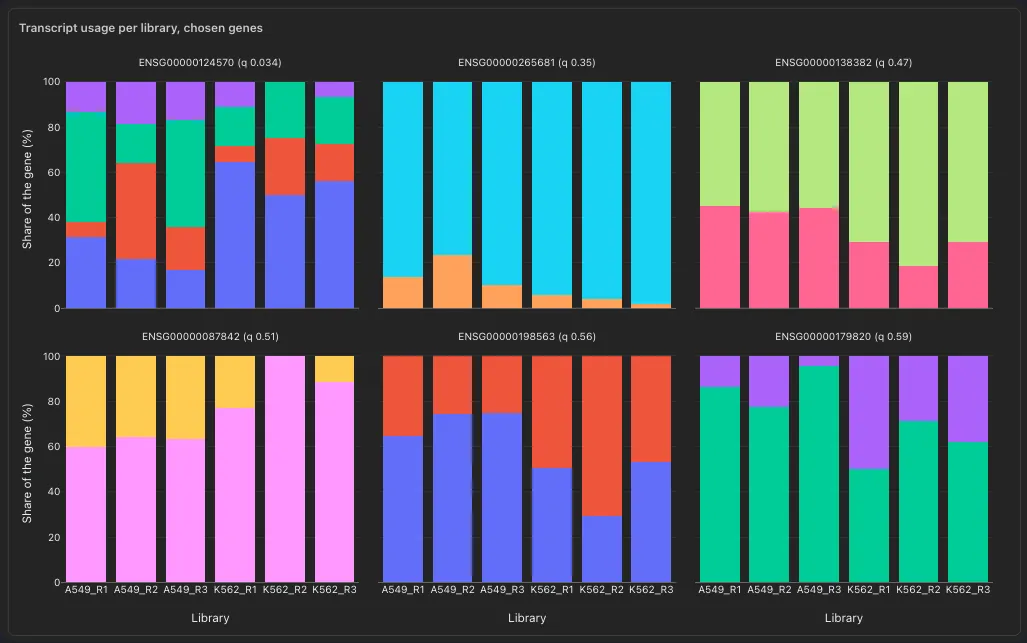
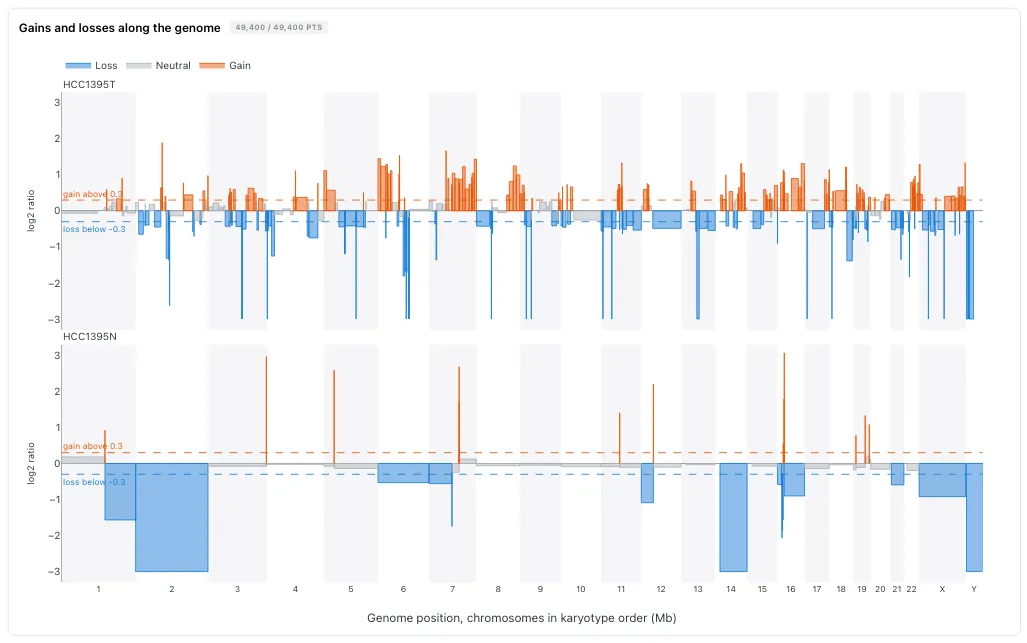
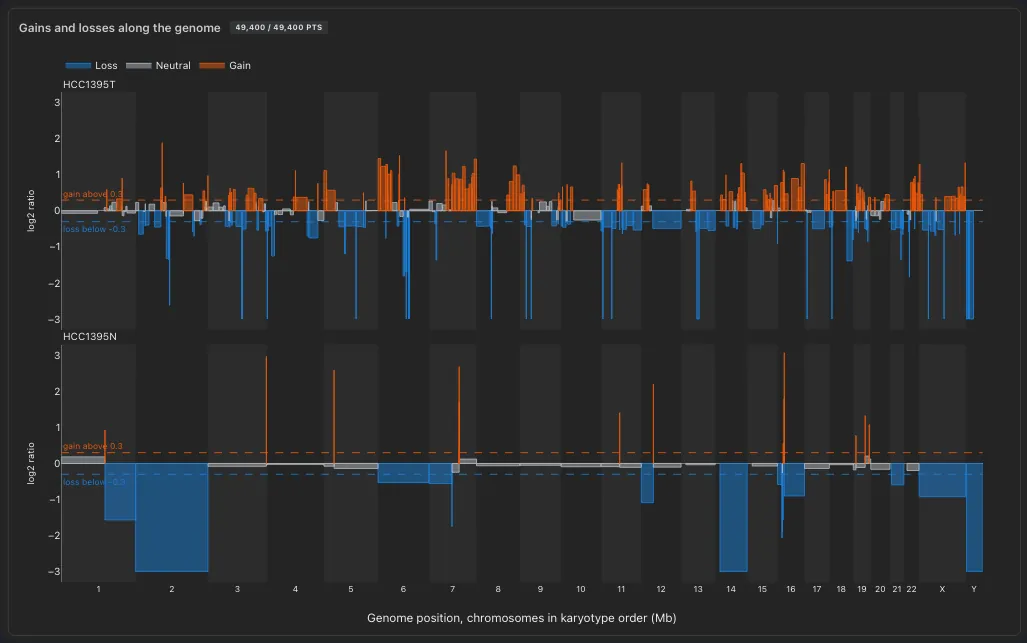
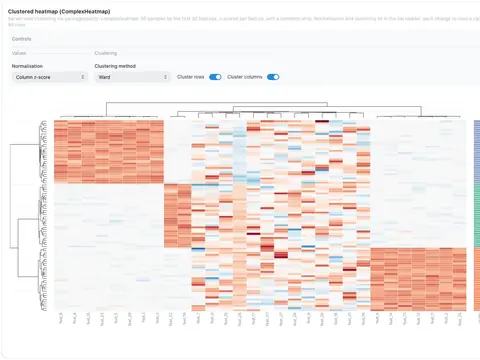
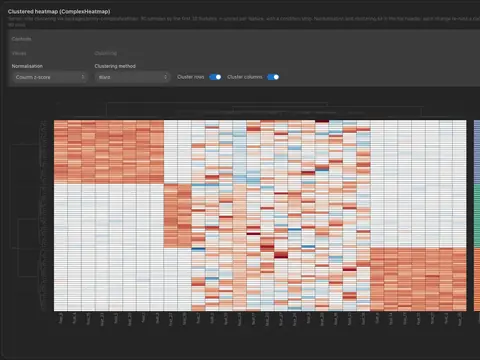
- Scatter, bar, line, histogram, box and ComplexHeatmap from the editor
- Code mode takes any Plotly Express call
- A click or a lasso on a scatter filters the dashboard
Advanced viz
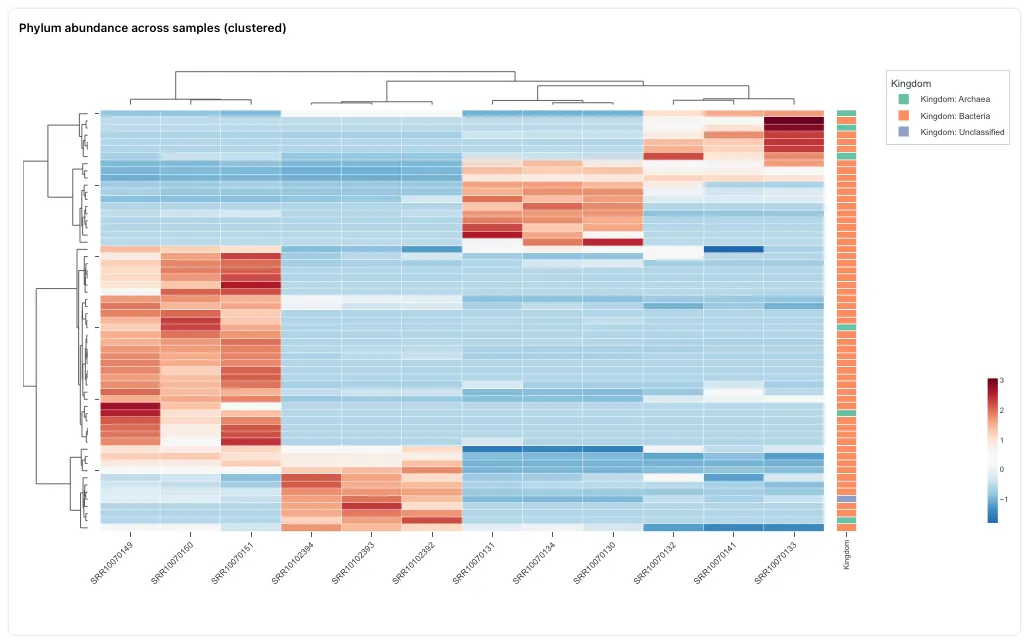
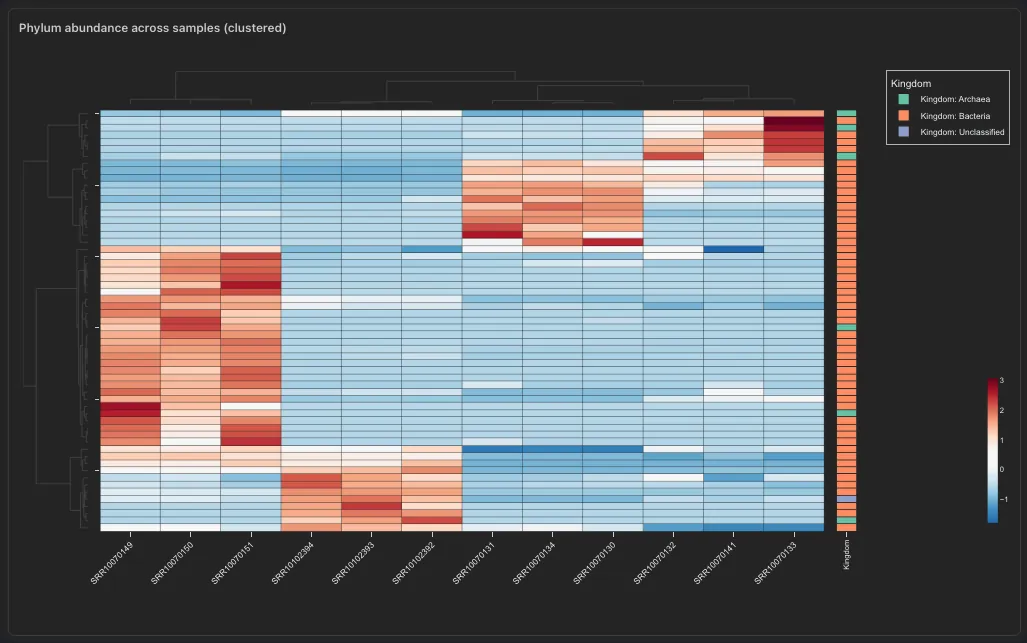
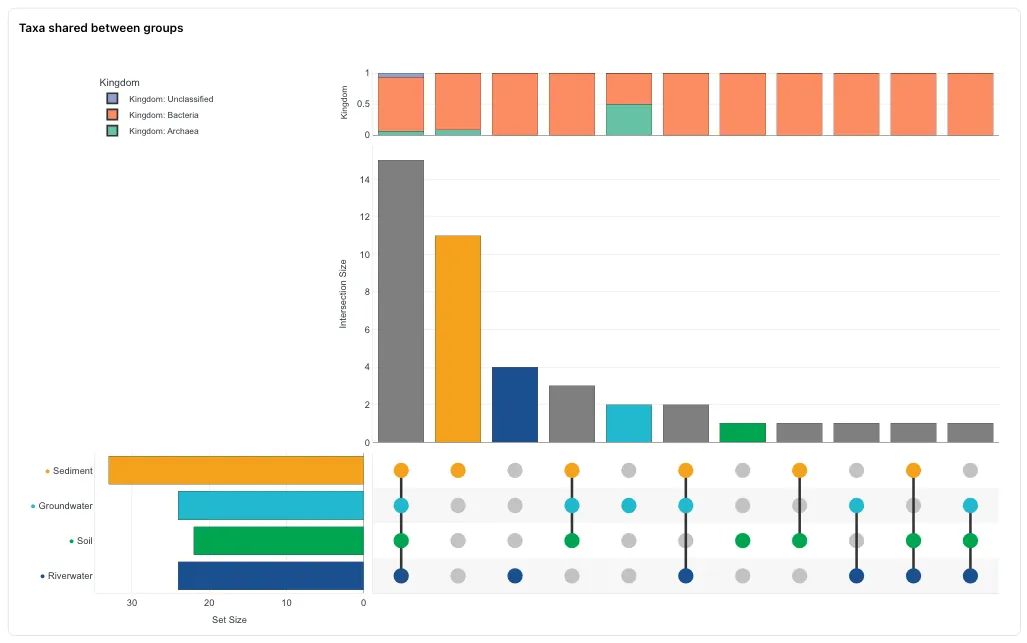
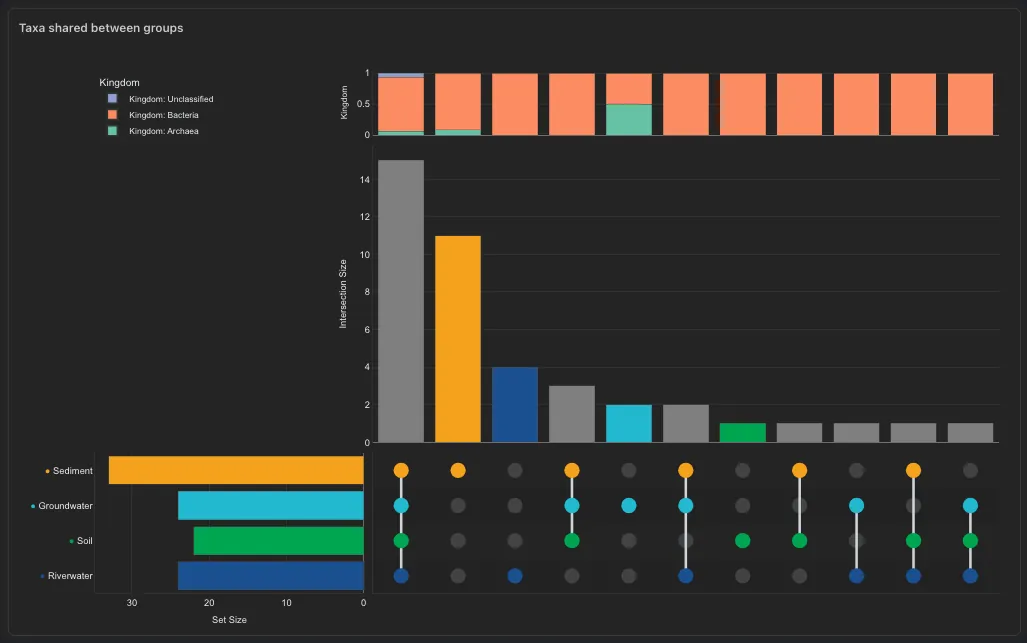
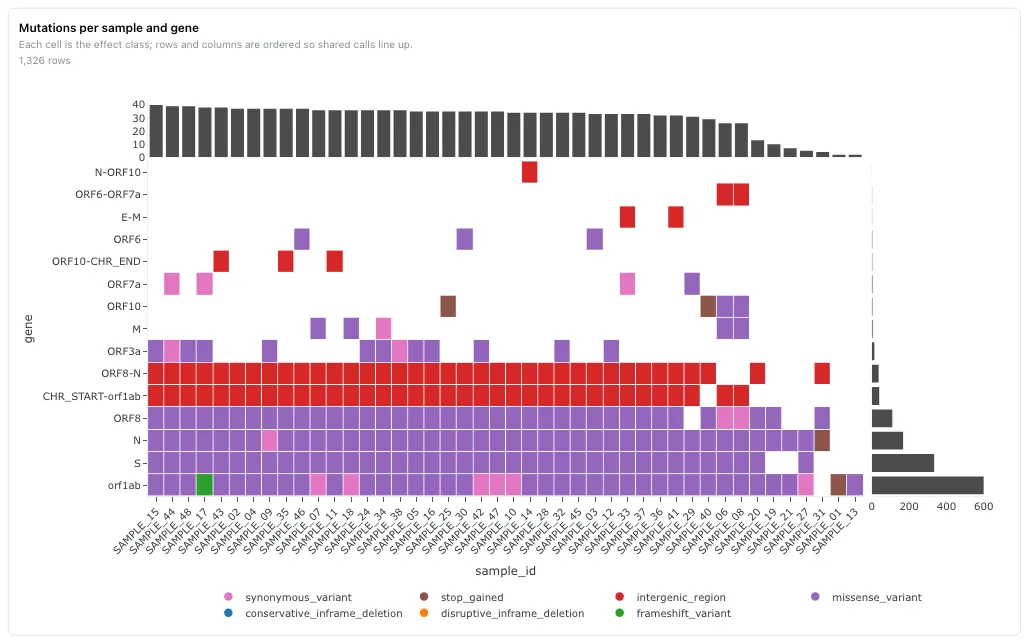
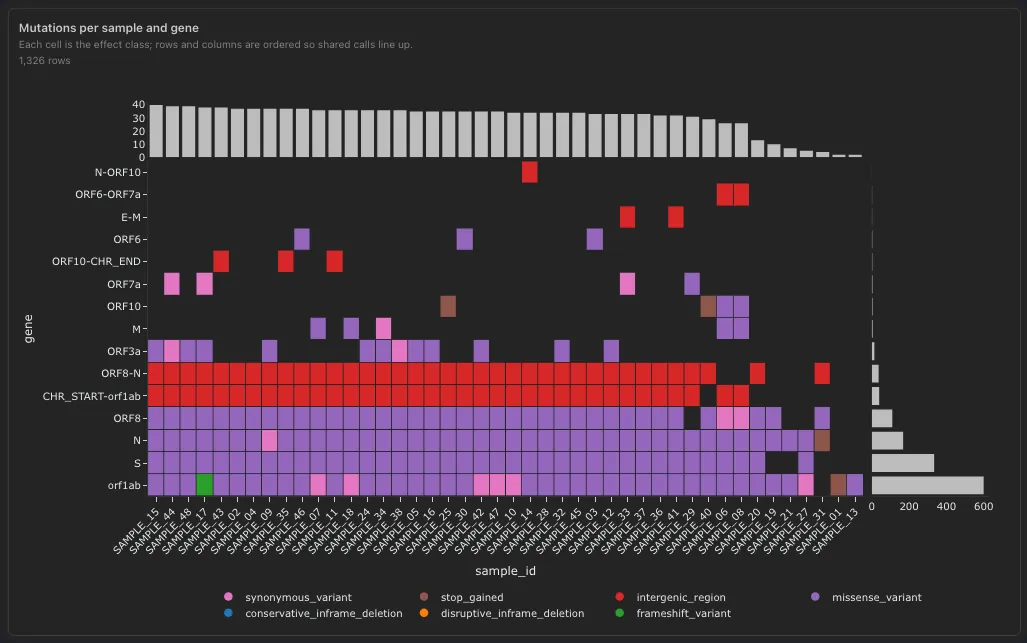
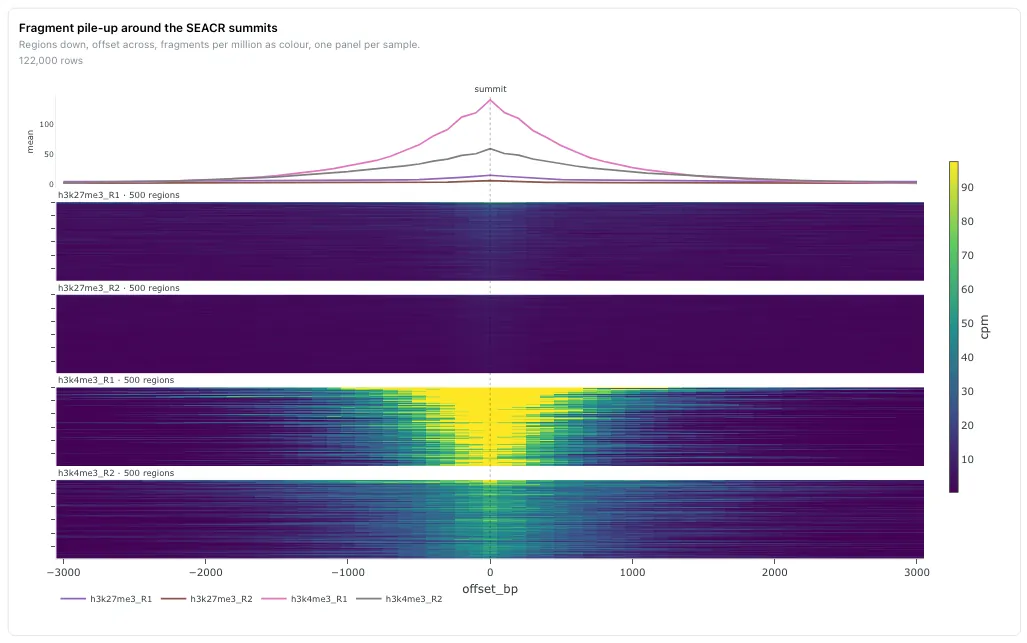
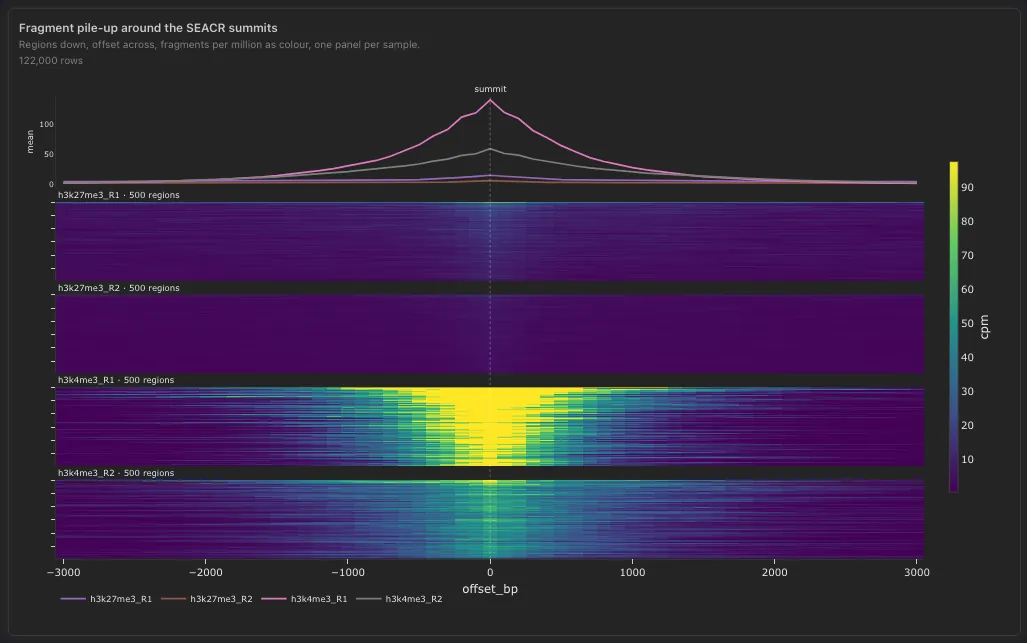
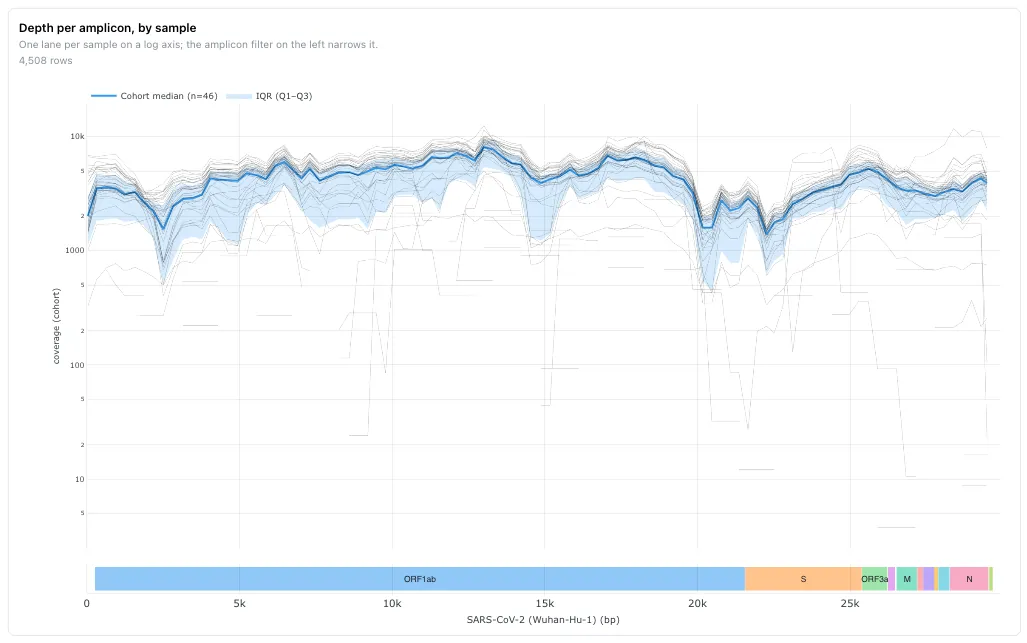
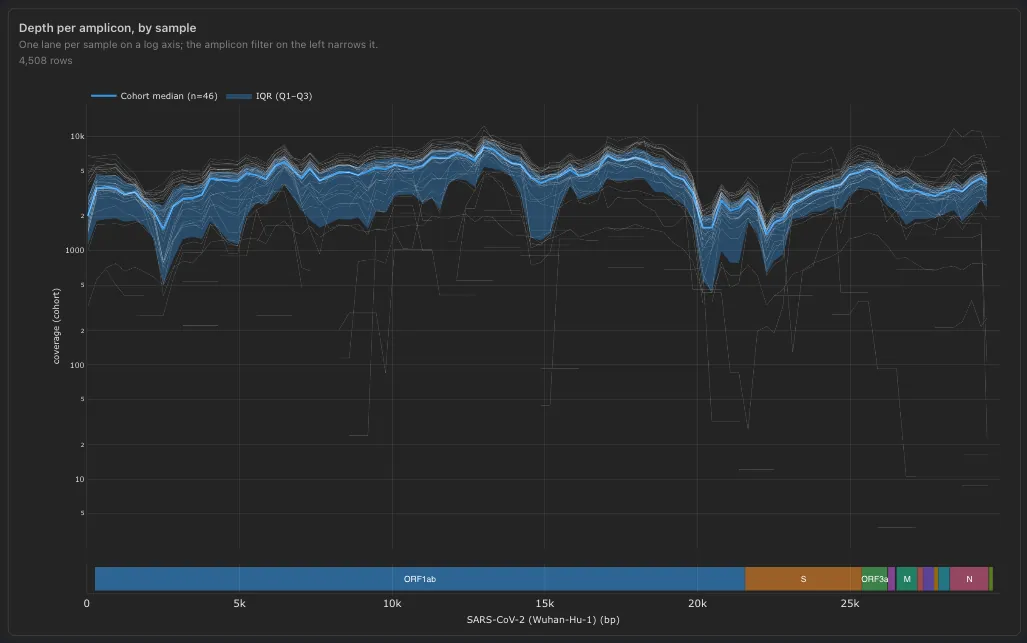
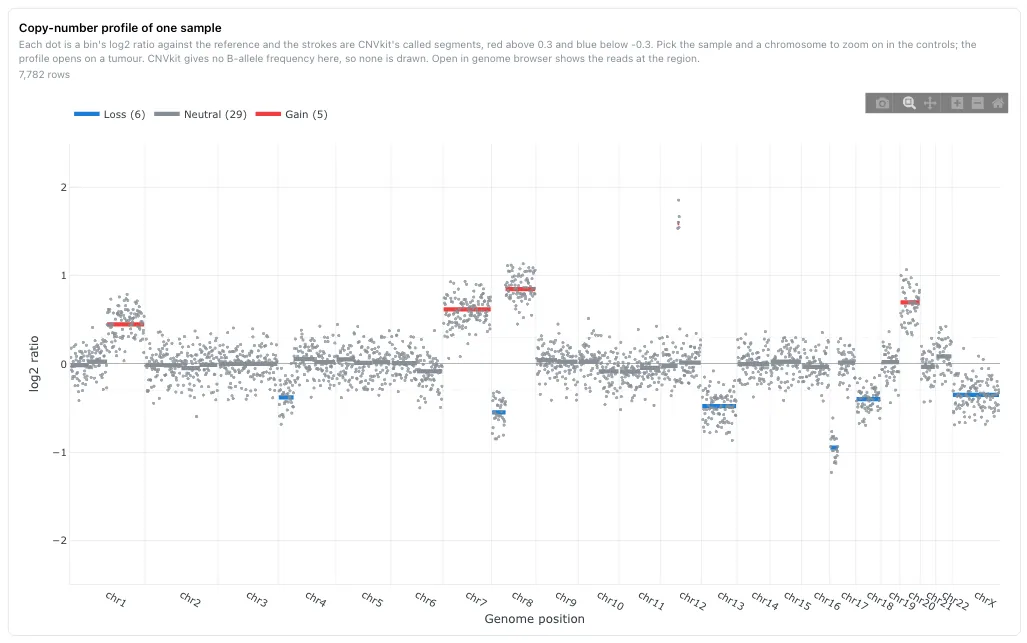
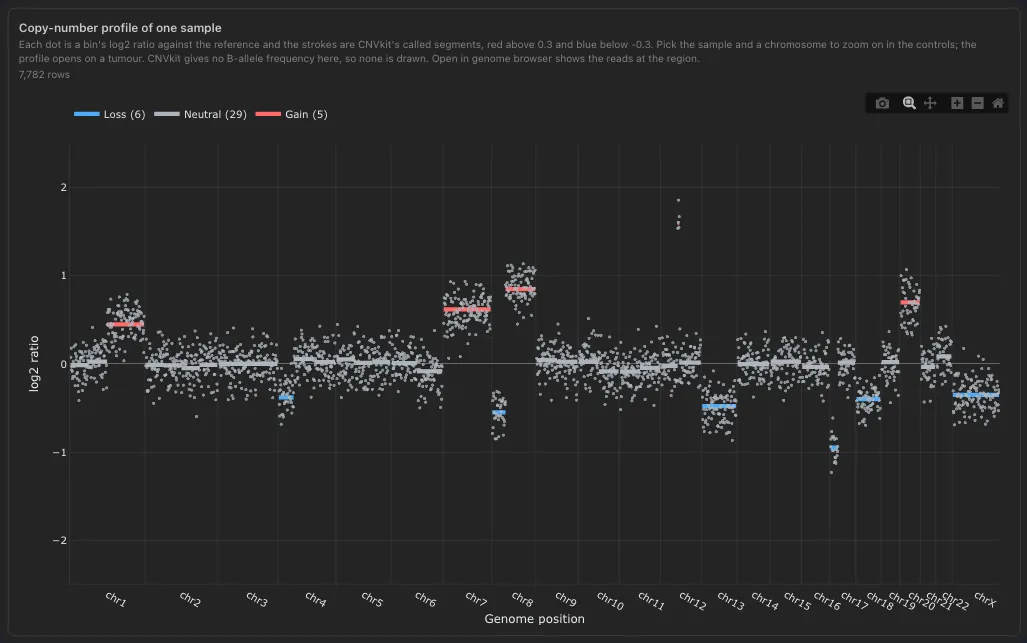
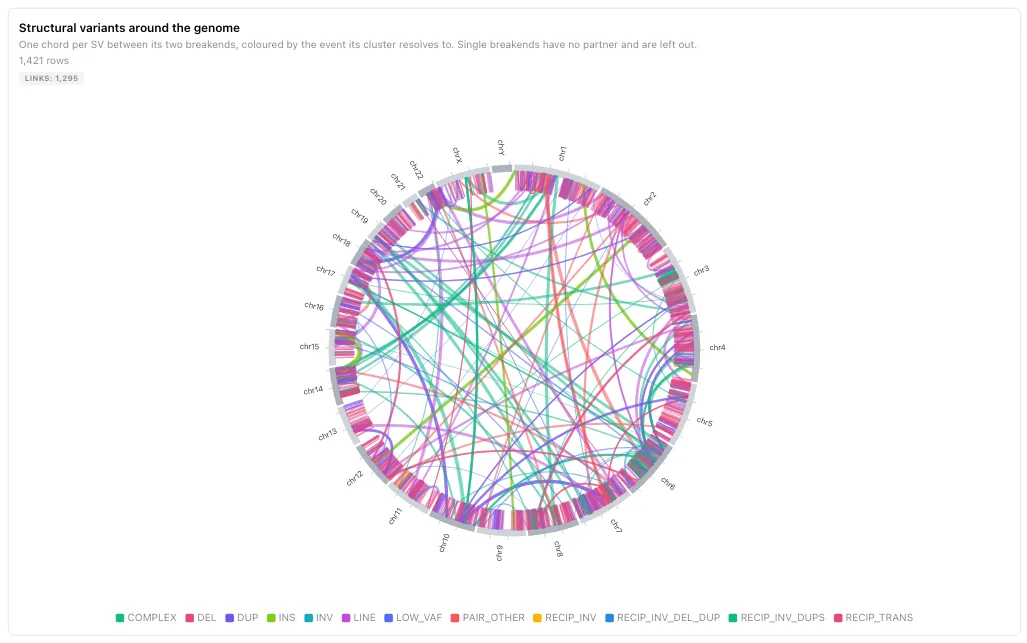
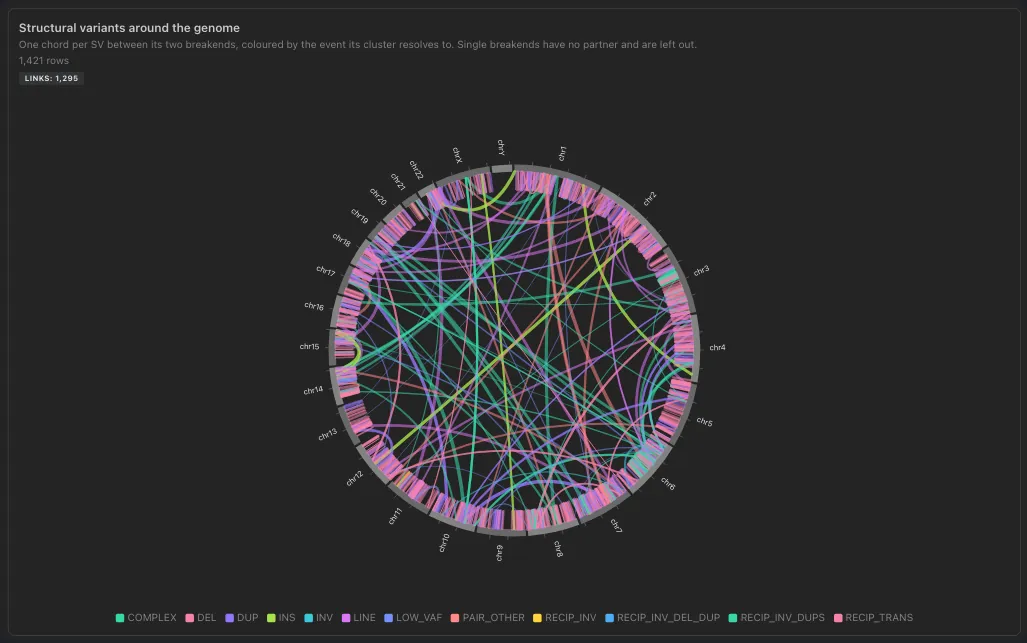
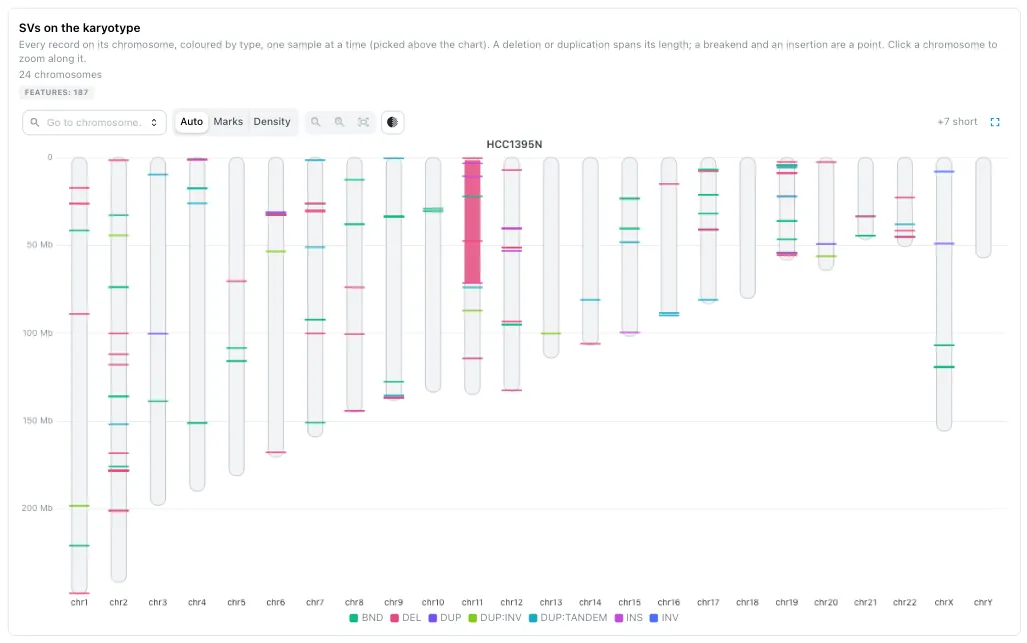
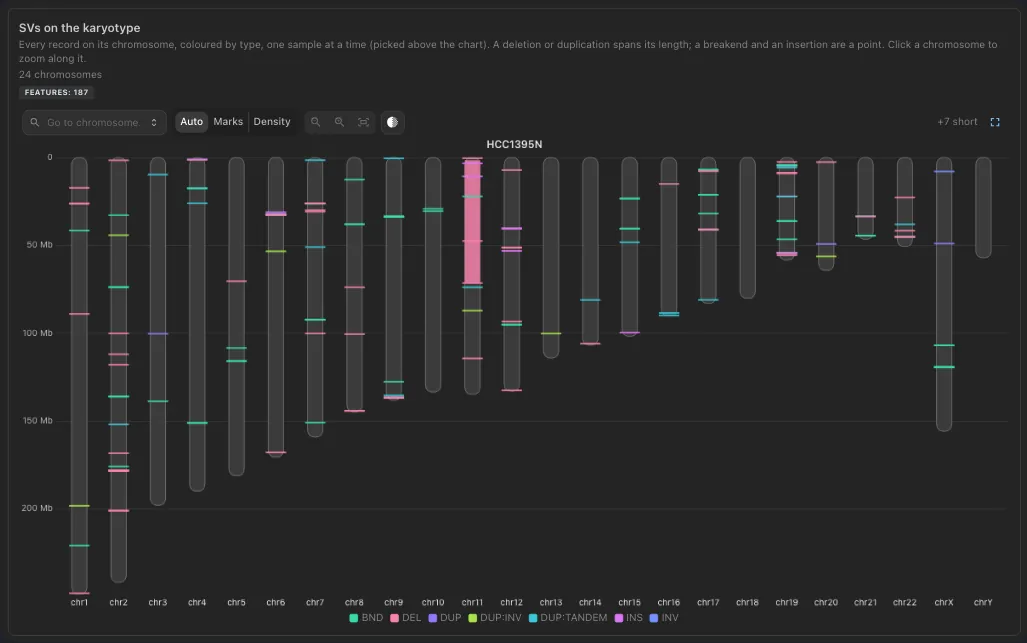
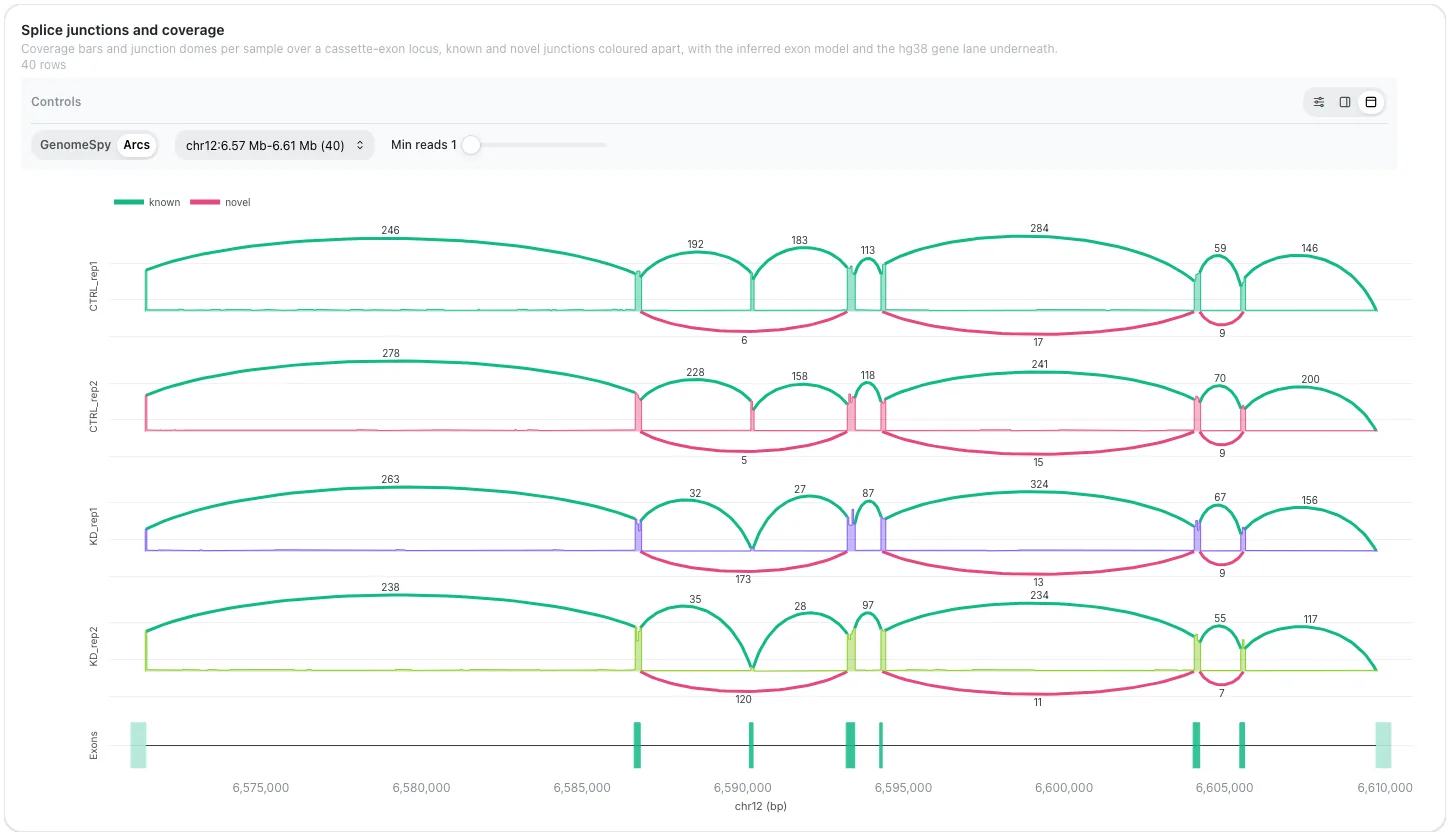
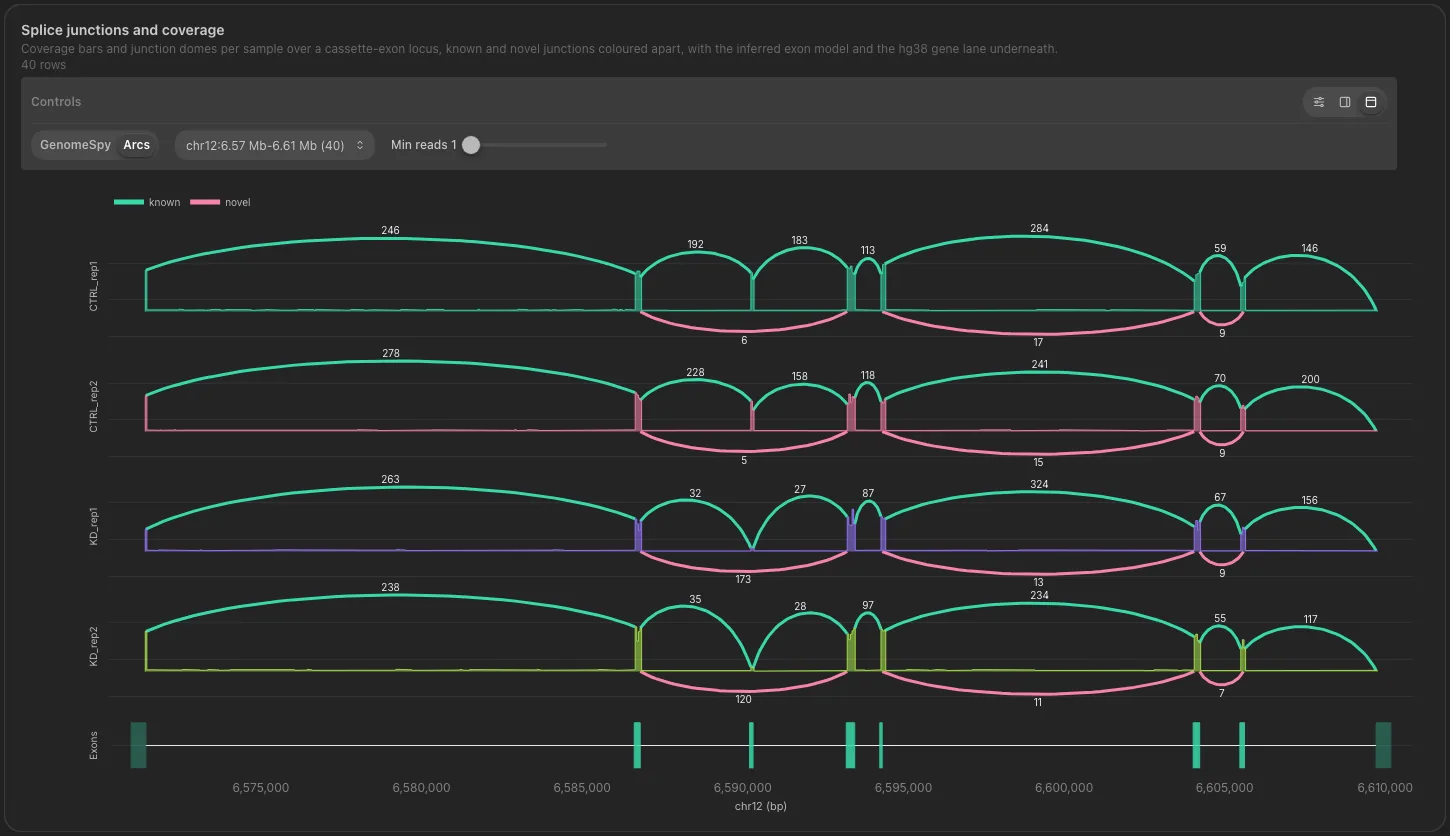
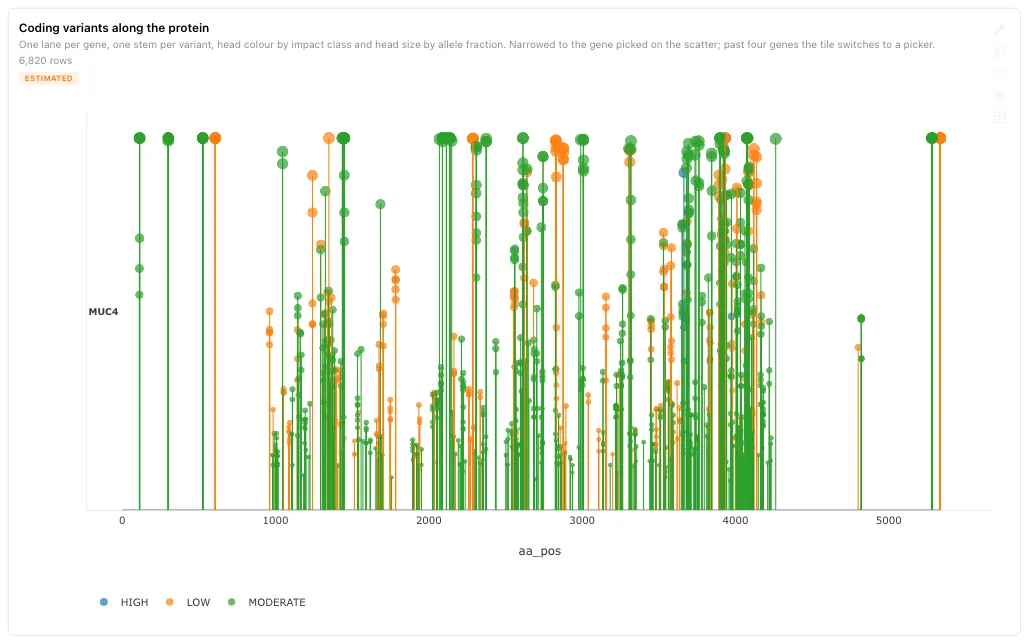
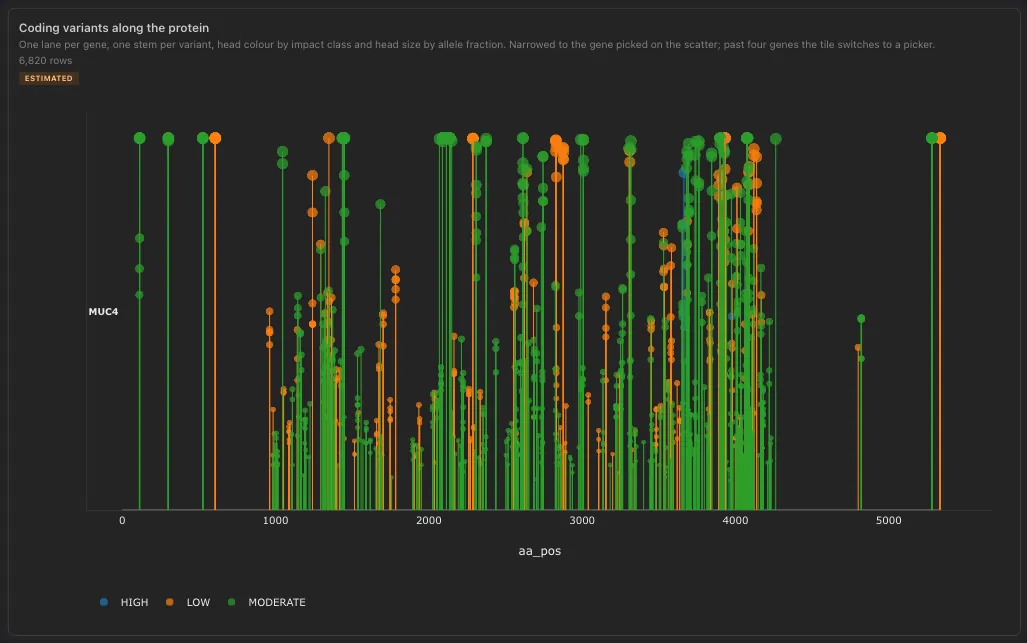
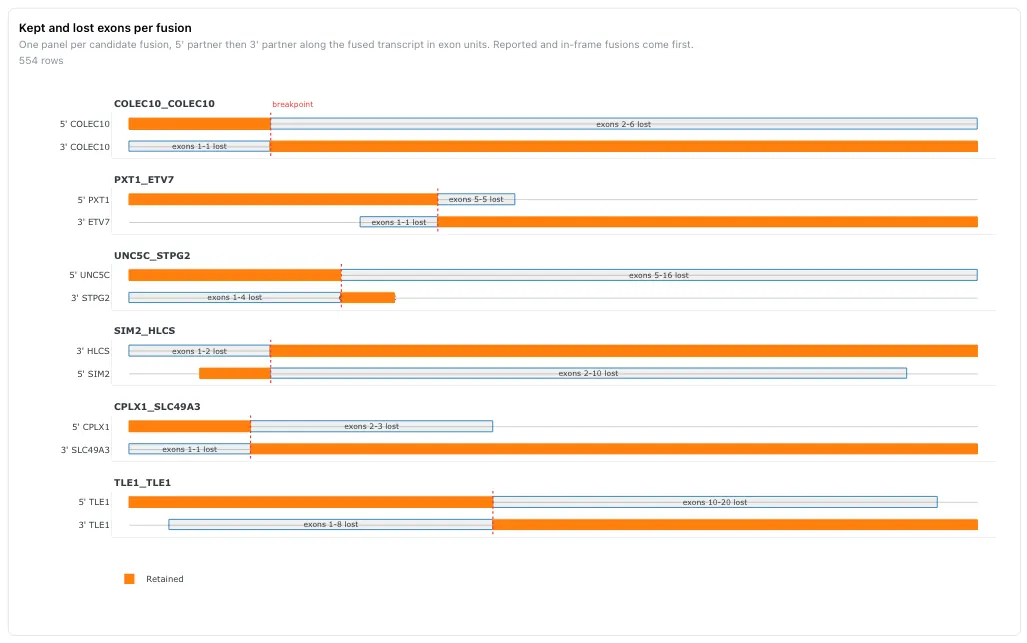
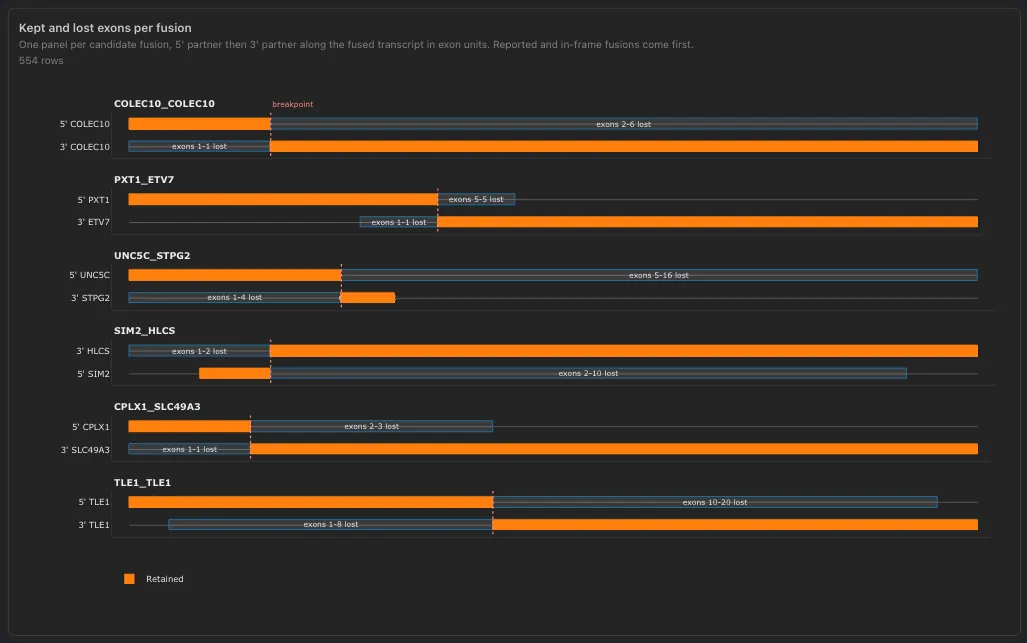
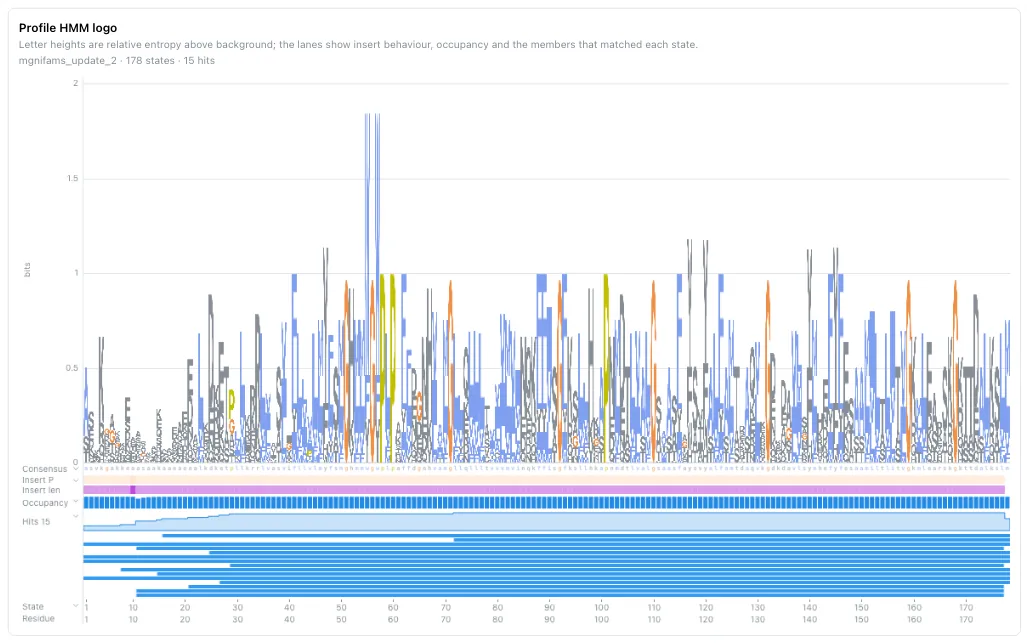
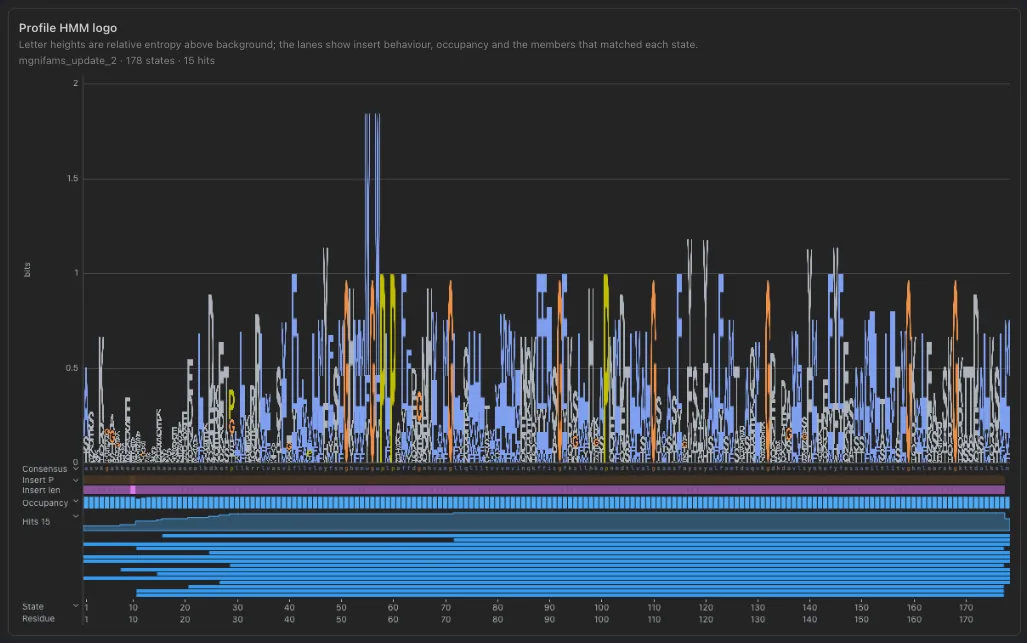
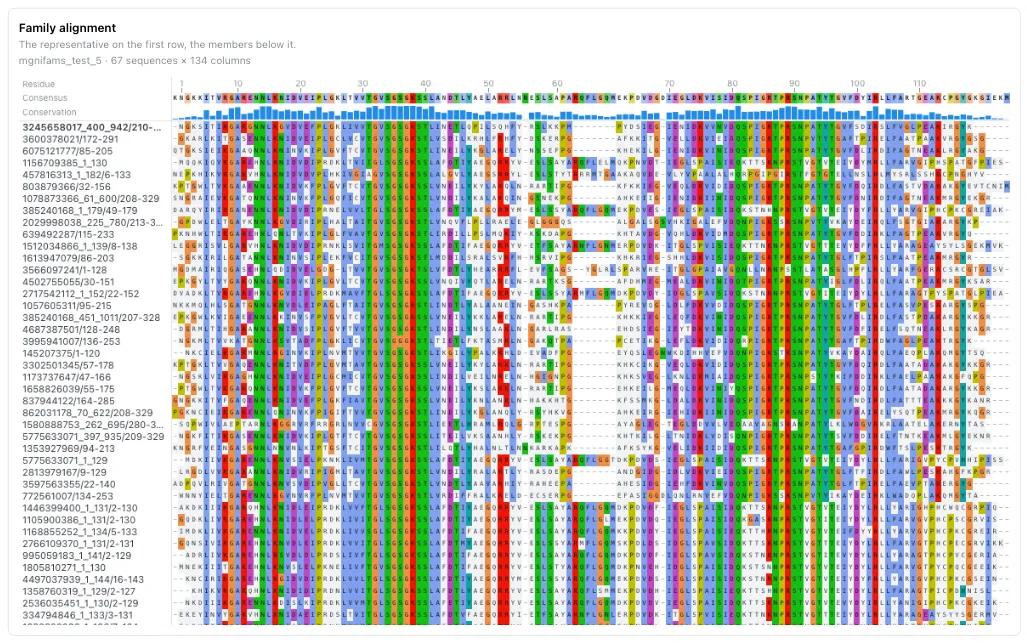
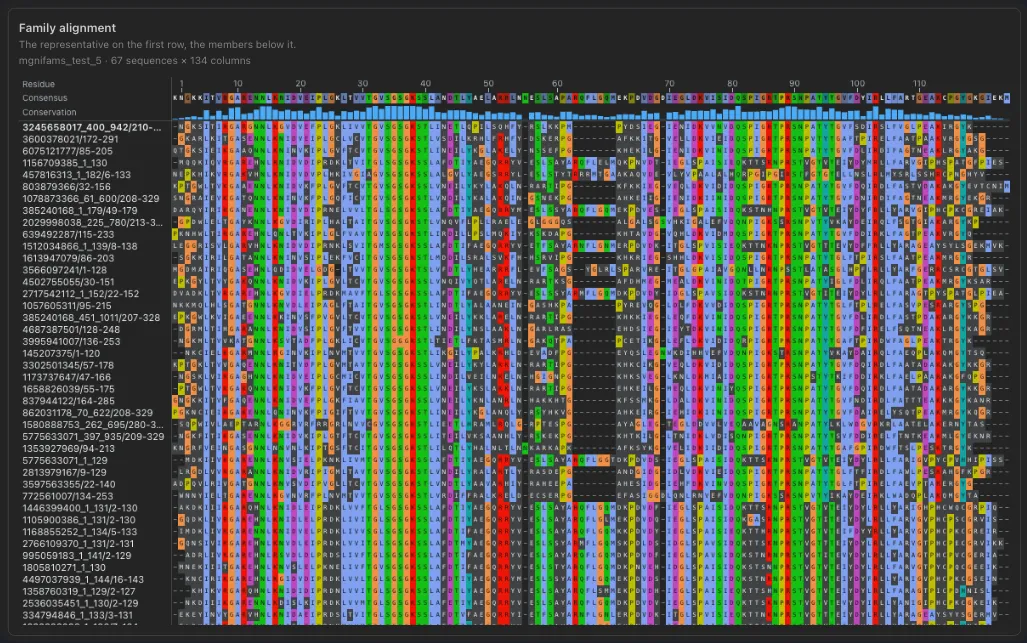
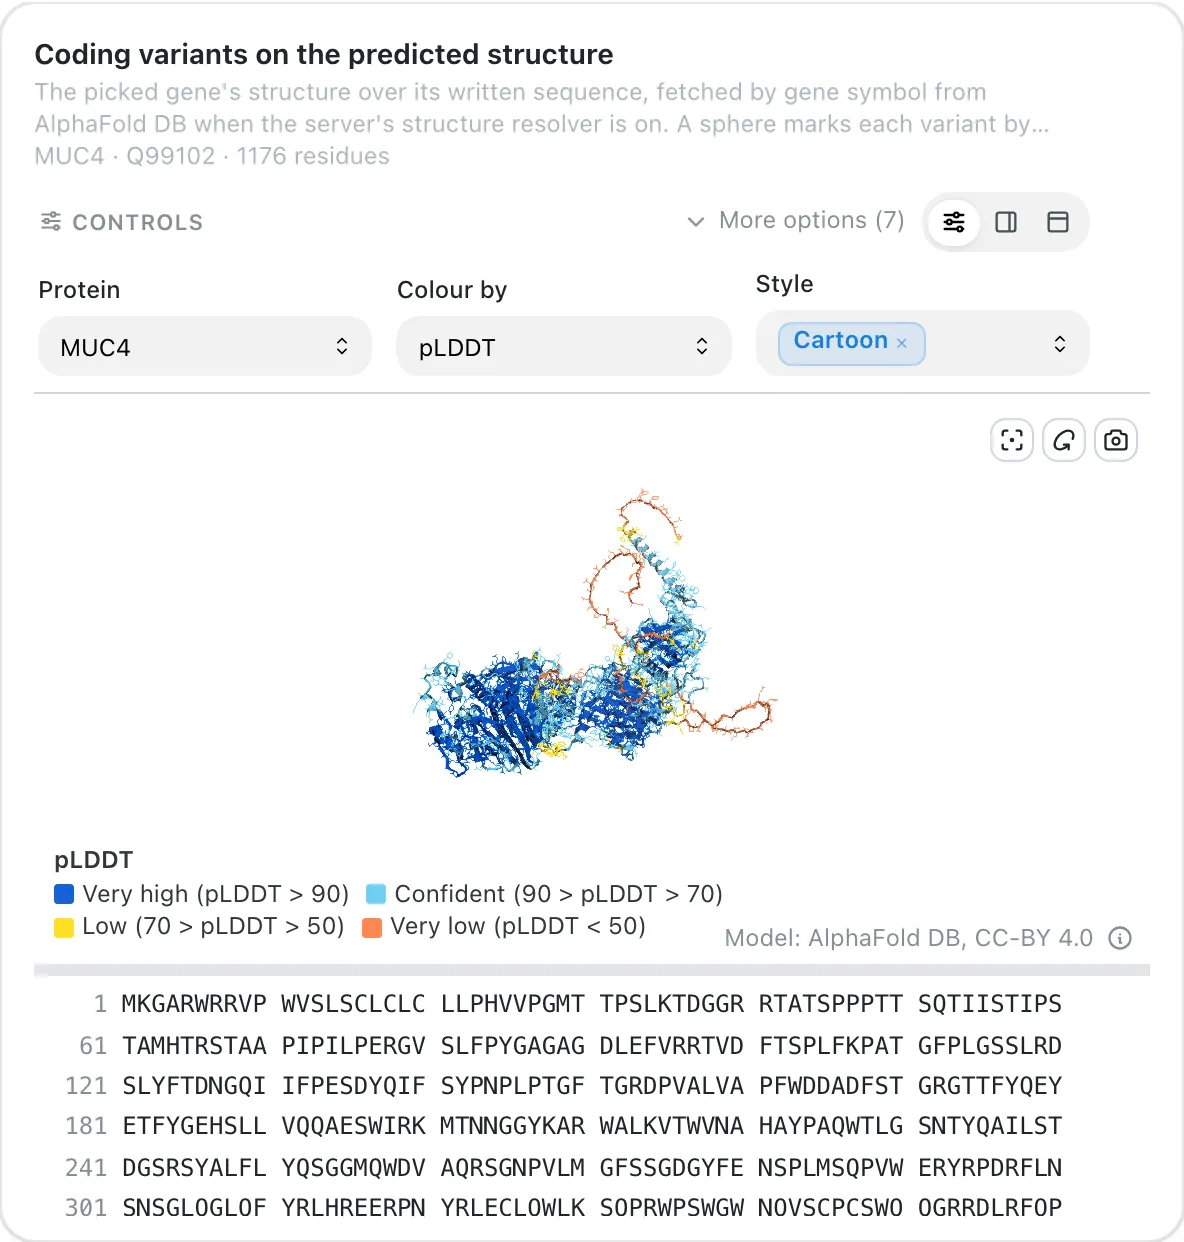
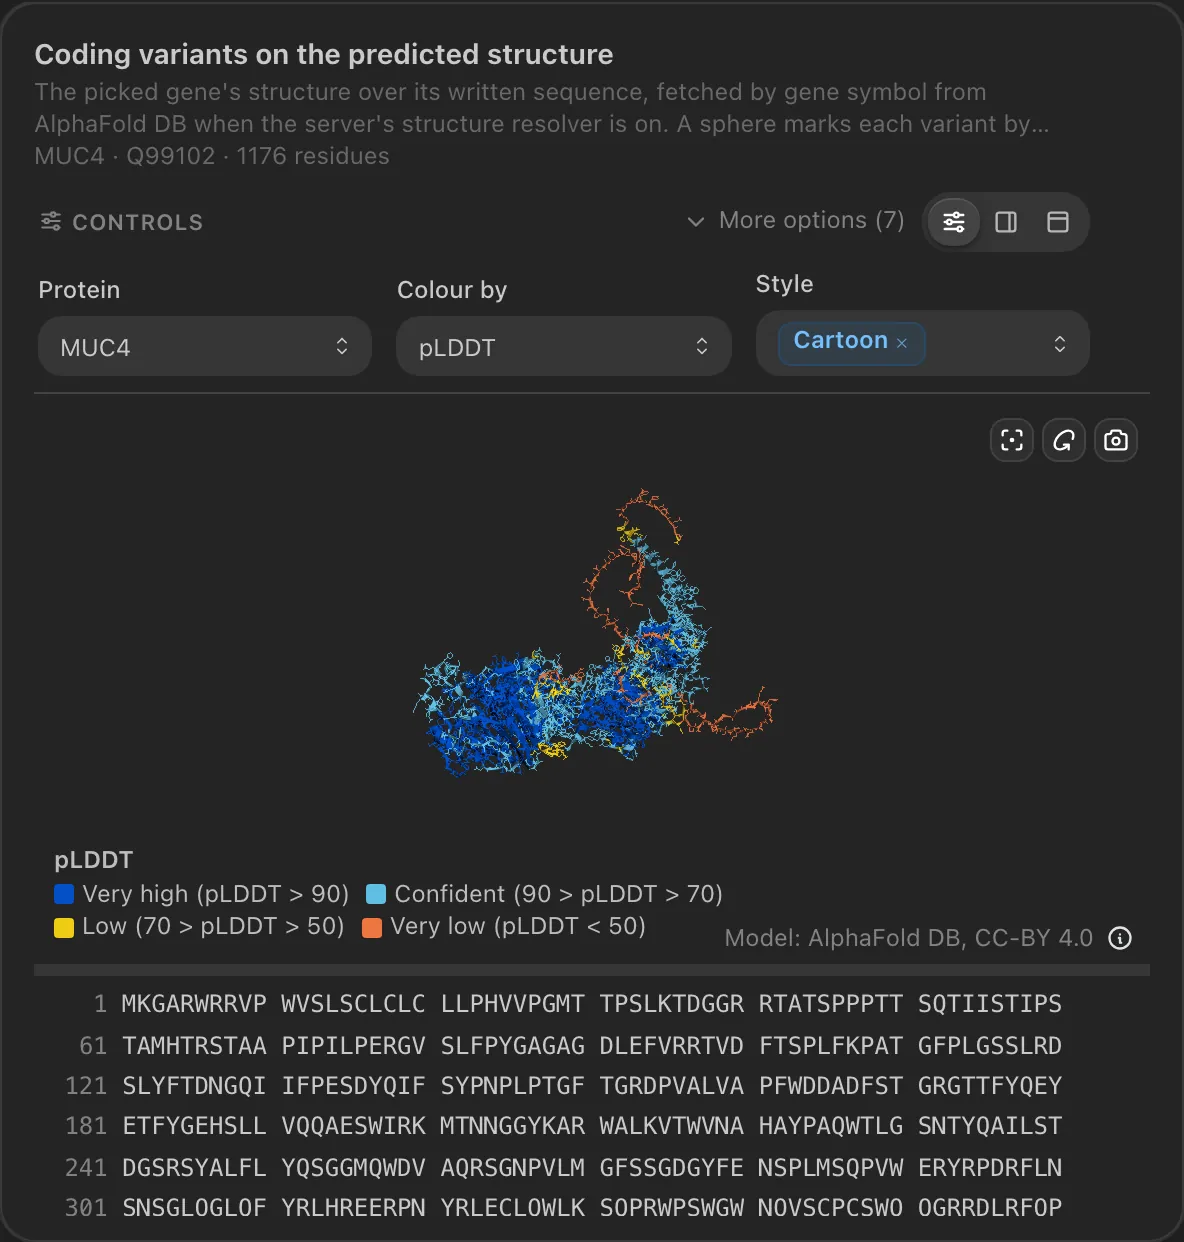
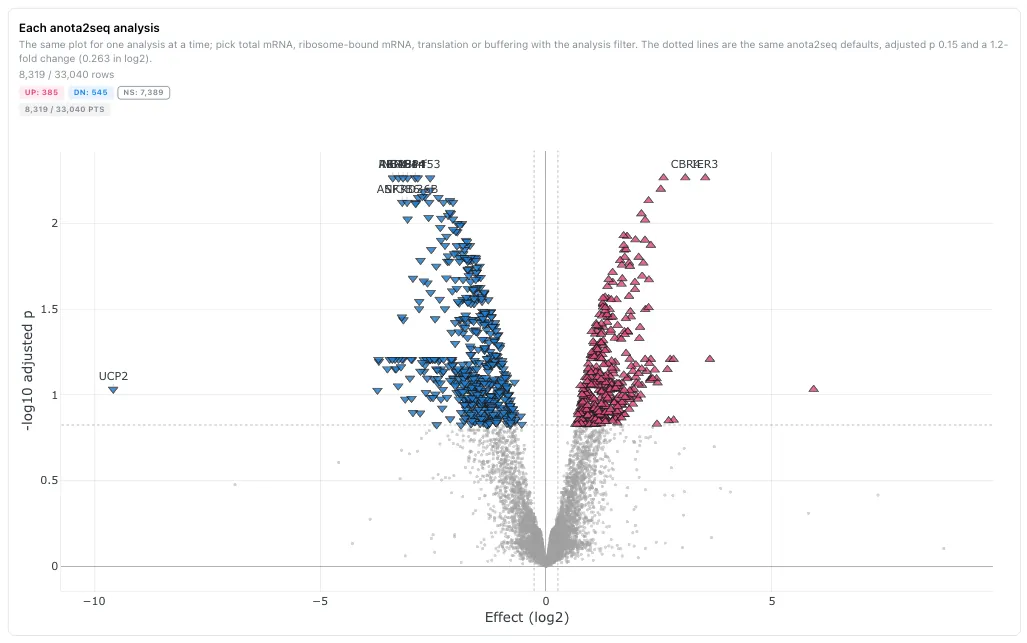
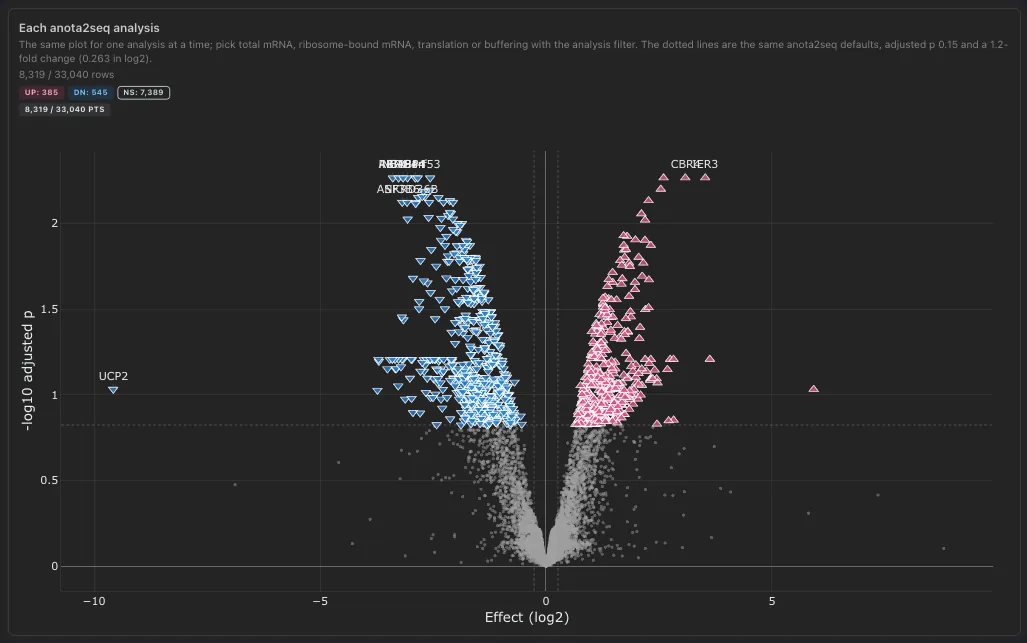
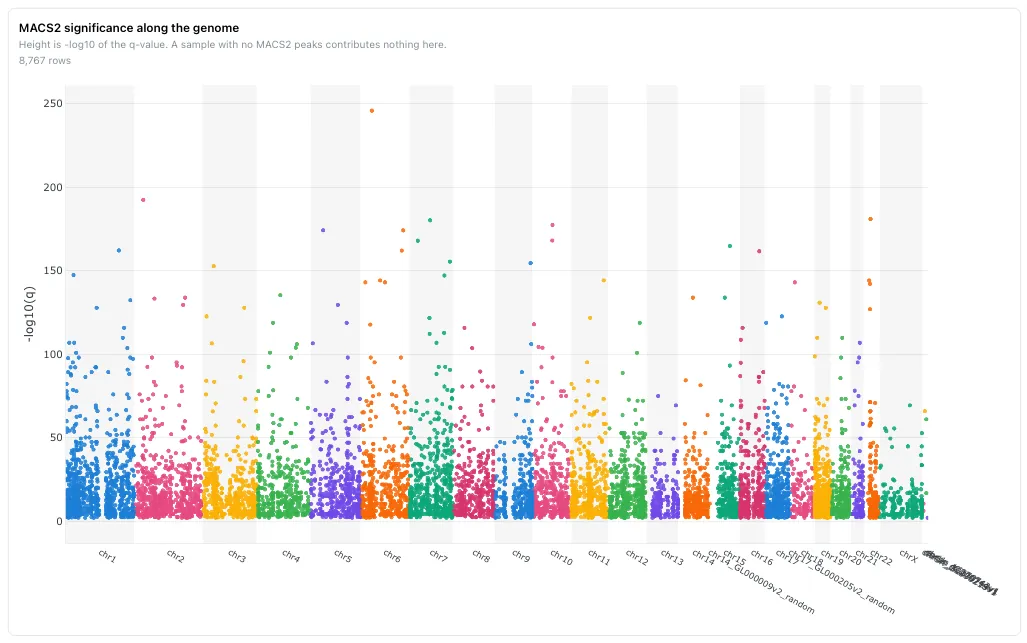
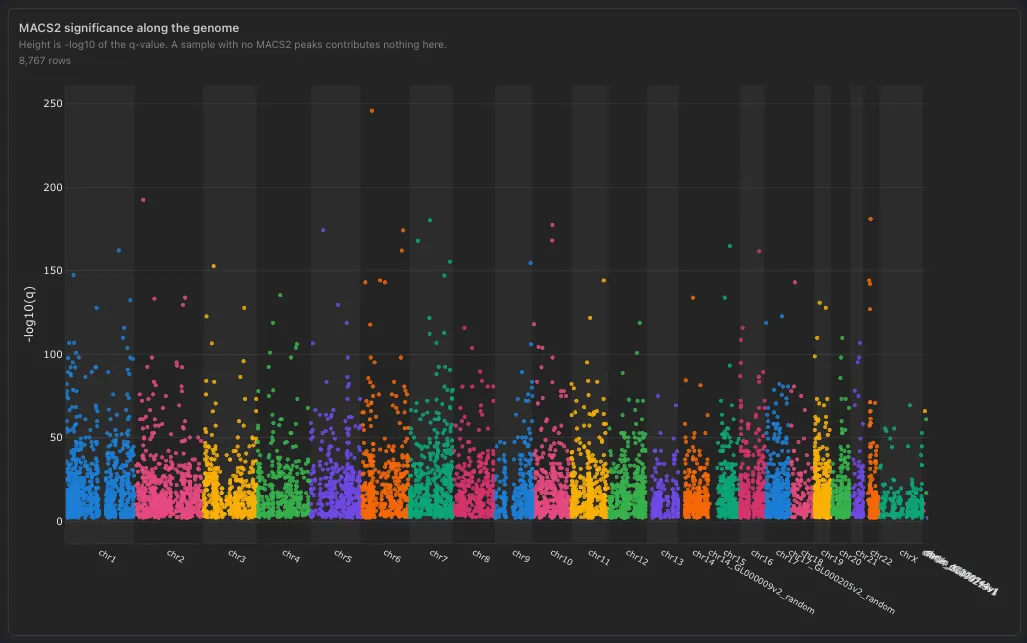
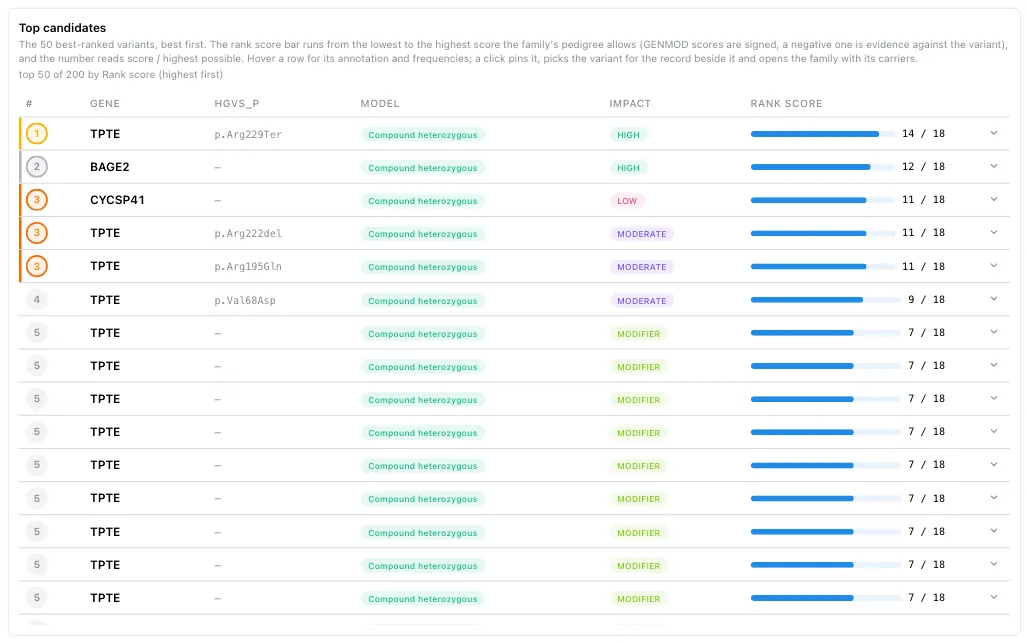
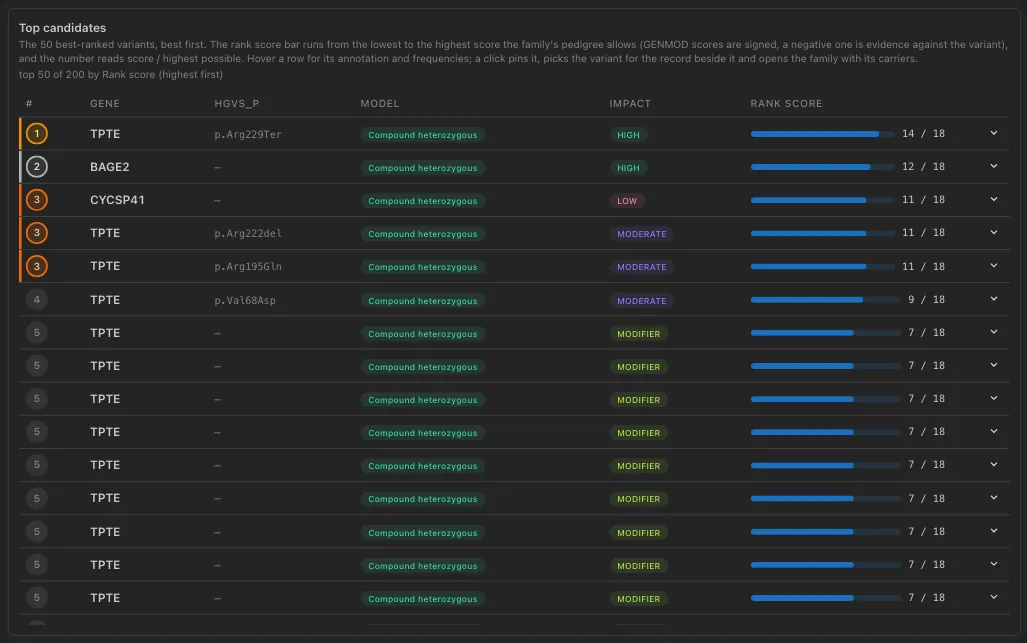
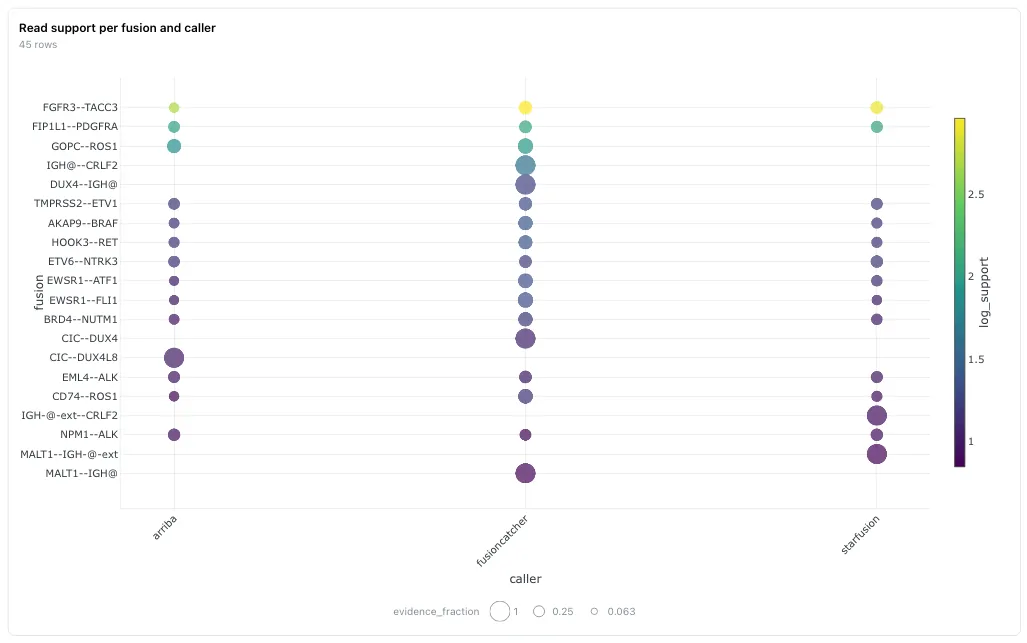
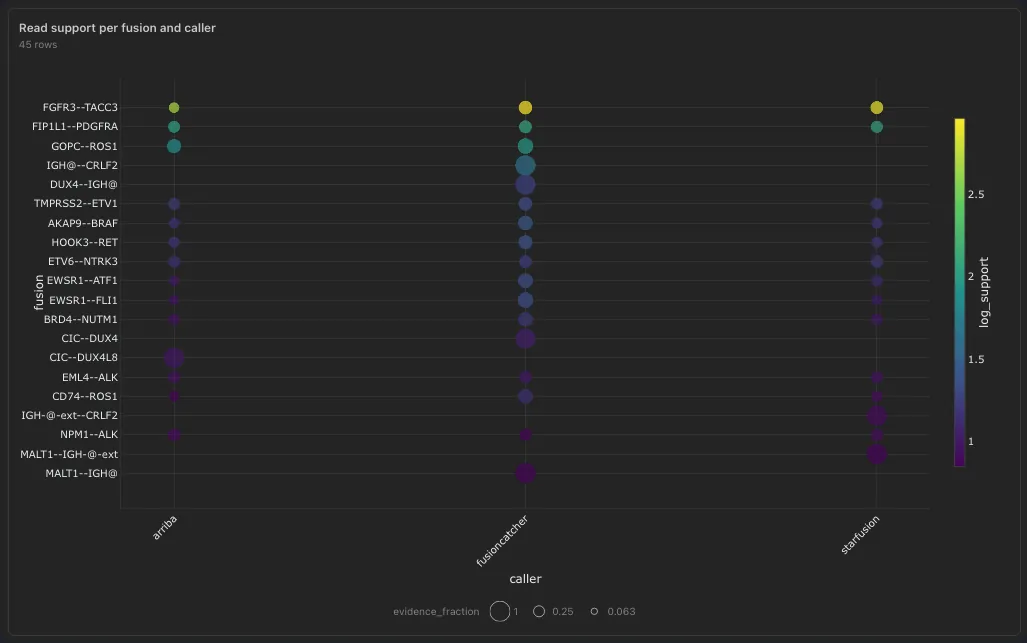
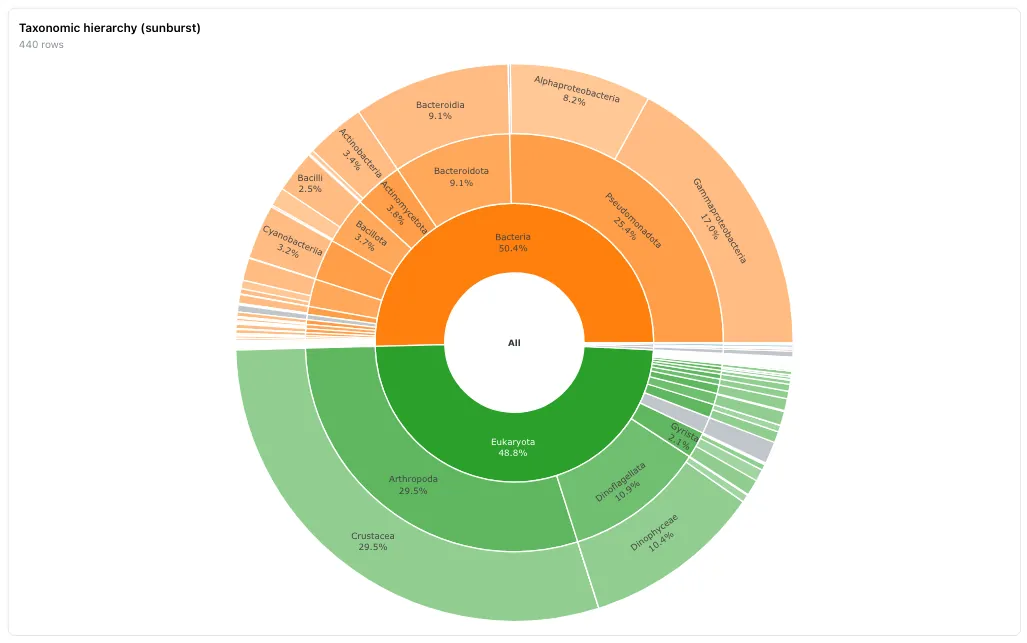
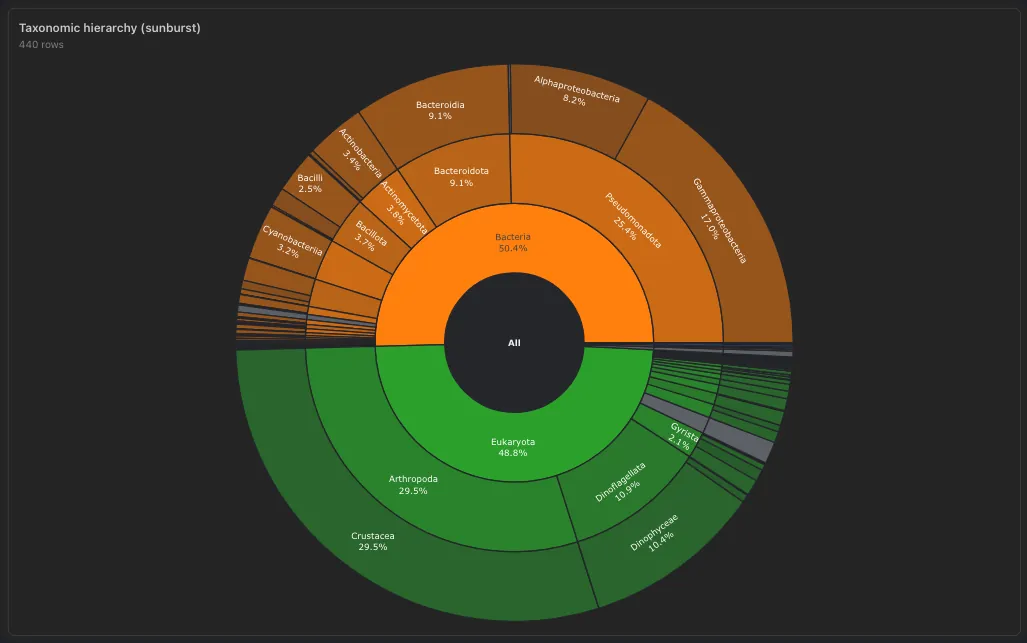
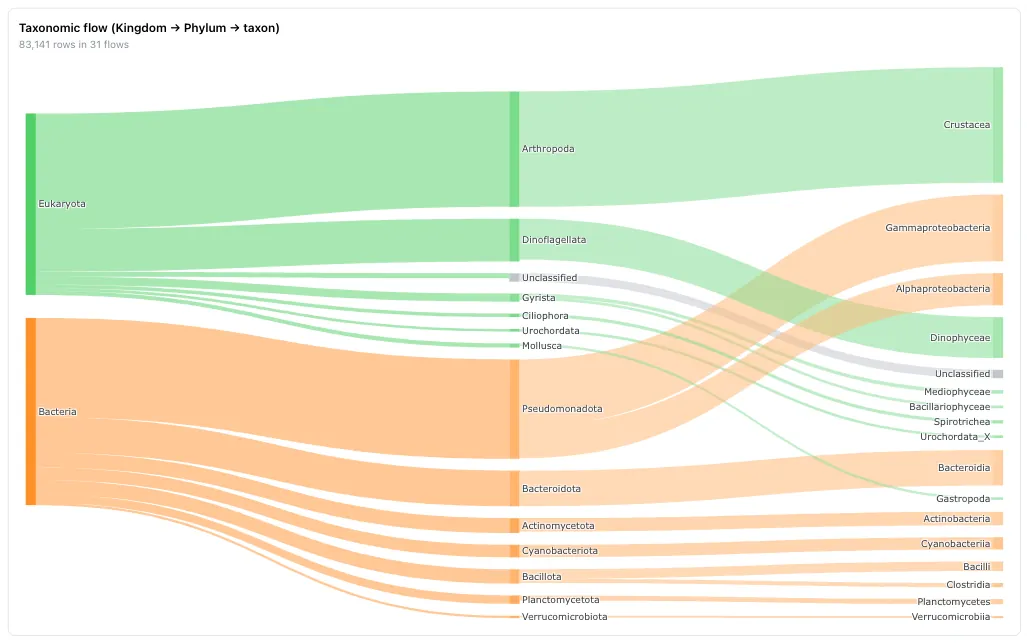
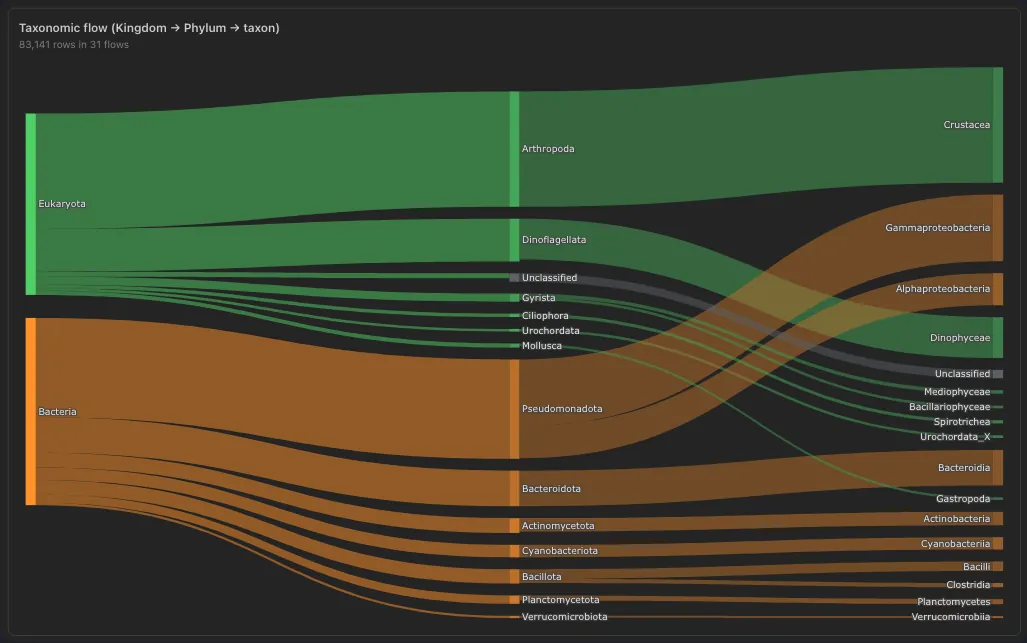
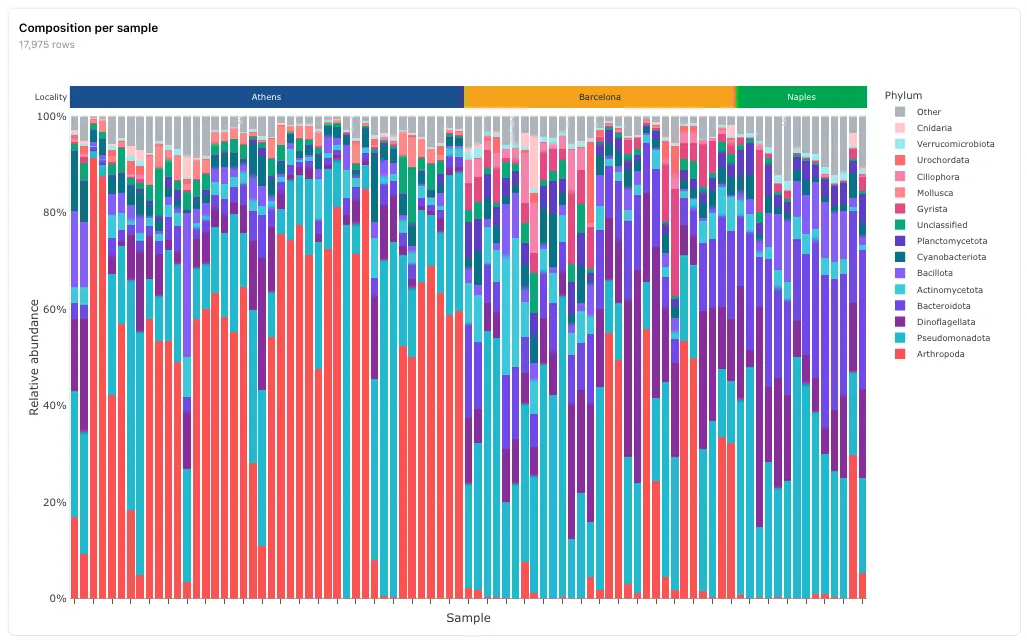
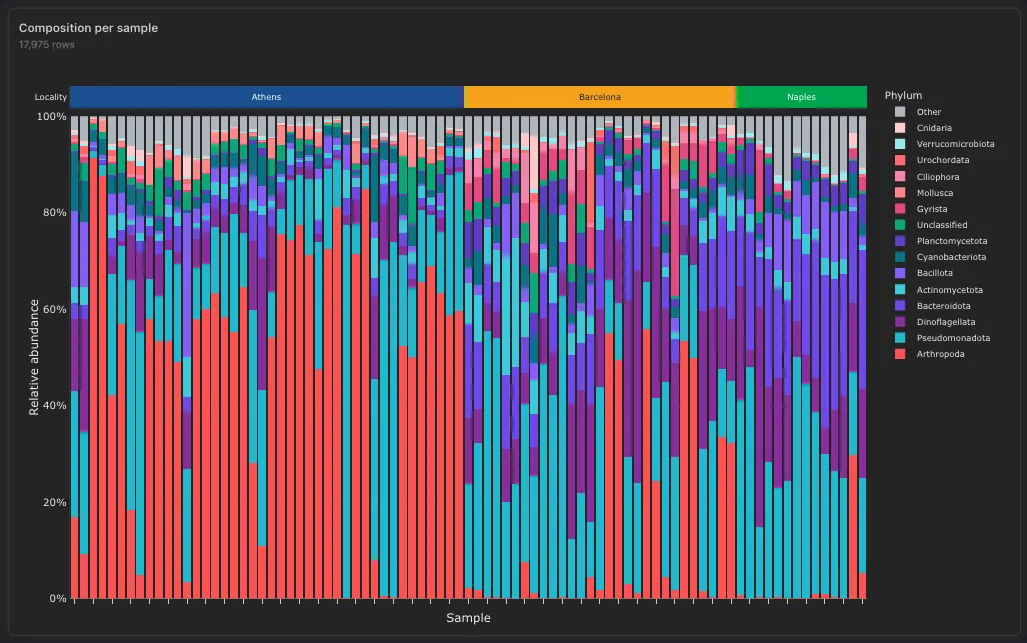
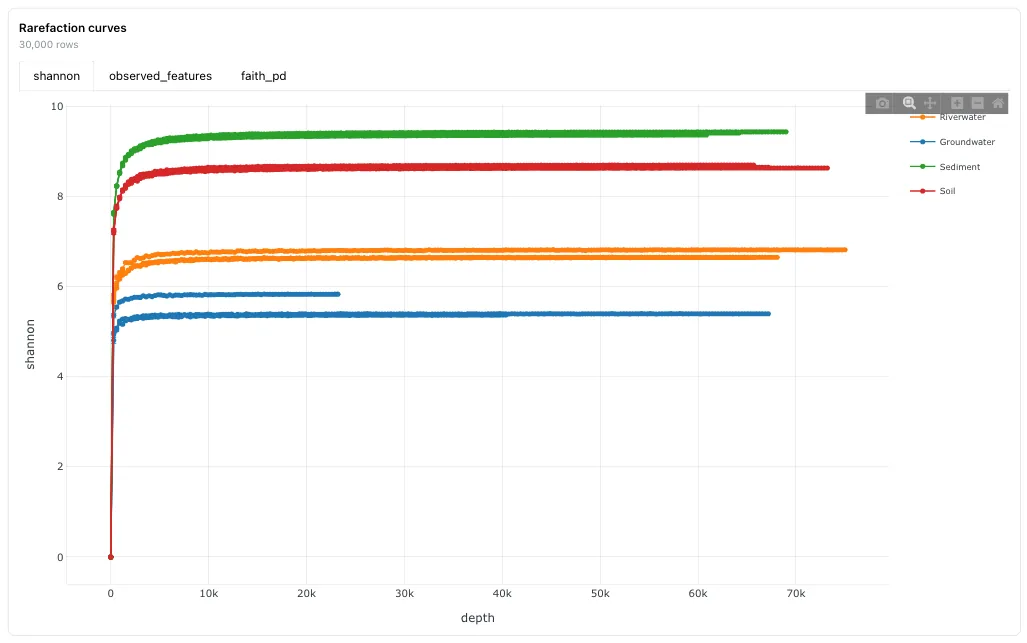
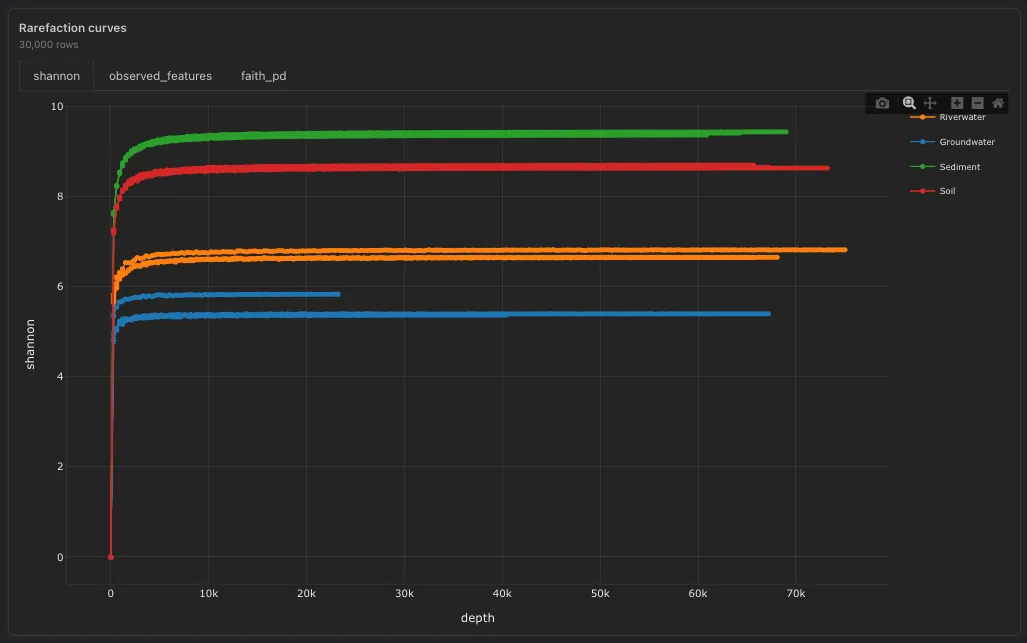
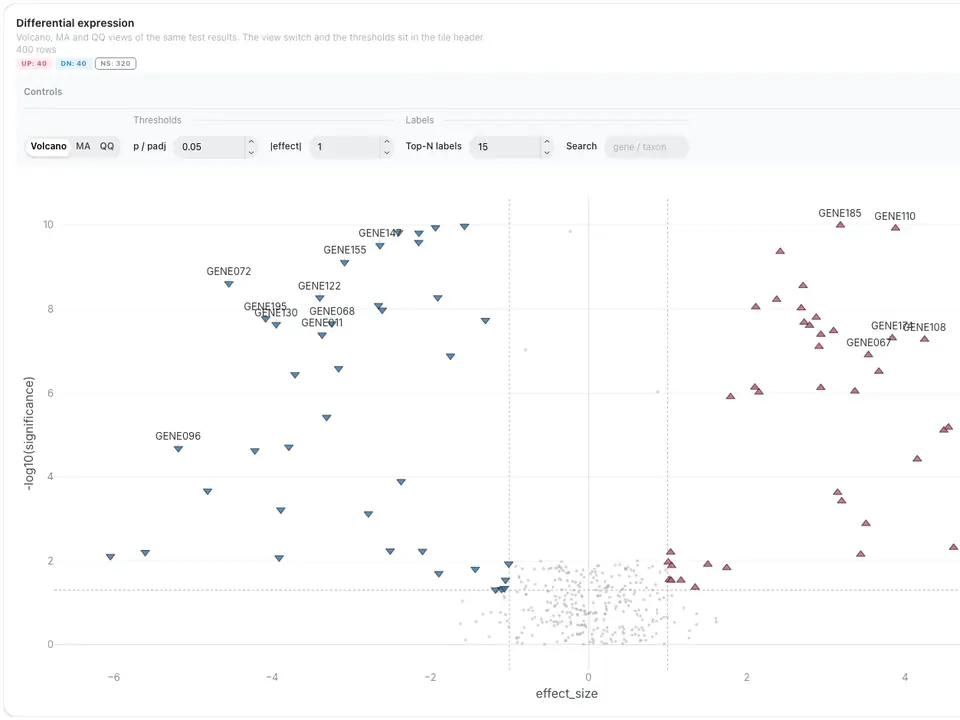
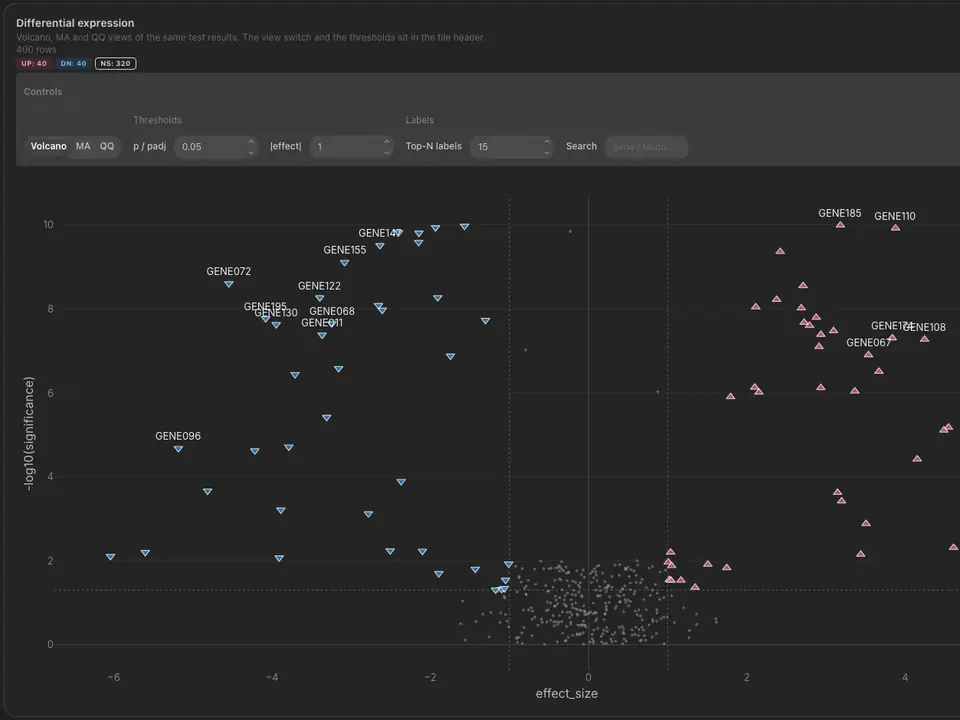
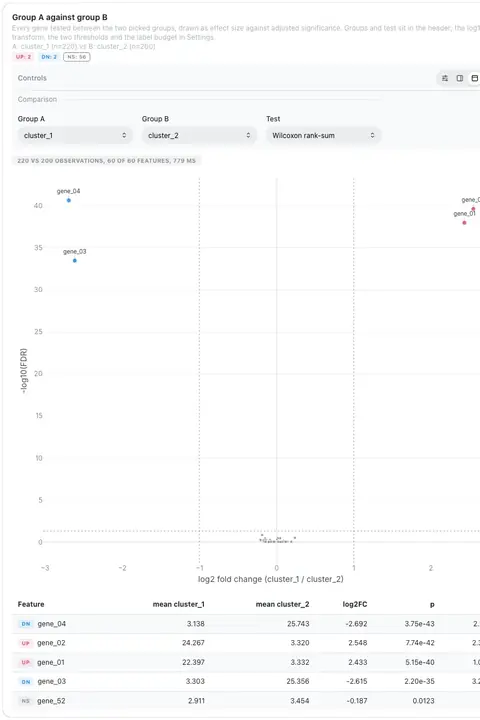
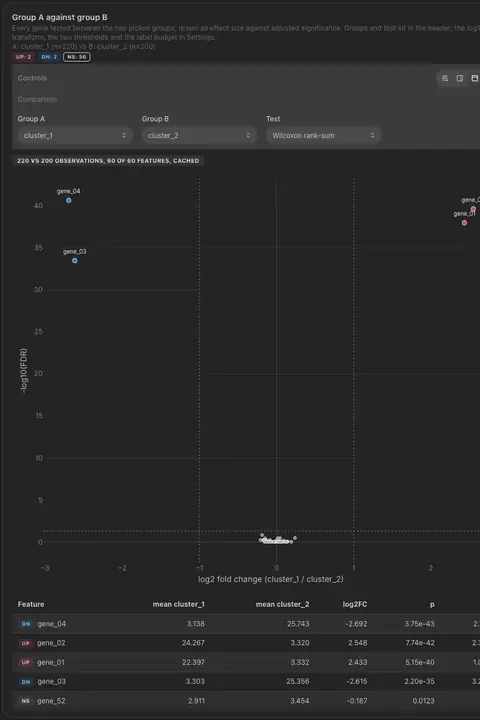
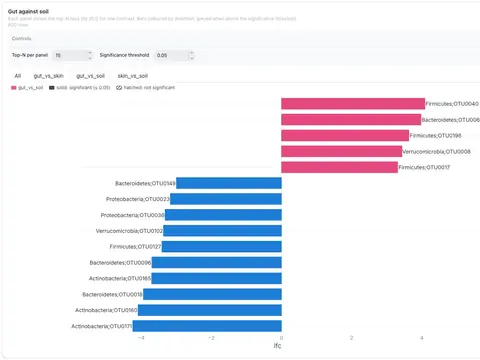
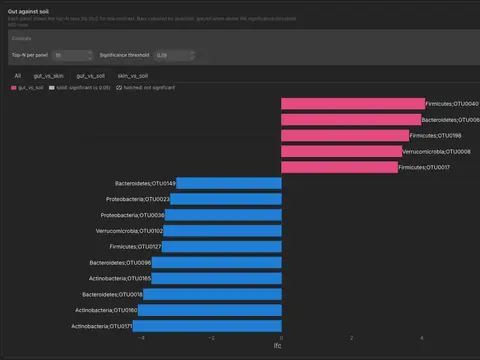
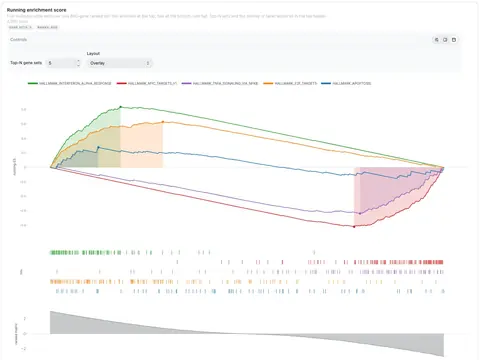
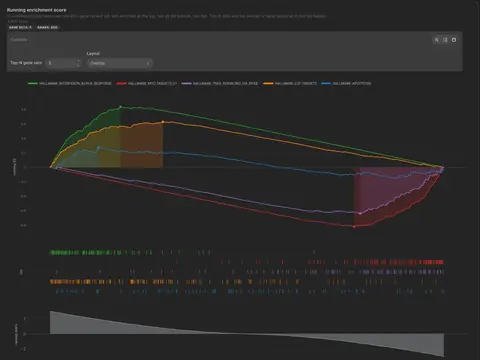
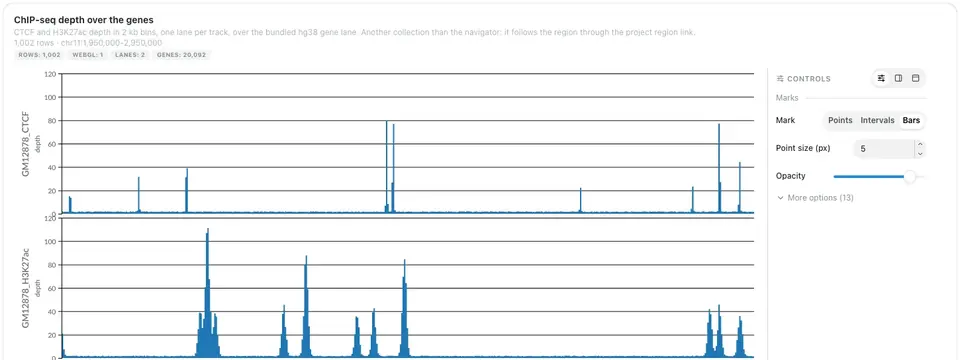
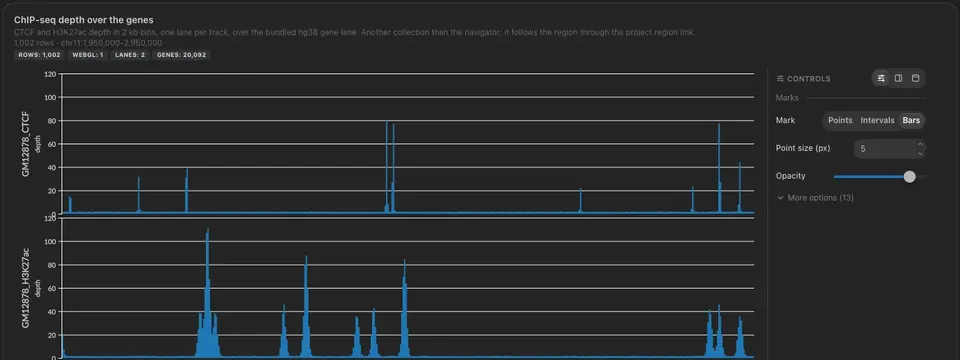
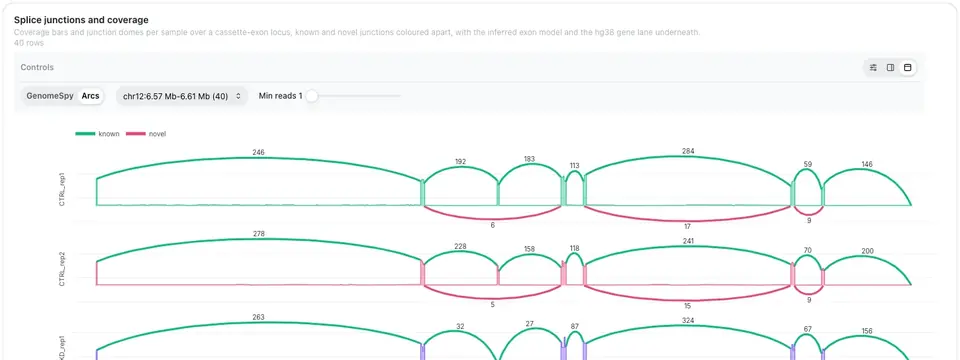
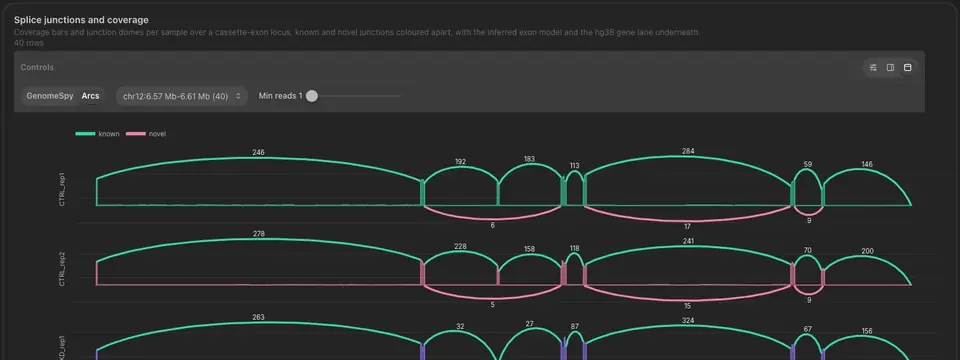
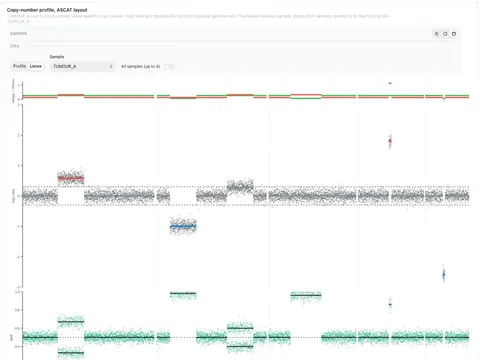
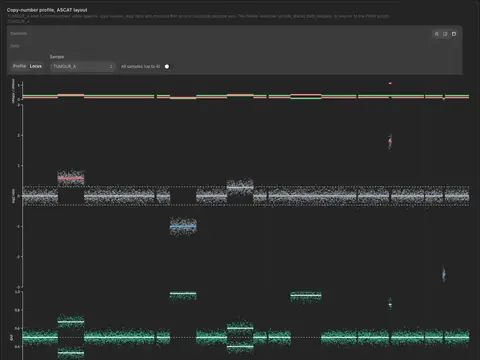
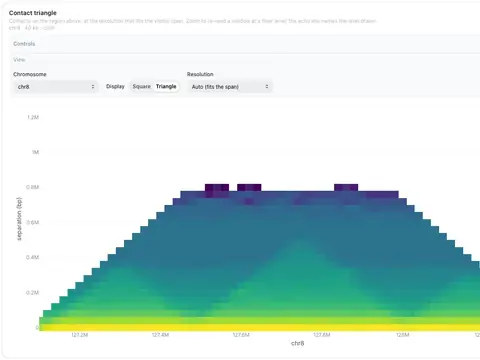
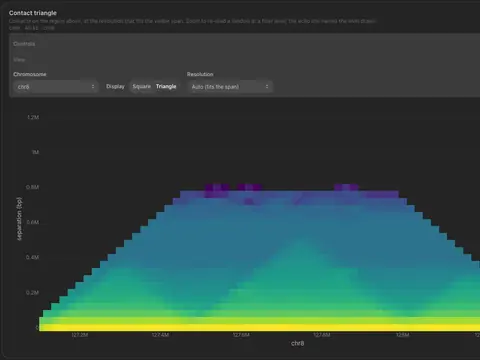
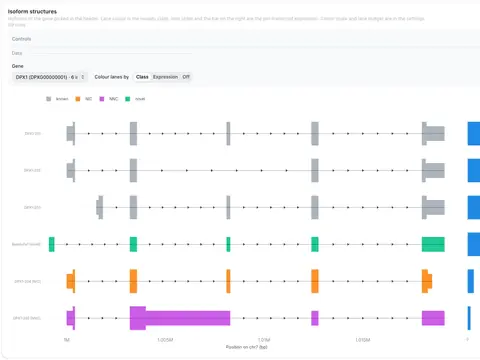
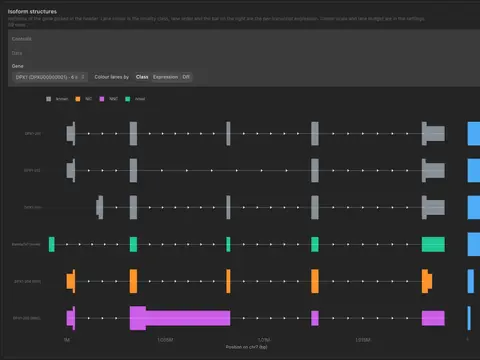
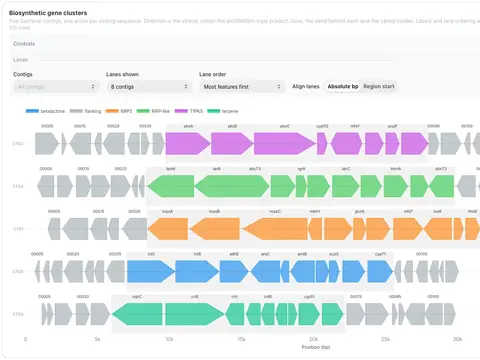
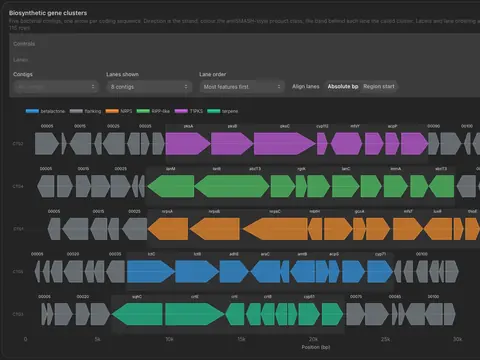
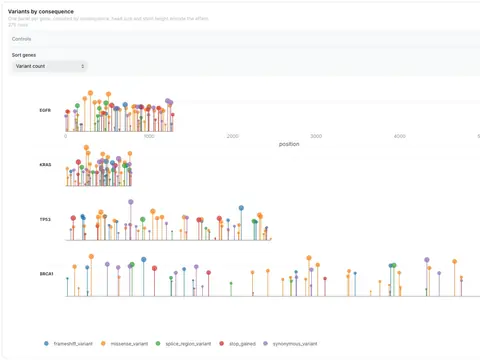
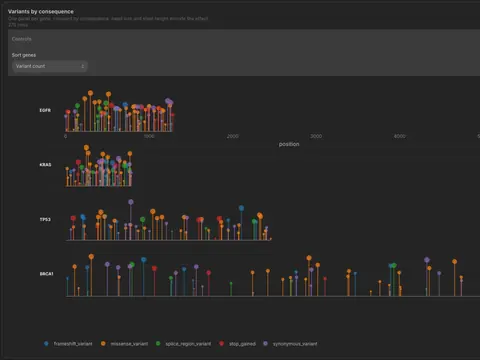
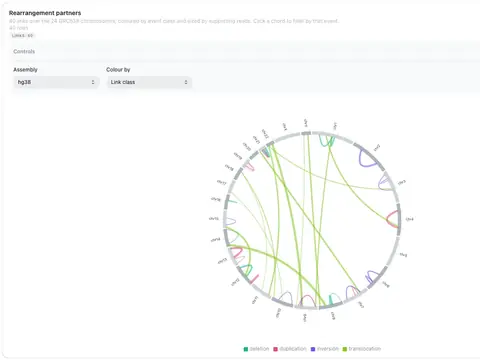
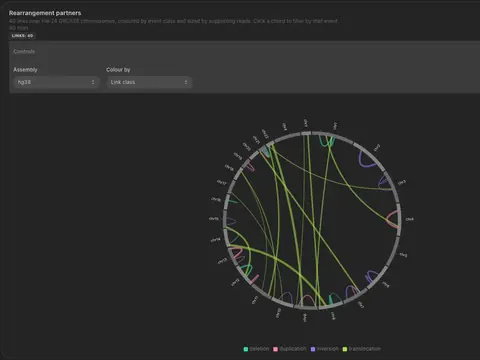
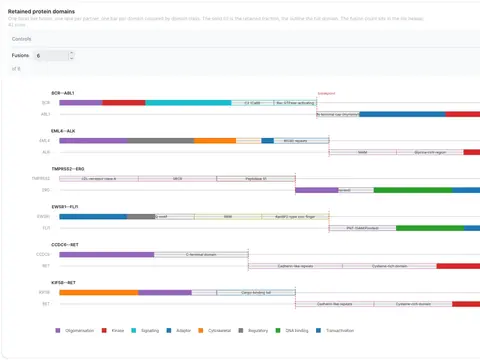
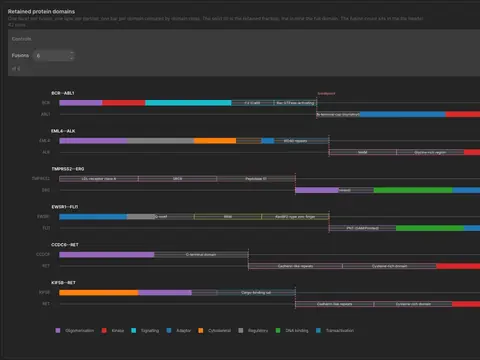
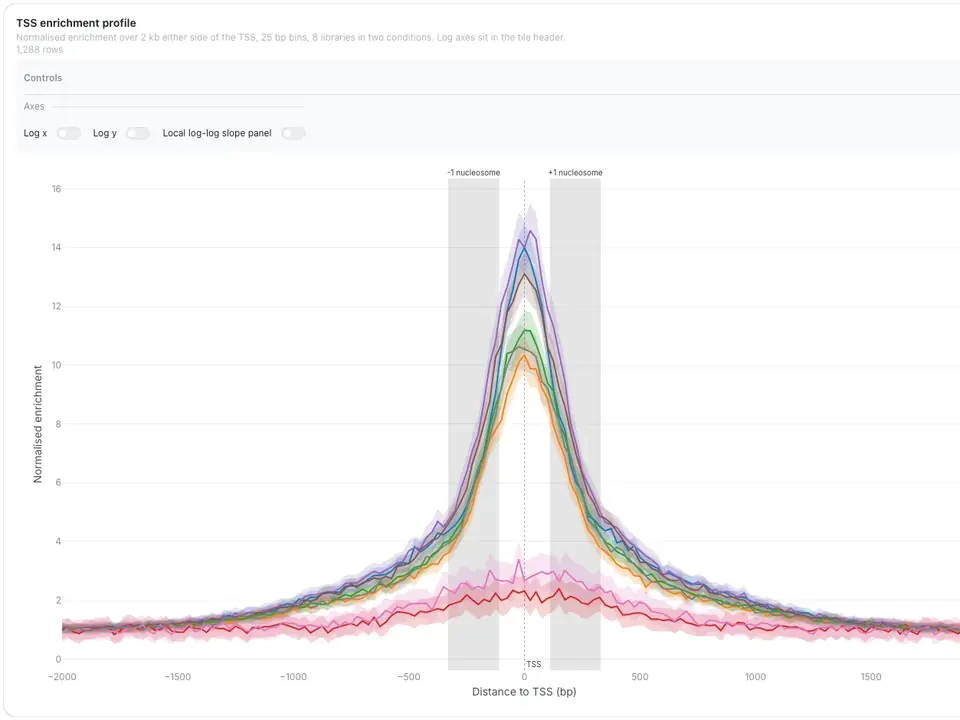
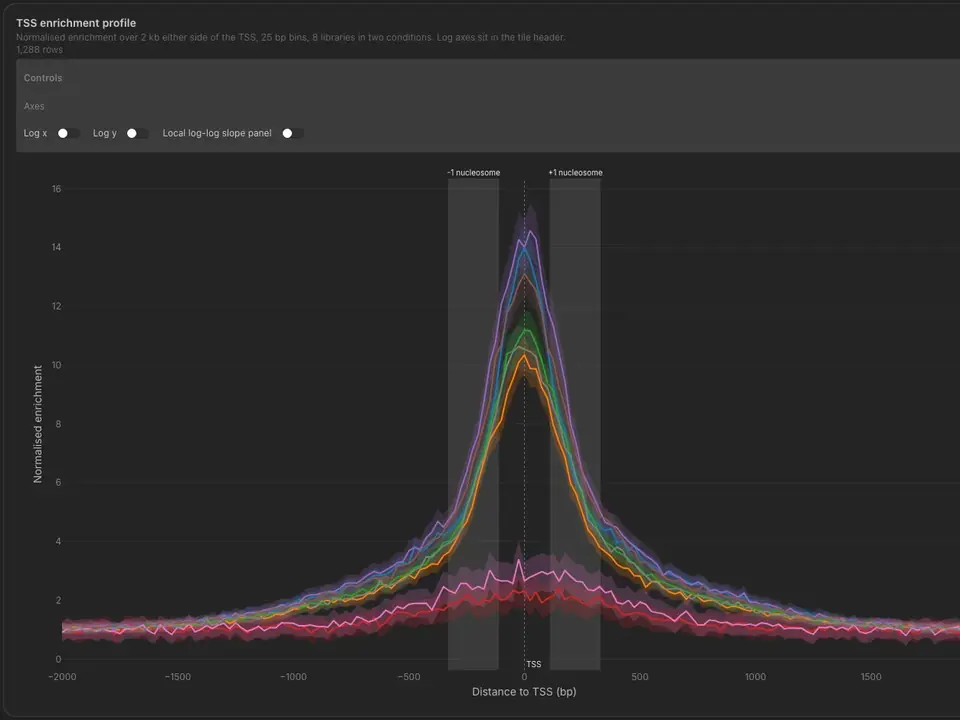
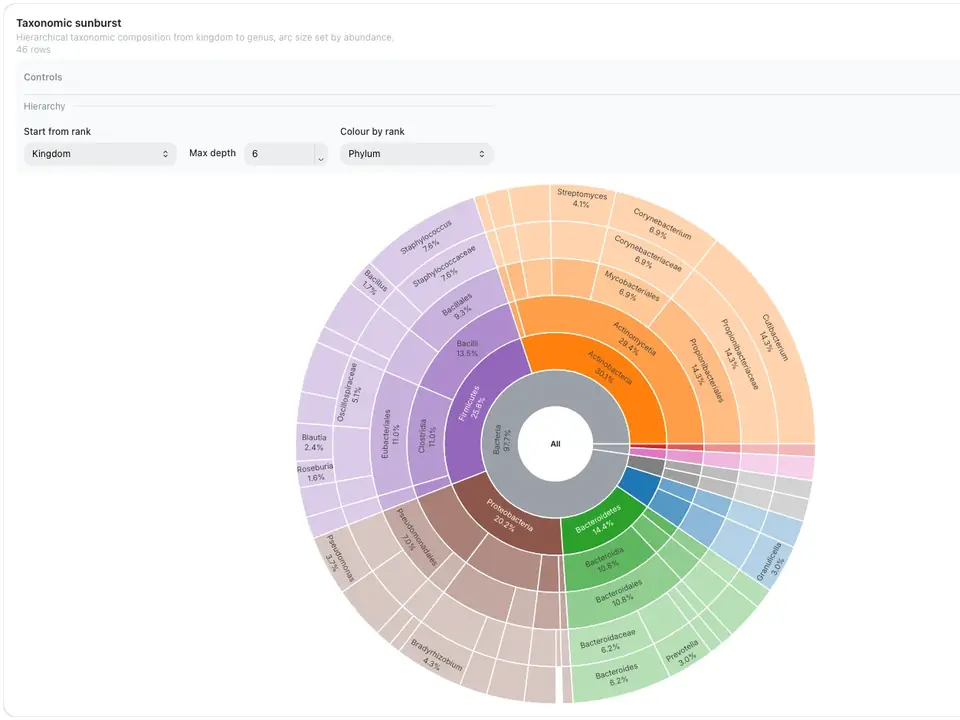
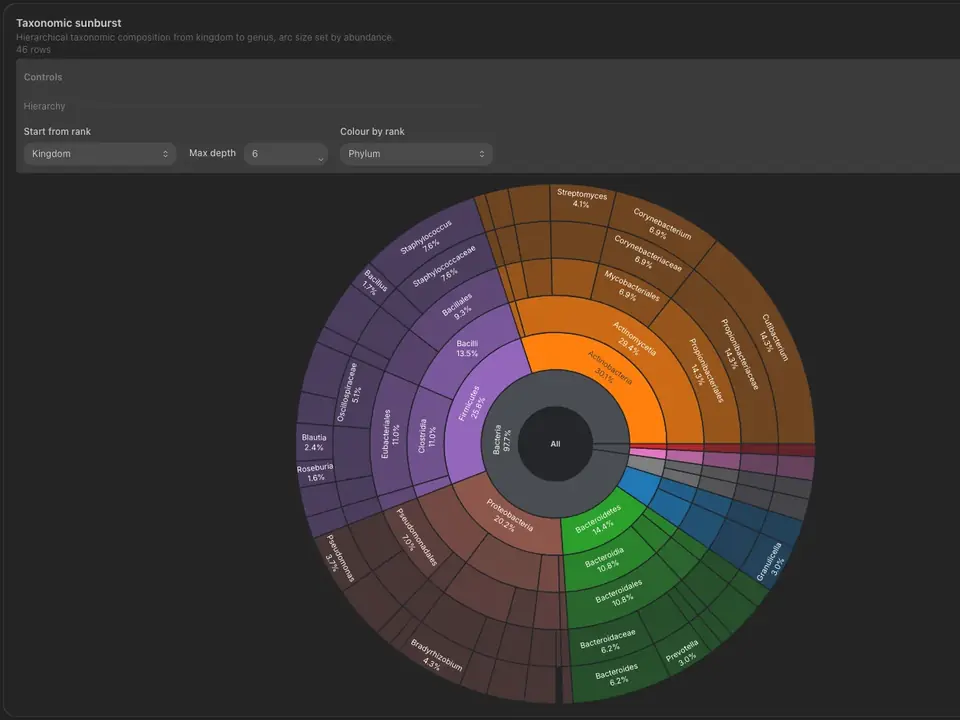
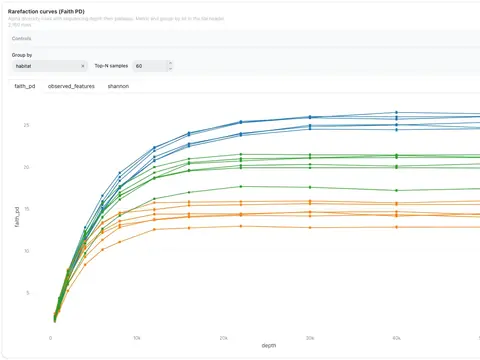
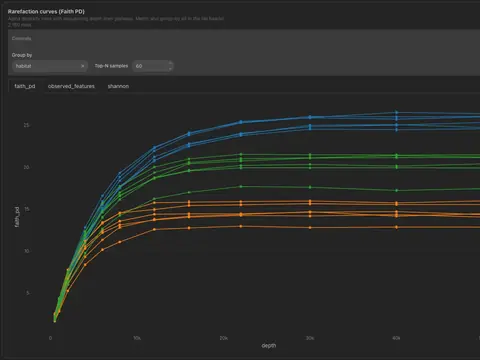
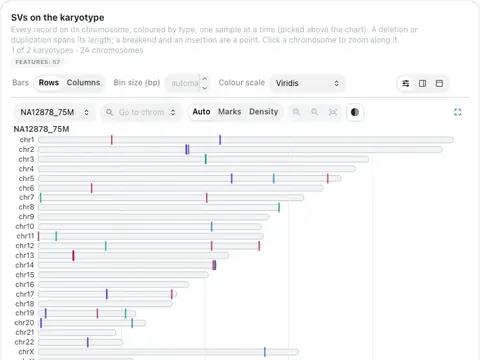
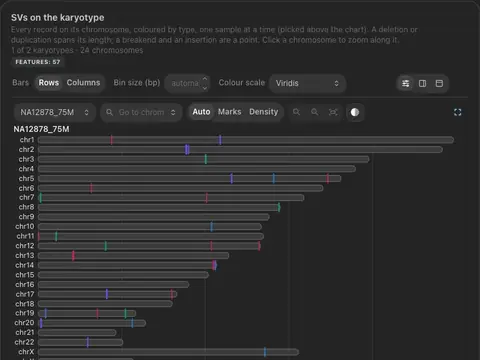
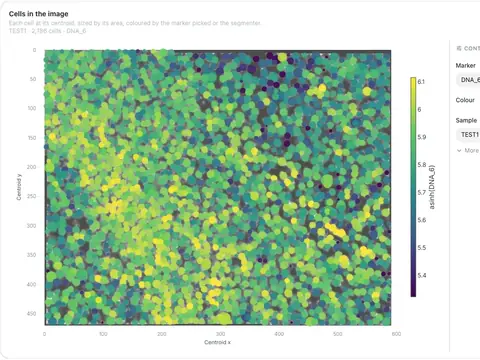
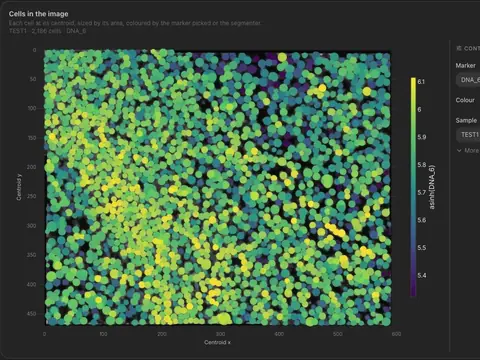
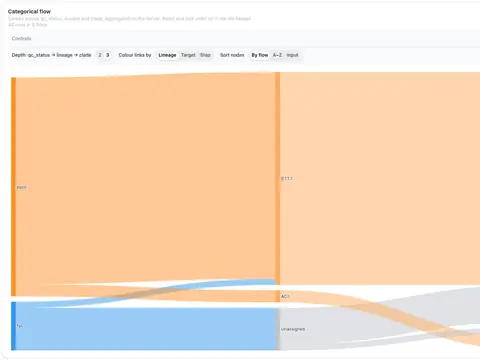
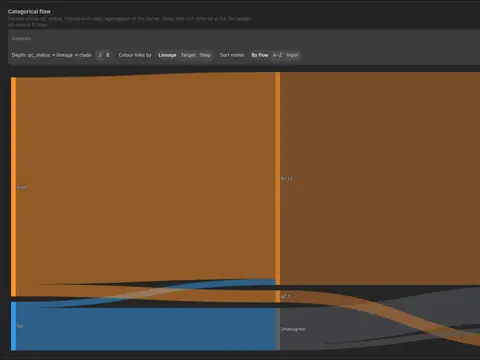
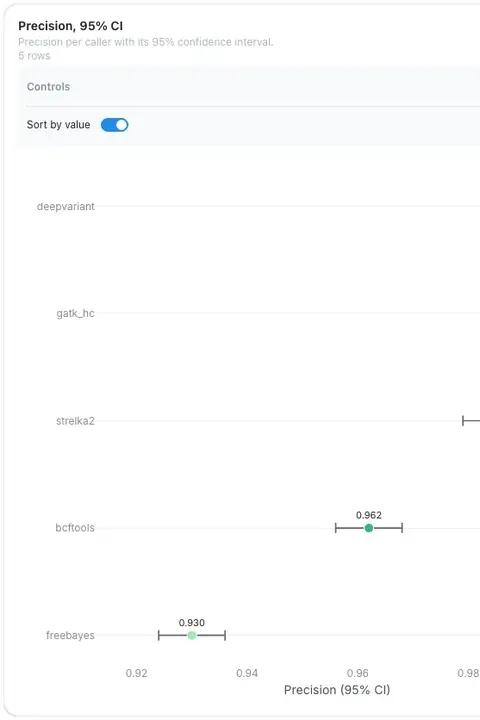
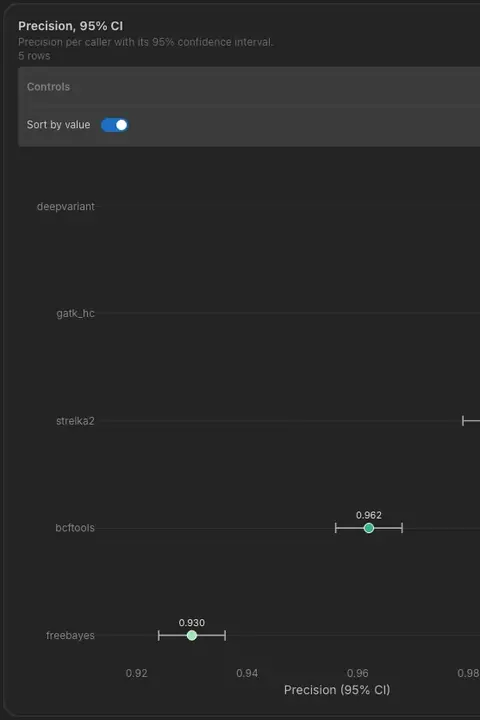
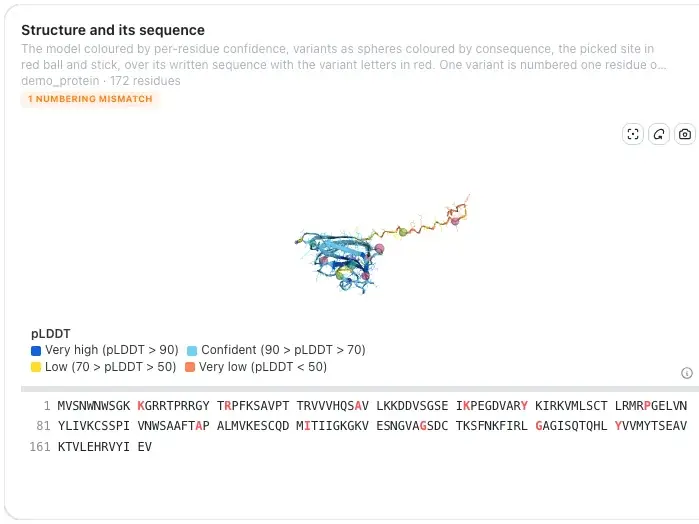
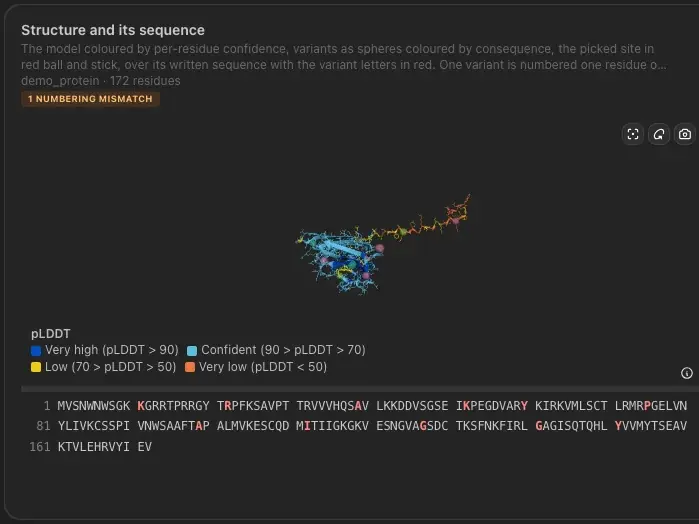
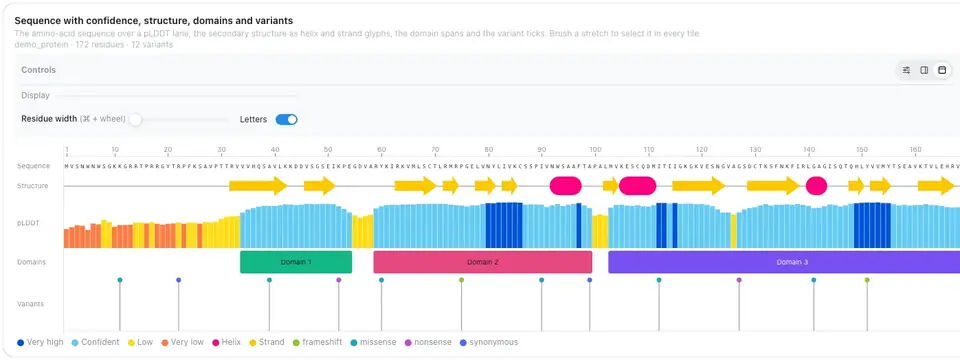
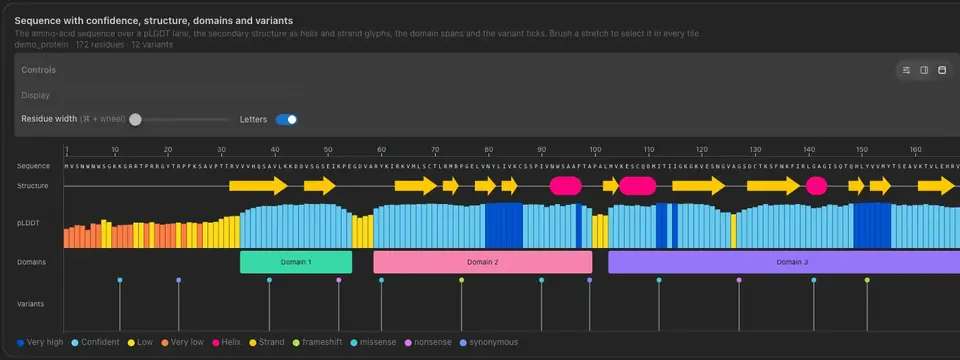
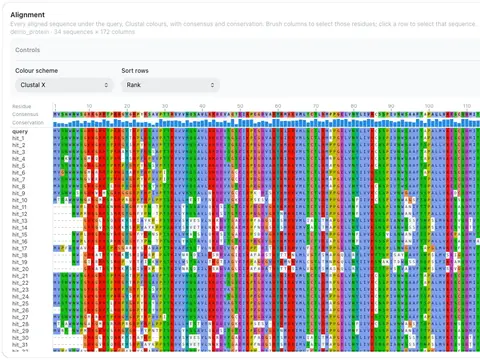
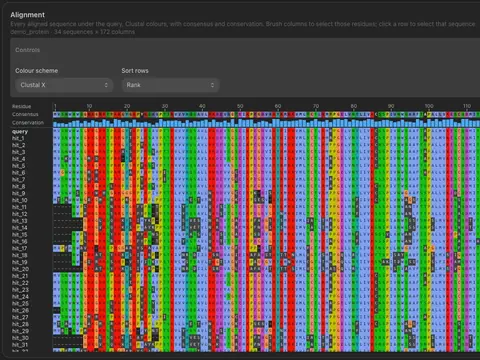
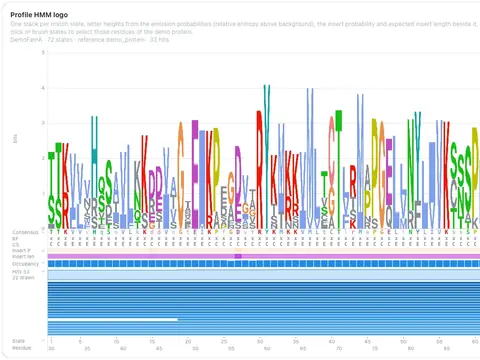
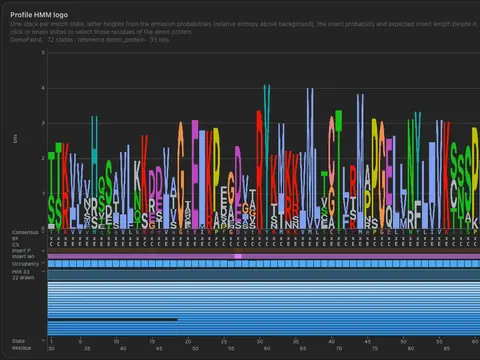
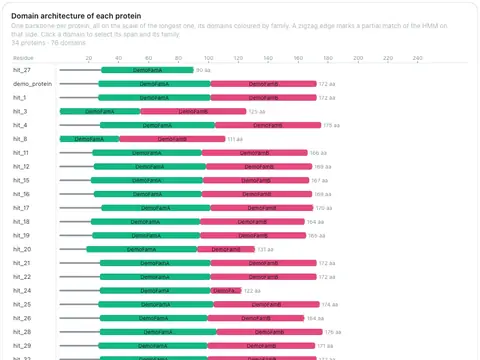
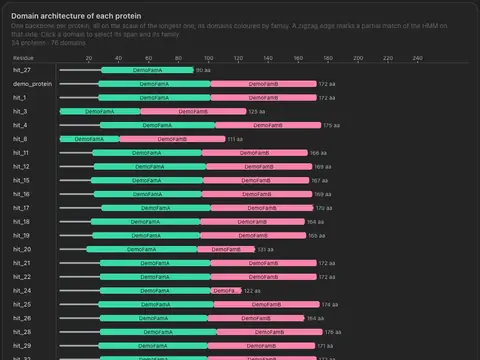
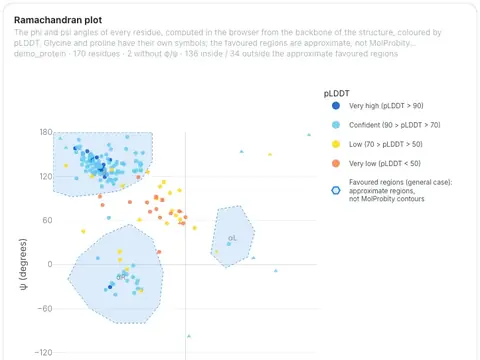
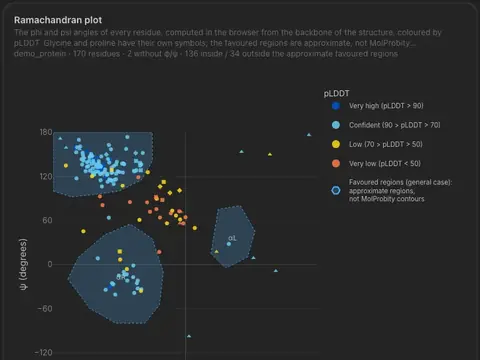
- 56 visualizations: volcano, oncoplot, sunburst, genome tracks, 3D structures and more
- Each comes with its own controls; some switch between views
Card
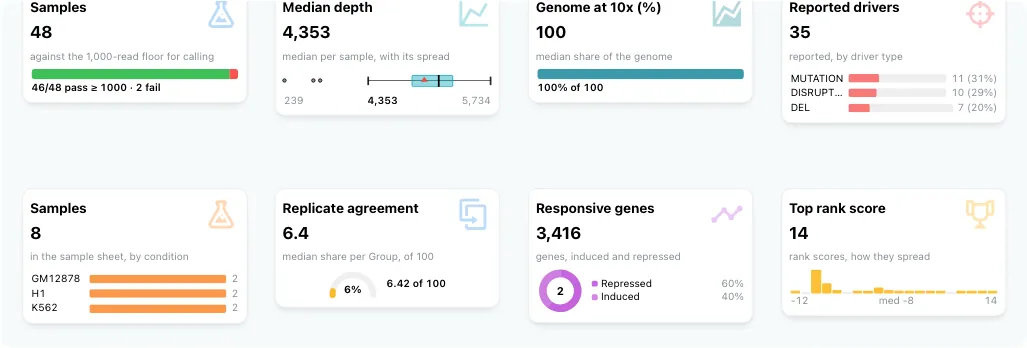
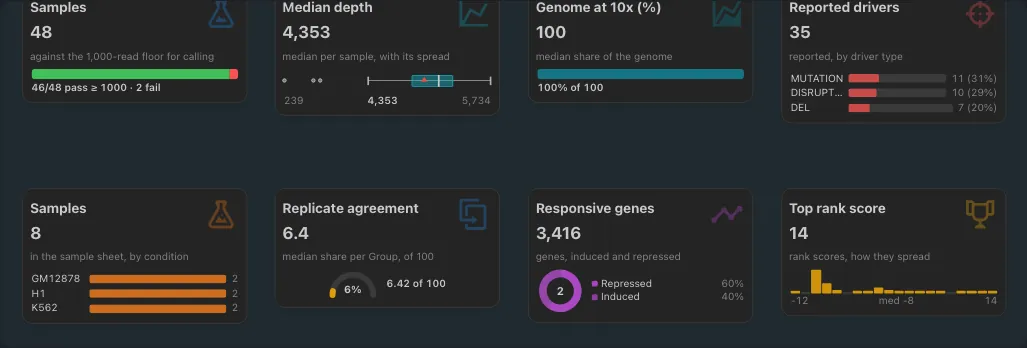
- One metric per card: count, sum, average, median, unique values and more
- A secondary view shows its shape: donut, box plot, sparkline, histogram, gauge
- Follows every filter on the dashboard
Table
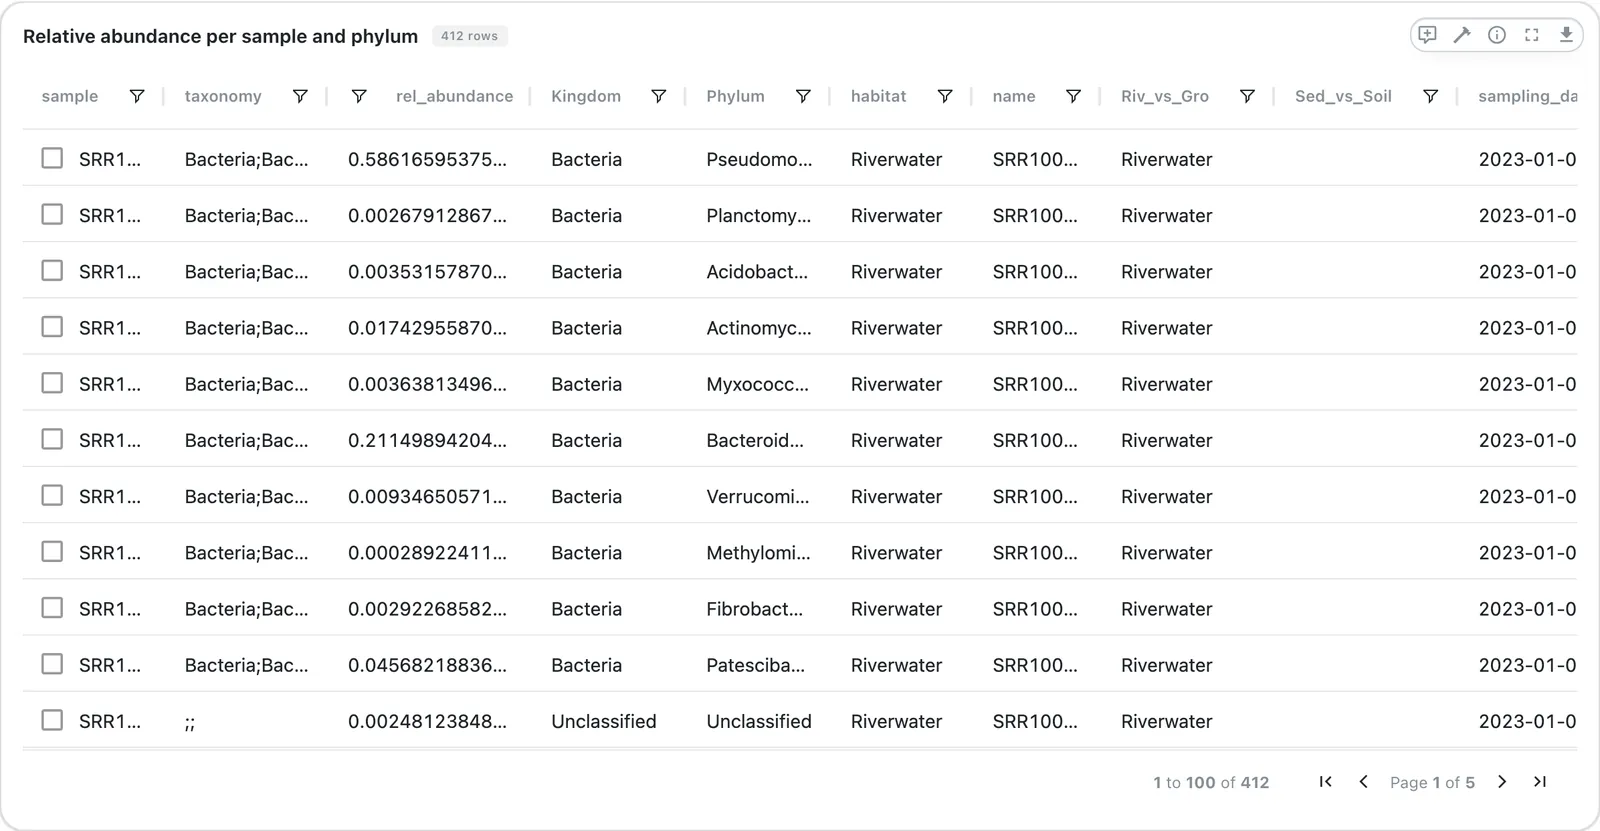
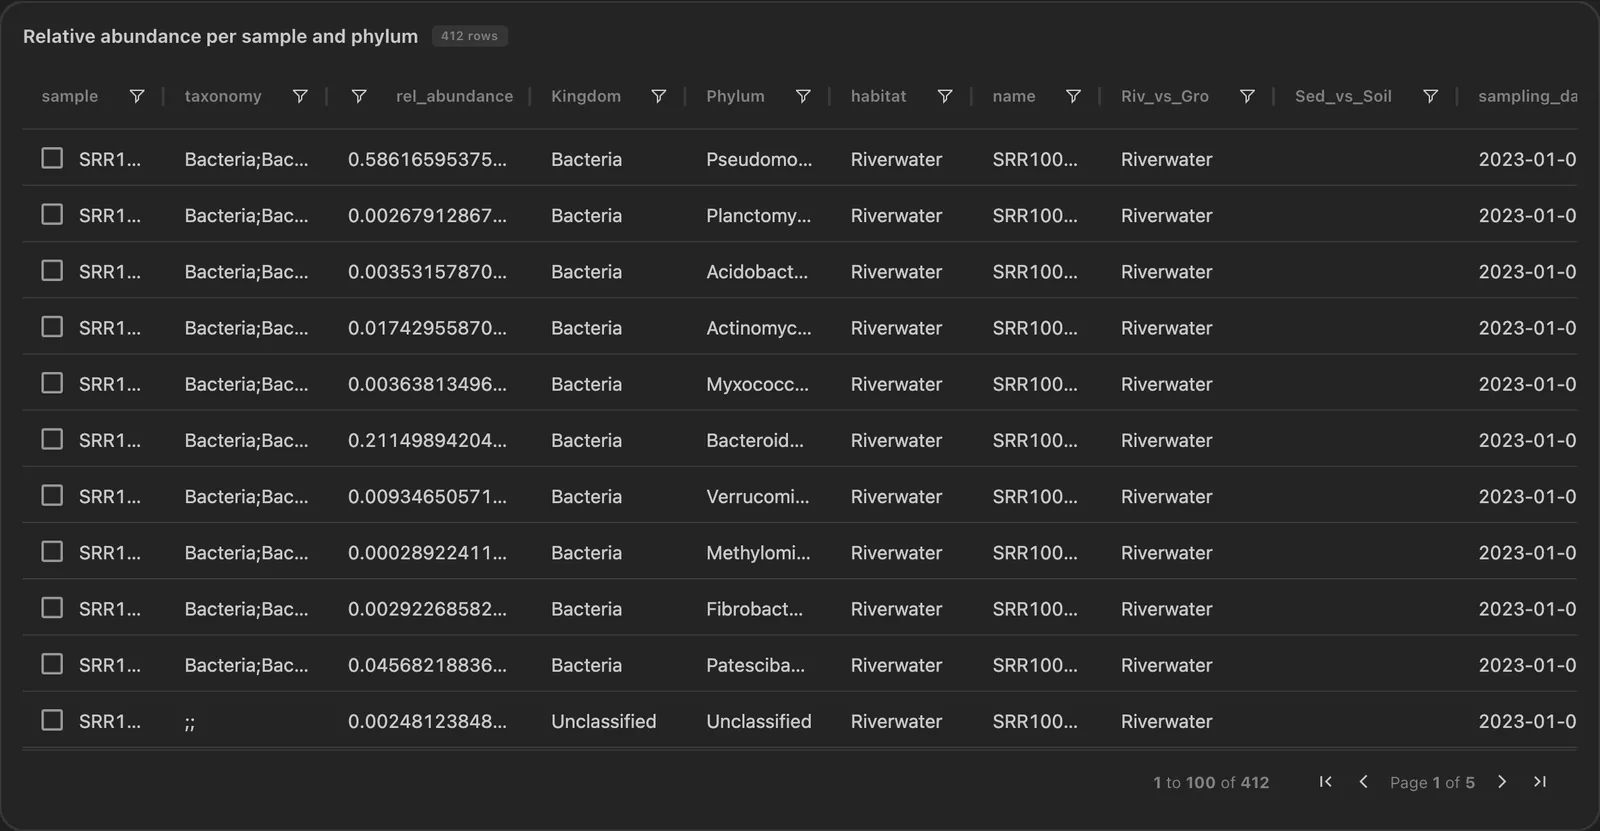
- AG Grid with server-side paging, so large tables stay fast
- Sort and filter by column, export to CSV
- Selecting rows filters the dashboard
Interactive
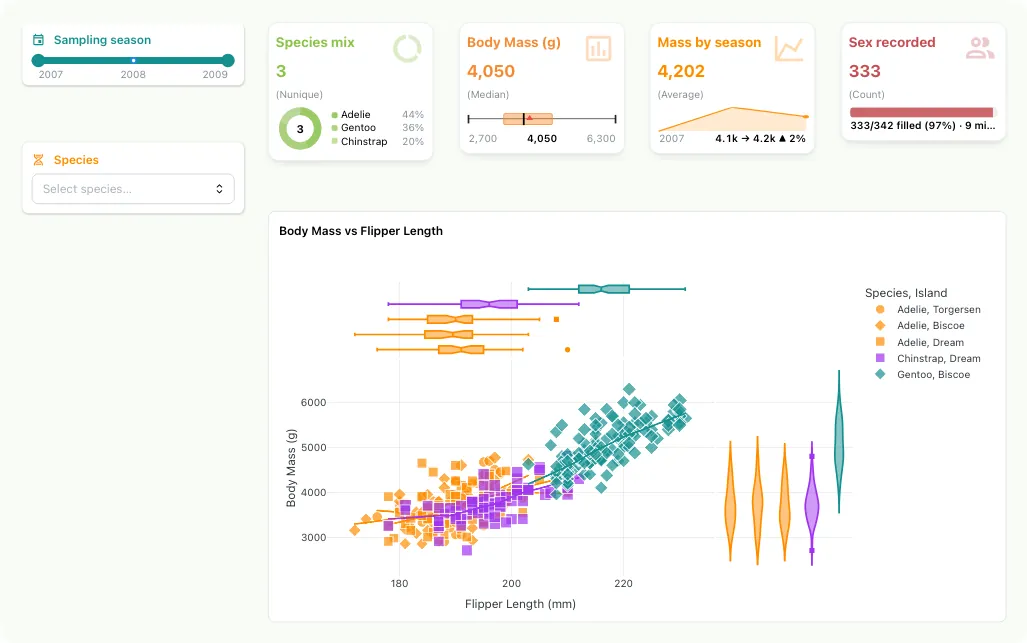
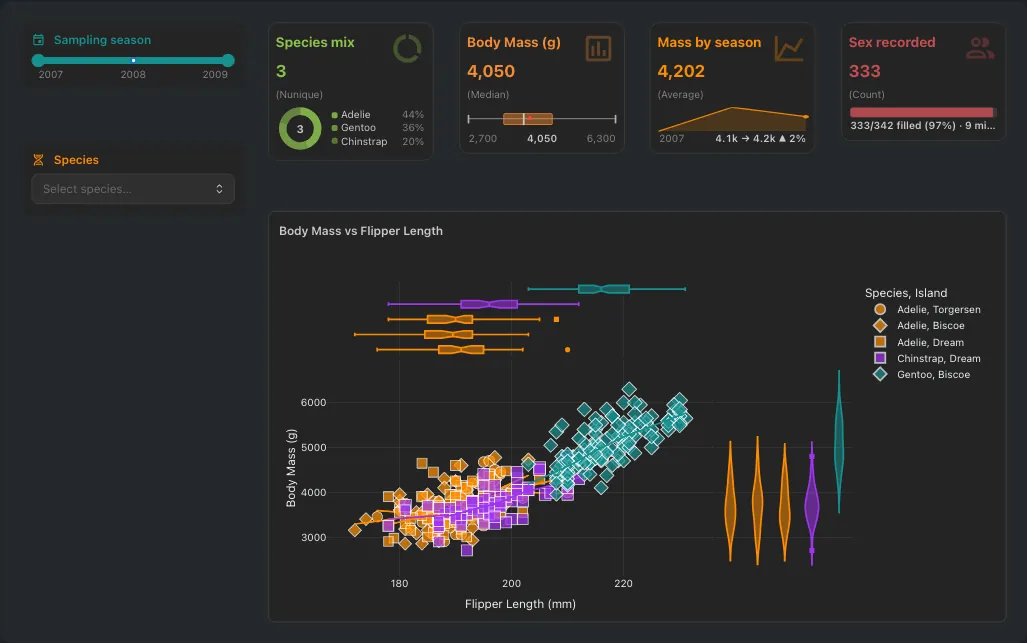
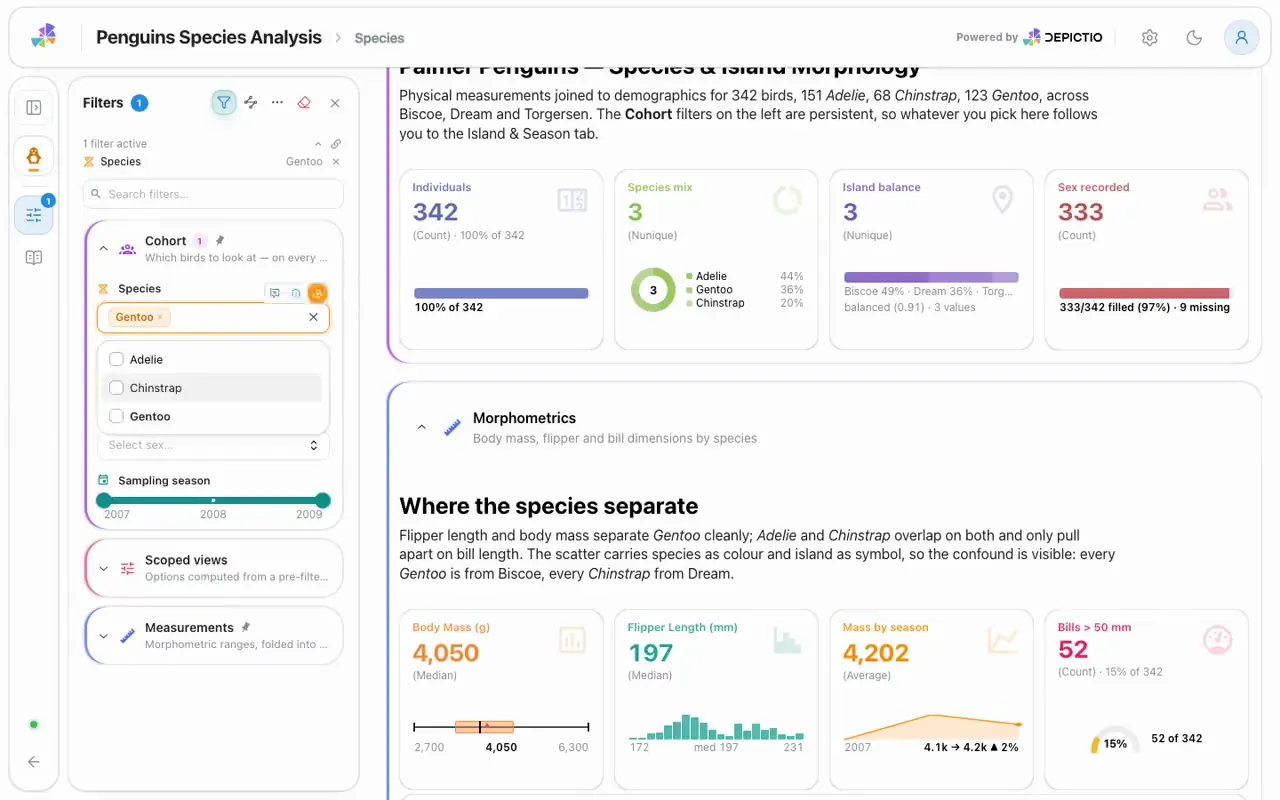
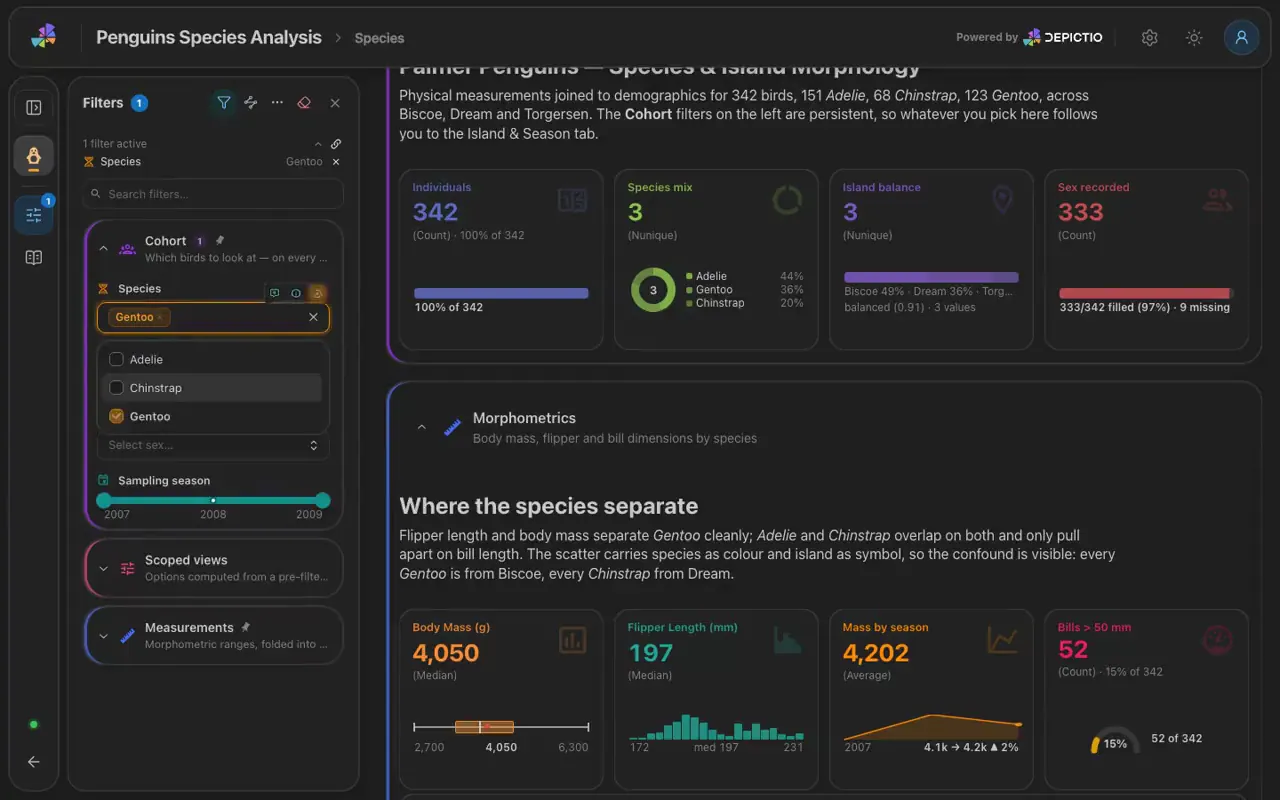
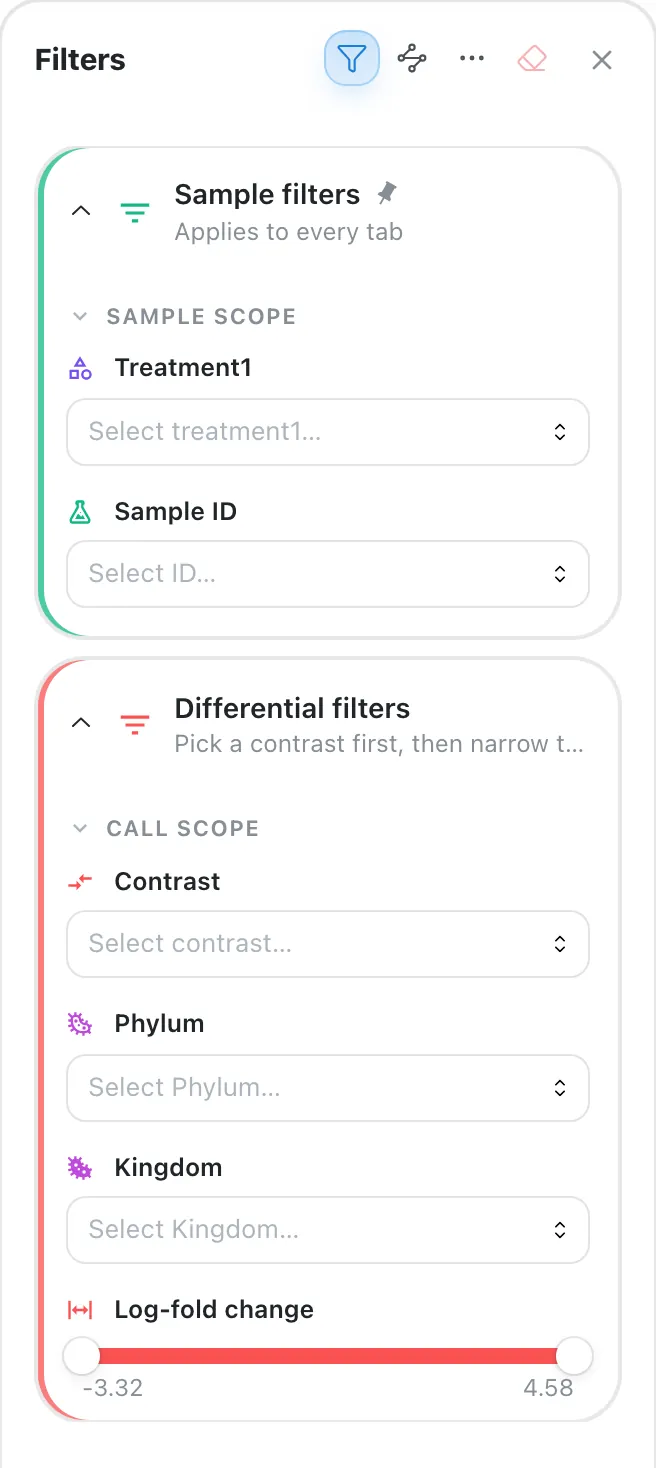
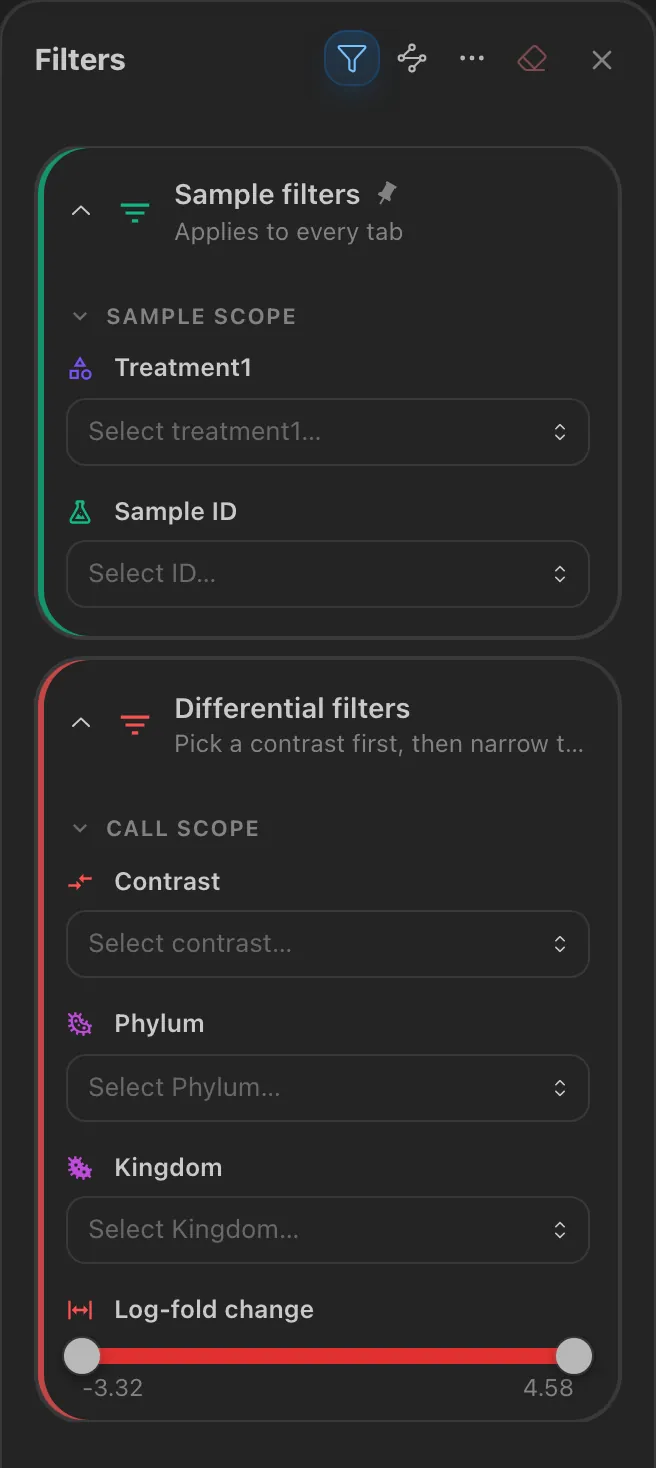
- Range slider, slider, multi-select, date picker, segmented control, text search
- Each filter applies to every linked component
- Grouped in a filter panel at the side of the dashboard
MultiQC
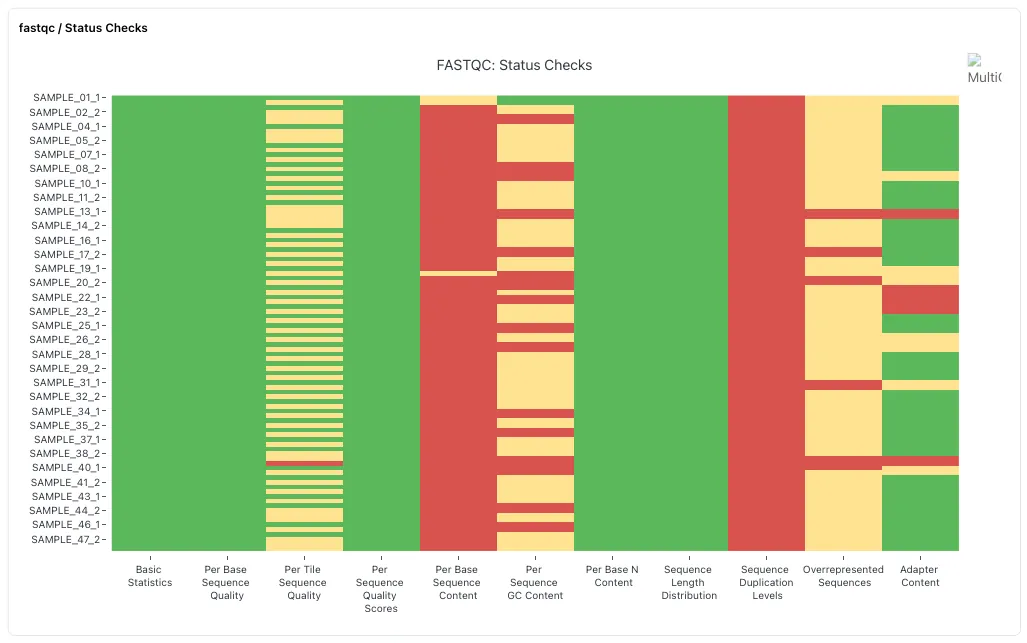
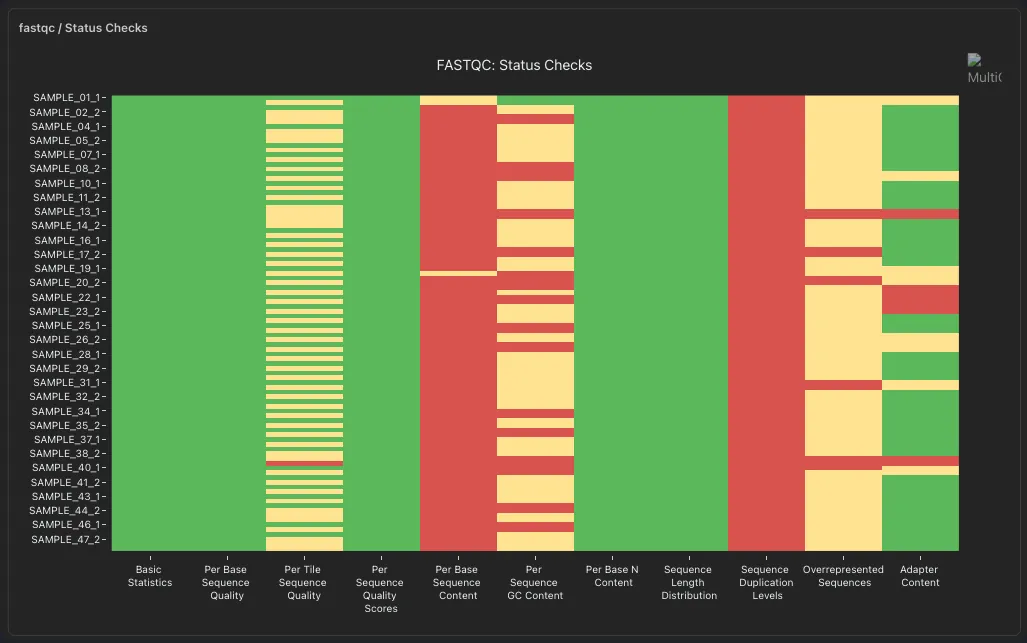
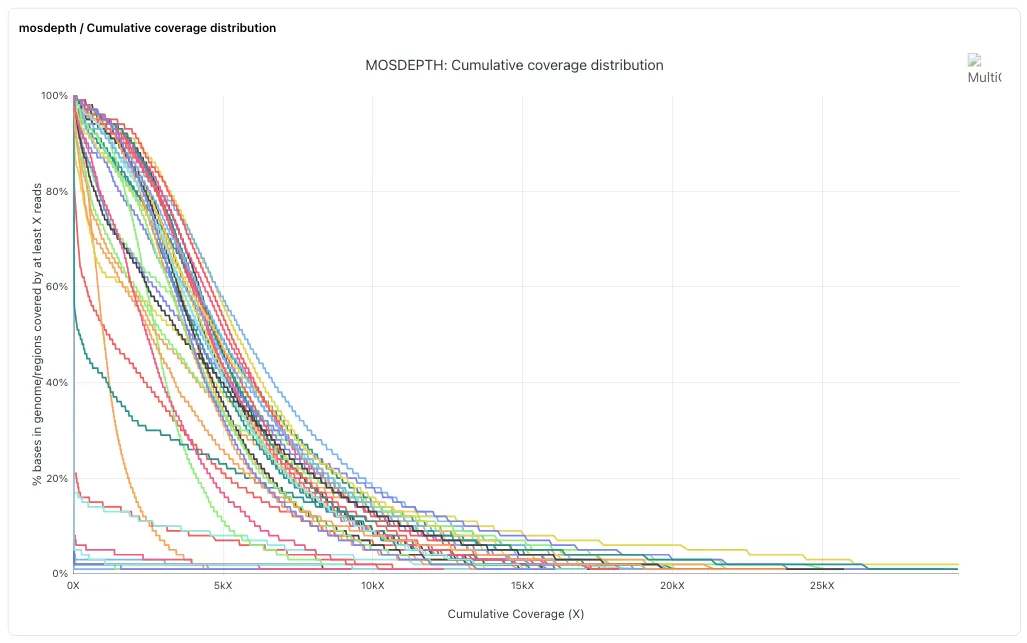
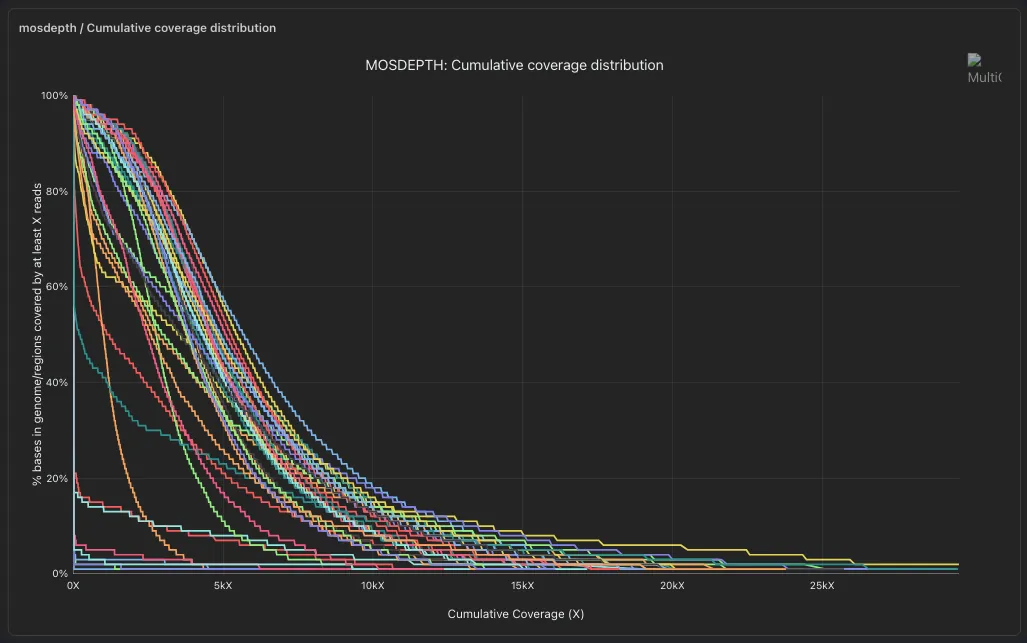
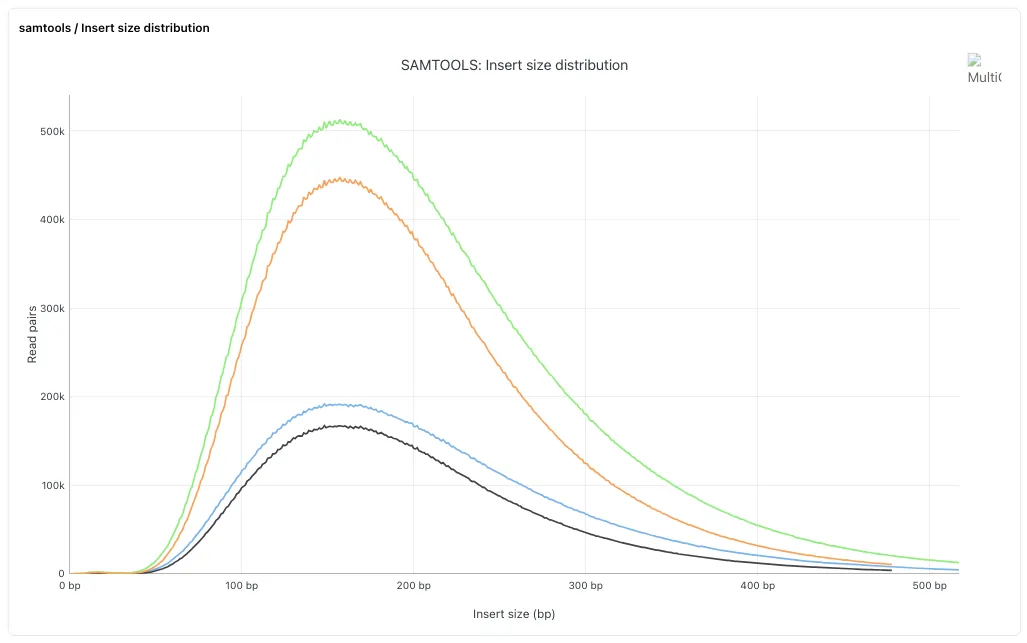
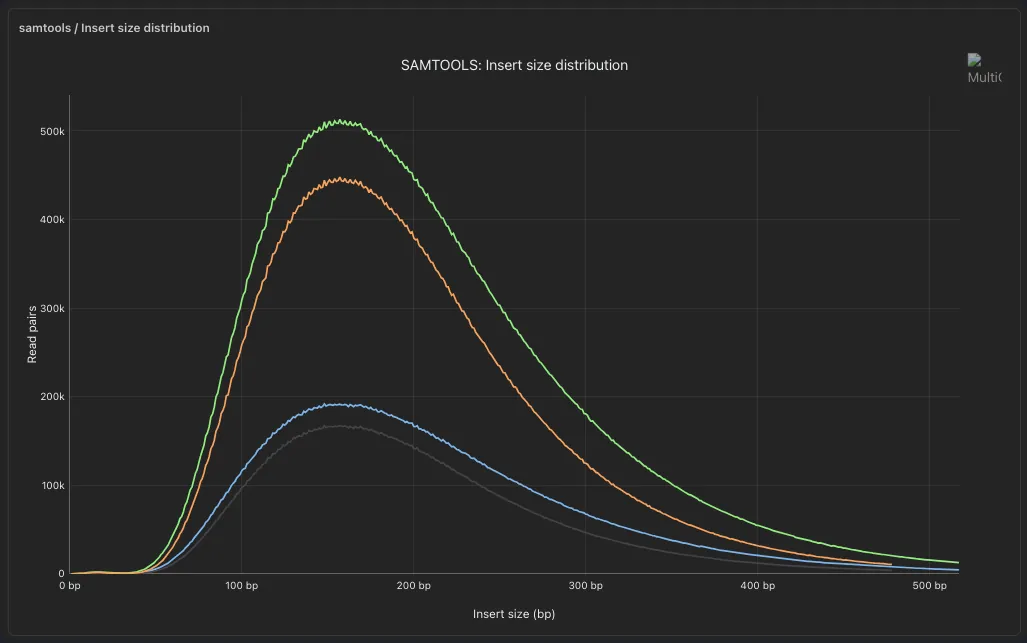
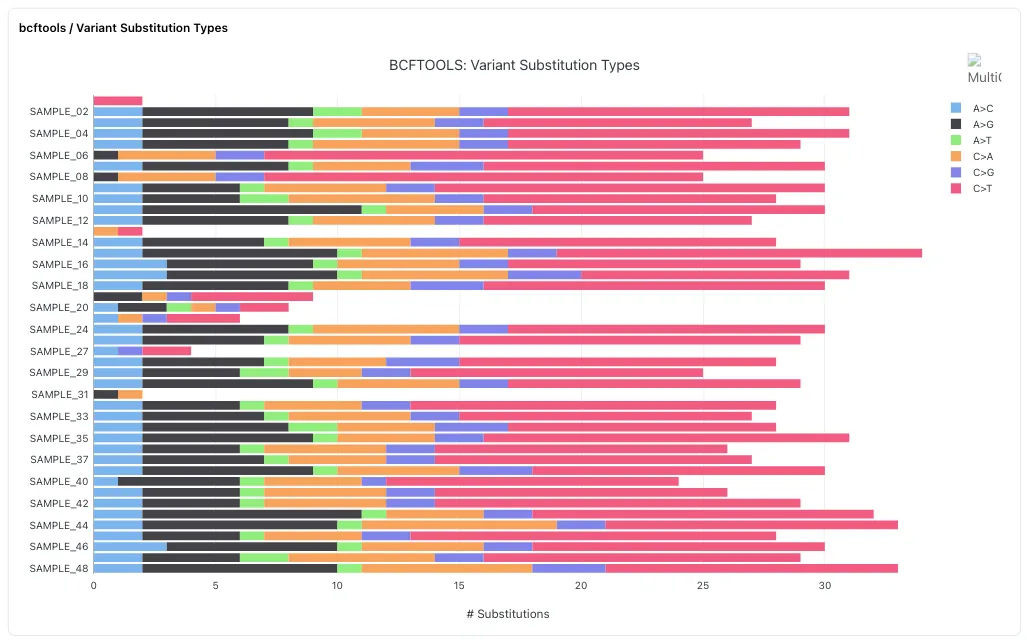
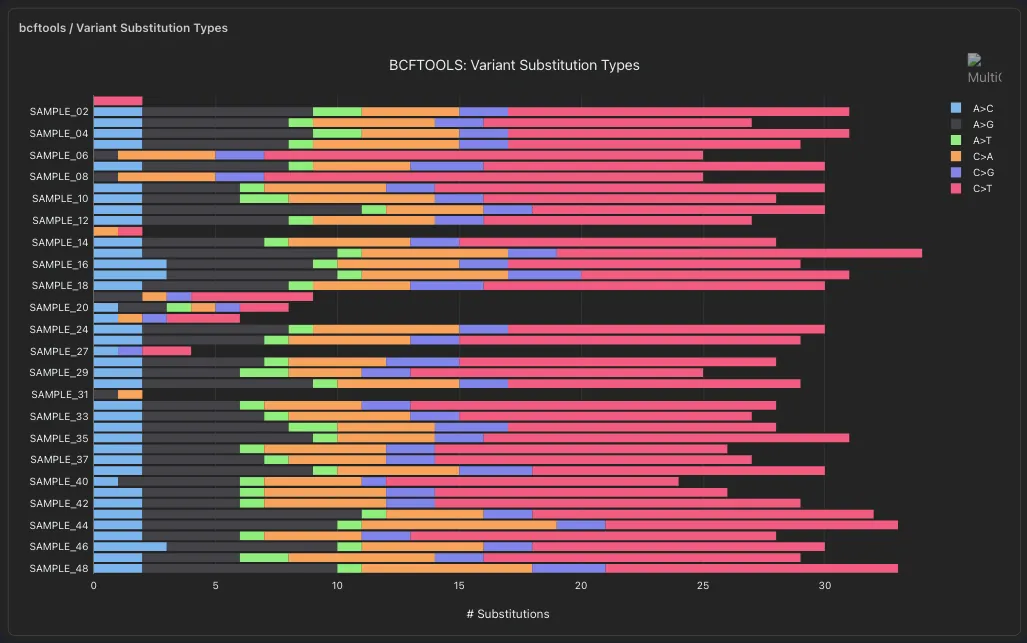
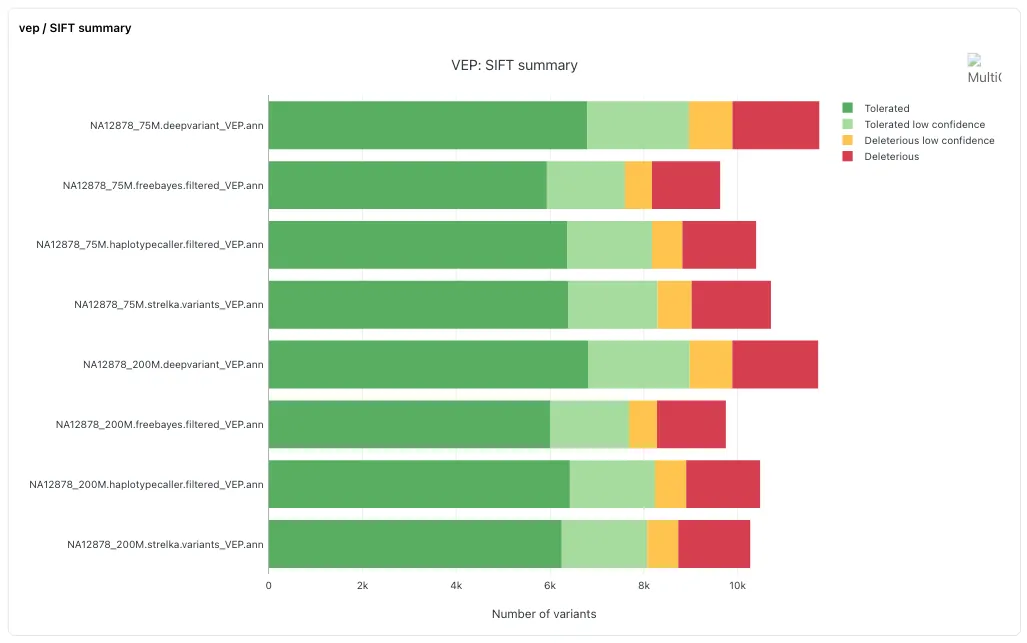
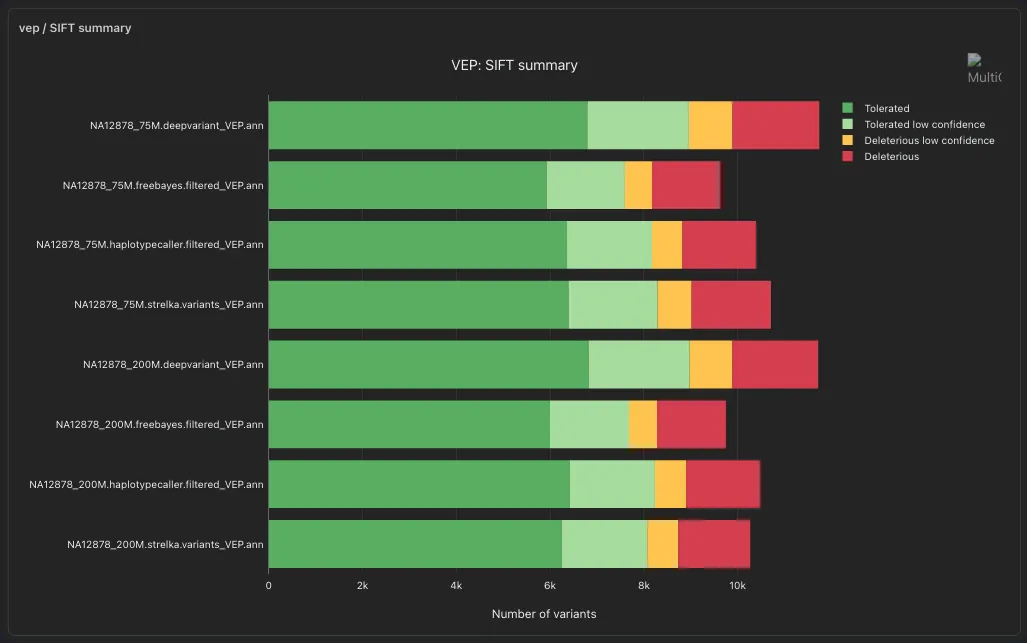
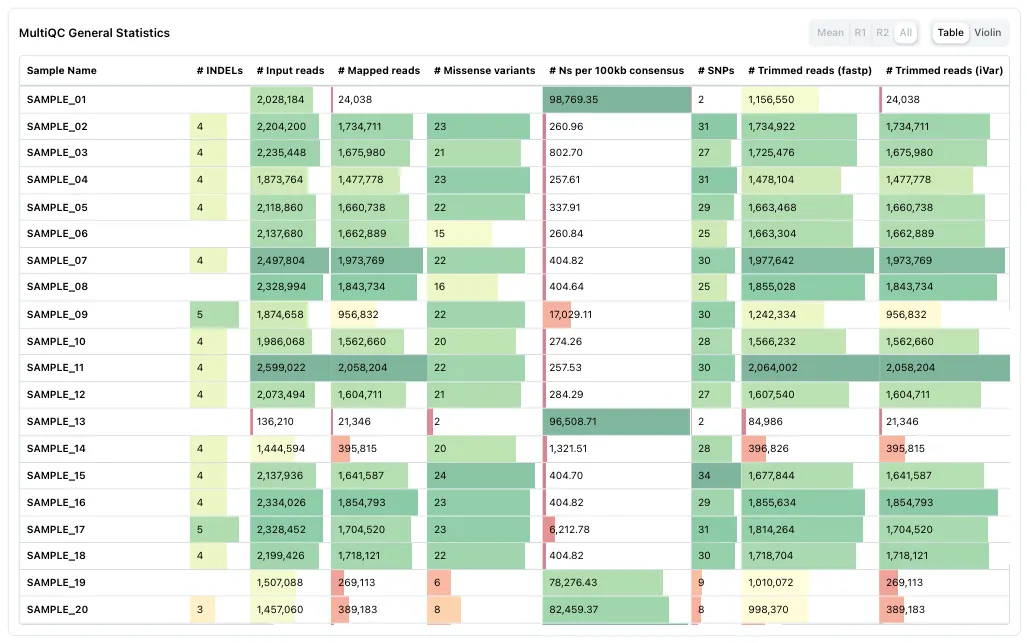
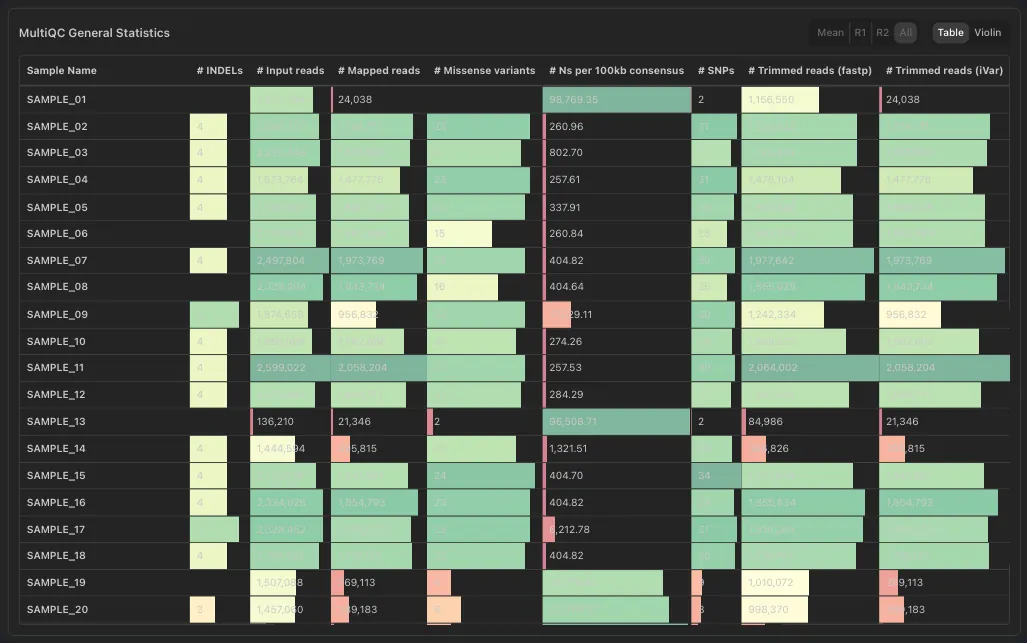
- MultiQC plots and the general stats table, inside the dashboard
- Filtered with the rest of the dashboard
Map
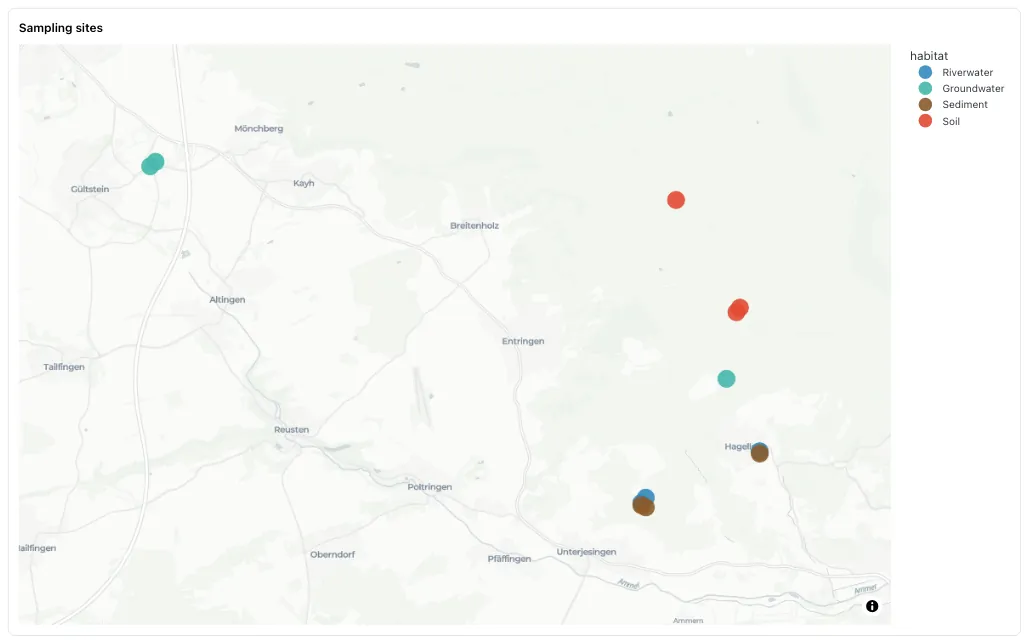
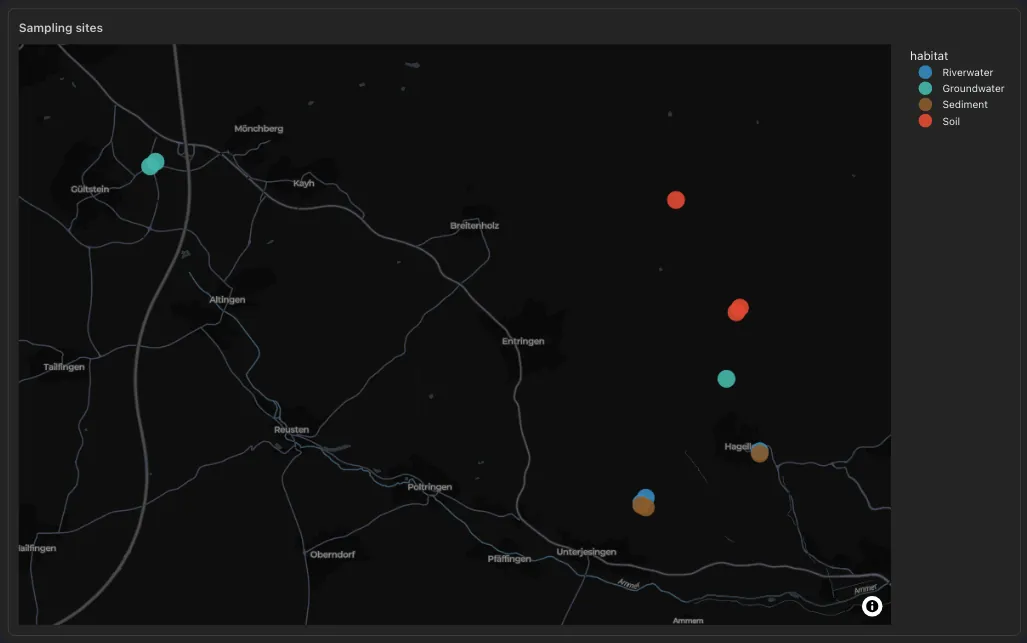
- Tile maps from latitude and longitude columns, no API key
- A click or a lasso on the sites filters the dashboard
Genome browser
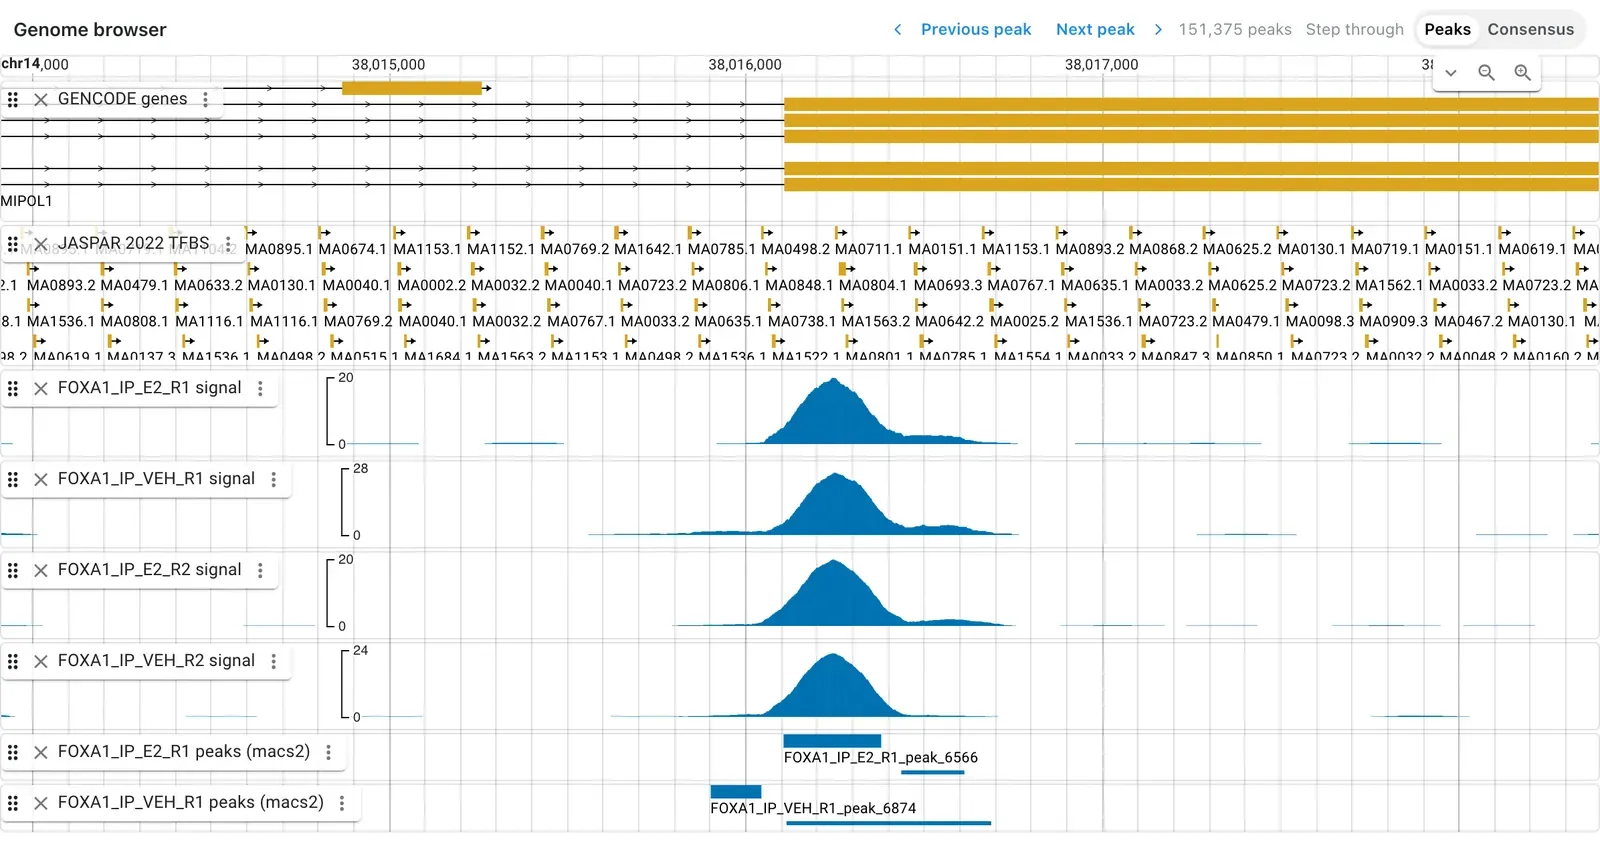
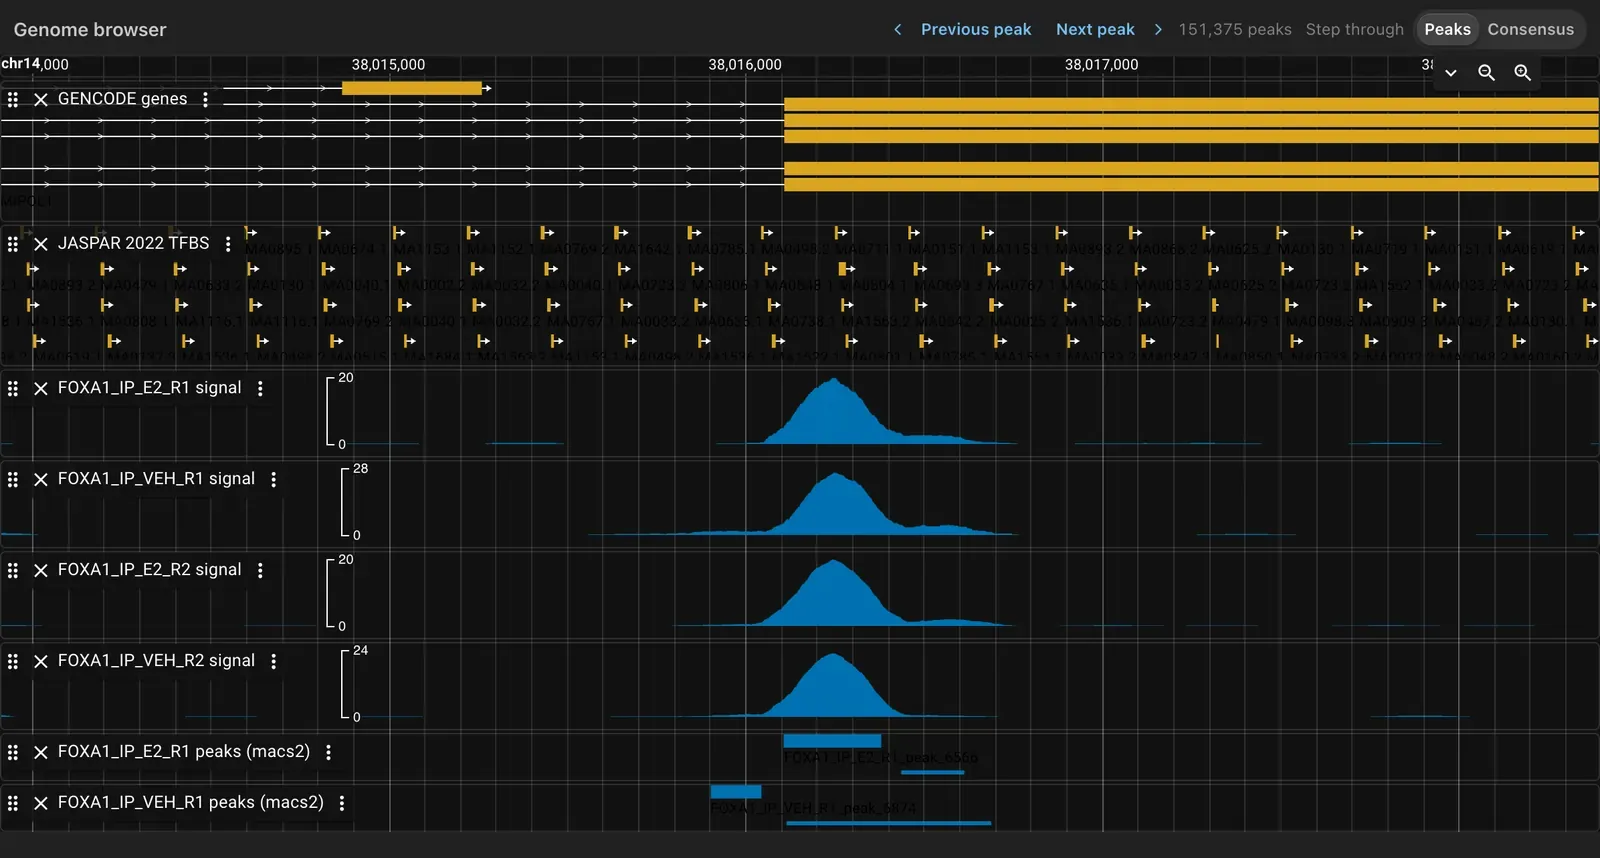
- JBrowse 2 inside the dashboard, no browser server to run, bound to a manifest of track files: bigWig, BAM, VCF, BED, GFF
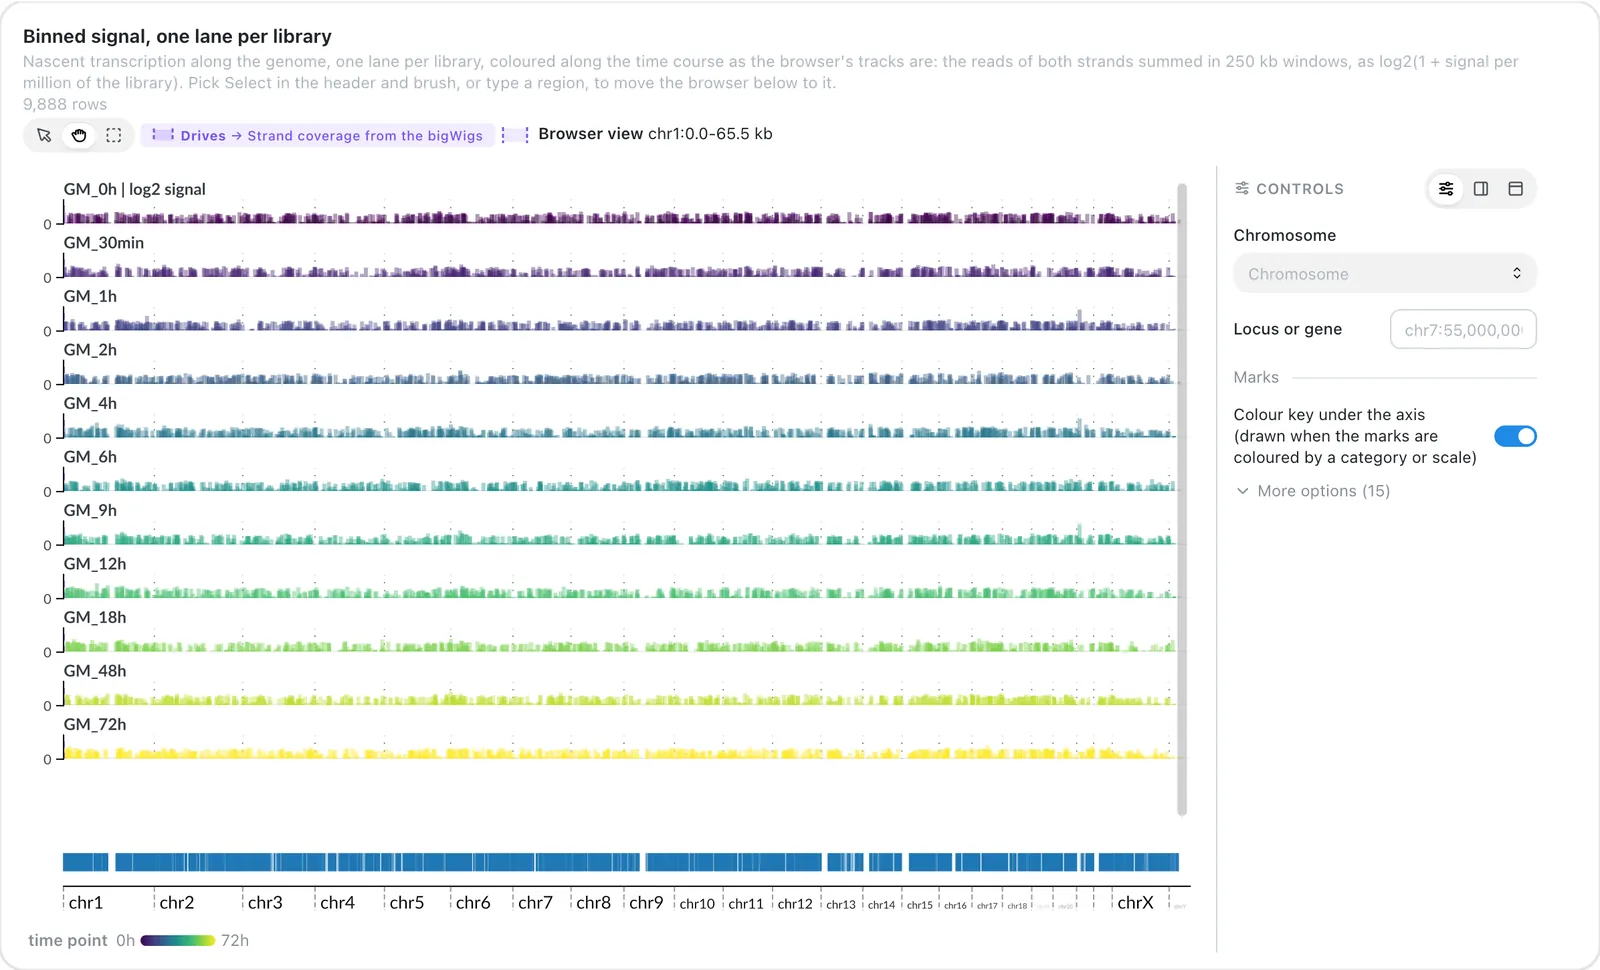
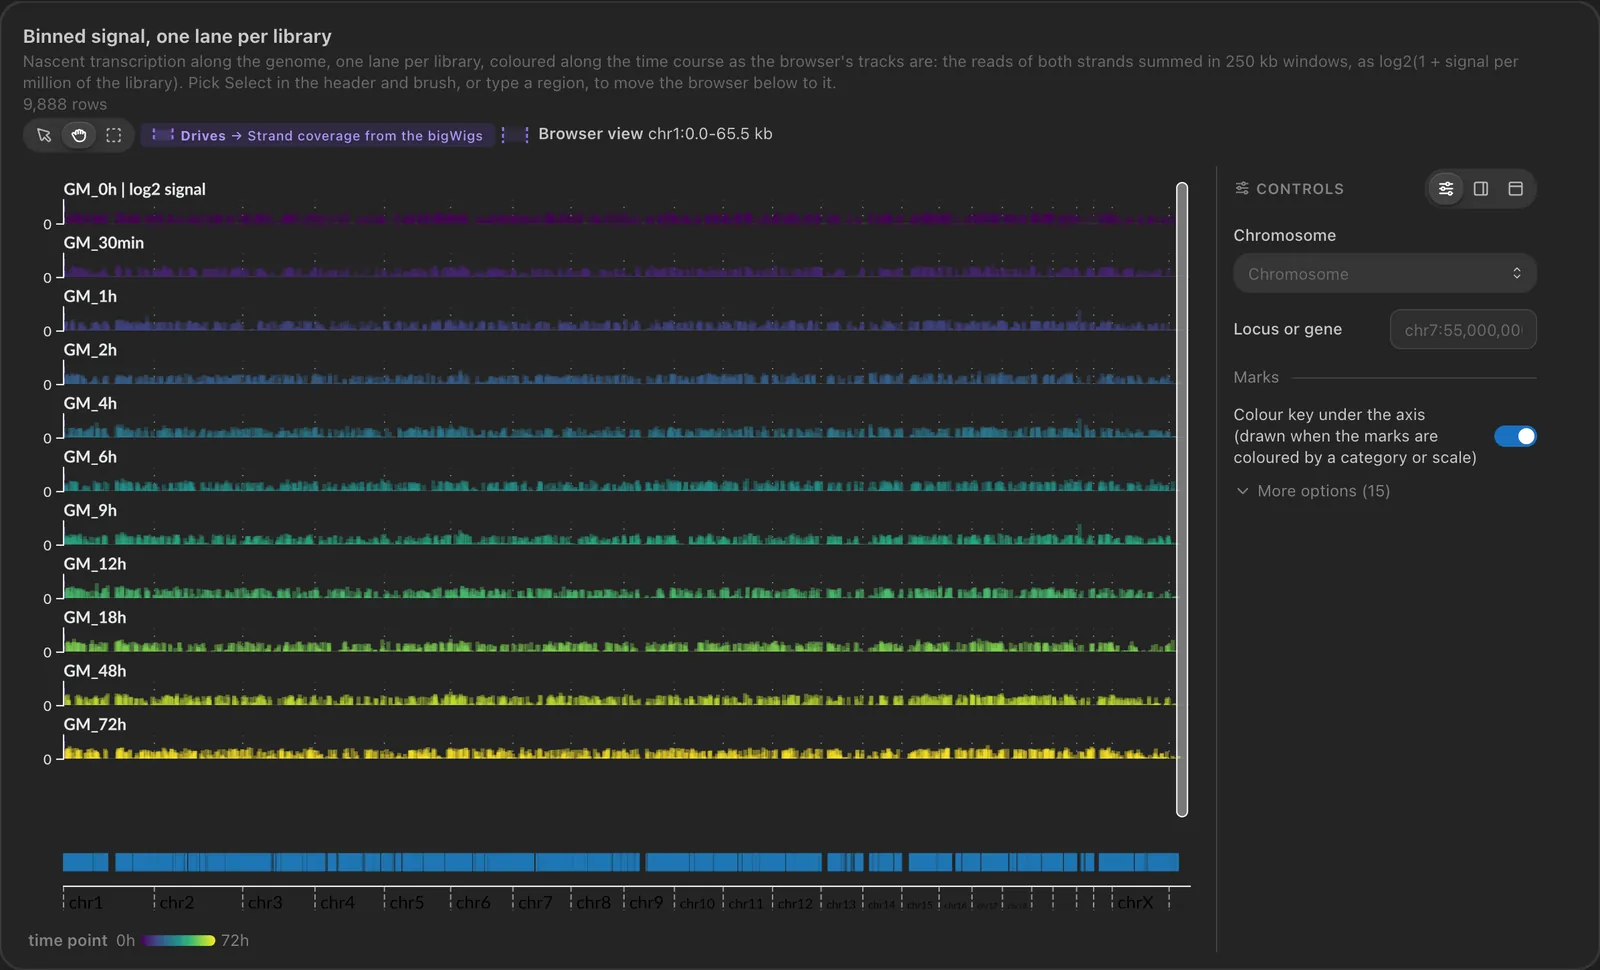
- GenomeSpy lanes (the Navigator) show every library along the genome, here coloured by time point: brush a region and the browser opens on it
- The browser's window is drawn as a band on the lanes, and a click on a feature filters the dashboard on its sample
- Filters pick the tracks and frame the locus
Text
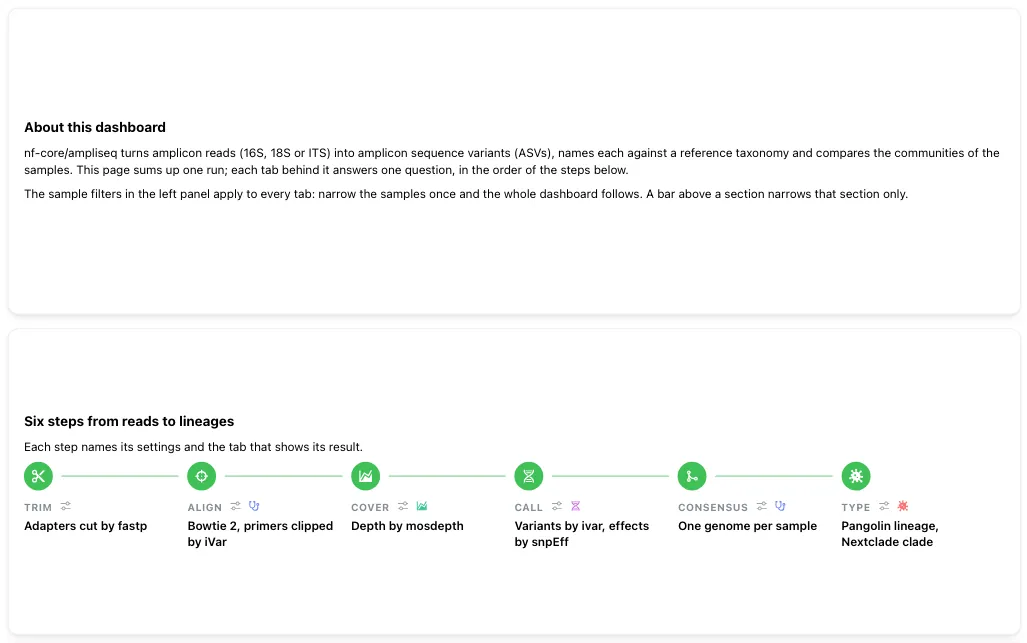
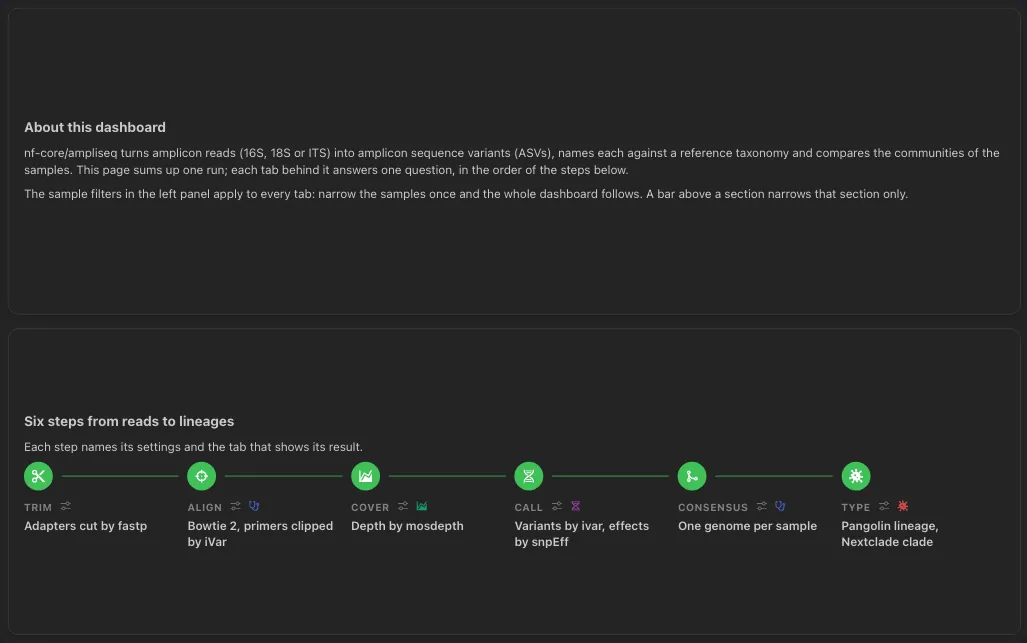
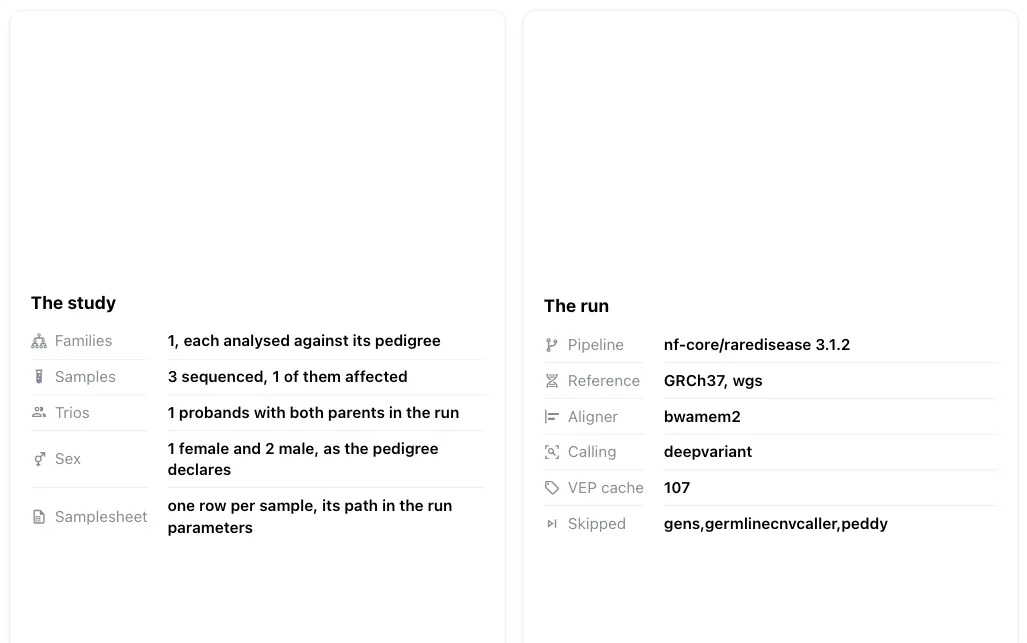
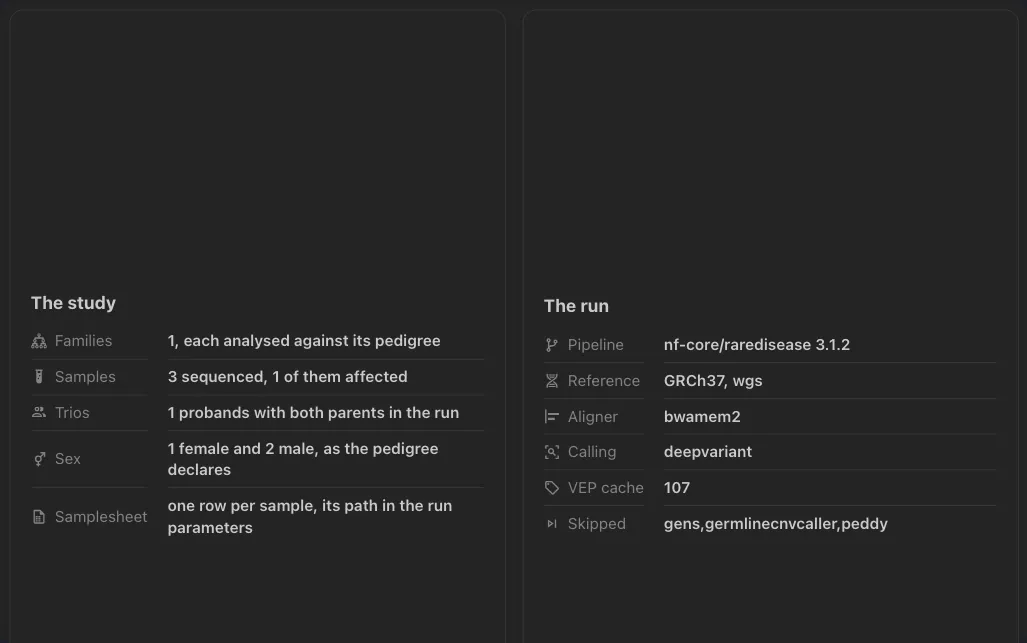
- Markdown blocks between the plots
- Say what the dashboard answers and how to read it
- Values computed from the data and the run parameters, kept up to date
Image
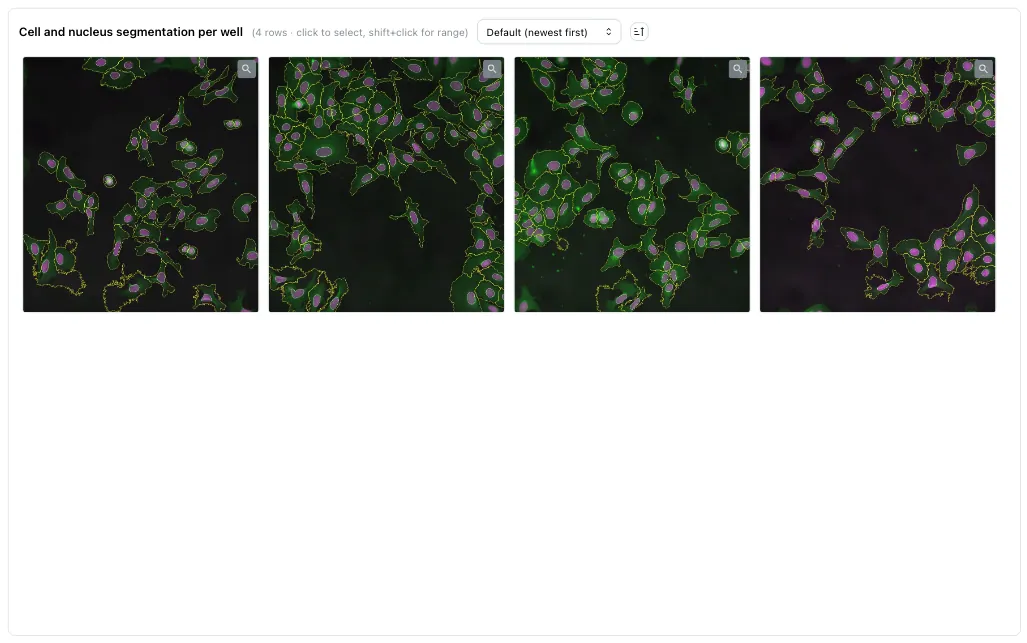
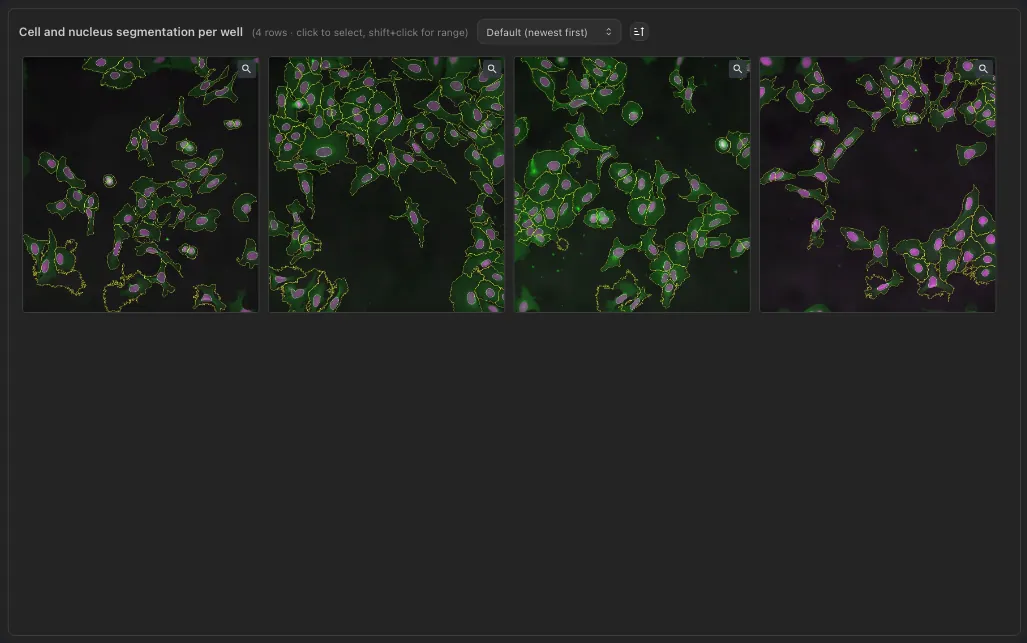
- Image galleries served from S3 or MinIO storage
- Filtered by the dashboard's interactive components
- Click a thumbnail for the full-size image
A selection, not the full list: each component has more types, options and layouts. See all components and the advanced visualizations.
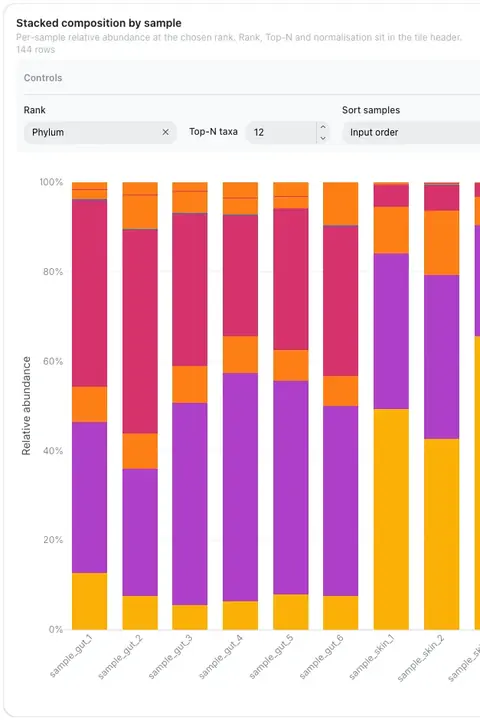
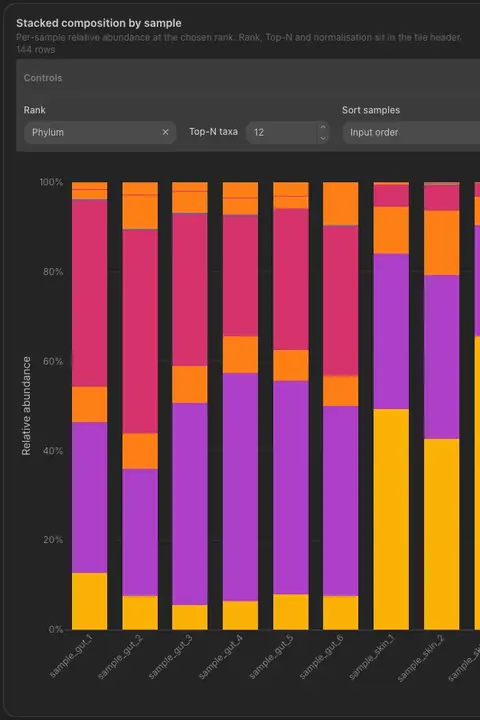
The dashboard below is the output of an nf-core/ampliseq run, ingested with the CLI and built from a pipeline template. The demo signs you straight into a temporary account, so you can browse the pre-loaded projects and create your own without registering.
Note: Accounts and related data will be reset after 1 hour to keep the demo environment clean.
Get started with Depictio
Key Features
From the command line that reads your pipeline output to the instance an admin runs in production.
01Your data, in one placeProjects →

One pipeline, many runs, one place
A project holds the workflows, the data collections and the dashboards that belong together. Declare it in a YAML file or build it from the browser, whichever suits the run. A template turns that declaration into a reusable recipe: one command against a new run of the same pipeline and the whole thing stands up again, project, data collections and dashboards included, ready to read.
What a project is → Templates →Or just drop the file in
No pipeline to point at yet? Drop a CSV, TSV, Parquet or Feather file straight into a project from the browser, or a MultiQC report, and Depictio scans it and aggregates it into a Delta table for you. The collection is ready to build on without touching the CLI, and you can link two of them on a shared column from the same screen, so a filter on one reaches every component built on the other.
Start a project →Read where your data lives
Point depictio ingest at a finished run, on your laptop or on the cluster where it landed, and it scans the output in place, pushing only the aggregated results, never the raw files. Smaller collections can be added straight from the browser instead. Either way the ingestion report says what was found, what was missing, and the parameters the pipeline ran with.
Or let the pipeline ingest itself
Install the trigger once on the machine that runs nextflow, and a pipeline that completes is ingested into Depictio on its own, with the template picked from the pipeline's name and version and not a line about Depictio in the pipeline. Install it opt-in with --default-disabled and only the runs that pass --depictio_enabled true are ingested. A failed run is never ingested, and a problem on Depictio's side leaves the pipeline's exit status alone.
02Build the dashboardBuild a dashboard →
Drag, drop, resize
Every component sits on the same grid: drag one anywhere, pull its corner to resize it, and the cards around it move out of the way. Figures, tables, metric cards, image galleries, maps, text, filters and MultiQC panels all behave the same way, and the layout is saved as you go. Nothing here needs code.
Add a component →Design your component
Adding a component starts with a choice, and this is the first branch: pick the type, connect it to a data collection, then tune it against a live preview. Axes, colours, layout, cross-filtering, and Code Mode when you want the Plotly figure itself.
Build a dashboard →Or take one off the shelf
The other branch: the tools catalog recognises which tool produced each output in your project and offers the visualizations that tool is known to support, pre-configured and previewed at the exact grid box the component will occupy.
Pick from the catalog →components:
- component_type: card
data_collection_tag: metadata
column_name: sample_id
aggregation: nunique
- component_type: advanced_viz
data_collection_tag: ancombc
viz_kind: volcanoOr write the dashboard as code
Export any dashboard to a YAML file, review it in a pull request, and import it back into another instance. Sections, filters and every component are plain fields, so a change to a dashboard reviews like any other change.
Dashboards as YAML →Room for a real dashboard
Group cards into sections, keep one filter panel across a family of tabs, dock a map beside the data, and inspect any component to see where its numbers come from.
Sections and tabs →Go back to any version, data included
Every change to a dashboard is kept as a version: bookmark one, share it as a read-only preview link, restore it, or bring back a single component. A version also records which commit of each table it drew from, so a past dashboard is shown with the data it showed at the time, and the editor can draw today's layout from earlier data.
Dashboard and data versions →03Read the scienceComponents →
Plots built for omics
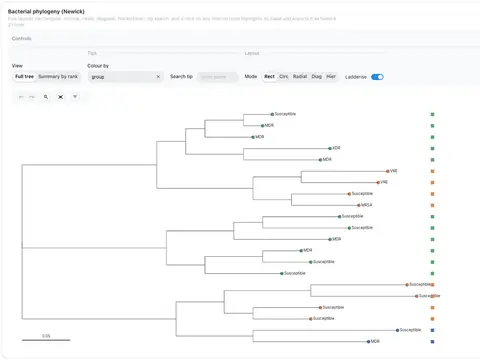
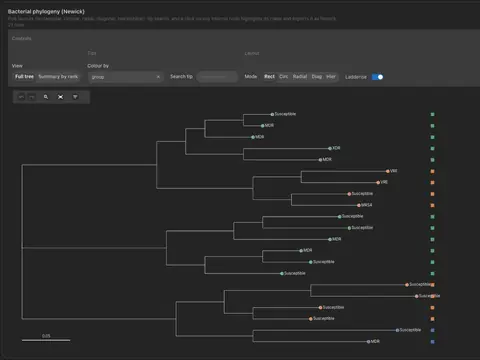
Volcano, Manhattan, UpSet, hierarchical heatmaps, phylogeny, ordination and many more, alongside the usual scatter and bar charts. Each one is an advanced viz: you bind it to any table or file whose columns fit it, rather than waiting for the tool that produced the data to draw it for you.
Every advanced viz →Pick a clade, filter everything
Click any internal node and the panel names what you picked: how many tips it holds, how deep it runs, how well the branch is supported, and how those tips break down by taxonomy. Send it through as a filter and every other component on the dashboard narrows to the same samples.
Phylogeny interaction →

Every QC report, in the dashboard
Hand Depictio the MultiQC reports a run produced, from the CLI or straight from the browser, and it aggregates them across every sample and every run; and their data becomes components you place like any other: General Statistics as a table, each module's plot as its own card. Then it goes past what the HTML report can do: join those panels to your sample sheet and to any other collection in the project, and filter all of them at once from your own metadata, from a map, from a date picker, or from any other filter component on the dashboard.
Working with MultiQC →Slice it, then compare
Lasso points on a plot, pick rows in a table, or select a region on the map, then save what you picked as a named group. Every component on the dashboard then colours by that grouping at once, or splits into one panel per group, so treated and control sit side by side instead of in two browser tabs. Groups survive a reload and travel with the dashboard, so the comparison is something you share rather than something you rebuild.
Selection groups →Where the samples came from
Any collection carrying coordinates becomes a map: points, choropleths from your own GeoJSON, or a panel that follows you across every tab. Dock it in the filter rail or float it over the grid, and lasso a region to filter every other component down to the samples inside it, exactly like a dropdown would. Geography stops being a column in a table and becomes a way to ask questions of the run.
The map panel →04Run it, extend itAdministration →
Watch a run as it lands
Opt a project into real-time events and its dashboards hold a WebSocket open. Each time the CLI ingests new data the server broadcasts on that channel and the affected components refresh themselves, with no reload and no polling. A log beside the grid lists the events as they arrive, so you can watch a run fill a dashboard in while it is still running.
Real-time events →Run your own instance
Depictio is meant to be self-hosted, and the admin panel is built for that: scheduled backups with a retention policy and a restore gated behind validation, tasks, ingestion runs, logs and service health in one view, users and groups, and branding that reaches the whole instance, its name, its logo, its palette, the login screen and the figures it renders.
Monitoring and tasks →
Add your tool without writing YAML
And the shelf is yours to stock. Drop one output file, bind its columns in Depictio's own component builder, and Tool Studio writes the catalog entry and opens the pull request for you, so the next person picks what you designed.
Open Tool Studio →Tools Catalog
Depictio recognises the bioinformatics tools behind your data and offers the visualizations those tools are known to support, ready to drop on a dashboard.
Browse the catalog
Every recognised tool, every output, and what each one renders as. Previewed on real fixture data.
Open the catalog →Pick, don't build
Adding a component starts with a choice: build it yourself, or pick a pre-configured one the catalog matched to your data.
See the picker →Contribute a tool
Tool Studio authors an entry in the browser: drop an output file, bind its columns, and it opens the pull request for you.
Open Tool Studio →Getting Started
Ready to get started with Depictio?
Three commands, from results to dashboard
On a laptop and without Docker: install the package, start the server, then point it at a pipeline's output. The same server runs in Docker Compose or Kubernetes when a team needs it, and a local server moves to Docker Compose with its data.
Python package installation →uv tool install "depictio[local]"
depictio local up
depictio ingest path/to/resultsLive demo
Example dashboards, ready to explore
No sign-upCodespaces
The Python package, in a cloud workspace
No installPython package
Try it on a laptop, no containers
No Docker
Docker Compose
A shared instance for a team or a demo
Recommended
Kubernetes
For production environments
ProductionCLI Tools
For data ingestion and management
ToolsFunding
Depictio is developed with the support of academic and public funding, enabling us to provide a free and open-source platform for the bioinformatics community.

Marie Skłodowska-Curie Grant
This project has received funding from the European Union's Horizon 2020 research and innovation programme under the Marie Skłodowska-Curie grant agreement No 945405
Learn More
ARISE Programme
ARISE is a postdoctoral research programme for technology developers, hosted at EMBL.
Learn More
EMBL
The European Molecular Biology Laboratory is Europe's flagship laboratory for the life sciences.
Learn MoreAcademic Partners
SciLifeLab Data Centre
SciLifeLab Data Centre provides data-driven life science research infrastructure and expertise to accelerate open science in Sweden and beyond.
Learn More