

The smrnaseq template follows an nf-core/smrnaseq run from trimmed small RNA libraries to novel miRNA candidates:
- Overview: the run in four key figures, live findings and four figures, each linked to the tab that explains it
- Data & QC: the MultiQC report, then what each library is made of, how long its reads are and whether it was sequenced deep enough
- Expression: which miRNAs each library carries and which vary most, how the libraries relate, and which miRNAs separate two groups
- Sequences: how far the reads stray from the reference miRNA sequences, and the precursors miRDeep2 proposes beyond miRBase
The persistent Sample filters (the design group, then the sample) sit in the
left panel and narrow every tab.
Expression is aggregated from the mirtop isomiR table
The template reads miRNA expression from mirtop's joined isomiR table, one row per isomiR with a count column per sample, and aggregates it per miRNA. CPM is therefore over miRNA-assigned reads. miRTrace publishes no statistics table of its own, so its composition, length and complexity views are read back from the plot data MultiQC keeps in its parquet.
Quick start
depictio ingest /path/to/smrnaseq_results \
  --template nf-core/smrnaseq/latest \
  --var METADATA_FILE=/path/to/design.tsv \
  --var GENOME=hg38
The pipeline samplesheet carries no design column, so the design comes from
an optional table: METADATA_FILE, sample id in the first column (or in a
column named sample), one column per factor, and GROUP_COL defaulting to
the first factor. Without it the design table, the group filters and the
group splits are dropped and the figures fall back to one colour. GENOME (default hg38) is the UCSC
assembly the novel precursors link out to. A run with --skip_mirdeep takes
--var SKIP_MIRDEEP=true, one with --skip_multiqc takes
--var SKIP_MULTIQC=true.
depictio config nextflow --install     # once per machine
nextflow run nf-core/smrnaseq -r 2.4.1 -profile docker --outdir results
No depictio ingest, and no template named: the pipeline ingests its own
output directory when it finishes and resolves this template from its own
manifest. See Nextflow trigger.
Reference
The template reads the MultiQC report, the mirtop joined isomiR table, the
miRDeep2 per-sample results and the optional design table. The sample hub, the
per-miRNA summary, the PCA, the heatmap matrix, the isomiR composition and the
miRDeep2 precursors are recipes over those files. 40 of its 58 tiles carry a
use: catalog reference, so a tile says where its panel comes from.
Self-adapting layout
The dashboard adapts to whatever the run actually produced: components bound to pruned or unparsed data collections are hidden, tabs left with no real visualizations are dropped entirely, and the remaining components are re-packed so there are no empty rows.
Template variables
Variables you provide when running the template: DATA_ROOT is the results directory given to depictio ingest, the others are set with --var NAME=value:
| Variable | Required | Description |
|---|---|---|
DATA_ROOT |
✓ | Root directory of one smrnaseq run (multiqc/, mirna_quant/, the miRDeep2 result_*.csv tables, pipeline_info/) |
METADATA_FILE |
— | Optional design table (TSV or CSV): sample id in the first column (or a column named sample), one column per factor. Enables the design filters, colouring and the group comparison defaults. |
METADATA_ID_COL |
— | Design table sample-id column (links join on it). Auto-detected as the first column; defaults to 'sample'. |
GROUP_COL |
— | Design column the dashboards group and colour by. Auto-detected as the first factor column of METADATA_FILE. |
GENOME |
— | UCSC assembly name the novel precursor coordinates are linked out to (the genome the run mapped to). |
SKIP_MIRDEEP |
— | Set (--var SKIP_MIRDEEP=true) for a run with --skip_mirdeep: no result_*.csv tables, so the miRDeep2 collections are pruned. |
SKIP_MULTIQC |
— | Set (--var SKIP_MULTIQC=true) for a run with --skip_multiqc: no report, so the MultiQC and miRTrace collections are pruned. |
Auto-detected (set from the run's metadata / params.json; the route flags drive Conditional routes below): GROUP_COL_DISPLAY, ANNOTATION_COLS
Data collections
17 data collections — 9 required 8 optional · 8 direct 9 derived.
Origin tells you whether a collection is real pipeline data or a reshape of it: direct = a pipeline output (scanned, or a recipe that reads raw files); derived = a recipe that reshapes one or more direct collections into the layout a visualization needs (no new measurement). Reads shows what produces it: a recipe .py transform, whose name links to its source on GitHub, or a raw file scanned off disk. (A direct collection can still have a recipe — one that merely parses/cleans the raw file; derived means the recipe reshapes another collection.)
| Tag | Origin | Type | Reads | Status |
|---|---|---|---|---|
multiqc_data |
direct |  MultiQC MultiQC |
file (?:.*/)?multiqc(?:/[^/]+)?/multiqc(?:_report)?_data/multiqc.parquet$ |
required |
metadata |
direct | Table | file {METADATA_FILE} |
optional |
mirtop_mirna_counts |
derived | Table | recipe mirtop/mirna_counts.py |
required |
mirtop_sample_matrix |
derived | Table | recipe mirtop/sample_matrix.py |
required |
mirtop_sample_pca |
derived | Table | recipe mirtop/sample_pca.py |
required |
mirtop_top_variable_heatmap |
derived | Table | recipe mirtop/top_variable_heatmap.py |
required |
mirtop_mirna_summary |
derived | Table | recipe mirtop/mirna_summary.py |
required |
mirtop_isomir_composition |
direct | Table | recipe mirtop/isomir_composition.py |
required |
mirtop_isomir_landscape |
direct | Table | recipe mirtop/isomir_landscape.py |
required |
mirtrace_composition |
direct | Table | recipe multiqc/mirtrace_composition.py |
optional |
mirtrace_length |
direct | Table | recipe multiqc/mirtrace_length.py |
optional |
mirtrace_complexity |
direct | Table | recipe multiqc/mirtrace_complexity.py |
optional |
mirdeep2_results_raw |
direct | Table | file result_.+.csv$ |
optional |
mirdeep2_predictions |
derived | Table | recipe mirdeep2/predictions.py |
optional |
mirdeep2_novel_precursors |
derived | Table | recipe mirdeep2/novel_precursors.py |
optional |
mirdeep2_score_summary |
derived | Table | recipe mirdeep2/score_summary.py |
optional |
samples |
derived | Table | recipe nf-core/smrnaseq/samples.py |
required |
Conditional routes
Rows are data collections; columns are the variables you set or params.json flags auto-detected from the run. Each filled cell is the effect of setting that variable; an empty cell means that variable leaves the collection unchanged. (8 collections are unaffected by any variable — present on every run.)
+ included− removed⇄ repointed
| Data collection | METADATA_FILE |
SKIP_MIRDEEP |
SKIP_MULTIQC |
|---|---|---|---|
multiqc_data |
− | ||
metadata |
+ | ||
mirtrace_composition |
− | ||
mirtrace_length |
− | ||
mirtrace_complexity |
− | ||
mirdeep2_results_raw |
− | ||
mirdeep2_predictions |
− | ||
mirdeep2_novel_precursors |
− | ||
mirdeep2_score_summary |
− |
Cross-DC links
25 links — selecting a value in the source collection filters the target. The join column is shown after the source.
| Source · column | Target | Filters | |
|---|---|---|---|
samples · sample |
→ | multiqc_data |
Filter the MultiQC panels by the sample hub selection |
samples · sample |
→ | mirtop_mirna_counts |
Filter the per-sample miRNA counts by the sample hub selection |
samples · sample |
→ | mirtop_sample_matrix |
Filter the comparison matrix by the sample hub selection |
samples · sample |
→ | mirtop_sample_pca |
Filter the sample PCA by the sample hub selection |
samples · sample |
→ | mirtop_top_variable_heatmap |
Filter the heatmap columns (column subset on a wide matrix) by the sample hub selection |
samples · sample |
→ | mirtop_isomir_composition |
Filter the isomiR composition by the sample hub selection |
samples · sample |
→ | mirtrace_composition |
Filter the miRTrace composition by the sample hub selection |
samples · sample |
→ | mirtrace_length |
Filter the length profiles by the sample hub selection |
samples · sample |
→ | mirtrace_complexity |
Filter the complexity curves by the sample hub selection |
samples · sample |
→ | mirdeep2_predictions |
Filter the miRDeep2 calls by the sample hub selection |
samples · sample |
→ | mirdeep2_score_summary |
Filter the miRDeep2 score calibration by the sample hub selection |
metadata · {METADATA_ID_COL} |
→ | multiqc_data |
Filter the MultiQC panels by the design table selection |
metadata · {METADATA_ID_COL} |
→ | samples |
Filter the sample hub by the design table selection |
metadata · {METADATA_ID_COL} |
→ | mirtop_mirna_counts |
Filter the per-sample miRNA counts by the design table selection |
metadata · {METADATA_ID_COL} |
→ | mirtop_sample_matrix |
Filter the comparison matrix by the design table selection |
metadata · {METADATA_ID_COL} |
→ | mirtop_sample_pca |
Filter the sample PCA by the design table selection |
metadata · {METADATA_ID_COL} |
→ | mirtop_top_variable_heatmap |
Filter the heatmap columns (column subset on a wide matrix) by the design table selection |
metadata · {METADATA_ID_COL} |
→ | mirtop_isomir_composition |
Filter the isomiR composition by the design table selection |
metadata · {METADATA_ID_COL} |
→ | mirtrace_composition |
Filter the miRTrace composition by the design table selection |
metadata · {METADATA_ID_COL} |
→ | mirtrace_length |
Filter the length profiles by the design table selection |
metadata · {METADATA_ID_COL} |
→ | mirtrace_complexity |
Filter the complexity curves by the design table selection |
metadata · {METADATA_ID_COL} |
→ | mirdeep2_predictions |
Filter the miRDeep2 calls by the design table selection |
metadata · {METADATA_ID_COL} |
→ | mirdeep2_score_summary |
Filter the miRDeep2 score calibration by the design table selection |
mirtop_mirna_summary · mirna |
→ | mirtop_mirna_counts |
Narrow the per-sample counts to the miRNAs picked in the summary |
mirtop_mirna_summary · mirna |
→ | mirtop_isomir_landscape |
Narrow the isomiR landscape to the miRNAs picked in the summary |
Recipes
Each recipe reshapes raw pipeline output into a tidy table. The name links to its source; Output lists the validated OUTPUT_SCHEMA columns.
| Recipe | Transforms | Output |
|---|---|---|
mirdeep2/novel_precursors.py |
Novel miRNA precursors merged across samples, one row per locus. | precursor_id, chromosome, start, end, strand, samples_detected, detection_pct, calls, max_score, median_score, max_true_positive_pct, total_reads, mature_reads, star_reads, loop_reads, star_support, randfold_pct, rfam_alert, seed_match, best_sample, mature_sequence, star_sequence, precursor_sequence, precursor_length, genome_position |
mirdeep2/predictions.py |
miRNA precursor predictions from miRDeep2 result tables, one row per candidate. | prediction_id, sample, category, candidate_id, score, true_positive_pct, true_positive_sd, rfam_alert, total_reads, mature_reads, loop_reads, star_reads, randfold_significant, mirbase_mirna, seed_match, mature_sequence, star_sequence, precursor_sequence, precursor_length, chromosome, start, end, strand, locus |
mirdeep2/score_summary.py |
The miRDeep2 score-cutoff summary, one row per sample and cutoff. | sample, score_cutoff, novel_reported, novel_false_positives, novel_true_positives, known_in_species, known_in_data, known_detected, known_detected_pct, signal_to_noise |
mirtop/isomir_composition.py |
isomiR composition of each sample, in four exclusive partitions. | sample, rank, taxon, abundance, percent |
mirtop/isomir_landscape.py |
Which isomiR classes each of the most expressed miRNAs carries. | mirna, variant_class, mean_share_pct, samples_fraction, class_reads, mirna_rank |
mirtop/mirna_counts.py |
miRNA expression per sample, aggregated from the mirtop isomiR table. | sample, mirna, reads, cpm, log2_cpm, isomirs, reference_pct |
mirtop/mirna_summary.py |
One row per miRNA: how much, how widely and how variably it is expressed. | mirna, arm, expression_rank, total_reads, mean_cpm, median_cpm, mean_log2_cpm, sd_log2_cpm, samples_detected, detection_pct, max_isomirs, reference_pct |
mirtop/sample_matrix.py |
Samples x miRNAs CPM matrix, the input of the two-group comparison. | sample |
mirtop/sample_pca.py |
Sample PCA on miRNA expression, one row per sample. | sample, dim_1, dim_2, dim_3, mirna_reads, mirnas_detected |
mirtop/top_variable_heatmap.py |
Top variable miRNAs x samples, log2(CPM + 1), for ComplexHeatmap. | mirna |
multiqc/mirtrace_complexity.py |
miRNA complexity curves: distinct miRNAs found against reads sequenced. | sample, reads, distinct_mirnas |
multiqc/mirtrace_composition.py |
miRTrace read composition per library, three partitions in one frame. | sample, rank, taxon, abundance, percent |
multiqc/mirtrace_length.py |
Read length distribution per library, from miRTrace via MultiQC. | sample, length, reads, percent, length_class |
nf-core/smrnaseq/samples.py |
The nf-core/smrnaseq sample hub: one row per sample, every per-sample number. | sample, mirna_reads, mirnas_detected, mirnas_10cpm, reference_isoform_pct, mirna_pct, rrna_pct, trna_pct, artifact_pct, unknown_pct, top_clade, top_clade_pct, novel_candidates, known_recovered |
Dashboard tabs
One dashboard: the Overview, then six child tabs in three groups, read as a funnel from the libraries to the miRNAs they hold and the new ones they suggest. Each tab below carries the same icon and colour the dashboard gives it, so the page and the app read alike.
| Group | Tabs |
|---|---|
| Data & QC | MultiQC, Library QC |
| Expression | miRNA Expression, Group Comparison |
| Sequences | isomiRs, Novel miRNAs |
Each child tab opens with a short intro and a strip of cards (four, two on Group Comparison), then at most three open sections; tables and details follow, collapsed. The persistent Sample filters (the design group, then the sample) sit in the left panel and narrow every tab; the group filter reads the design table and is pruned with it. The per-miRNA and per-precursor summaries aggregate over libraries, so the sample filters do not reach them. The Sample sheet section (the design table and the library summary) is pinned, collapsed, to the bottom of every child tab.
Small RNA libraries, from the reads to the miRNAs they hold and the new ones they suggest.
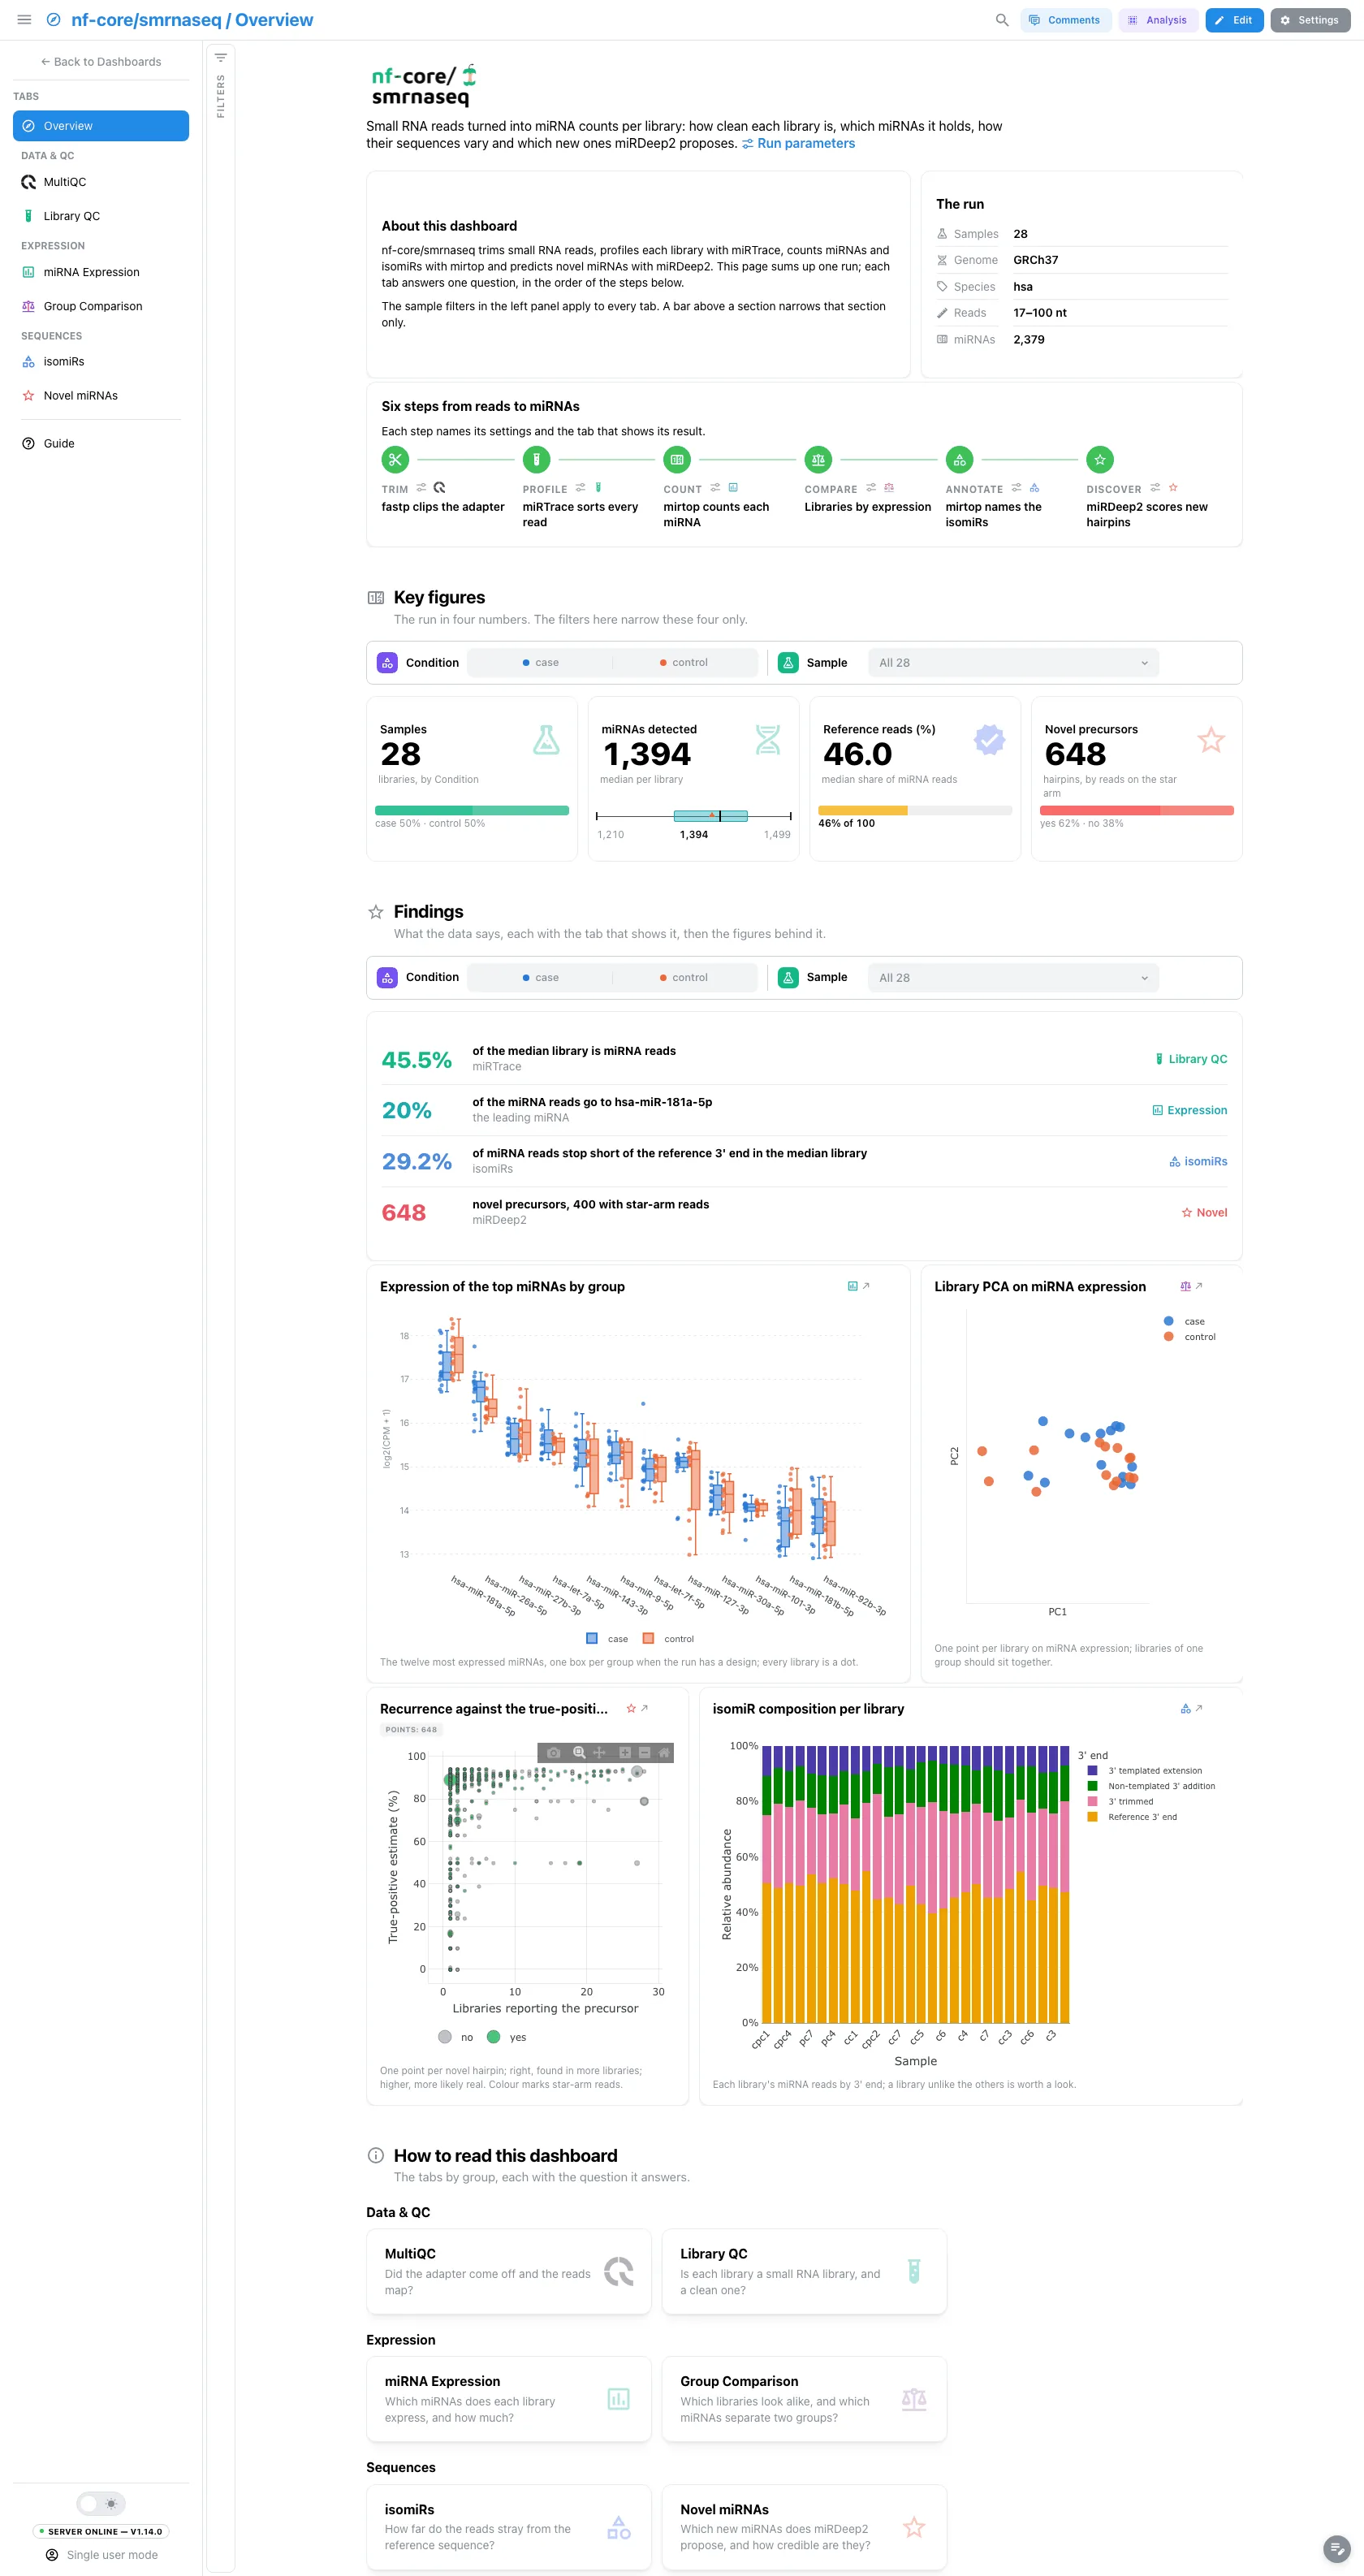
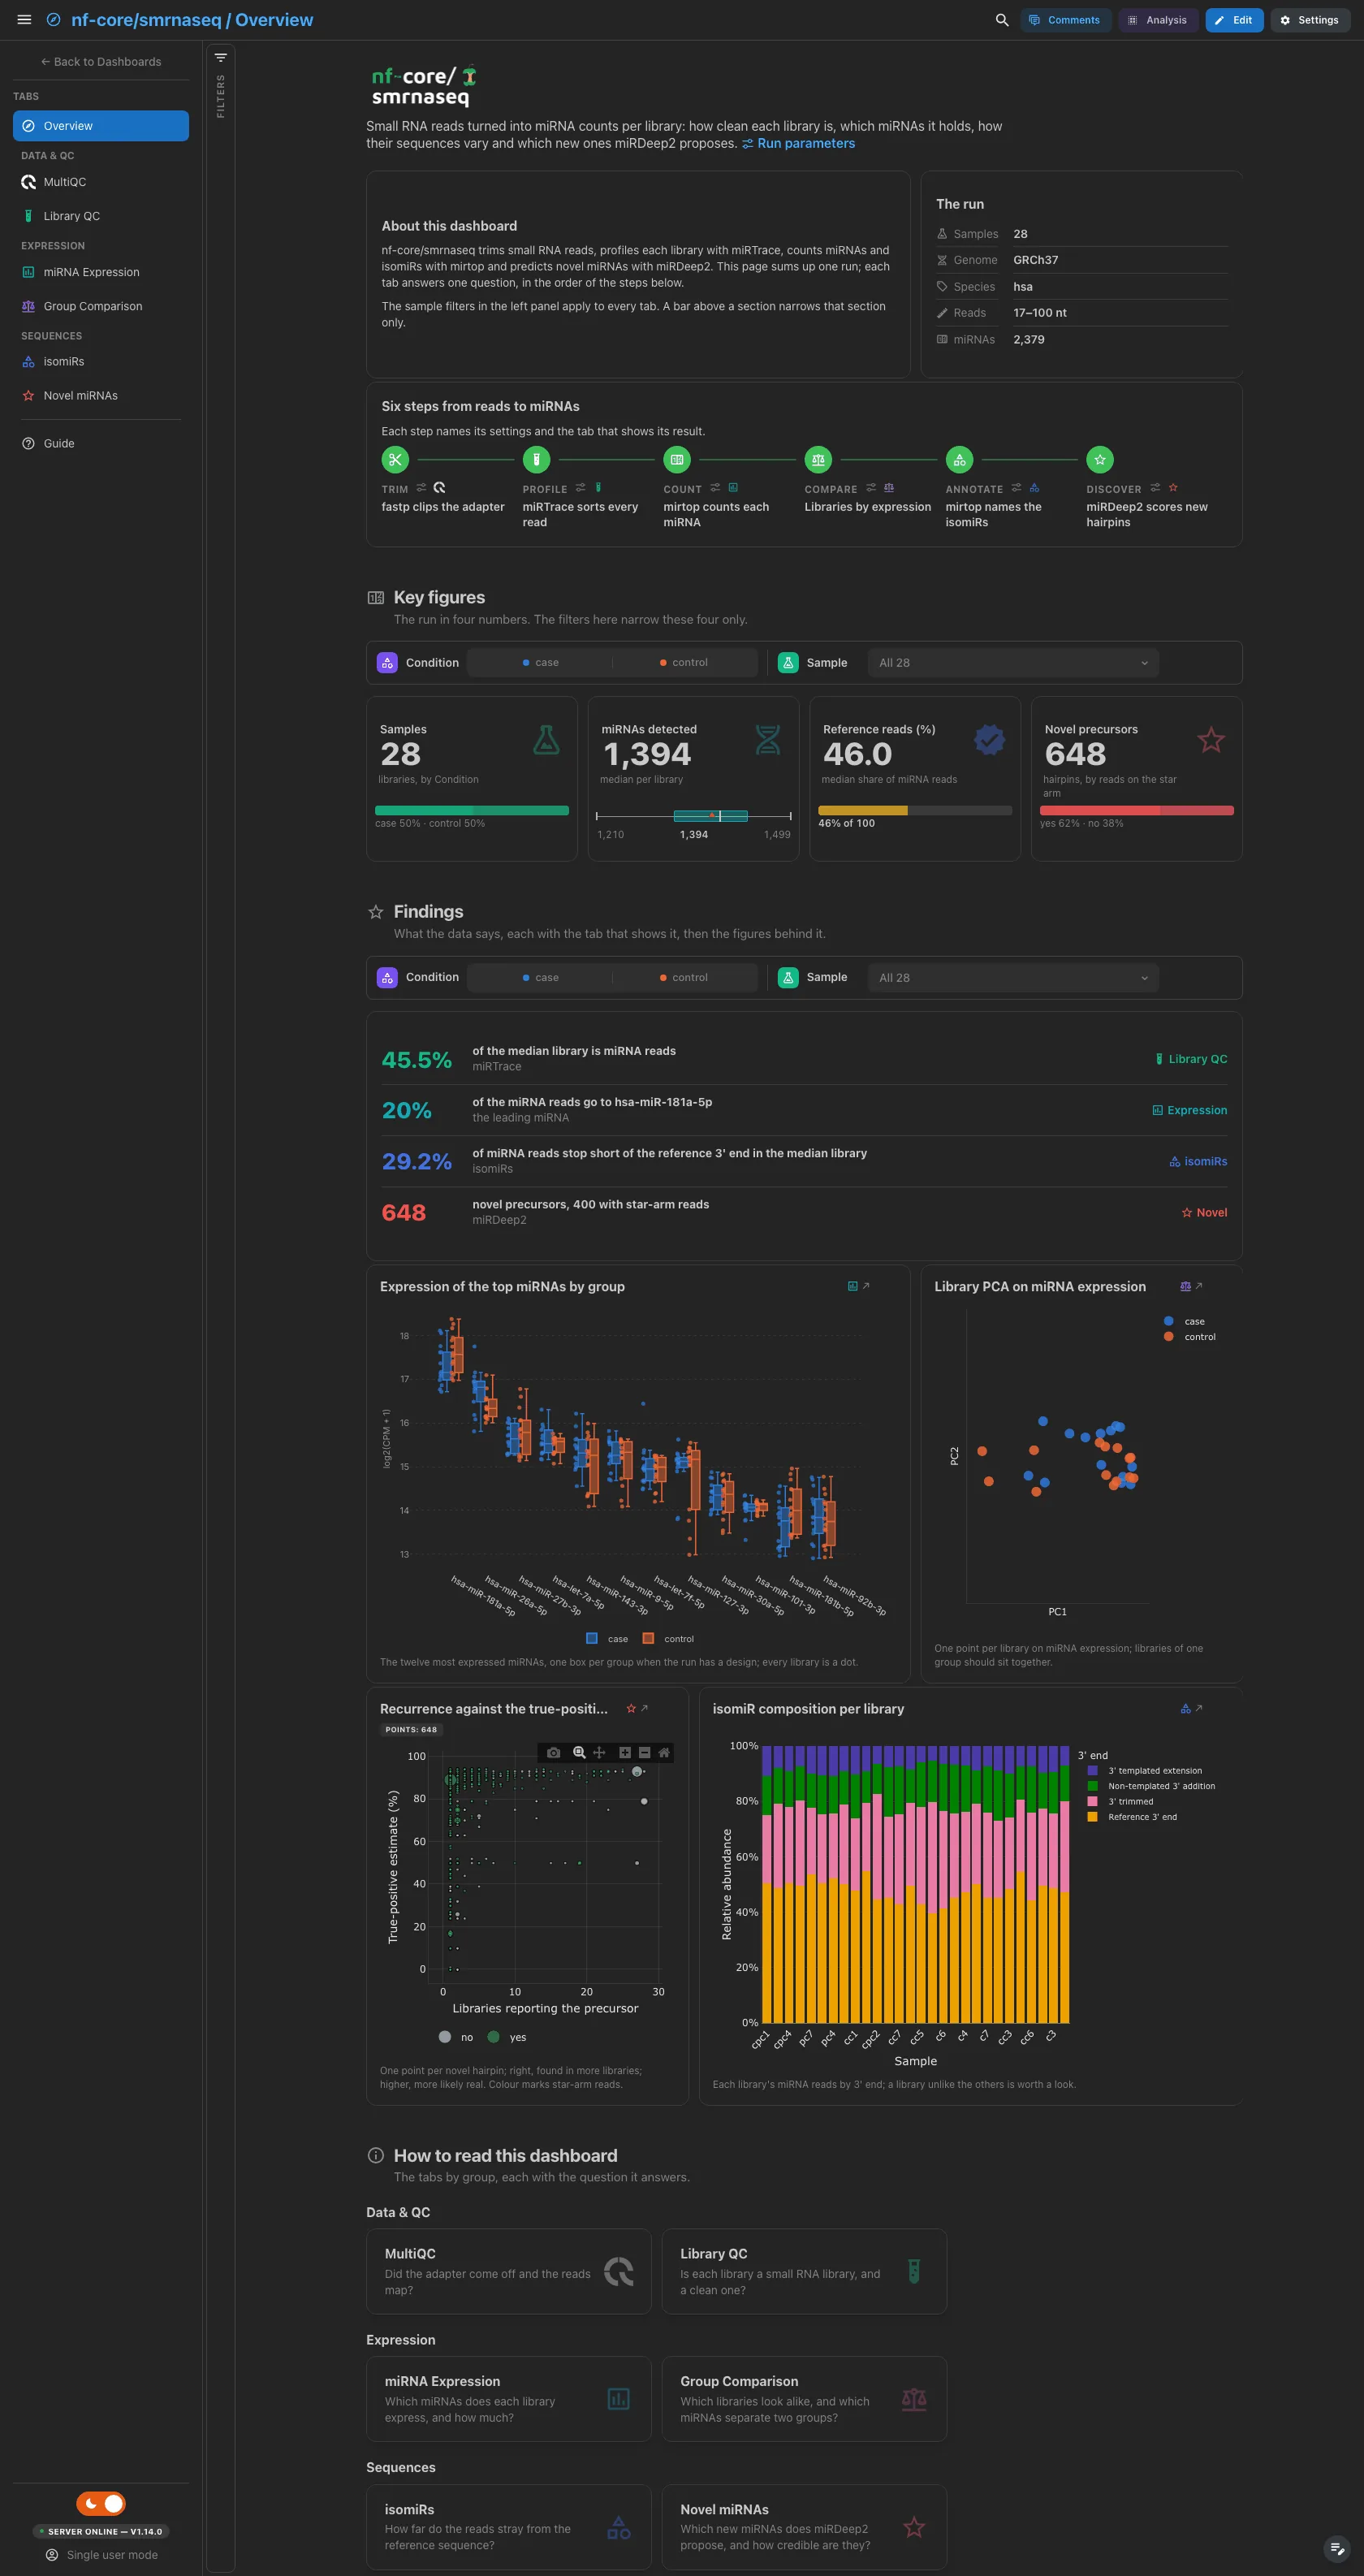
A short hero links the run parameters. About this dashboard says what the
dashboard shows and how the two filter levels work, The run lists the
samples, the genome, the miRTrace species, the read length window and the
miRNAs with reads, and Pipeline walks the six steps from trimming to
discovery, each linked to its settings and its tab. The findings are live
values: they follow the filters. A run with SKIP_MIRDEEP loses the novel
card, row and figure, and the Key figures keep three cards.
Filters and components
Filters · the left panel starts collapsed. Key figures and Findings each have their own filter bar (the design group and the sample): each narrows its own section only.
| Section | What it holds |
|---|---|
| Top | Hero, About this dashboard, The run, Pipeline |
| Key figures | 4 headline cards: samples by group, miRNAs detected, reference reads, novel precursors by star-arm reads |
| Findings | Live result rows, then 4 figures: the top miRNAs by group, the library PCA, the novel precursor plane and the isomiR composition |
| How to read this dashboard | The tabs by group, each with its question |
Data & QC · Did the adapter come off and the reads map?
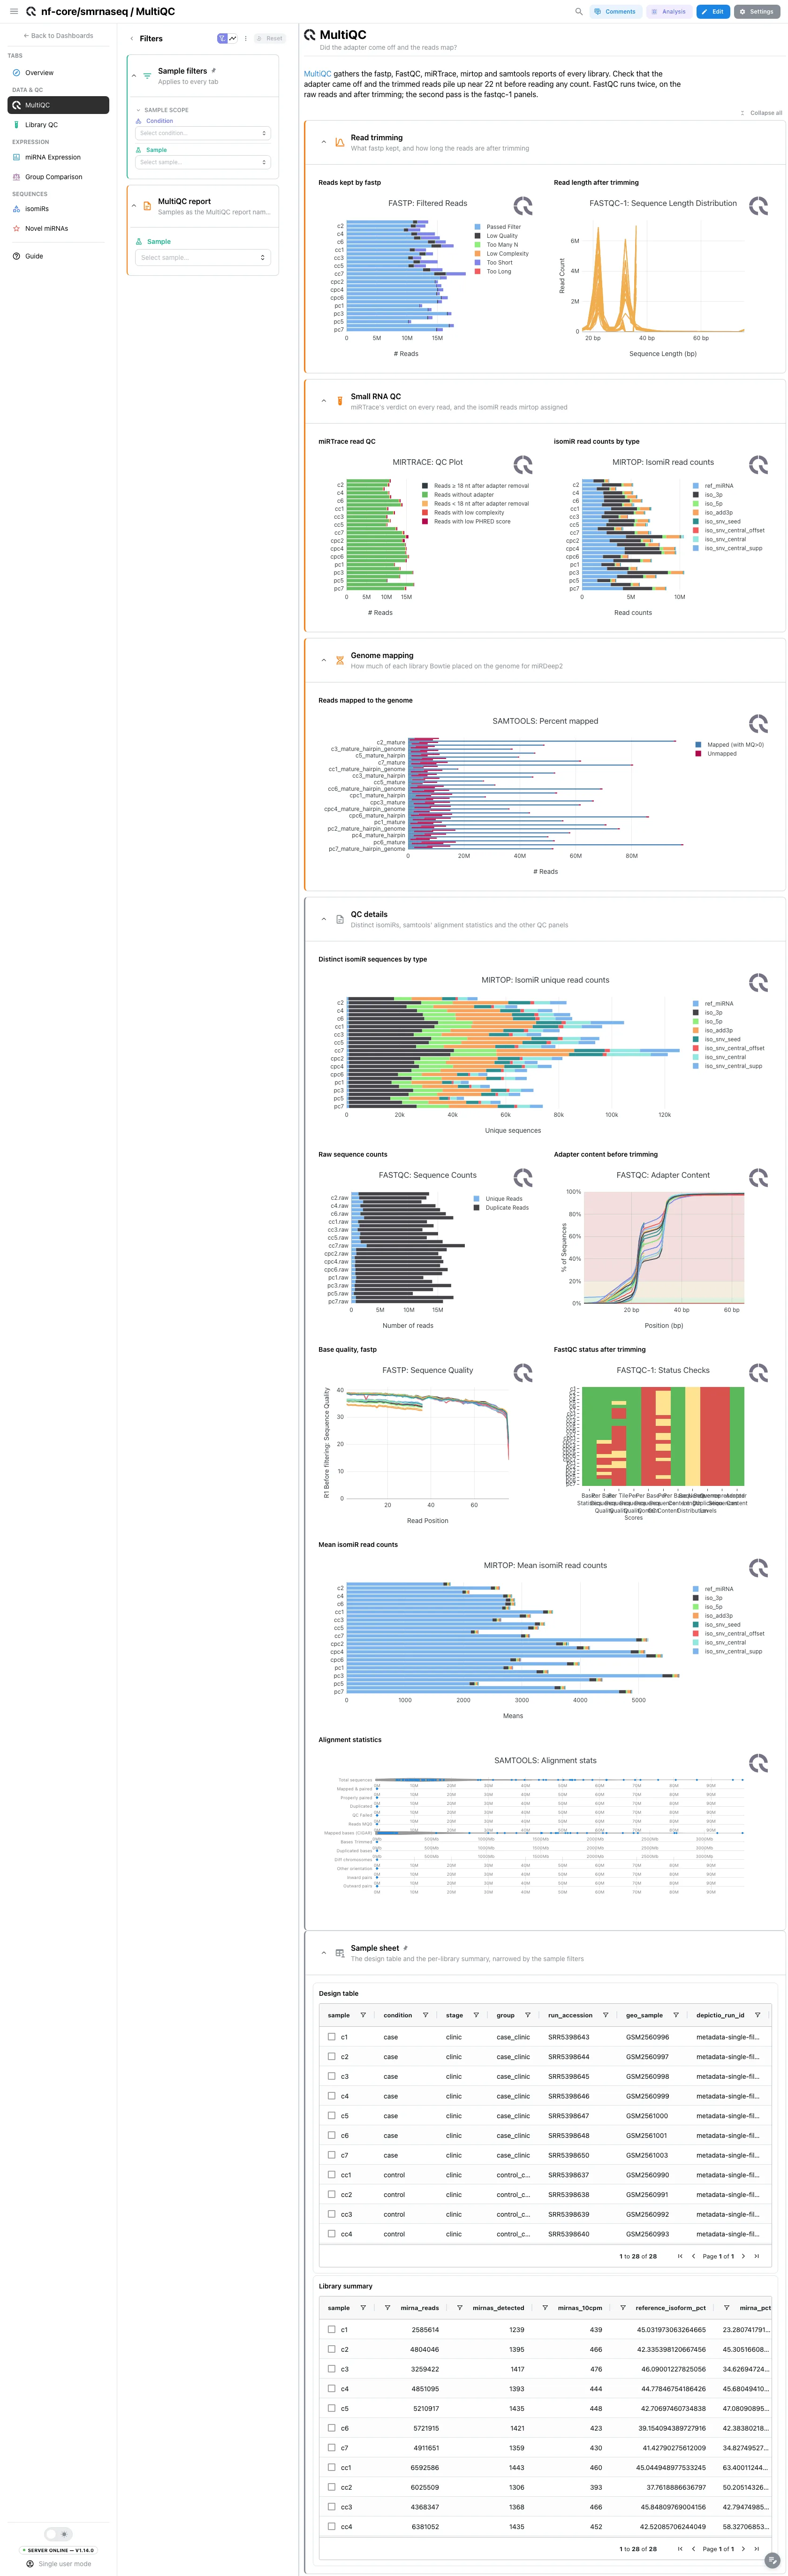
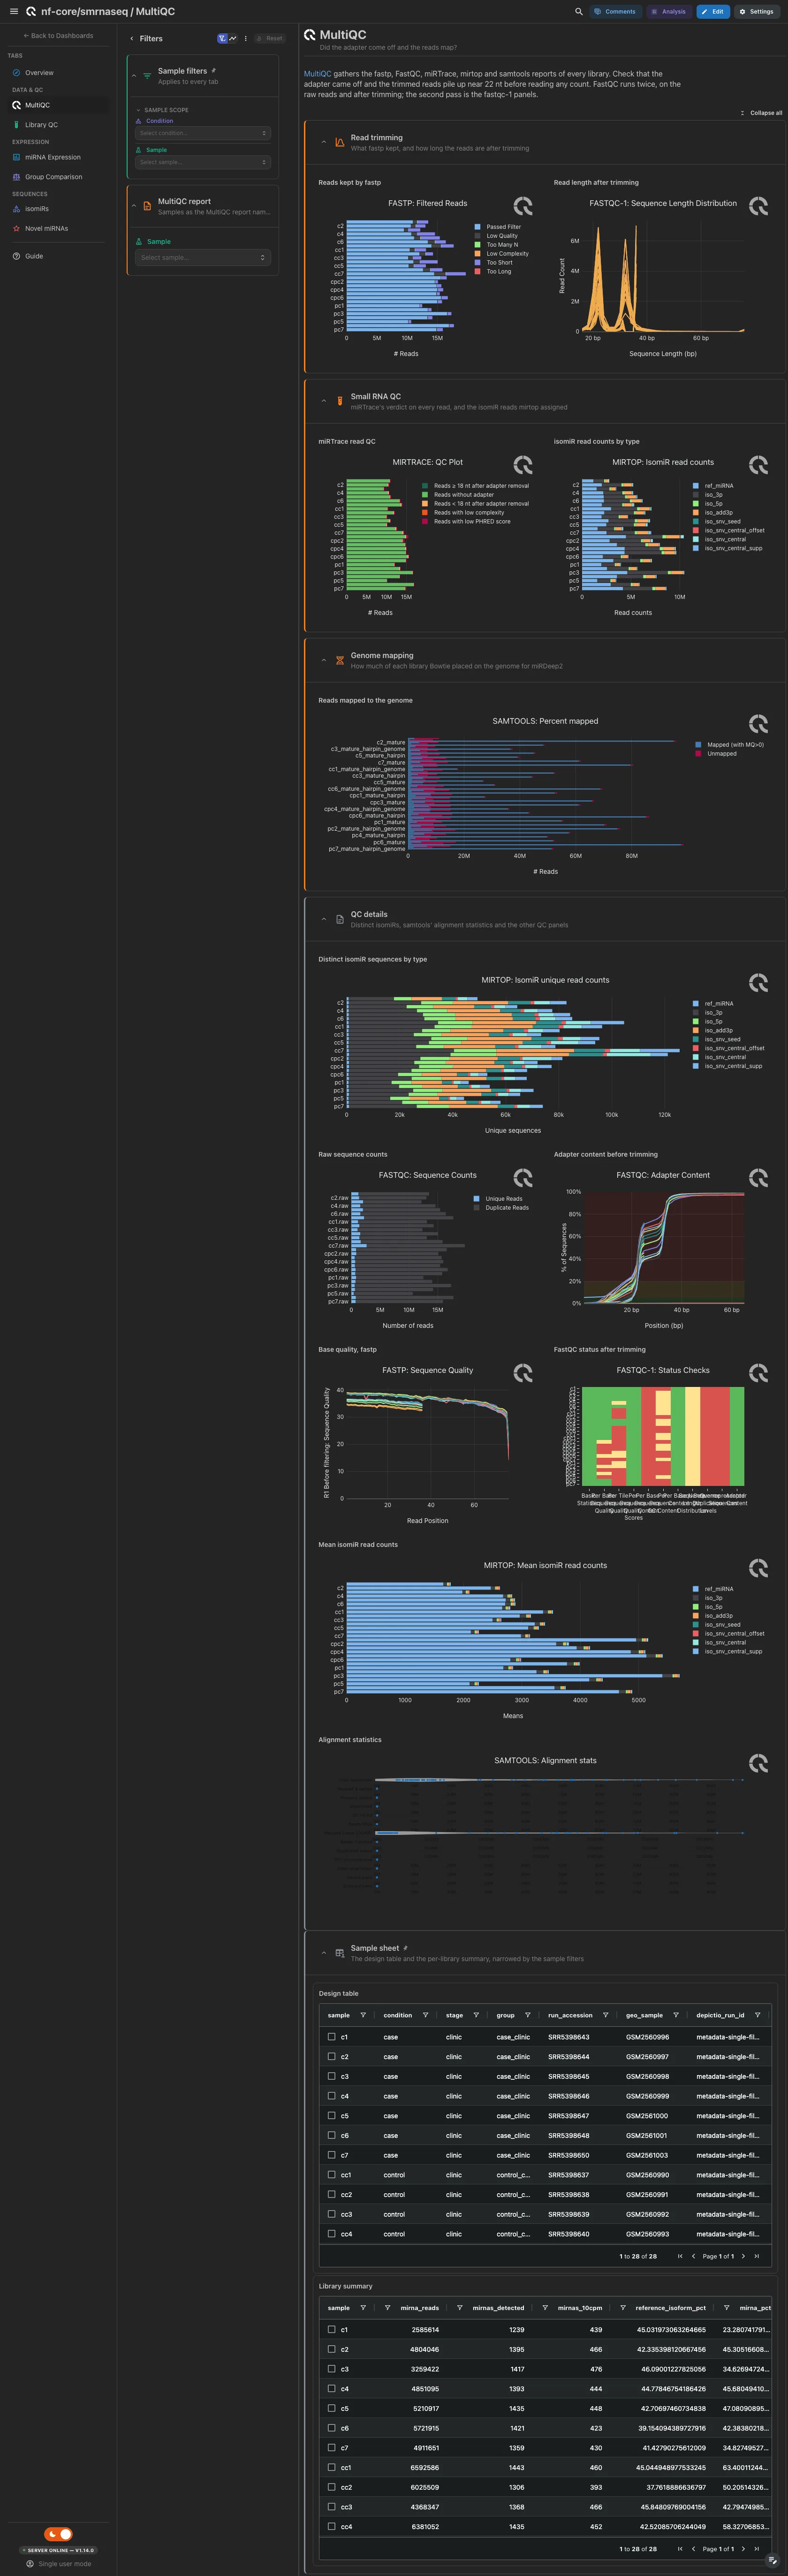
MultiQC panels only. Open: fastp's filtered reads beside the read length after
trimming, miRTrace's read QC beside mirtop's isomiR read counts, then
samtools' mapping rate, the reads Bowtie placed on the genome for miRDeep2.
Check that the adapter came off and the trimmed reads pile up near 22 nt
before reading any count. The distinct isomiR sequences, the raw FastQC
counts and adapter content, fastp's base quality, the post-trim FastQC status
(the fastqc-1 panels), the mean isomiR read counts and samtools' alignment
statistics are collapsed.
Filters and components
Filters · Sample, read from the MultiQC report.
| Section | What it holds |
|---|---|
| Read trimming | 2 MultiQC panels |
| Small RNA QC | 2 MultiQC panels |
| Genome mapping | 1 MultiQC panel |
| QC details (collapsed) | 7 MultiQC panels |
Data & QC · Is each library a small RNA library, and a clean one?
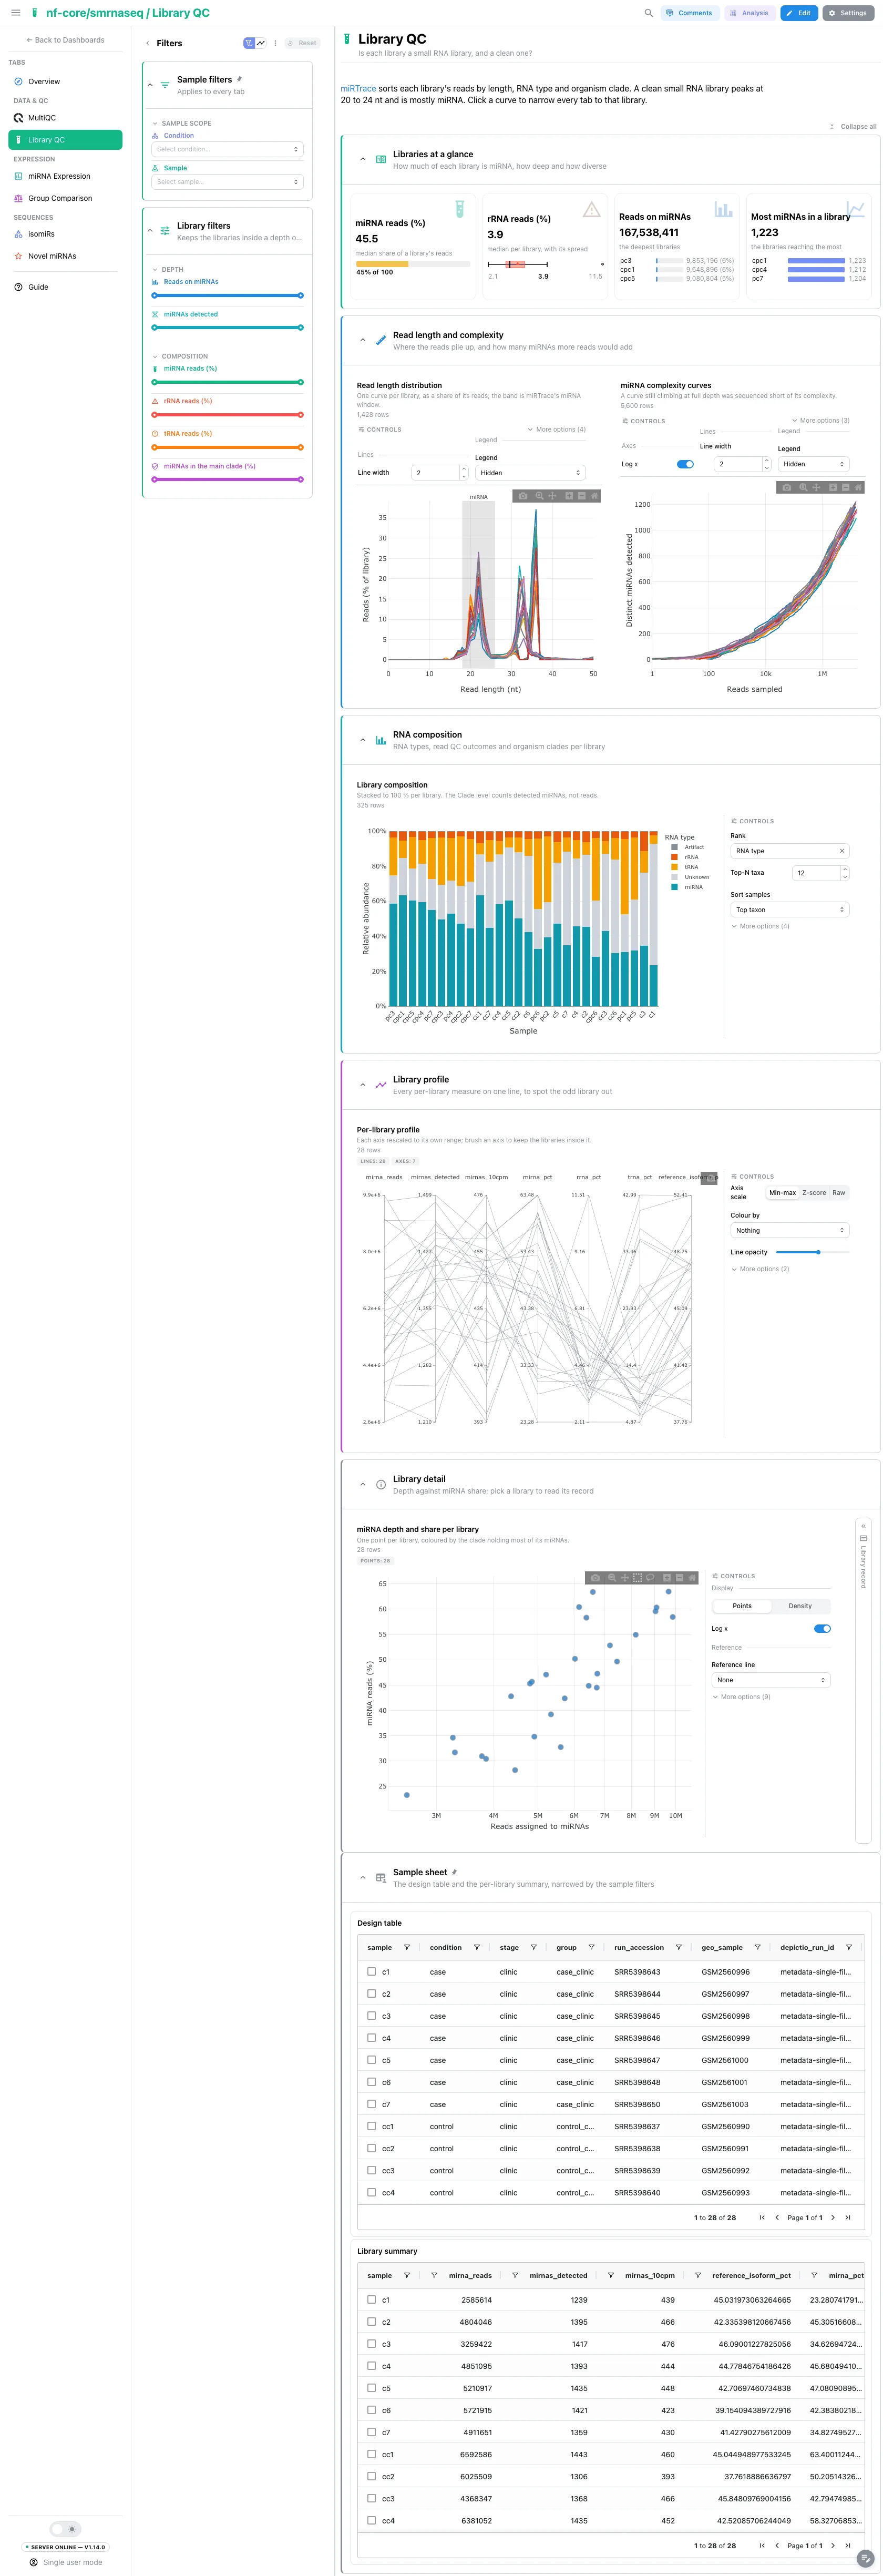
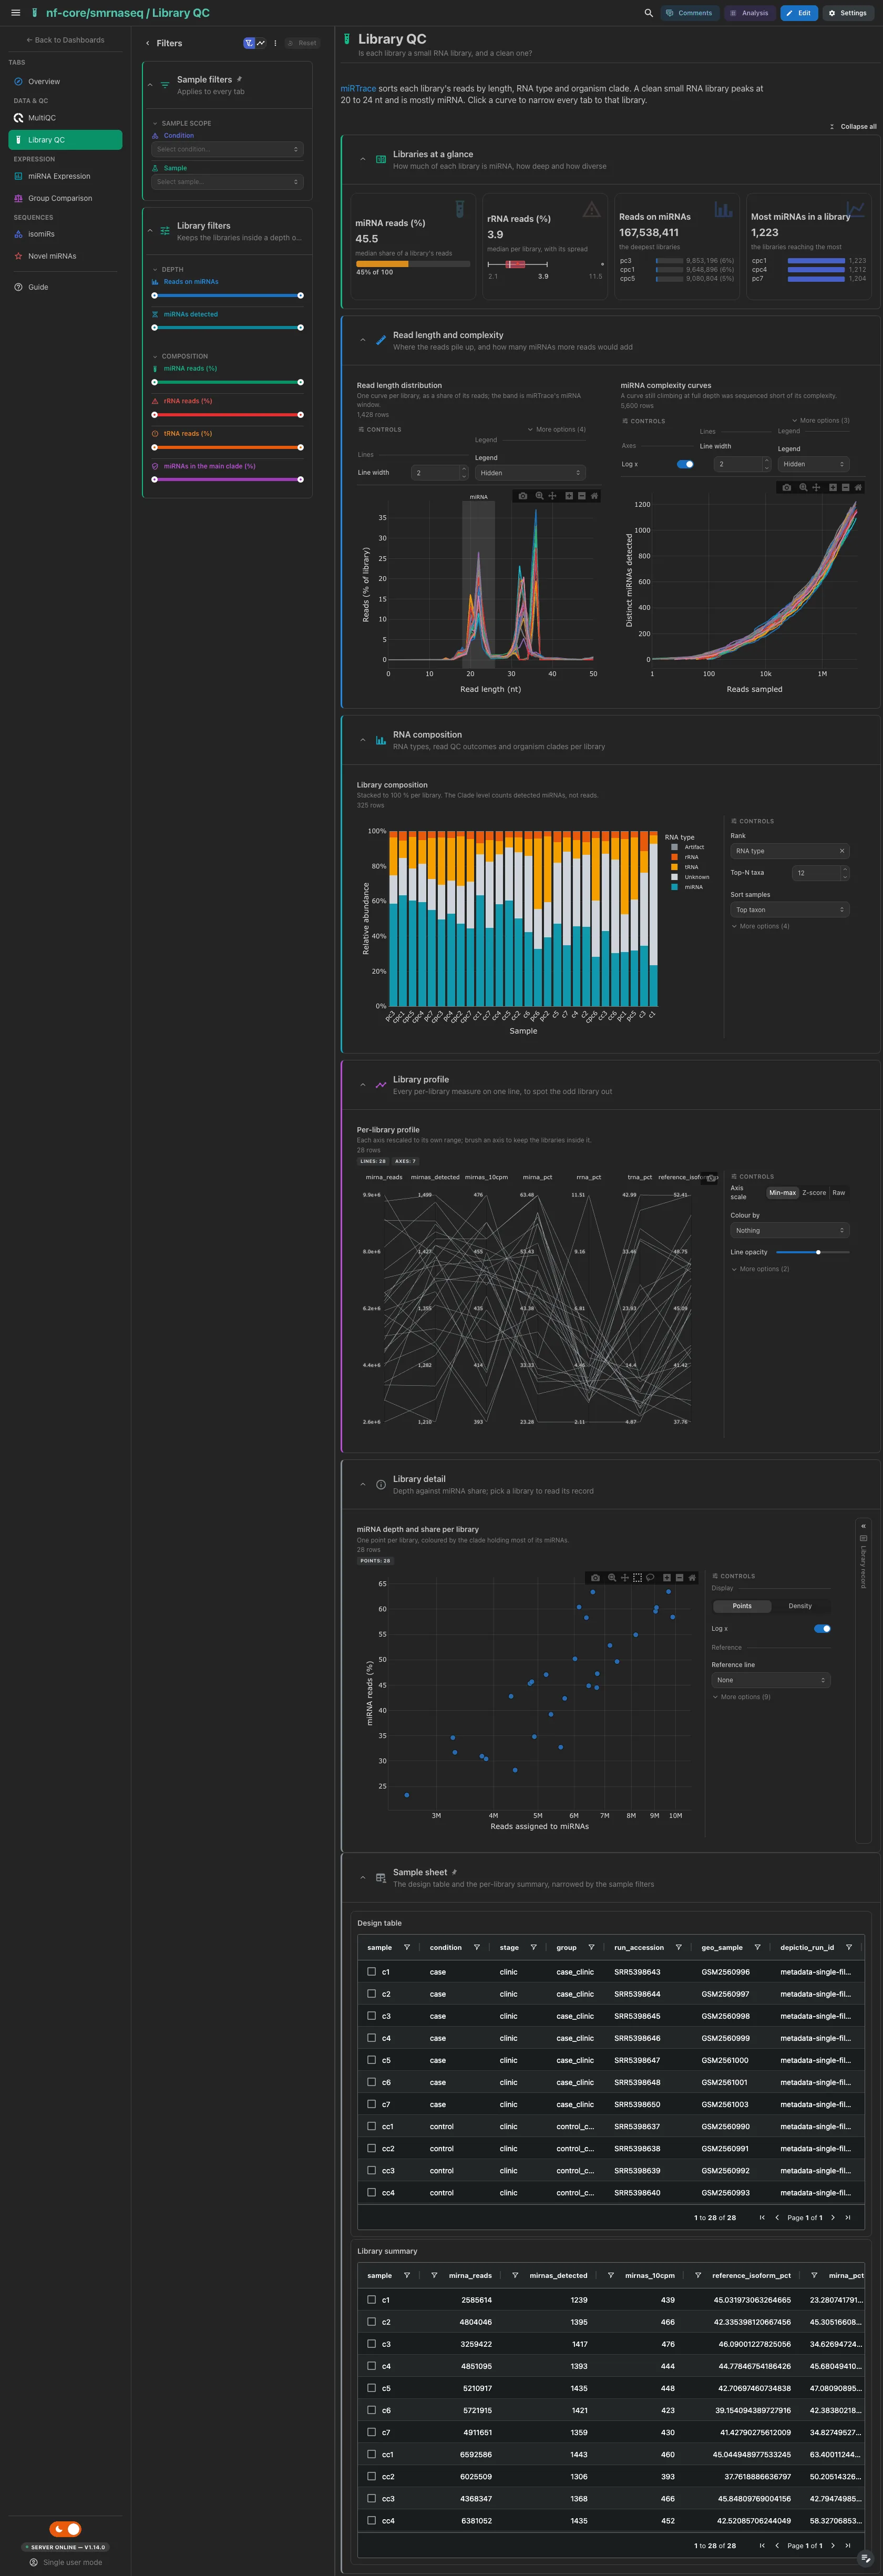
miRTrace's view of every library. The median miRNA share on a bar out of 100, the median rRNA share, the reads on miRNAs (the deepest libraries ranked) and the most miRNAs a library reaches at full depth. Then the read length profile, the miRNA window shaded, beside the complexity curves; the composition bars (RNA type, read QC outcome, organism clade); and the per-library measures as parallel coordinates. A clean small RNA library peaks at 20 to 24 nt and is mostly miRNA. Depth against miRNA share, one point per library coloured by its main clade, beside the library record, is collapsed.
Filters and components
Filters · Reads on miRNAs, miRNAs detected, miRNA reads (%),
rRNA reads (%), tRNA reads (%) and miRNAs in the main clade (%)
ranges on samples.
| Section | What it holds |
|---|---|
| Libraries at a glance | 4 cards |
| Read length and complexity | 2 advanced visualizations |
| RNA composition | 1 advanced visualization |
| Library profile | 1 advanced visualization |
| Library detail (collapsed) | 1 advanced visualization + a library record card |
miRTrace comes through MultiQC
miRTrace's numbers are read back from the MultiQC parquet. A run with
--skip_multiqc takes --var SKIP_MULTIQC=true: the MultiQC tab goes,
and so do the miRTrace cards, the length, complexity and composition
figures, and the miRNA share row on the Overview.
Expression · Which miRNAs does each library express, and how much?
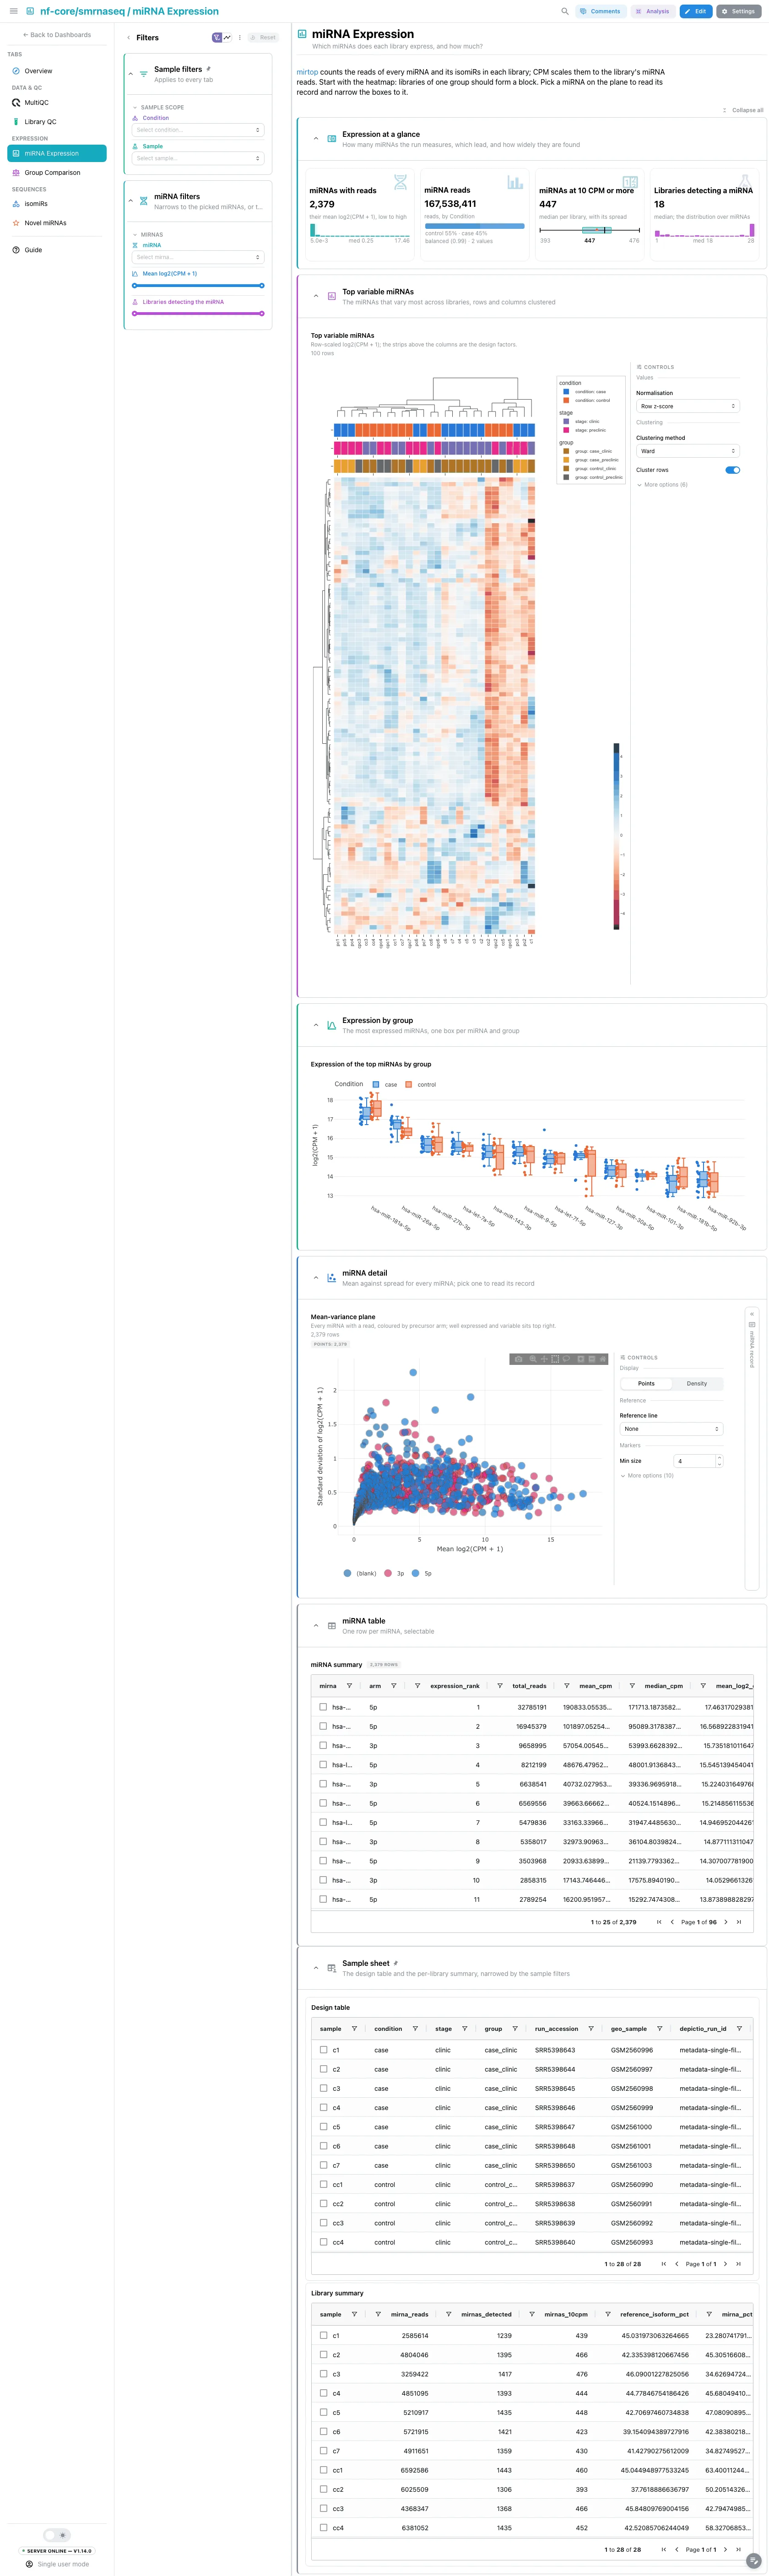
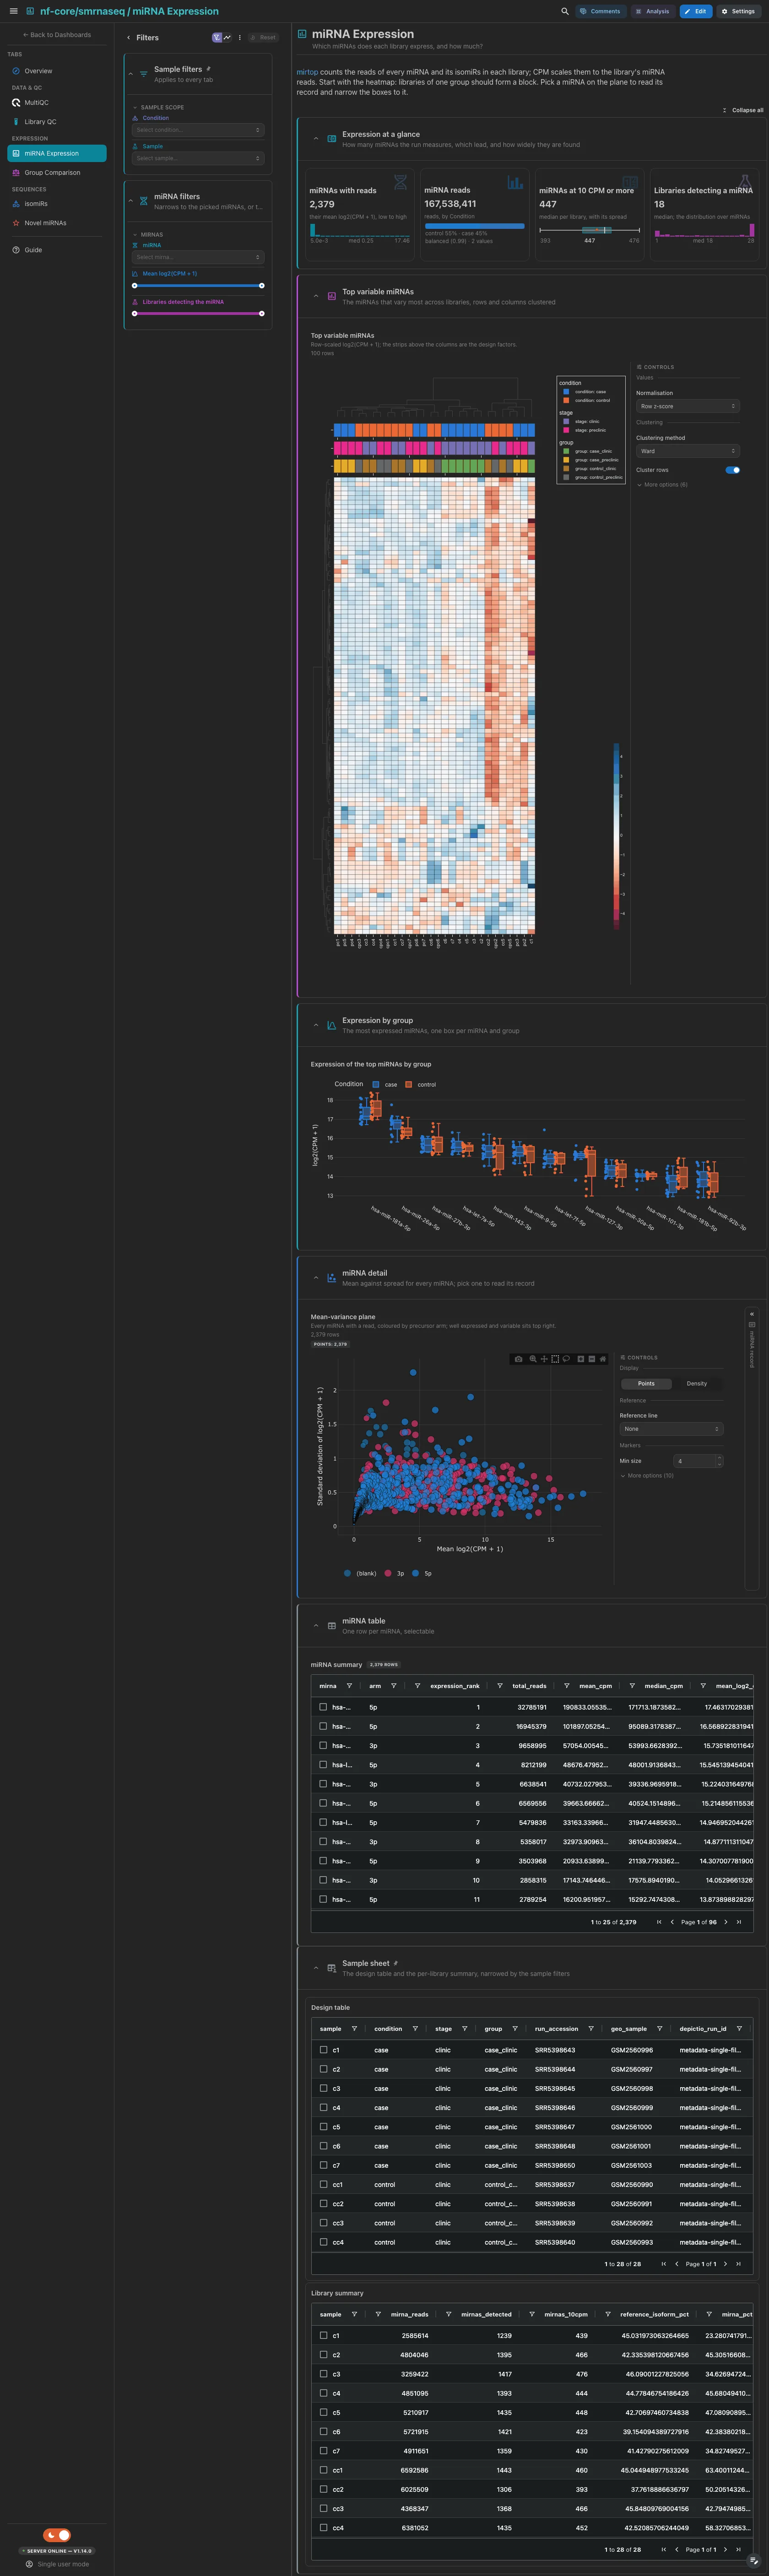
mirtop's counts, scaled to counts per million miRNA reads. The miRNAs with reads, the miRNA reads by group, the median miRNAs at 10 CPM or more per library and the median number of libraries detecting a miRNA. Then the clustered heatmap of the most variable miRNAs, where libraries of one group should form a block; the twelve most expressed miRNAs as boxes by group, every library a dot; and the mean-variance plane beside the record of the picked miRNA, linked to miRBase. A pick on the plane narrows the boxes to that miRNA. The miRNA table is collapsed.
Filters and components
Filters · a miRNA picker on mirtop_mirna_counts, and Mean
log2(CPM + 1) and Libraries detecting the miRNA ranges on
mirtop_mirna_summary.
| Section | What it holds |
|---|---|
| Expression at a glance | 4 cards |
| Top variable miRNAs | 1 advanced visualization |
| Expression by group | Expression of the top miRNAs by group |
| miRNA detail | 1 advanced visualization + a miRNA record card |
| miRNA table (collapsed) | miRNA summary |
Expression · Which libraries look alike, and which miRNAs separate two groups?
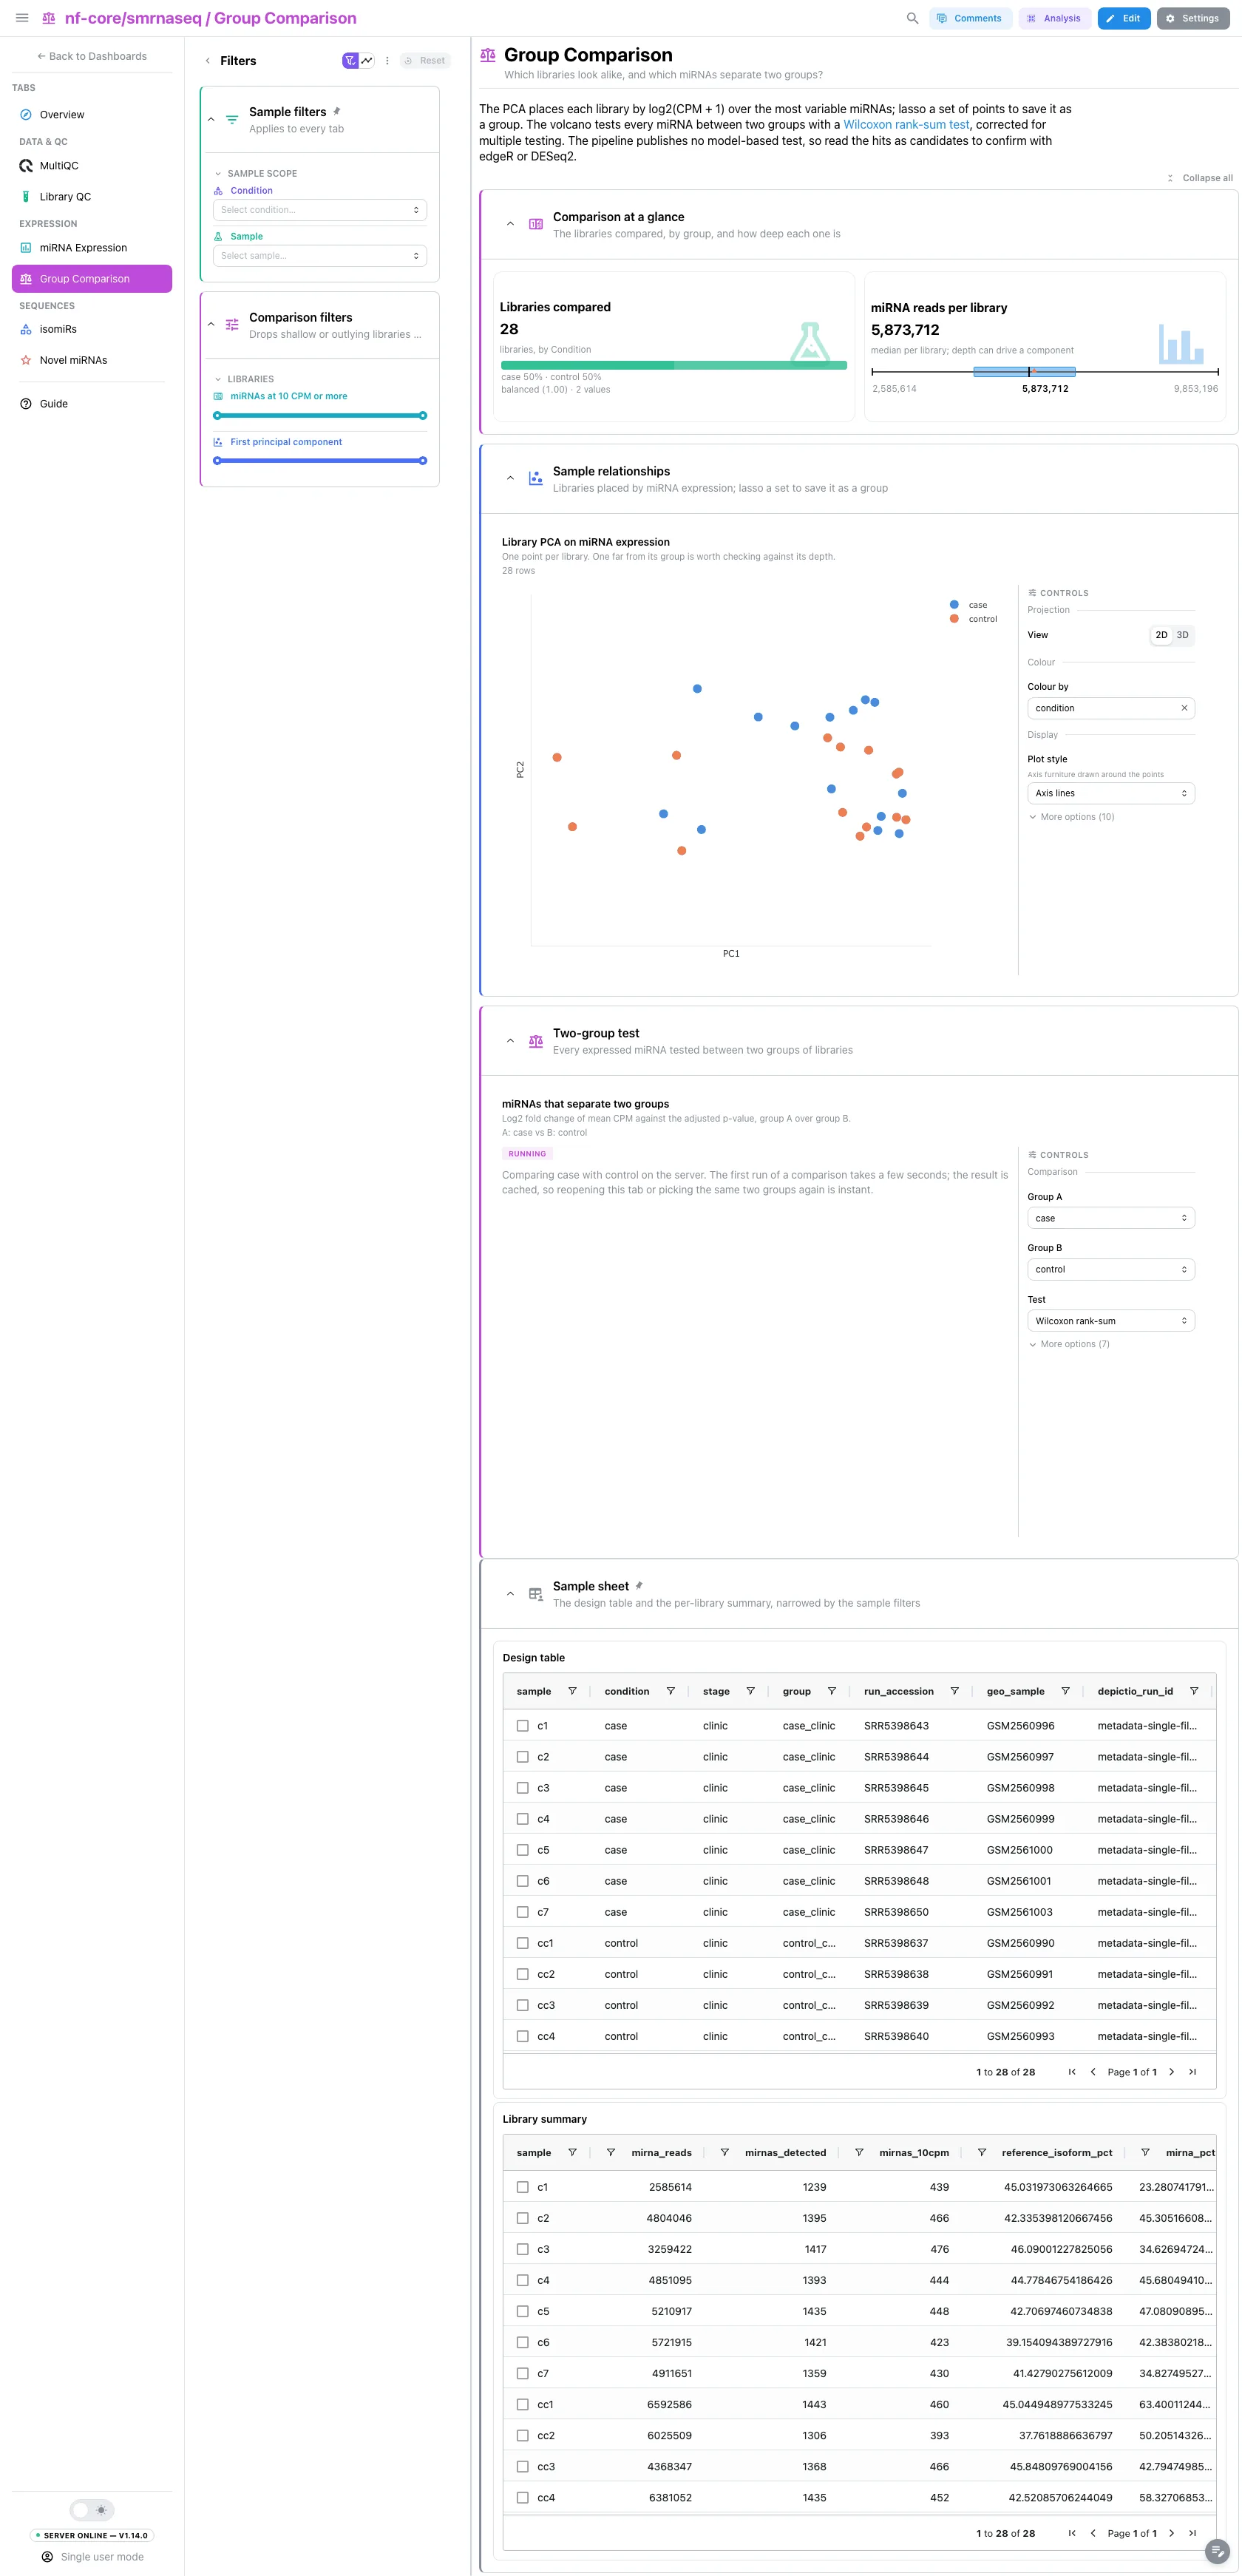
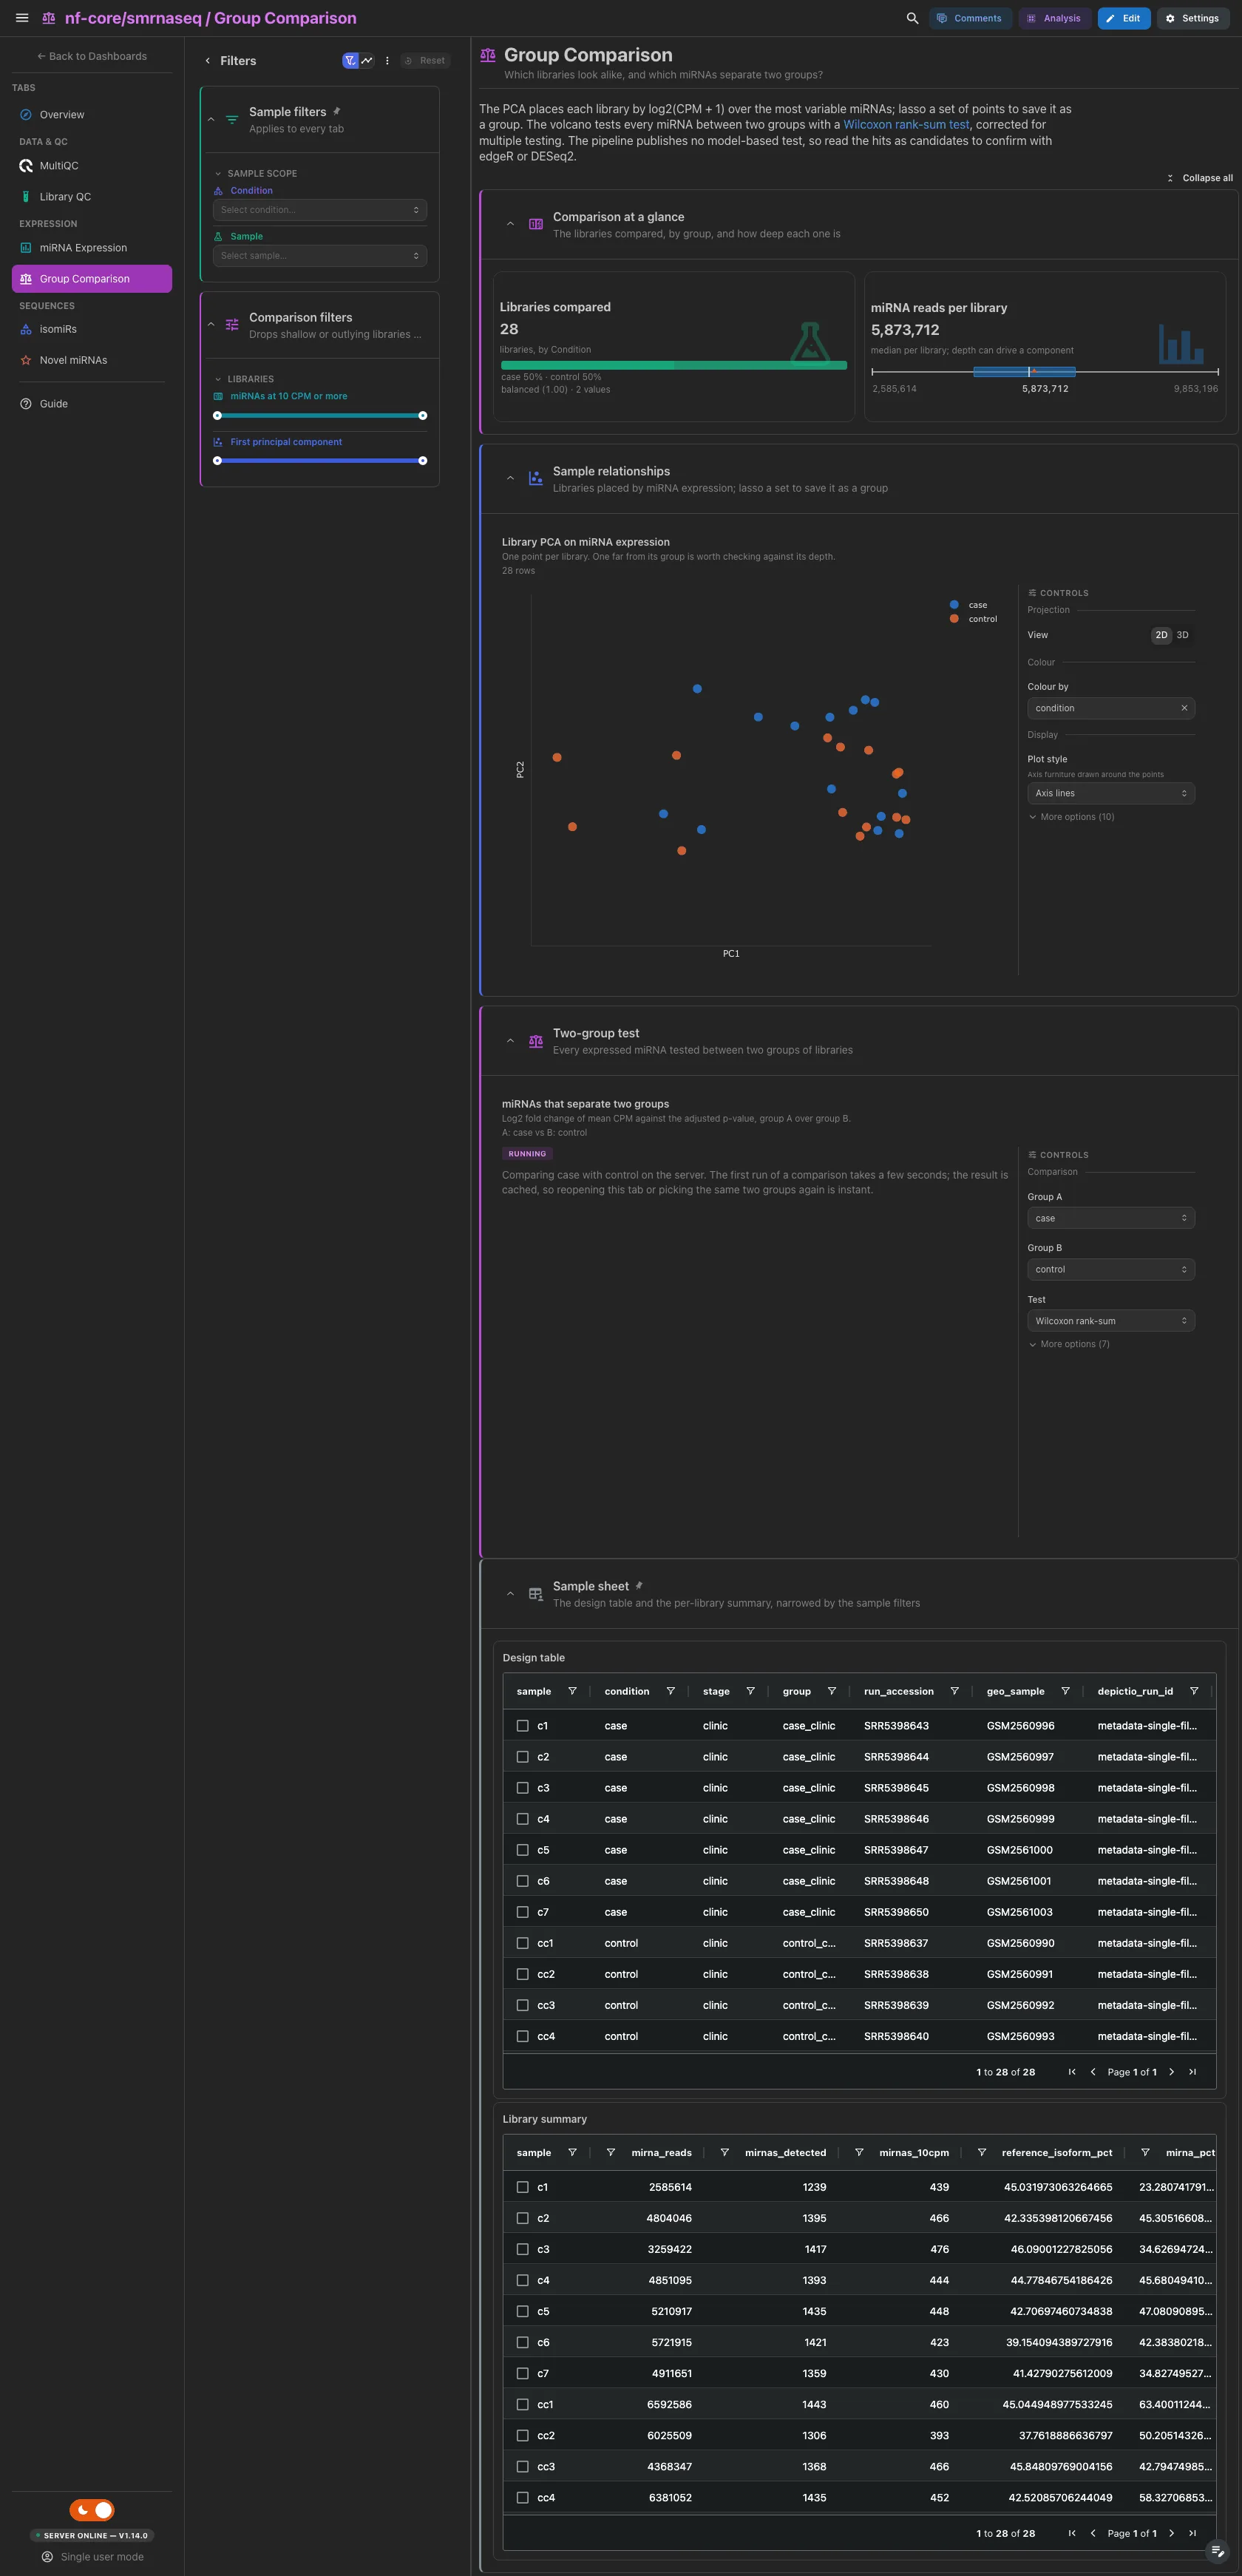
Two cards rather than four: the libraries compared, by group, and their miRNA depth, the two things to check before trusting a separation. Then the library PCA on log2(CPM + 1), coloured by group, where a lasso saves a set of points as a group, and the volcano of a Wilcoxon rank-sum test between two groups, corrected for multiple testing. The volcano opens on the first two groups of the design column and runs at once. It is a screen: the pipeline publishes no model-based test, so read the hits as candidates to confirm with edgeR or DESeq2.
Filters and components
Filters · a miRNAs at 10 CPM or more range on samples and a First
principal component range on mirtop_sample_pca, to drop shallow or
outlying libraries before comparing.
| Section | What it holds |
|---|---|
| Comparison at a glance | 2 cards |
| Sample relationships | 1 advanced visualization |
| Two-group test | 1 advanced visualization |
Sequences · How far do the reads stray from the reference sequence?
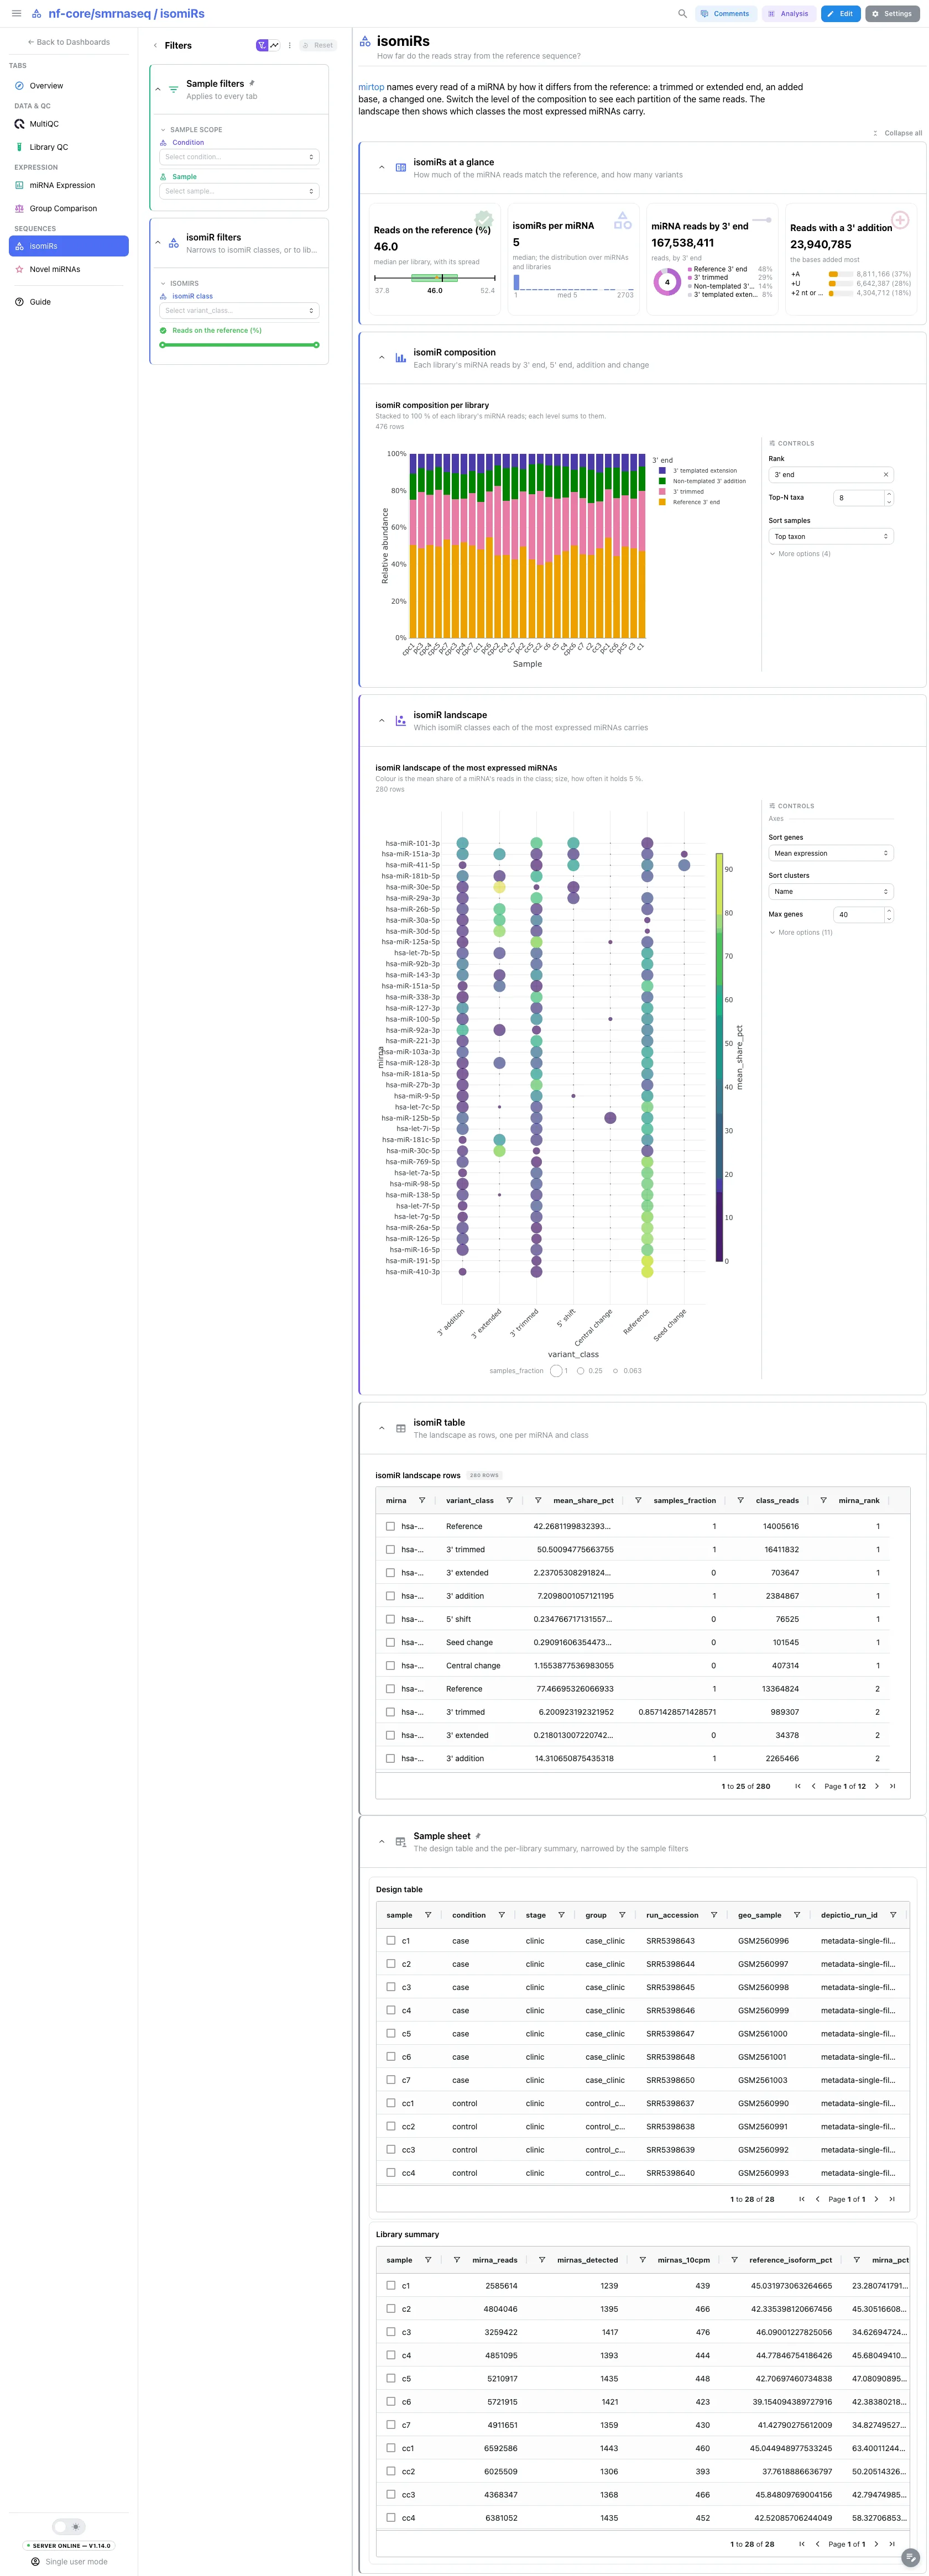
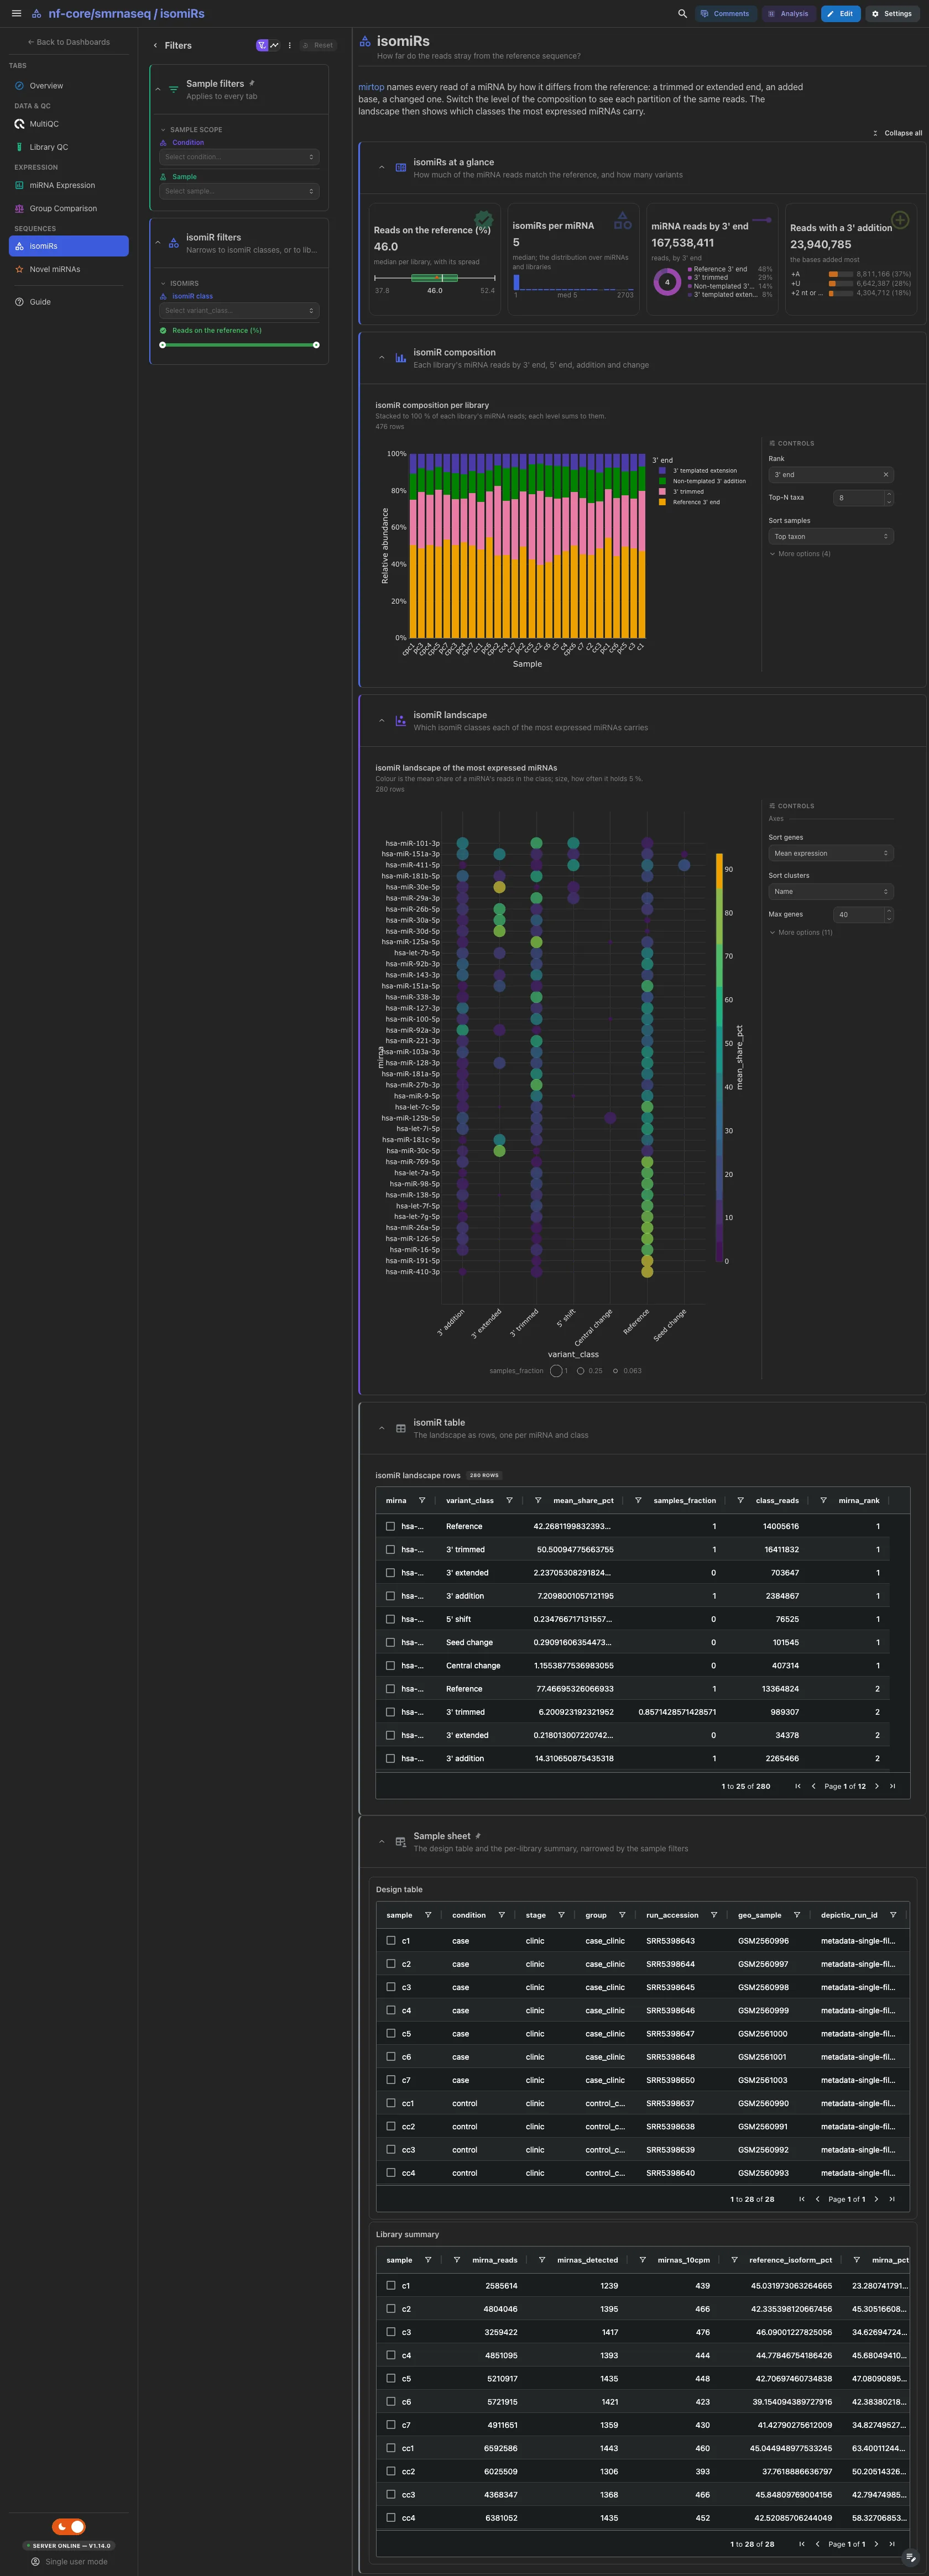
mirtop names every read of a miRNA by how it differs from the reference. The median share of a library's miRNA reads on the reference sequence, the median isomiRs of an expressed miRNA in a library, the miRNA reads by 3' end and the reads with a non-templated 3' addition, the added bases ranked. Then the isomiR composition of each library, opening on the 3' end with the 5' end, the addition and the nucleotide change a switch away, and the landscape of isomiR classes over the 40 most expressed miRNAs. The landscape table is collapsed.
Filters and components
Filters · isomiR class on mirtop_isomir_landscape and a Reads on
the reference (%) range on samples.
| Section | What it holds |
|---|---|
| isomiRs at a glance | 4 cards |
| isomiR composition | 1 advanced visualization |
| isomiR landscape | 1 advanced visualization |
| isomiR table (collapsed) | isomiR landscape rows |
Sequences · Which new miRNAs does miRDeep2 propose, and how credible are they?
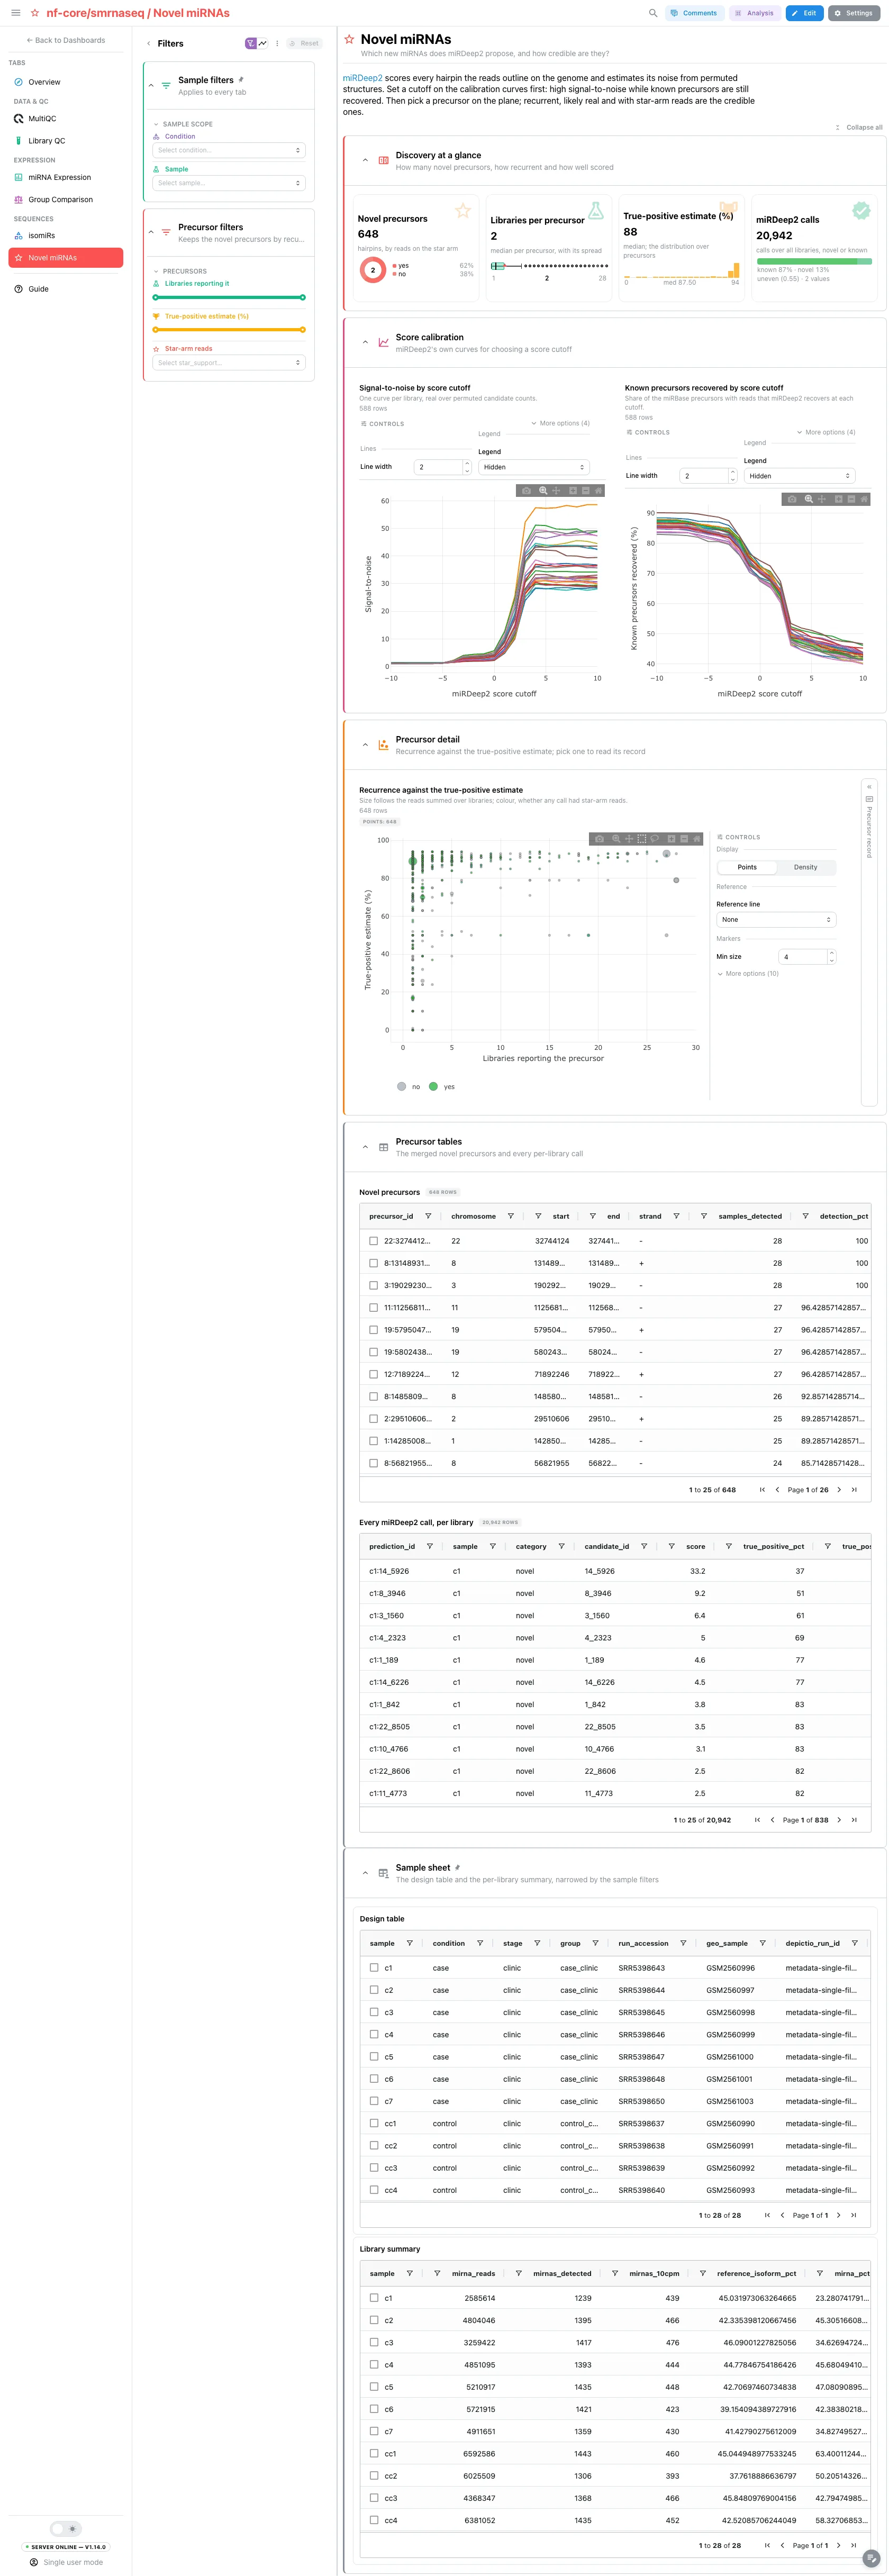
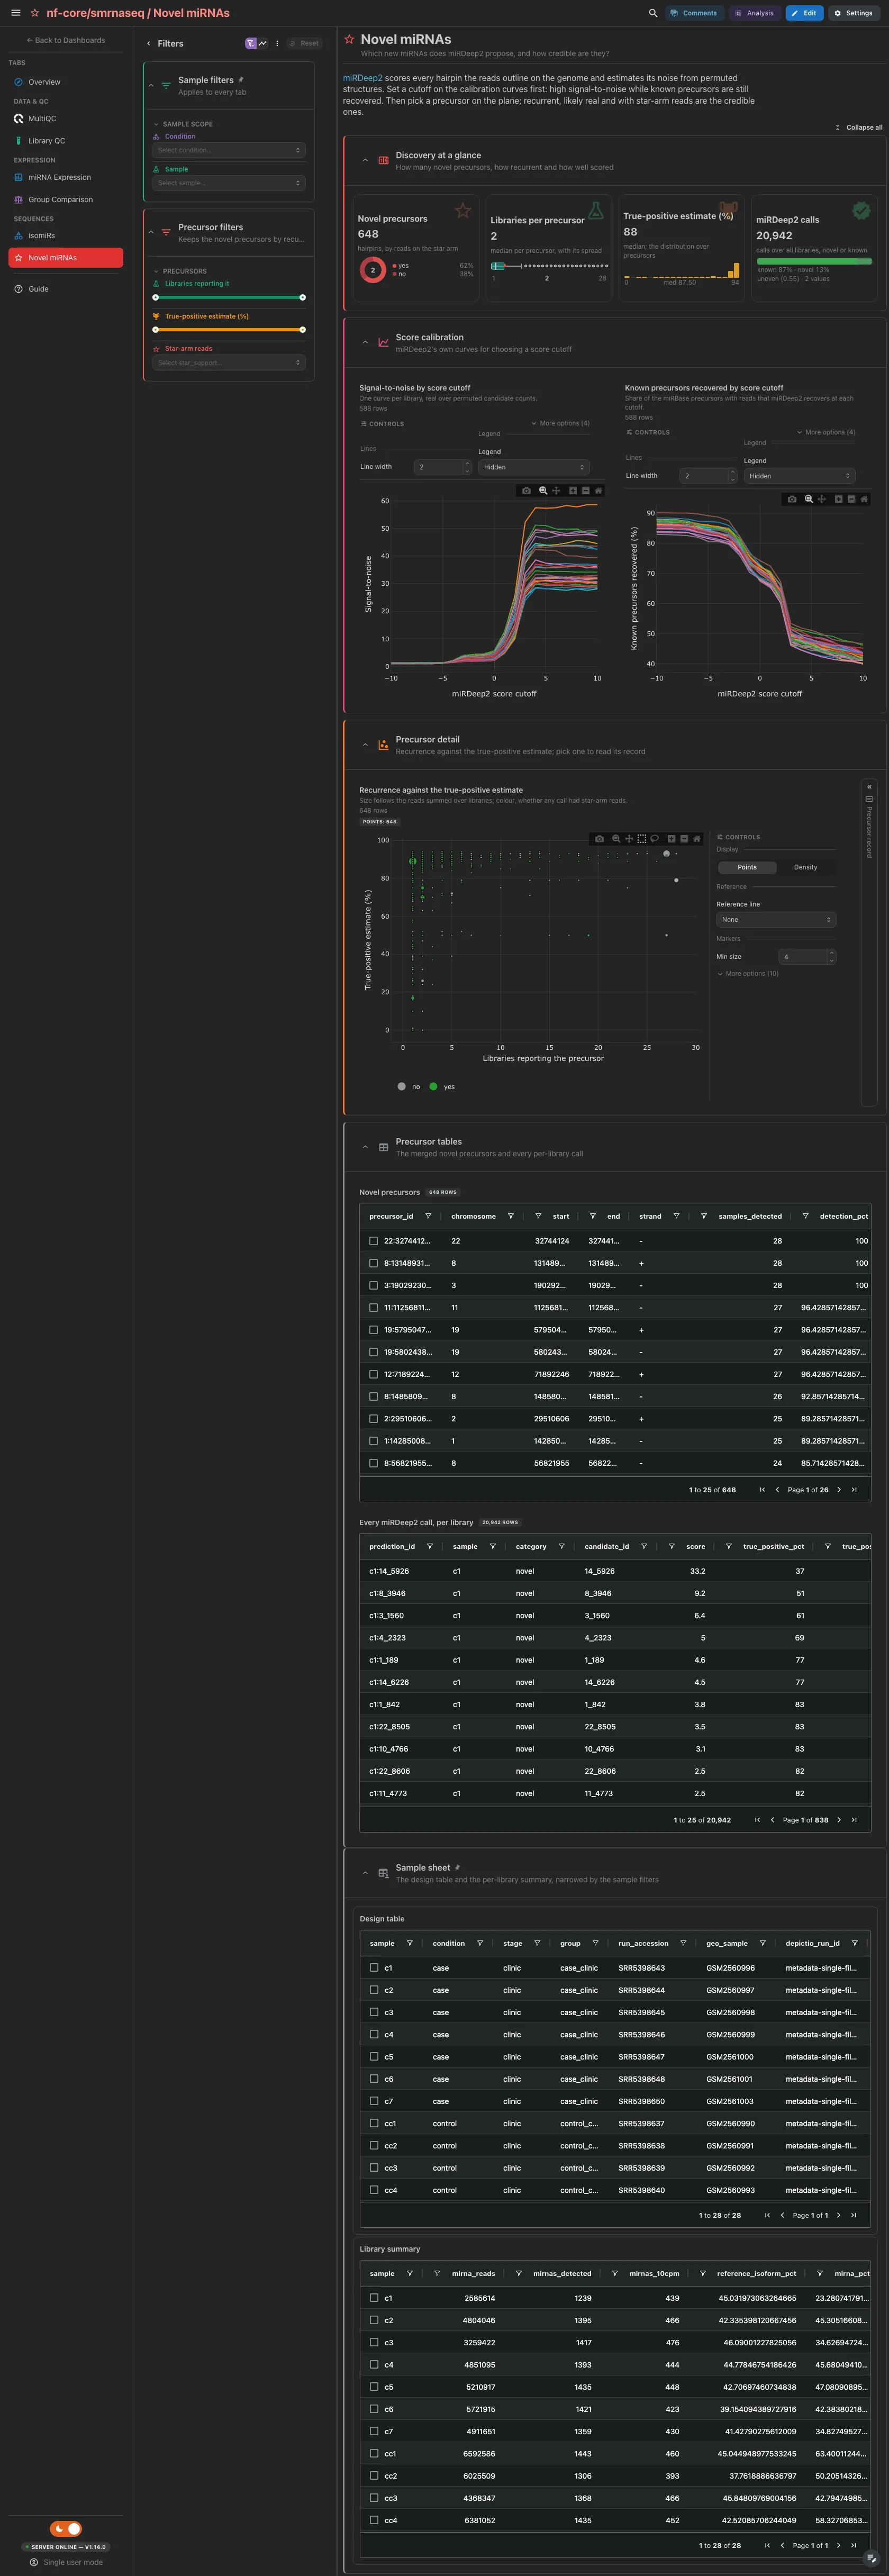
The novel precursors merged across libraries, by star-arm reads, the median
libraries reporting one, the median true-positive estimate and every miRDeep2
call, novel or known. Then miRDeep2's signal-to-noise and known-recovery
curves by score cutoff, to set the threshold, and the plane of recurrence
against the true-positive estimate beside the record of the picked precursor,
linked to the UCSC browser on GENOME. The plane reads the estimate rather
than the raw score, which is unbounded. The precursor table and every
per-library call are collapsed.
Filters and components
Filters · Libraries reporting it and True-positive estimate (%)
ranges and Star-arm reads on mirdeep2_novel_precursors.
| Section | What it holds |
|---|---|
| Discovery at a glance | 4 cards |
| Score calibration | 2 advanced visualizations |
| Precursor detail | 1 advanced visualization + a precursor record card |
| Precursor tables (collapsed) | Novel precursors, Every miRDeep2 call, per library |
Dropped with --skip_mirdeep
A run without miRDeep2 writes no result_*.csv. Pass
--var SKIP_MIRDEEP=true and the four miRDeep2 collections are pruned,
which drops this tab and the novel card, row and figure on the Overview.
Tables select rows and the planes and curves select points: the library summary,
the read-length and complexity curves, the library plane and the PCA on sample,
and the design table on its id column; the mean-variance plane, the miRNA summary
and the isomiR landscape rows on mirna; the novel-precursor plane and table on
precursor_id. A pick narrows the other tiles of its collection and follows the
project links to the collections downstream of it: a miRNA picked on the plane
narrows the per-library counts behind the boxes and the isomiR landscape. Each
record card follows the plane beside it and waits for a pick.
Running the pipeline
Depictio reads the output of nf-core/smrnaseq, it does not run the pipeline. Run the pipeline first:
nextflow run nf-core/smrnaseq -r 2.4.1 \
  --input samplesheet.csv \
  --genome GRCh38 --mirtrace_species hsa \
  --three_prime_adapter <adapter> \
  --outdir results -profile docker
Then point Depictio at the results, with a design table if you have one:
depictio ingest results/ --template nf-core/smrnaseq/latest \
  --var METADATA_FILE=design.tsv --var GENOME=hg38
See nf-co.re/smrnaseq/usage for full pipeline documentation.
Required data structure
Point depictio ingest at the directory holding the pipeline output. Depictio scans
recursively and matches on file name.
<DATA_ROOT>/
├── multiqc/multiqc_data/
│   └── multiqc.parquet                          # fastp, FastQC, miRTrace, mirtop, samtools
├── mirna_quant/mirtop/
│   └── joined_samples_mirtop.tsv                # the source of expression and isomiRs
├── result_*.csv                                 # miRDeep2 per sample (optional, --skip_mirdeep)
└── pipeline_info/
    ├── params_*.json
    └── *software*versions*.yml
The design table named by METADATA_FILE is read from wherever it points; its
id column is METADATA_ID_COL (default: the first column) and GROUP_COL picks
the factor the figures group on. The mature and hairpin count matrices and the
edgeR QC tables are not read.
Validation runs
The template was validated against the AWS megatest of the 2.4.1 release
(results-cb0af579b24cb8d5a3accd87b2f14ea93fe04832, the pipeline's full test
profile, a two-factor design), and the screenshots above come from it. That run
published the miRDeep2 results at the output root, and no mature or hairpin
matrices, which is why the template reads the mirtop joined table. The design
table is not part of the published run: it is vendored with the template under
input/. megatest.yaml lists the tables-only subset the template needs:
bash depictio/projects/nf-core/smrnaseq/2.4.1/download_test_data.sh /tmp/smrnaseq_test
mkdir -p /tmp/smrnaseq_test/input
cp depictio/projects/nf-core/smrnaseq/2.4.1/input/sample_metadata.tsv /tmp/smrnaseq_test/input/
depictio ingest /tmp/smrnaseq_test --template nf-core/smrnaseq/latest \
  --var METADATA_FILE=/tmp/smrnaseq_test/input/sample_metadata.tsv --var GENOME=hg19
Do not pass --project when ingesting: the dashboard is attached to the
project by name, so renaming it breaks a later depictio dashboard import.
Re-ingesting accumulates dashboards, so delete the project before repeating a run.
Additional resources
- nf-co.re/smrnaseq: official pipeline documentation
- nf-co.re/smrnaseq/2.4.1/results: AWS test results
- Template System Reference: YAML format, variables, conditionals
- Recipes: how to read, test, and write recipes
Authorship
 weber8thomas
Reviewing a template on your own data, or taking over a role here, is a contribution in itself: the contributing guide says what each one involves.