

The riboseq template follows an nf-core/riboseq run from paired Ribo-seq and RNA-seq libraries to translated ORFs:
- Overview: the run in four key figures, live findings and four figures, each linked to the tab that explains it
- Data & QC: the MultiQC report, riboWaltz periodicity of the footprints, and the Salmon sample space of both assays
- Translation: translational efficiency per gene, pooled over the run, and anota2seq translational regulation per contrast
- ORFs: ORF classes per library, and where Ribo-TISH, RiboCode and the annotation agree
The persistent Sample filters (the design group, the library and the assay)
sit in the left panel and narrow every tab that reads per-library data.
Two assays in one sample sheet
A riboseq run mixes total mRNA libraries (type: rnaseq) and ribosome
footprint libraries (type: riboseq). The MultiQC and Sample space tabs read
both; the riboWaltz, Ribo-TISH and RiboCode panels read the footprint
libraries only, and anota2seq pairs the two per contrast. The Assay filter
splits them on every tab that reads per-library data.
Quick start
depictio ingest /path/to/riboseq_results \
  --template nf-core/riboseq/latest \
  --var METADATA_FILE=/path/to/design.tsv
The hub of the dashboard is the sample sheet the run was started with. It is
not part of the published output, so copy it under input/ in the data root,
where SAMPLESHEET_FILE is auto-detected, or pass --var
SAMPLESHEET_FILE=.... METADATA_FILE is optional: a design table whose first
column is the sample id and whose first annotation column becomes the group
filter. Without it the design table and the group filter are dropped and every
other panel renders from the sample sheet.
depictio config nextflow --install     # once per machine
nextflow run nf-core/riboseq -r 2.0.0 -profile docker --outdir results
No depictio ingest, and no template named: the pipeline ingests its own
output directory when it finishes and resolves this template from its own
manifest. See Nextflow trigger.
Reference
The template reads the sample sheet, the MultiQC report, the Salmon merged gene
matrices, the riboWaltz QC tables, the anota2seq results per contrast, the
in-frame P-site counts and the Ribo-TISH and RiboCode ORF calls. Every
collection past the sample sheet, MultiQC and Salmon is optional, so a run that
skipped riboWaltz, the contrasts or an ORF caller still imports. 45 of its 65
tiles carry a use: catalog reference, so a tile says where its panel comes
from.
Self-adapting layout
The dashboard adapts to whatever the run actually produced: components bound to pruned or unparsed data collections are hidden, tabs left with no real visualizations are dropped entirely, and the remaining components are re-packed so there are no empty rows.
Template variables
Variables you provide when running the template: DATA_ROOT is the results directory given to depictio ingest, the others are set with --var NAME=value:
| Variable | Required | Description |
|---|---|---|
DATA_ROOT |
✓ | Root directory containing riboseq pipeline output (multiqc/, psites/, quantification/, translational_efficiency/, orf_predictions/) |
SAMPLESHEET_FILE |
— | Path to the riboseq samplesheet (sample, fastq_1, fastq_2, strandedness, type and the design columns). Auto-detected from {DATA_ROOT}/input/ (CSV or TSV) when omitted. |
METADATA_FILE |
— | Optional design table (TSV), first column the sample id, then one column per annotation. Adds the group filter and the design table; pruned when absent. |
METADATA_ID_COL |
— | Design-table sample id column (links join on it). Auto-detected as the first column; defaults to 'sample'. |
GROUP_COL |
— | Design-table column the group filter and card read. Auto-detected as the first annotation column (treatment in the vendored megatest table). |
Auto-detected (set from the run's metadata / params.json; the route flags drive Conditional routes below): GROUP_COL_DISPLAY
Data collections
18 data collections — 4 required 14 optional · 16 direct 2 derived.
Origin tells you whether a collection is real pipeline data or a reshape of it: direct = a pipeline output (scanned, or a recipe that reads raw files); derived = a recipe that reshapes one or more direct collections into the layout a visualization needs (no new measurement). Reads shows what produces it: a recipe .py transform, whose name links to its source on GitHub, or a raw file scanned off disk. (A direct collection can still have a recipe — one that merely parses/cleans the raw file; derived means the recipe reshapes another collection.)
| Tag | Origin | Type | Reads | Status |
|---|---|---|---|---|
multiqc_data |
direct |  MultiQC MultiQC |
file (?:.*/)?multiqc(?:/[^/]+)?/multiqc(?:_report)?_data/multiqc.parquet$ |
required |
samples |
direct | Table | recipe nf-core/riboseq/samplesheet.py |
required |
metadata |
direct | Table | file {METADATA_FILE} |
optional |
gene_counts |
direct | Table | file salmon.merged.gene_counts.tsv$ |
required |
sample_pca |
direct | Table | recipe salmon/sample_pca.py |
required |
ribowaltz_summary |
direct | Table | recipe ribowaltz/library_summary.py |
optional |
ribowaltz_frames |
direct | Table | recipe ribowaltz/frames.py |
optional |
ribowaltz_psite_region |
direct | Table | recipe ribowaltz/psite_region.py |
optional |
ribowaltz_length |
direct | Table | recipe ribowaltz/length_distribution.py |
optional |
ribowaltz_metaprofile_start |
direct | Table | recipe ribowaltz/metaprofile_start.py |
optional |
ribowaltz_metaprofile_stop |
direct | Table | recipe ribowaltz/metaprofile_stop.py |
optional |
anota2seq_regulation |
direct | Table | recipe anota2seq/regulation.py |
optional |
anota2seq_results |
direct | Table | recipe anota2seq/results.py |
optional |
translational_efficiency |
direct | Table | recipe nf-core/riboseq/translational_efficiency.py |
optional |
ribotish_orfs |
direct | Table | recipe ribotish/orfs.py |
optional |
ribocode_orfs |
direct | Table | recipe ribocode/orfs.py |
optional |
orf_calls |
derived | Table | recipe nf-core/riboseq/orf_calls.py |
optional |
orf_overlap |
derived | Table | recipe nf-core/riboseq/orf_overlap.py |
optional |
Conditional routes
Rows are data collections; columns are the variables you set or params.json flags auto-detected from the run. Each filled cell is the effect of setting that variable; an empty cell means that variable leaves the collection unchanged. (17 collections are unaffected by any variable — present on every run.)
+ included− removed⇄ repointed
| Data collection | METADATA_FILE |
|---|---|
metadata |
+ |
Cross-DC links
35 links — selecting a value in the source collection filters the target. The join column is shown after the source.
| Source · column | Target | Filters | |
|---|---|---|---|
samples · sample |
→ | multiqc_data |
Filter the MultiQC panels by sample sheet selection |
samples · sample |
→ | sample_pca |
Filter the sample space by sample sheet selection |
samples · sample |
→ | gene_counts |
Narrow the merged count matrix to the selected libraries (column subset) |
samples · sample |
→ | ribowaltz_summary |
Filter the Ribo-seq library summary by sample sheet selection |
samples · sample |
→ | ribowaltz_frames |
Filter the frame distribution by sample sheet selection |
samples · sample |
→ | ribowaltz_psite_region |
Filter the region composition by sample sheet selection |
samples · sample |
→ | ribowaltz_length |
Filter the footprint lengths by sample sheet selection |
samples · sample |
→ | ribowaltz_metaprofile_start |
Filter the start-codon metaprofile by sample sheet selection |
samples · sample |
→ | ribowaltz_metaprofile_stop |
Filter the stop-codon metaprofile by sample sheet selection |
samples · sample |
→ | ribotish_orfs |
Filter the Ribo-TISH ORFs by sample sheet selection |
samples · sample |
→ | ribocode_orfs |
Filter the RiboCode ORFs by sample sheet selection |
samples · sample |
→ | orf_calls |
Filter the ORF class composition by sample sheet selection |
metadata · {METADATA_ID_COL} |
→ | samples |
Filter the sample sheet by design-table selection |
metadata · {METADATA_ID_COL} |
→ | multiqc_data |
Filter the MultiQC panels by design-table selection |
metadata · {METADATA_ID_COL} |
→ | sample_pca |
Filter the sample space by design-table selection |
metadata · {METADATA_ID_COL} |
→ | ribowaltz_summary |
Filter the Ribo-seq library summary by design-table selection |
metadata · {METADATA_ID_COL} |
→ | ribowaltz_frames |
Filter the frame distribution by design-table selection |
metadata · {METADATA_ID_COL} |
→ | ribowaltz_psite_region |
Filter the region composition by design-table selection |
metadata · {METADATA_ID_COL} |
→ | ribowaltz_length |
Filter the footprint lengths by design-table selection |
metadata · {METADATA_ID_COL} |
→ | ribowaltz_metaprofile_start |
Filter the start-codon metaprofile by design-table selection |
metadata · {METADATA_ID_COL} |
→ | ribowaltz_metaprofile_stop |
Filter the stop-codon metaprofile by design-table selection |
metadata · {METADATA_ID_COL} |
→ | ribotish_orfs |
Filter the Ribo-TISH ORFs by design-table selection |
metadata · {METADATA_ID_COL} |
→ | ribocode_orfs |
Filter the RiboCode ORFs by design-table selection |
metadata · {METADATA_ID_COL} |
→ | orf_calls |
Filter the ORF class composition by design-table selection |
ribowaltz_summary · sample |
→ | ribowaltz_frames |
Carry a library-quality filter onto the frame distribution |
ribowaltz_summary · sample |
→ | ribowaltz_length |
Carry a library-quality filter onto the footprint lengths |
ribowaltz_summary · sample |
→ | ribowaltz_metaprofile_start |
Carry a library-quality filter onto the start-codon metaprofile |
ribowaltz_summary · sample |
→ | ribowaltz_metaprofile_stop |
Carry a library-quality filter onto the stop-codon metaprofile |
ribowaltz_summary · sample |
→ | ribowaltz_psite_region |
Carry a library-quality filter onto the region composition |
anota2seq_regulation · gene_id |
→ | anota2seq_results |
Carry the regulation-mode selection onto the per-analysis results |
anota2seq_regulation · gene_id |
→ | translational_efficiency |
Carry the regulation-mode selection onto the translational efficiency plane |
anota2seq_regulation · contrast |
→ | anota2seq_results |
Keep the per-analysis results on the contrast picked for the regulation panels |
orf_overlap · orf_id |
→ | ribotish_orfs |
Carry an ORF selection onto the Ribo-TISH calls |
orf_overlap · orf_id |
→ | ribocode_orfs |
Carry an ORF selection onto the RiboCode calls |
orf_overlap · orf_class |
→ | orf_calls |
Narrow the ORF class composition to the picked classes |
Recipes
Each recipe reshapes raw pipeline output into a tidy table. The name links to its source; Output lists the validated OUTPUT_SCHEMA columns.
| Recipe | Transforms | Output |
|---|---|---|
anota2seq/regulation.py |
anota2seq regulatory mode per gene: one row per contrast and gene. | contrast, gene_id, gene_name, total_mrna_lfc, total_mrna_padj, translated_mrna_lfc, translated_mrna_padj, translation_effect, translation_pvalue, translation_padj, buffering_effect, buffering_padj, regulation_mode, direction |
anota2seq/results.py |
anota2seq results in long form: one row per contrast, analysis and gene. | contrast, analysis, gene_id, gene_name, effect, slope, pvalue, padj, neg_log10_padj, significant, direction |
nf-core/riboseq/orf_calls.py |
ORF classes per library and caller: the composition behind the ORF stacked bars. | sample, caller, orf_class, orfs, pct |
nf-core/riboseq/orf_overlap.py |
Which ORFs each caller found: one row per ORF, pooled over the libraries. | orf_id, gene_id, gene_name, gene_type, orf_class, aa_length, ribotish, ribocode, annotated_cds, ribotish_libraries, ribocode_libraries |
nf-core/riboseq/samplesheet.py |
nf-core/riboseq samplesheet as the sample hub every panel filters through. | sample, type, read_type |
nf-core/riboseq/translational_efficiency.py |
Baseline translational efficiency per gene, pooled over the run's libraries. | gene_id, gene_name, rna_cpm, ribo_cpm, log2_rna_cpm, log2_ribo_cpm, log2_te, rna_libraries, ribo_libraries |
ribocode/orfs.py |
RiboCode ORF calls, one row per library and ORF. | sample, orf_id, transcript_id, gene_id, gene_name, gene_type, chrom, strand, orf_type, orf_class, aa_length, psites_frame0, adjusted_pvalue |
ribotish/orfs.py |
Ribo-TISH ORF predictions, one row per library and ORF. | sample, orf_id, transcript_id, gene_id, gene_name, gene_type, chrom, strand, orf_type, orf_class, start_codon, aa_length, start_sites, frame_qvalue |
ribowaltz/frames.py |
riboWaltz P-site frame distribution per library and transcript region. | sample, region, frame, count, pct |
ribowaltz/length_distribution.py |
riboWaltz read-length distribution per library. | sample, length, count, pct |
ribowaltz/library_summary.py |
One row per Ribo-seq library: the riboWaltz quality readouts side by side. | sample, psites, frame0_cds_pct, frame_bias, cds_pct, utr5_pct, utr3_pct, cds_enrichment, modal_length, length_iqr |
ribowaltz/metaprofile_start.py |
riboWaltz metagene P-site profile around the start codon. | sample, position, signal |
ribowaltz/metaprofile_stop.py |
riboWaltz metagene P-site profile around the stop codon. | sample, position, signal |
ribowaltz/psite_region.py |
riboWaltz P-site share per transcript region, against the transcriptome expectation. | sample, region, scope, count, pct, expected_pct, enrichment |
salmon/sample_pca.py |
Sample PCA of a merged Salmon TPM matrix, plus the per-sample library summary. | sample_id, dim_1, dim_2, group, genes_detected, genes_expressed, median_tpm |
Dashboard tabs
One dashboard: the Overview, then six child tabs in three groups, read as a funnel from the reads to the ORFs being translated. Each tab below carries the same icon and colour the dashboard gives it, so the page and the app read alike.
| Group | Tabs |
|---|---|
| Data & QC | MultiQC, Ribo-seq QC, Sample space |
| Translation | Translational efficiency, Translational regulation |
| ORFs | ORF discovery |
Each child tab opens with a short intro and a strip of four cards, then at most
three open sections; tables and details follow, collapsed. The persistent Sample
filters (the design group, the library and the assay) sit in the left panel and
narrow every tab that reads per-library data; Translational efficiency and
Translational regulation are pooled over the run and do not follow them. The
Sample sheet section (the sample sheet and the optional design table) is pinned,
collapsed, to the bottom of every child tab. Without a METADATA_FILE the design
table and the group filters go; the library and assay filters remain.
Ribosome footprints and mRNA, from read QC to the ORFs being translated.
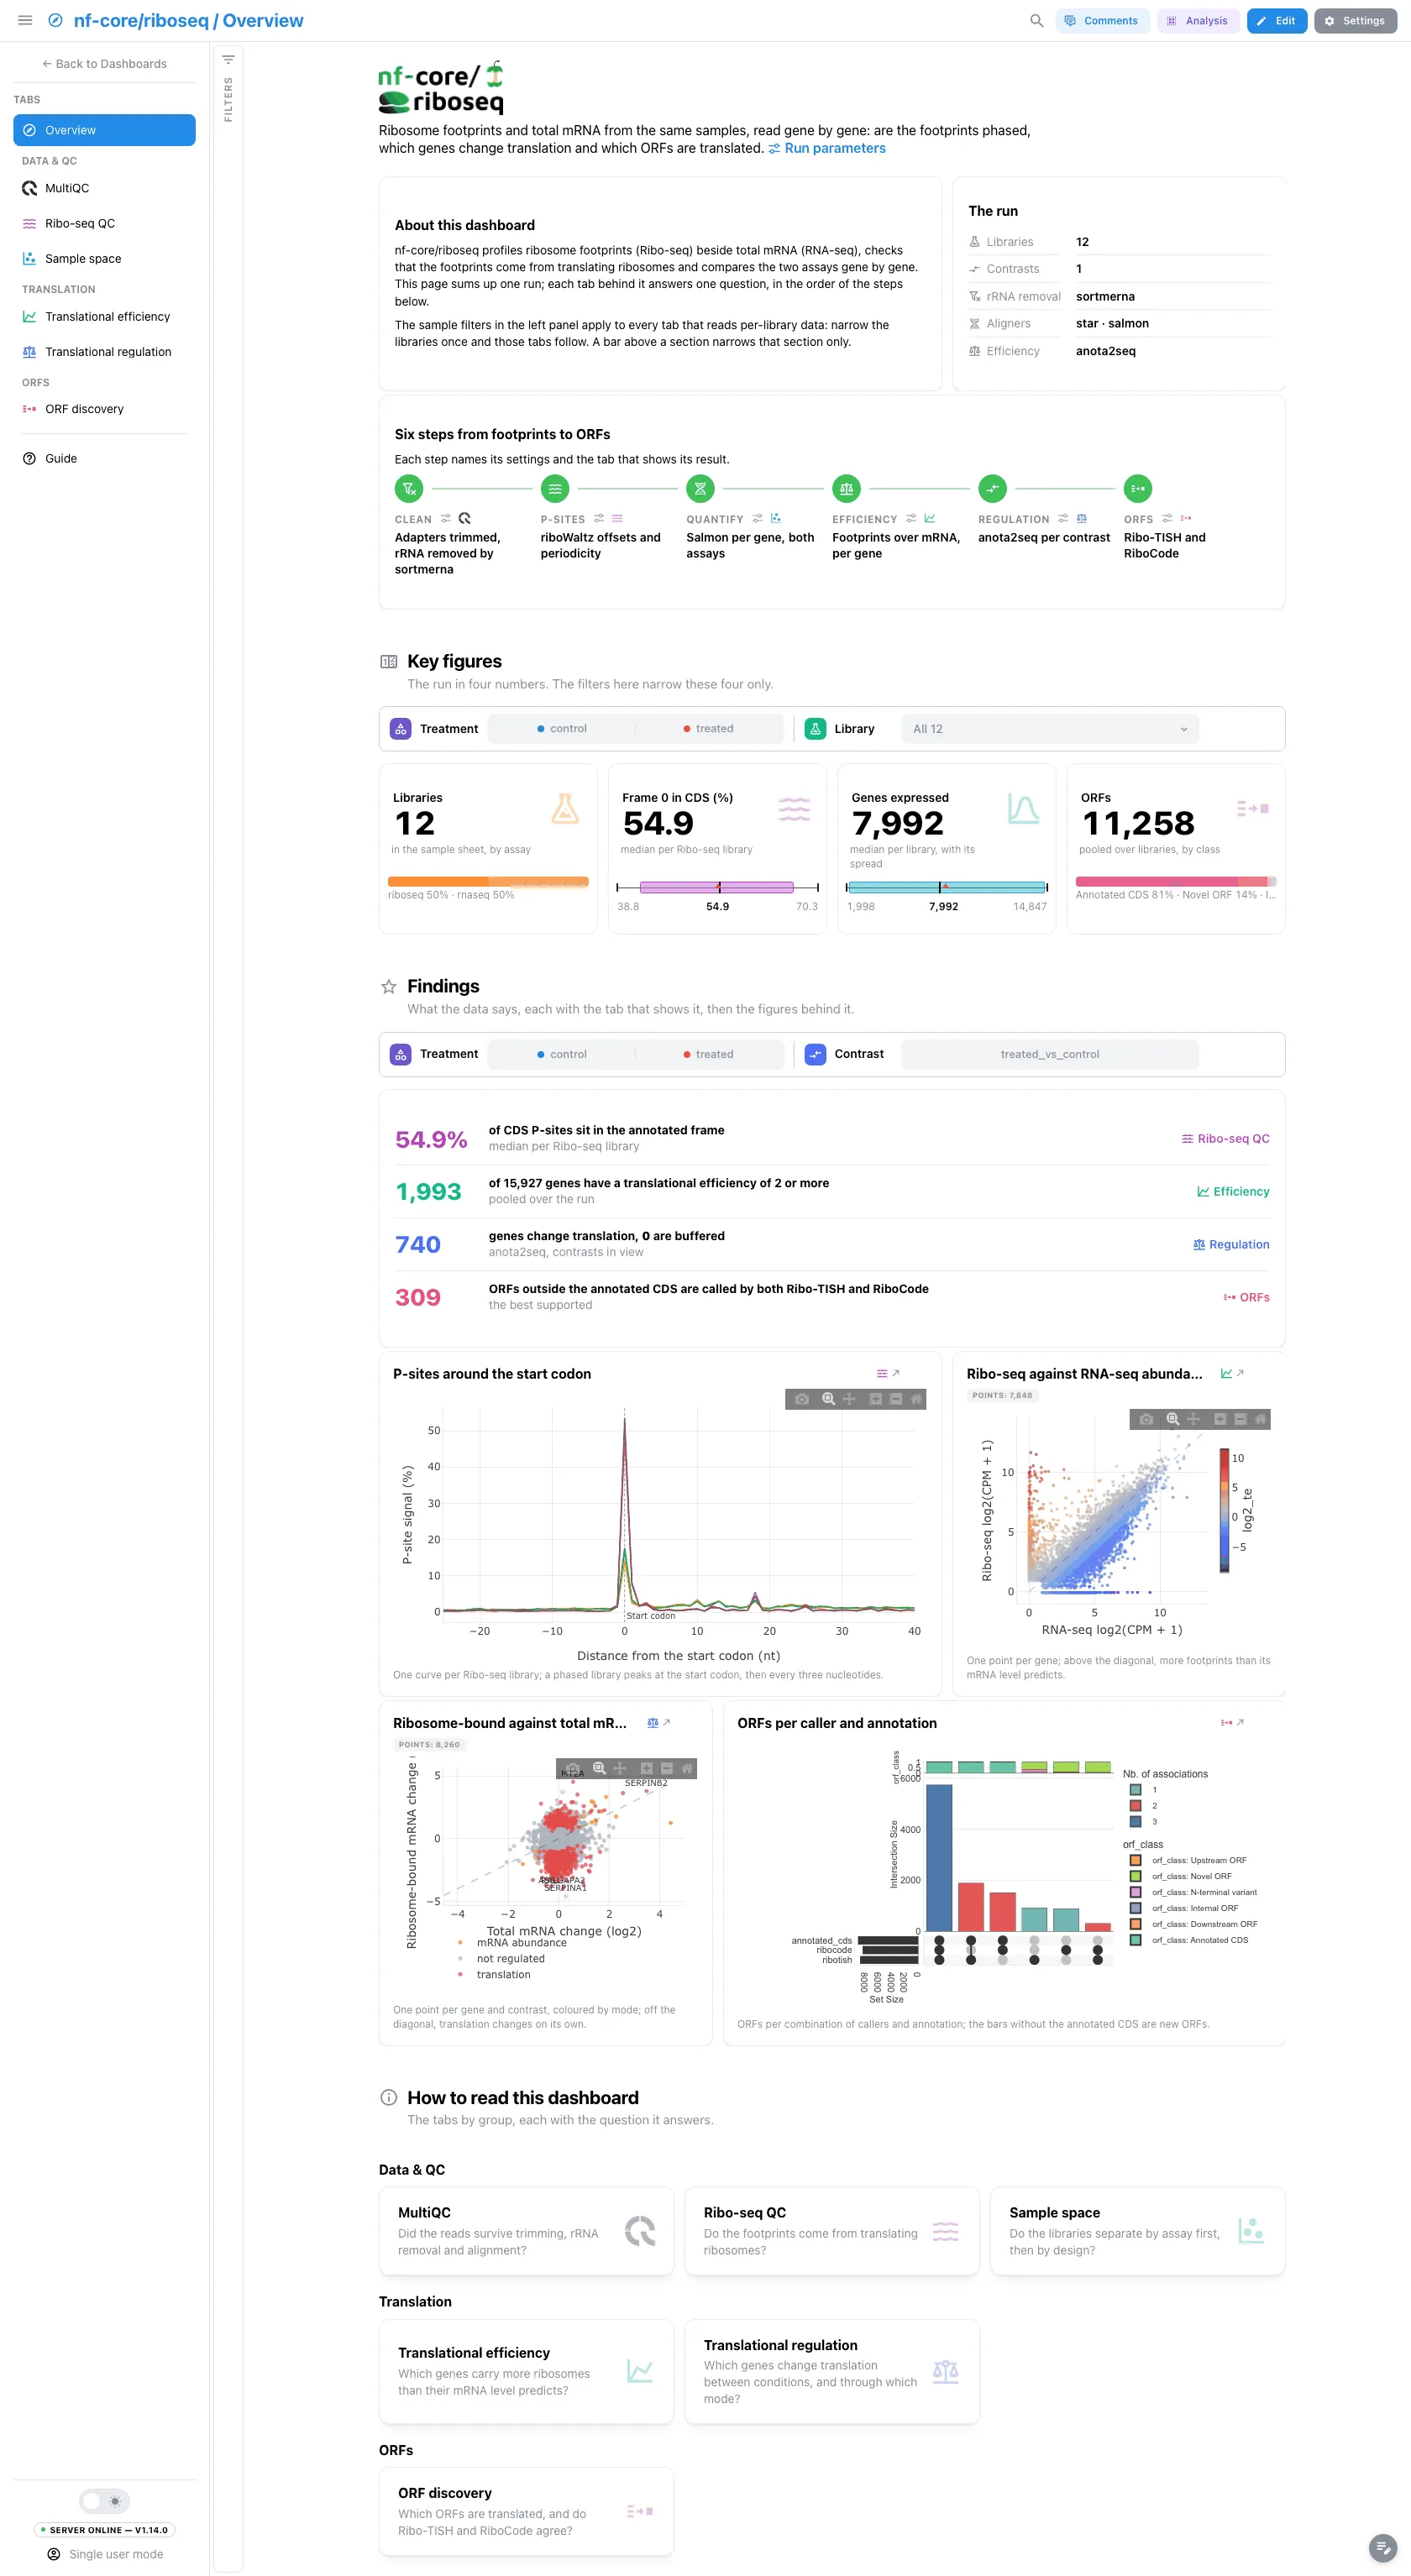
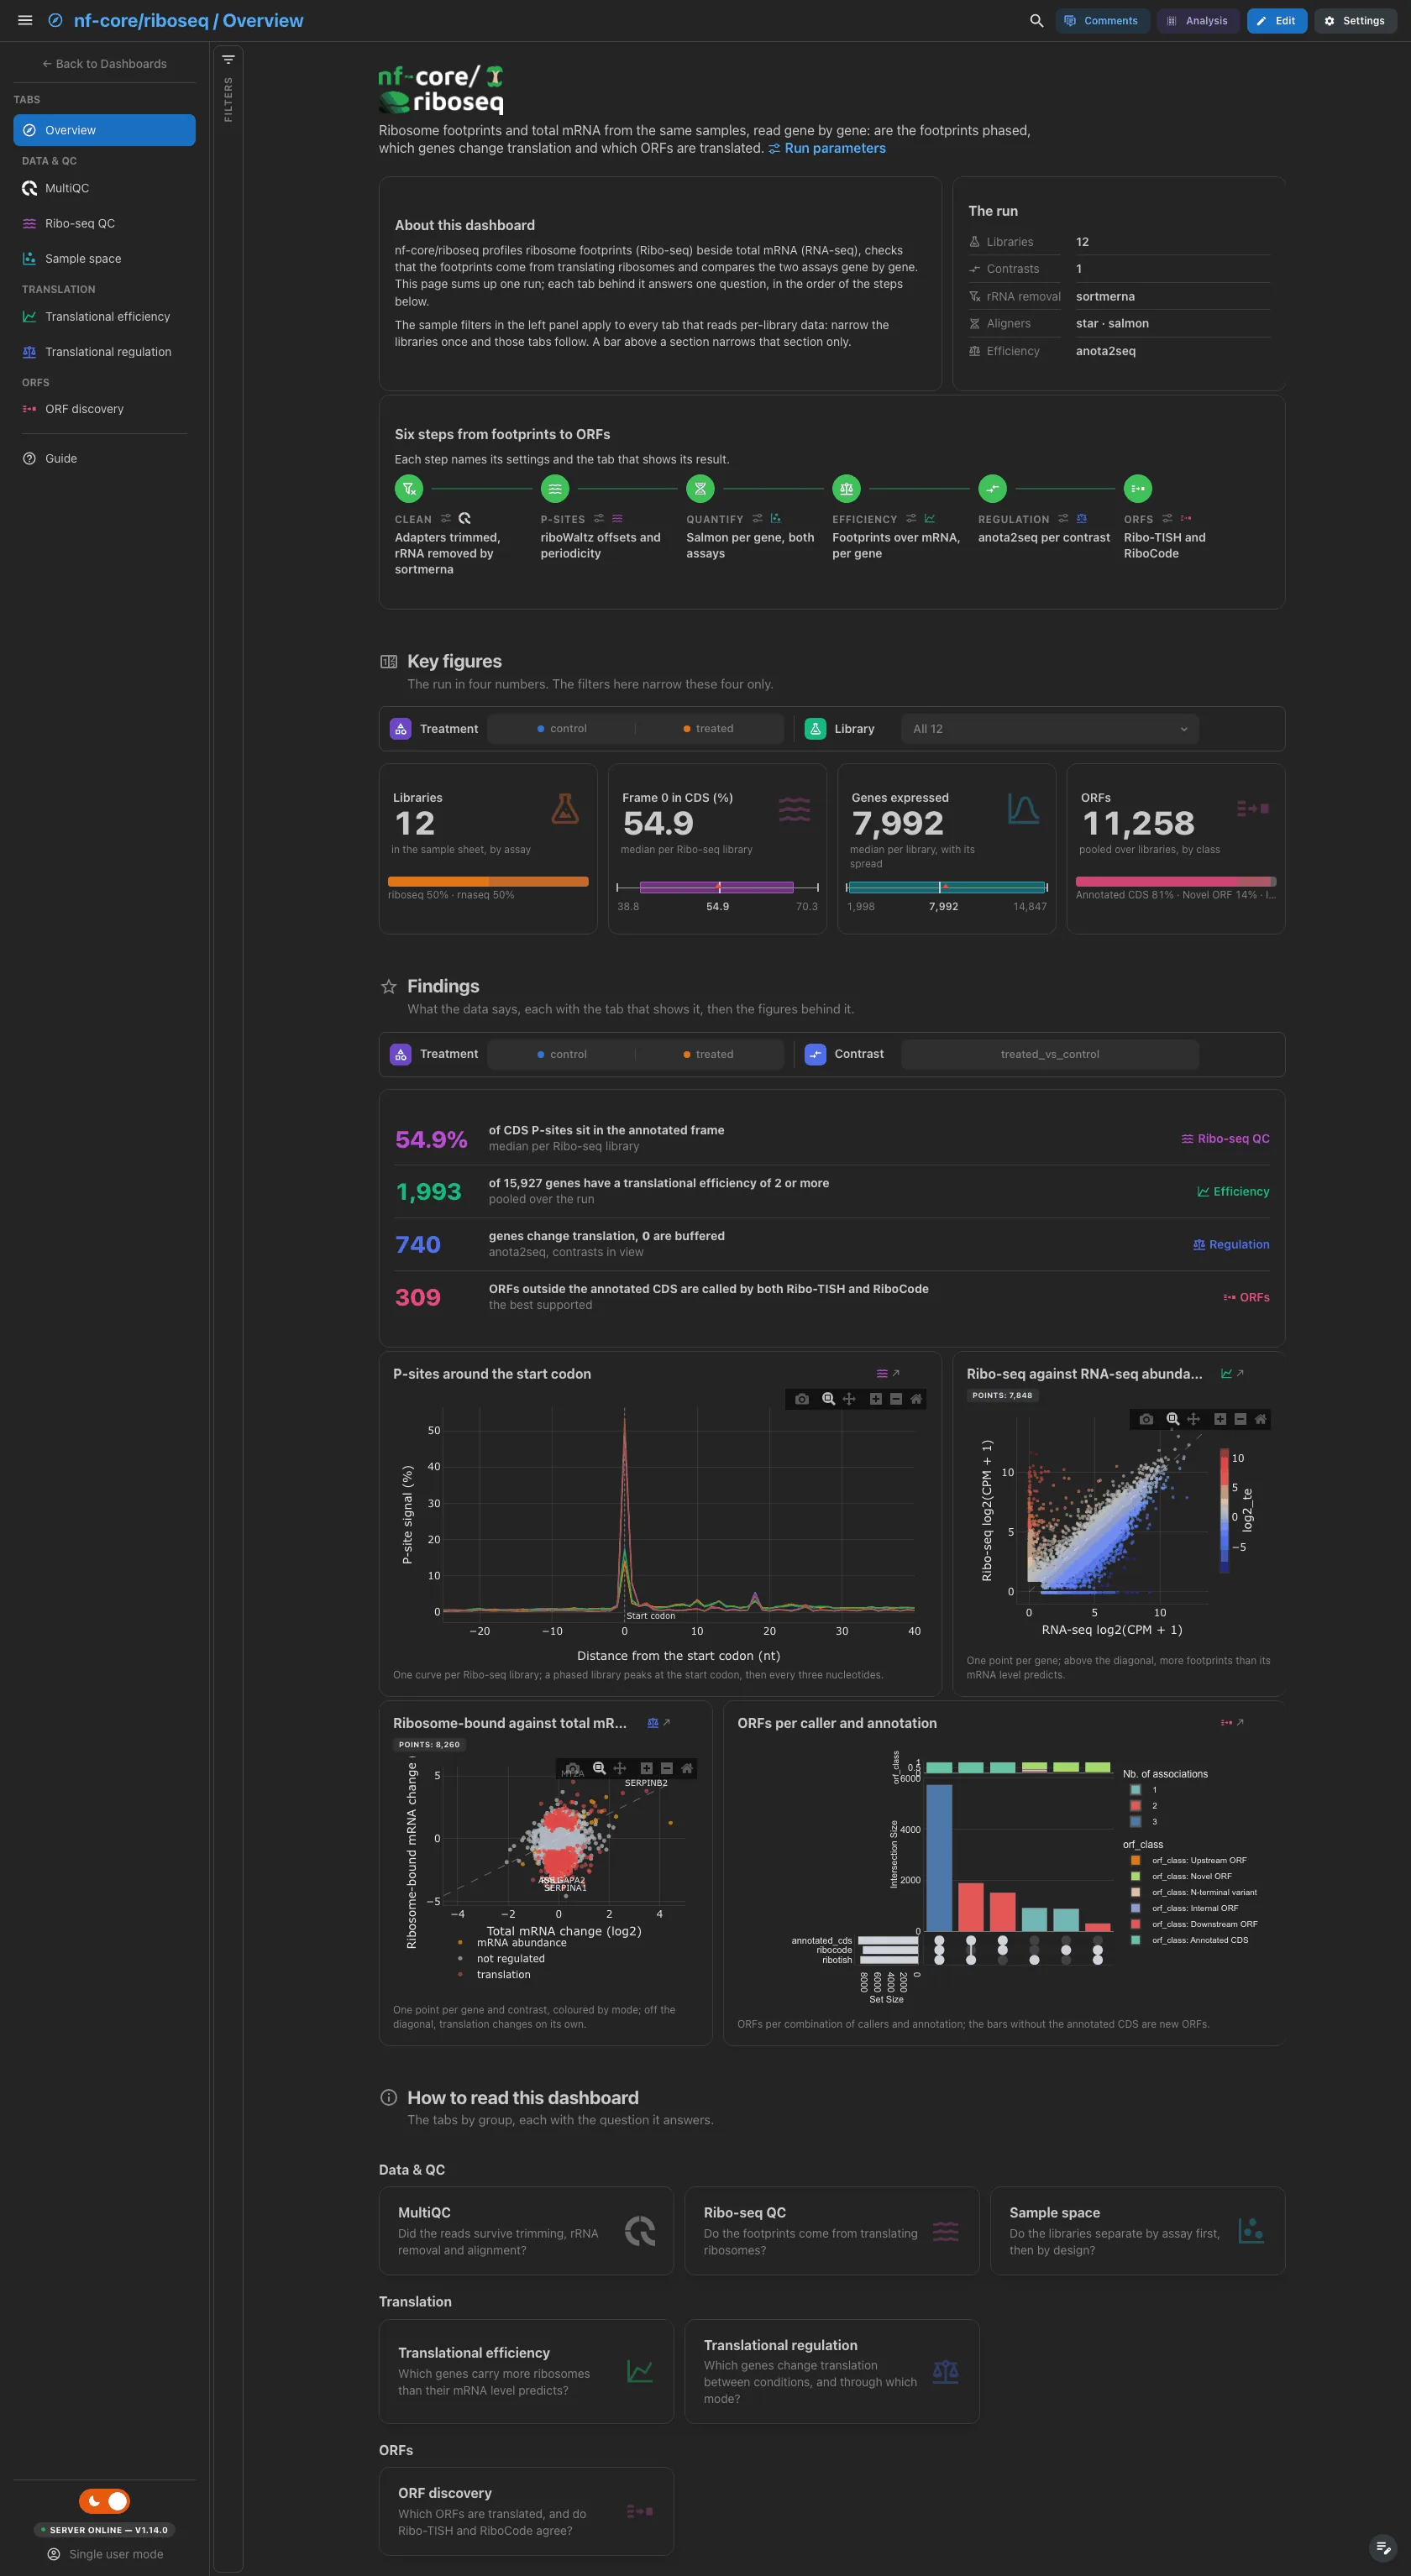
A short hero links the run parameters. About this dashboard says what the
dashboard shows and how the two filter levels work, The run lists the
libraries, the contrasts, the rRNA removal tool, the aligners and the
efficiency method, and Pipeline walks the six steps from cleaning to ORFs,
each linked to its settings and its tab. The findings are live values: they
follow the filters, except the efficiency and ORF rows, which are pooled over
the run. No key figure reads anota2seq, so a run without --contrasts keeps
four cards; regulation is a findings row and a figure.
Filters and components
Filters · the left panel starts collapsed. Key figures has its own filter bar (the design group and the library), Findings another (the design group and the contrast): each narrows its own section only.
| Section | What it holds |
|---|---|
| Top | Hero, About this dashboard, The run, Pipeline |
| Key figures | 4 headline cards: libraries by assay, frame-0 share of CDS P-sites, genes expressed, ORFs by class |
| Findings | Live result rows, then 4 figures: the P-sites around the start codon, the efficiency plane, the fold-change plane and the caller UpSet |
| How to read this dashboard | The tabs by group, each with its question |
Data & QC · Did the reads survive trimming, rRNA removal and alignment?
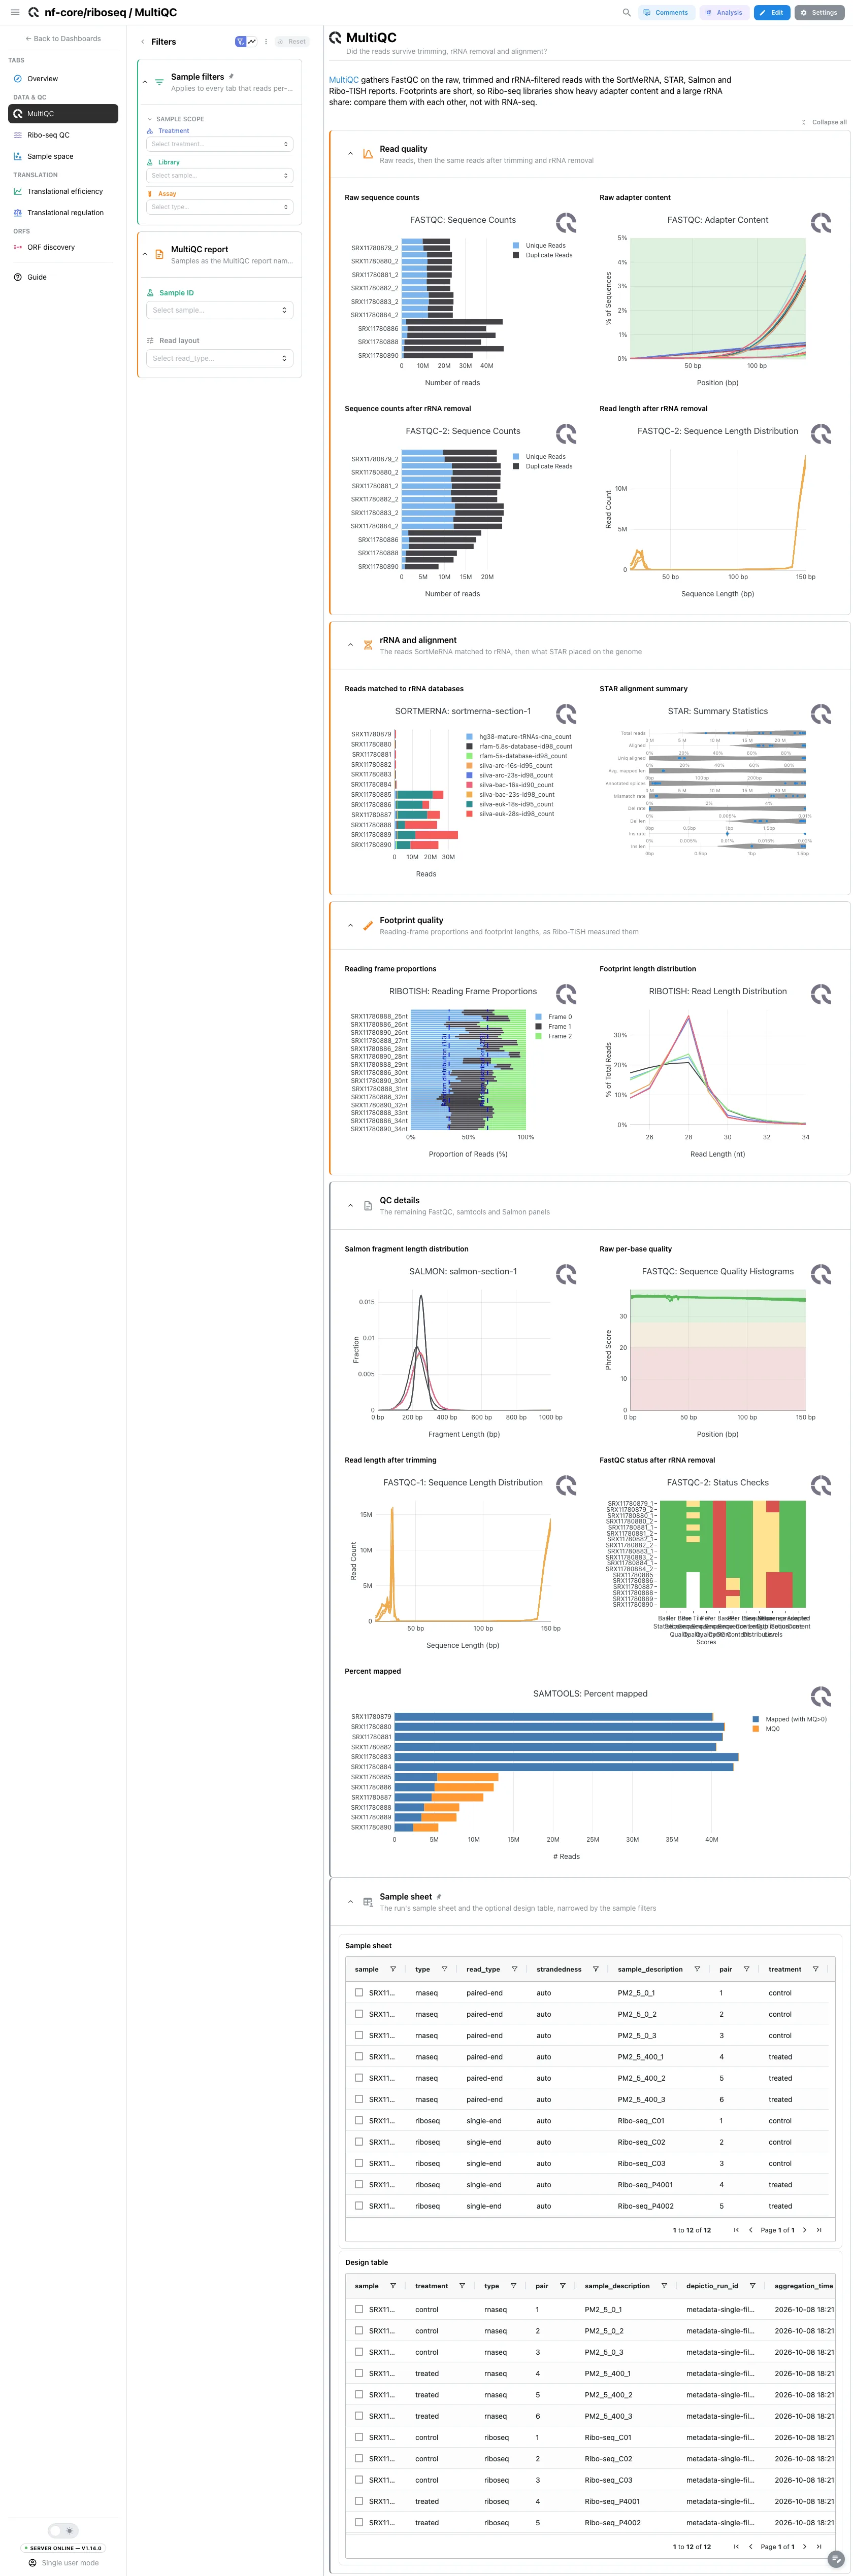
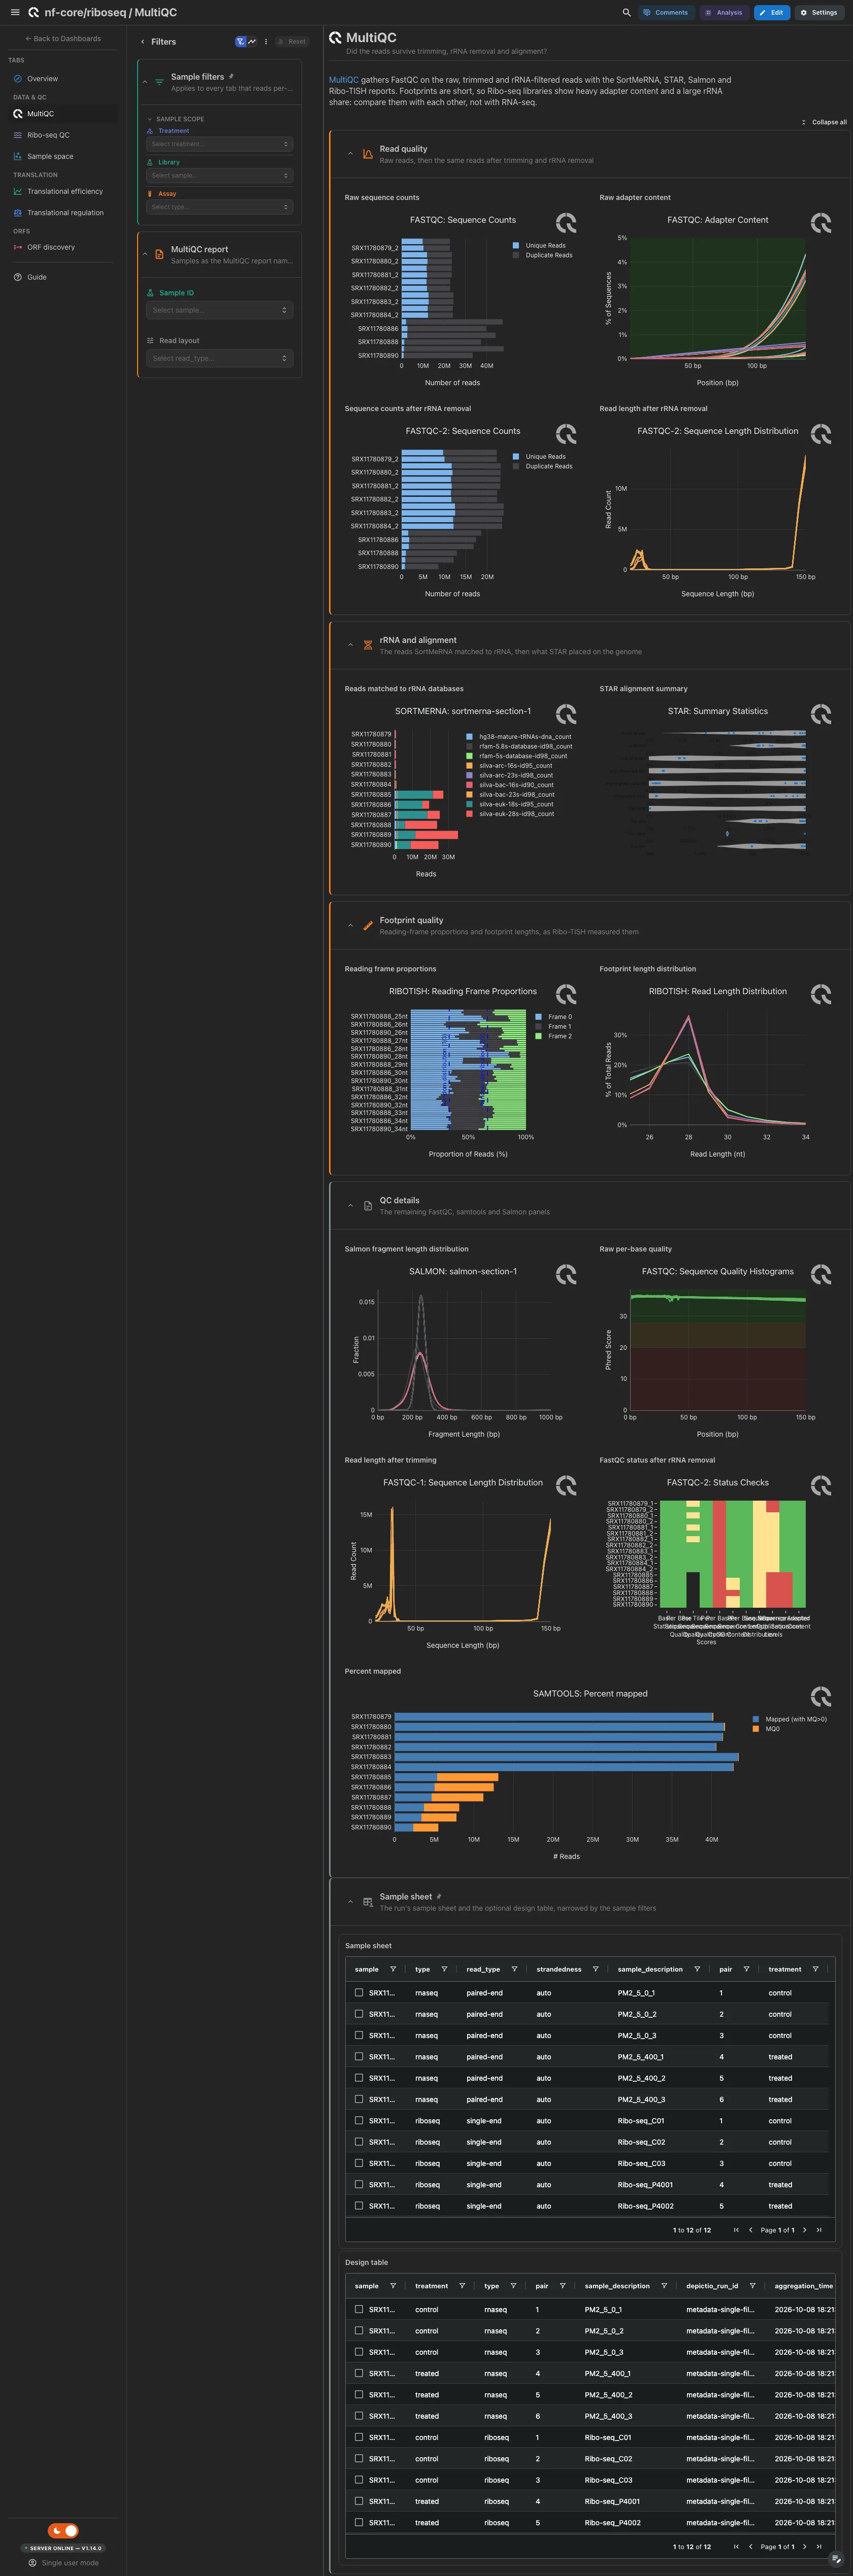
MultiQC panels only. Open: FastQC sequence counts and adapter content on the raw reads, then counts and read lengths after rRNA removal; the SortMeRNA rRNA share beside the STAR summary; Ribo-TISH's reading-frame proportions and footprint lengths. Footprints are short, so Ribo-seq libraries show heavy adapter content and a large rRNA share: compare them with each other, not with RNA-seq. The Salmon fragment lengths, the raw per-base quality, the read lengths after trimming, the FastQC status after rRNA removal and the samtools mapping rate are collapsed.
Filters and components
Filters · Sample ID, read from the MultiQC report, and Read layout
on the sample sheet, so both work on a run without a design table.
| Section | What it holds |
|---|---|
| Read quality | 4 MultiQC panels |
| rRNA and alignment | 2 MultiQC panels |
| Footprint quality | 2 MultiQC panels |
| QC details (collapsed) | 5 MultiQC panels |
Data & QC · Do the footprints come from translating ribosomes?
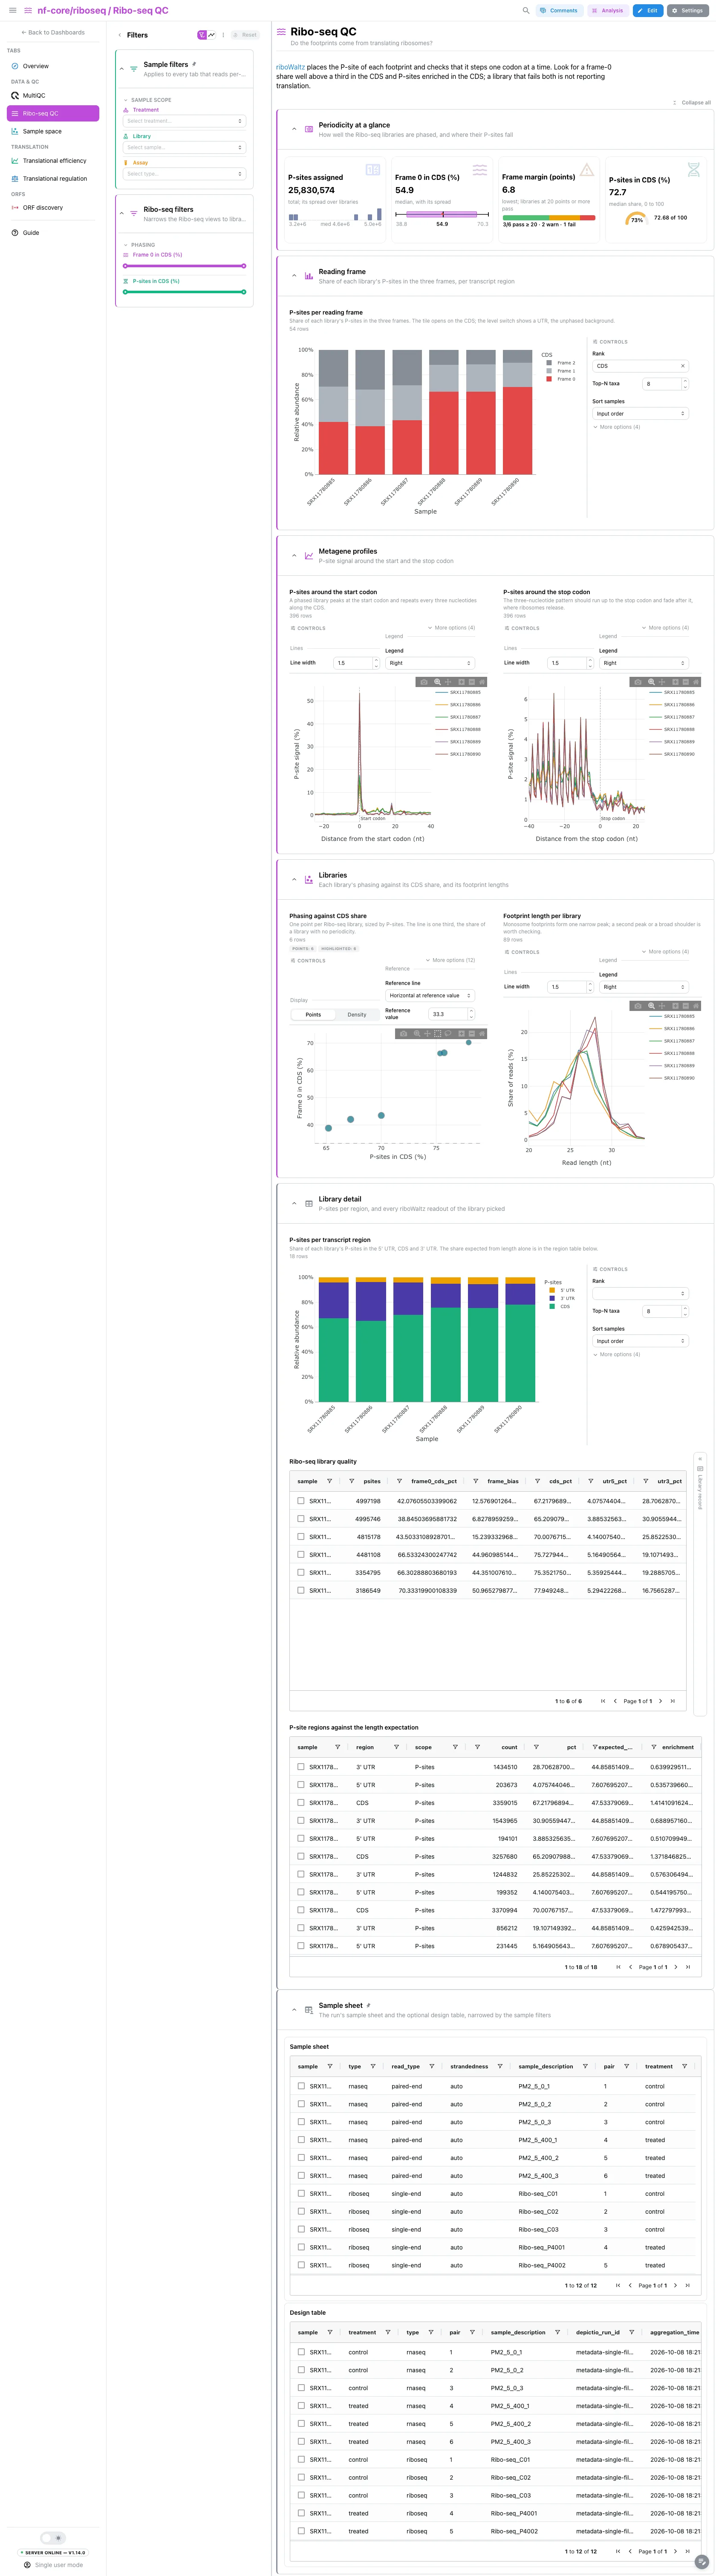
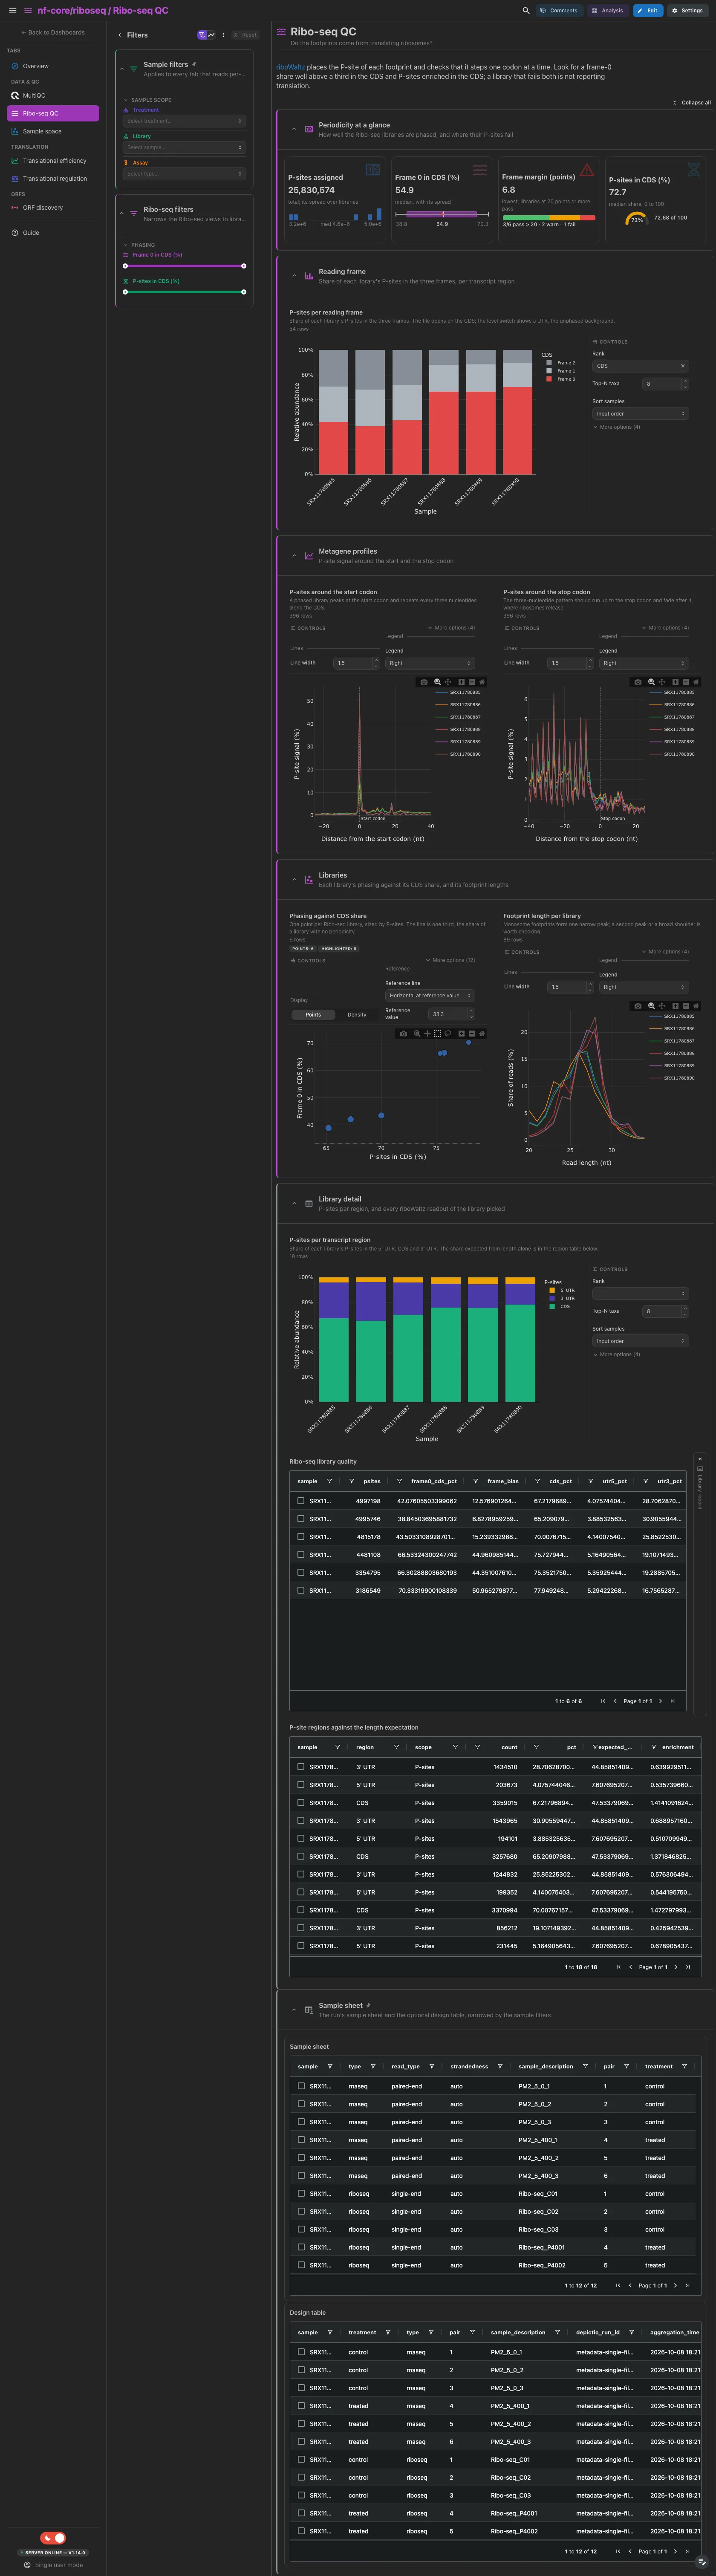
The P-sites riboWaltz assigned, the median frame-0 share in the CDS, the lowest frame margin against a 20-point threshold and the median CDS share of P-sites. Then the P-sites per reading frame (the CDS first, a UTR one switch away), the P-sites around the start and the stop codon, and the phasing plane beside the footprint length profiles. The frame-0 share is taken on frame 0 itself, not on the dominant frame, so a mis-set P-site offset shows as a low value. The region composition, the library table with its record card and the region table against the length expectation are collapsed.
Filters and components
Filters · Frame 0 in CDS (%) and P-sites in CDS (%) ranges on
ribowaltz_summary, which links to every other riboWaltz view.
| Section | What it holds |
|---|---|
| Periodicity at a glance | 4 cards |
| Reading frame | 1 advanced visualization |
| Metagene profiles | 2 advanced visualizations |
| Libraries | 2 advanced visualizations: the phasing plane and the footprint length profiles |
| Library detail (collapsed) | 1 advanced visualization, Ribo-seq library quality + a library record card, P-site regions against the length expectation |
Only with riboWaltz
A run with --skip_ribowaltz writes no riboWaltz tables: the tab is
dropped, and with it the frame-0 card, the frame-0 row and the start-codon
figure on the Overview.
Data & QC · Do the libraries separate by assay first, then by design?
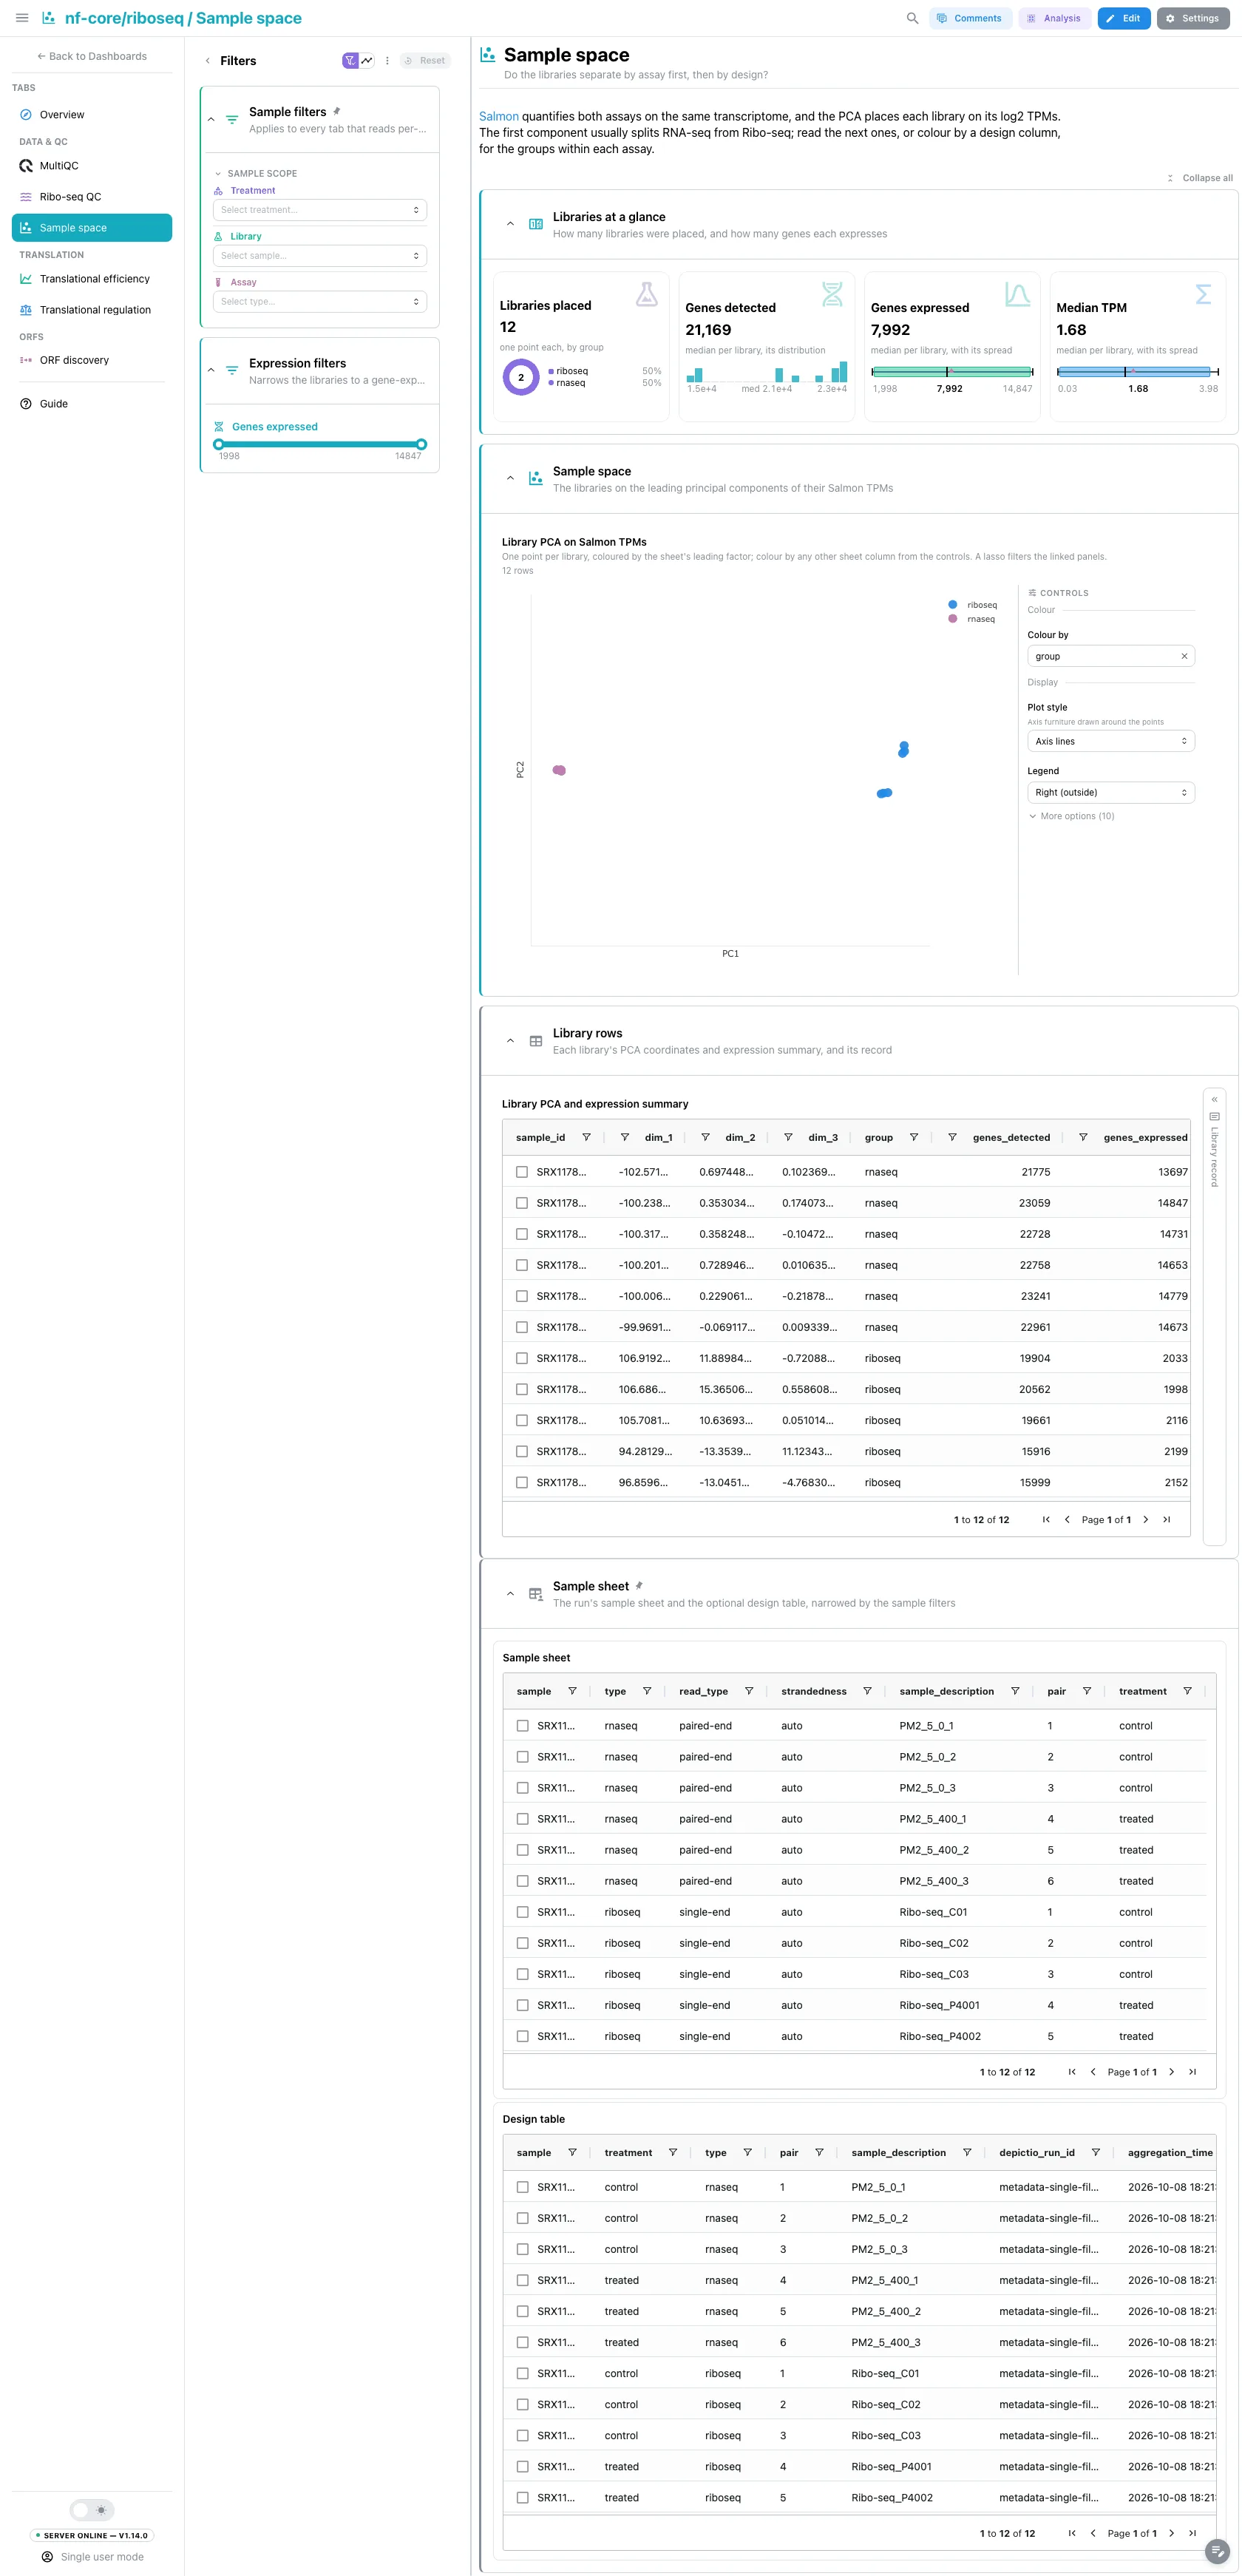
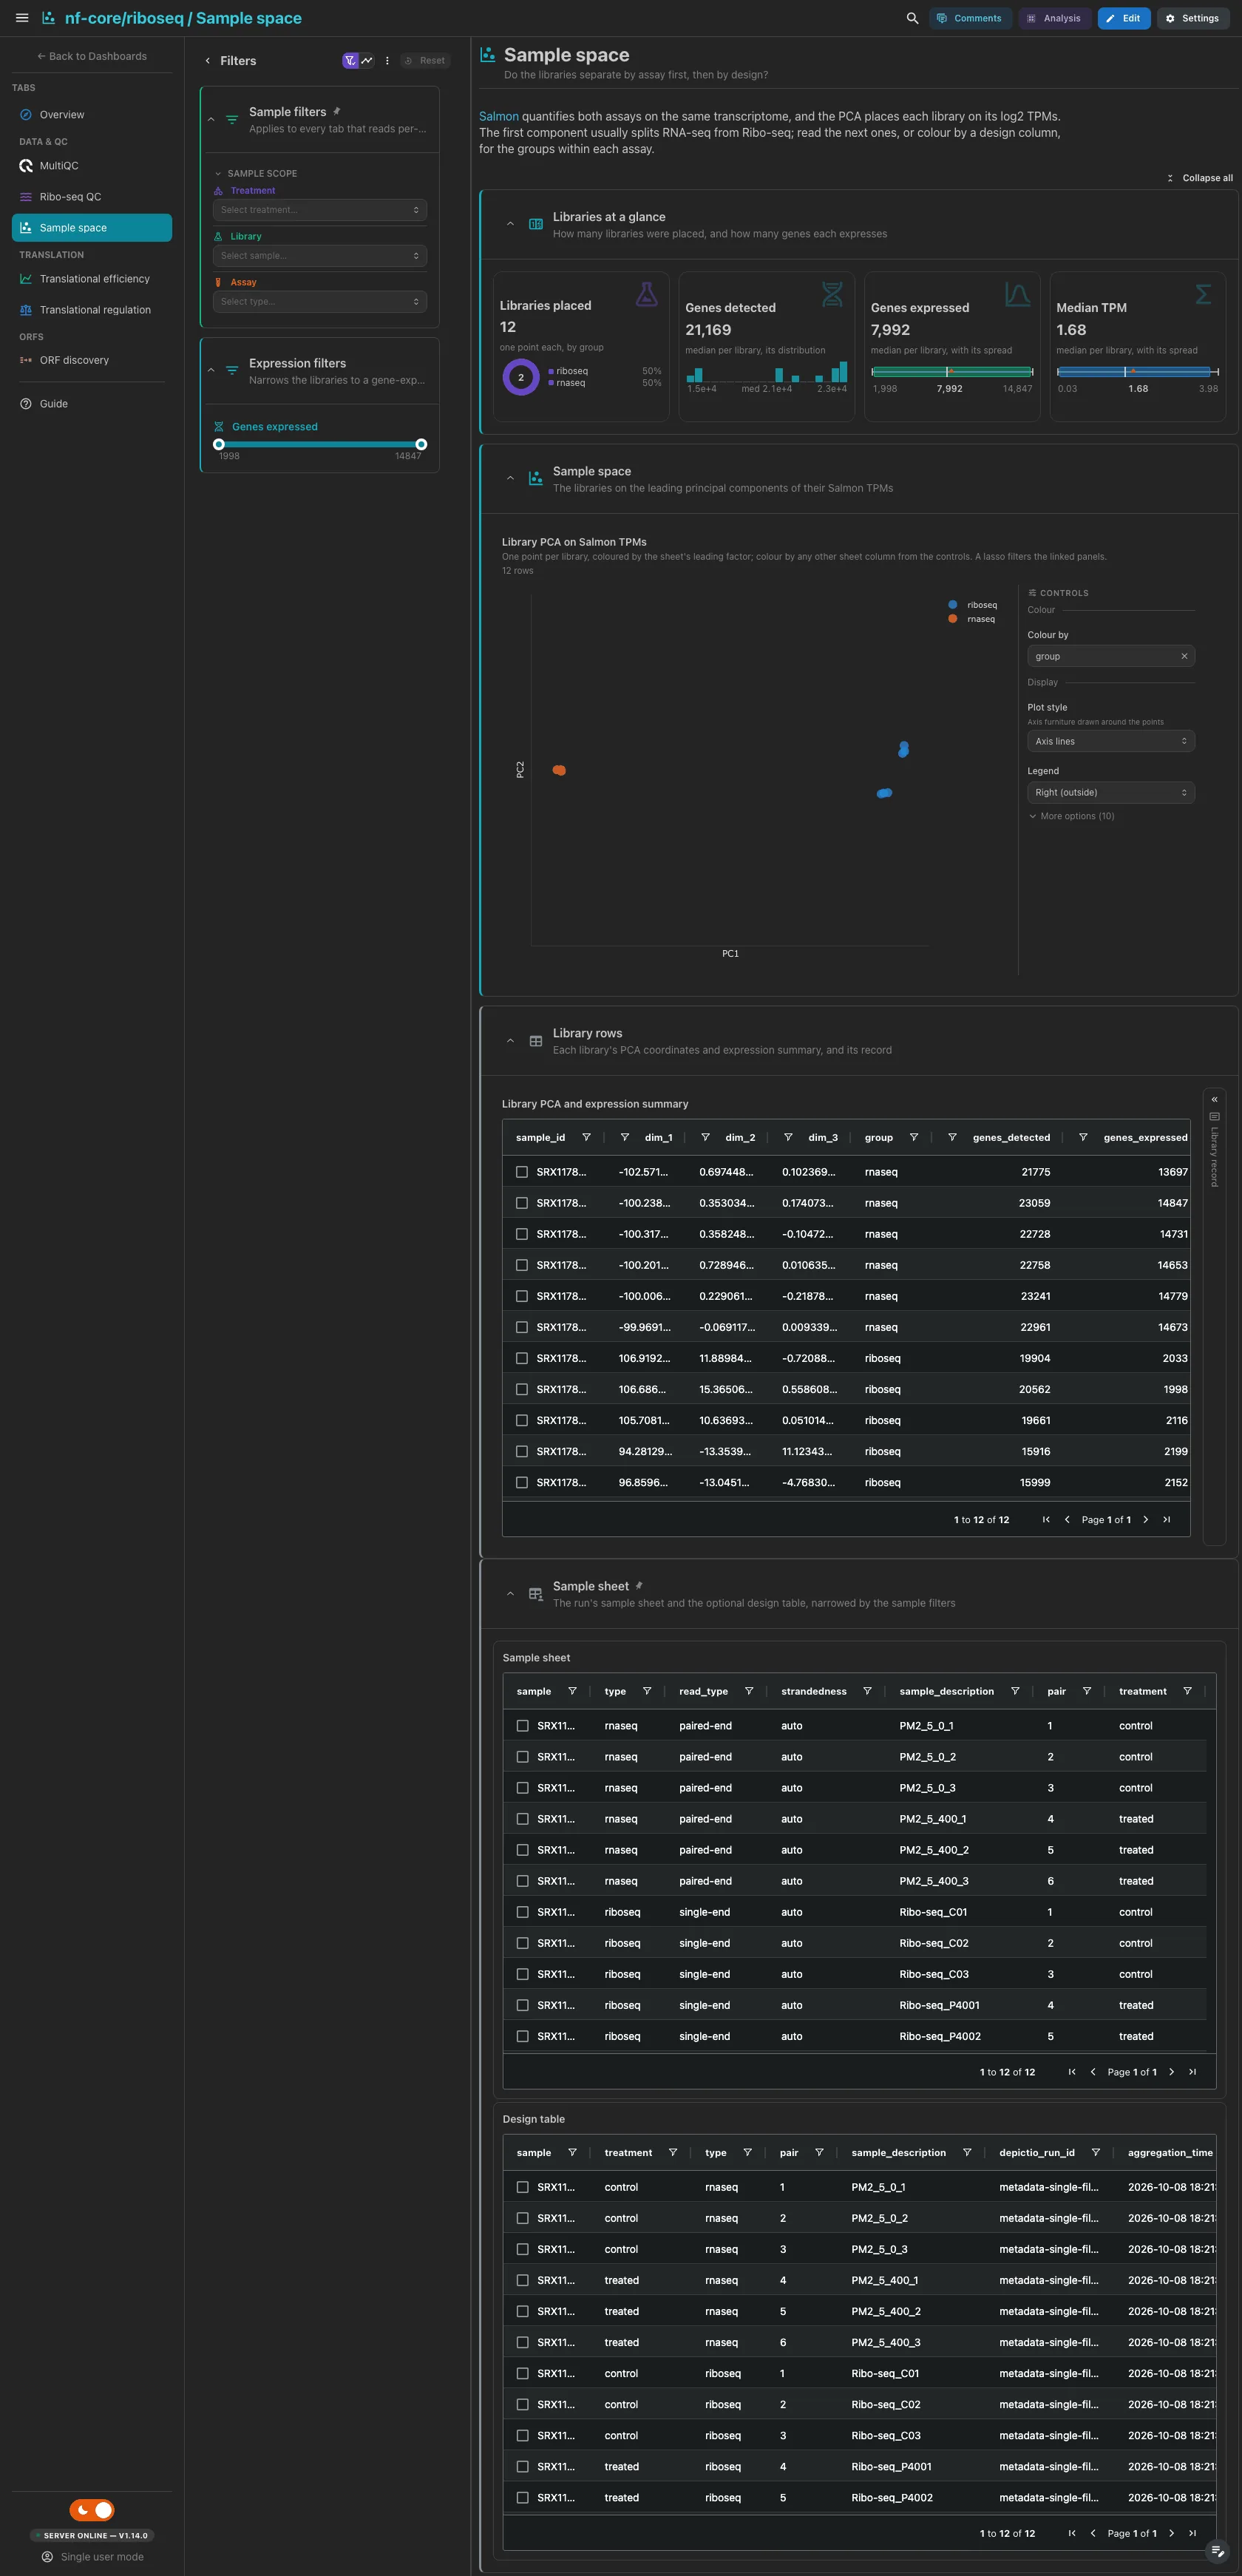
The libraries placed, split by the sheet's leading factor (the assay on a riboseq sheet), the median genes detected, and the median genes expressed and median TPM per library with their spread. Then a PCA on the Salmon TPMs of every library, Ribo-seq and RNA-seq together, coloured by the leading factor; any other sheet column is one switch away. The first component usually splits the two assays; read the next ones for the design groups within each. A lasso filters the linked panels. The PCA table with the library record beside it is collapsed.
Filters and components
Filters · a Genes expressed range on sample_pca.
| Section | What it holds |
|---|---|
| Libraries at a glance | 4 cards |
| Sample space | 1 advanced visualization |
| Library rows (collapsed) | Library PCA and expression summary + a library record card |
Translation · Which genes carry more ribosomes than their mRNA level predicts?
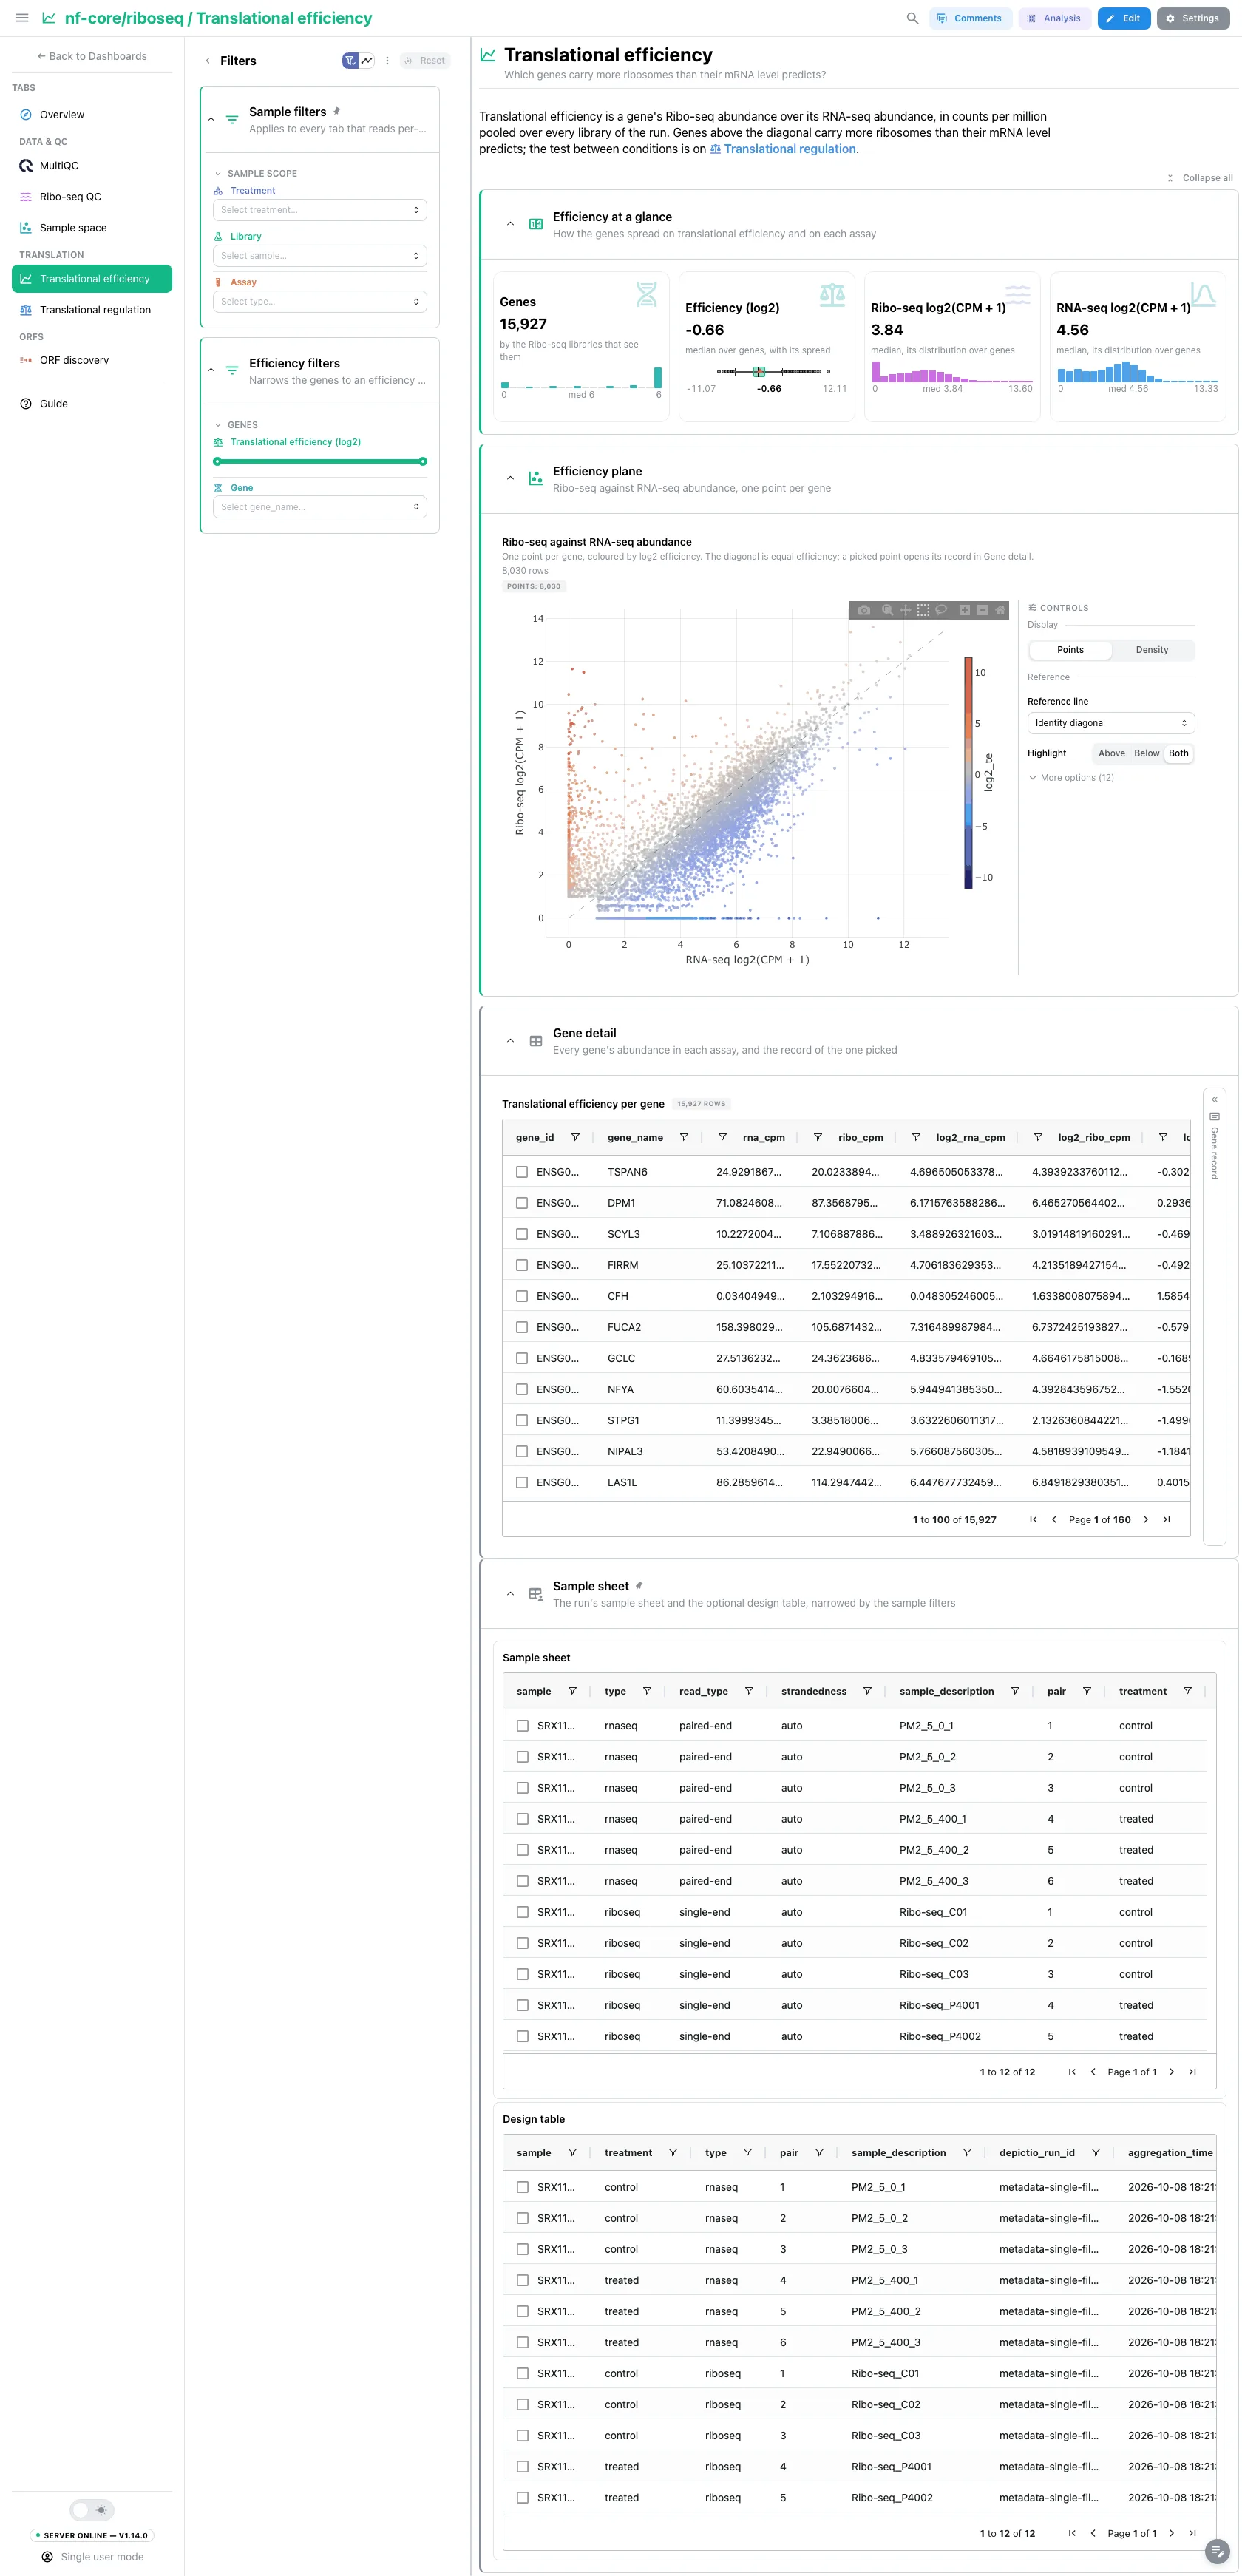
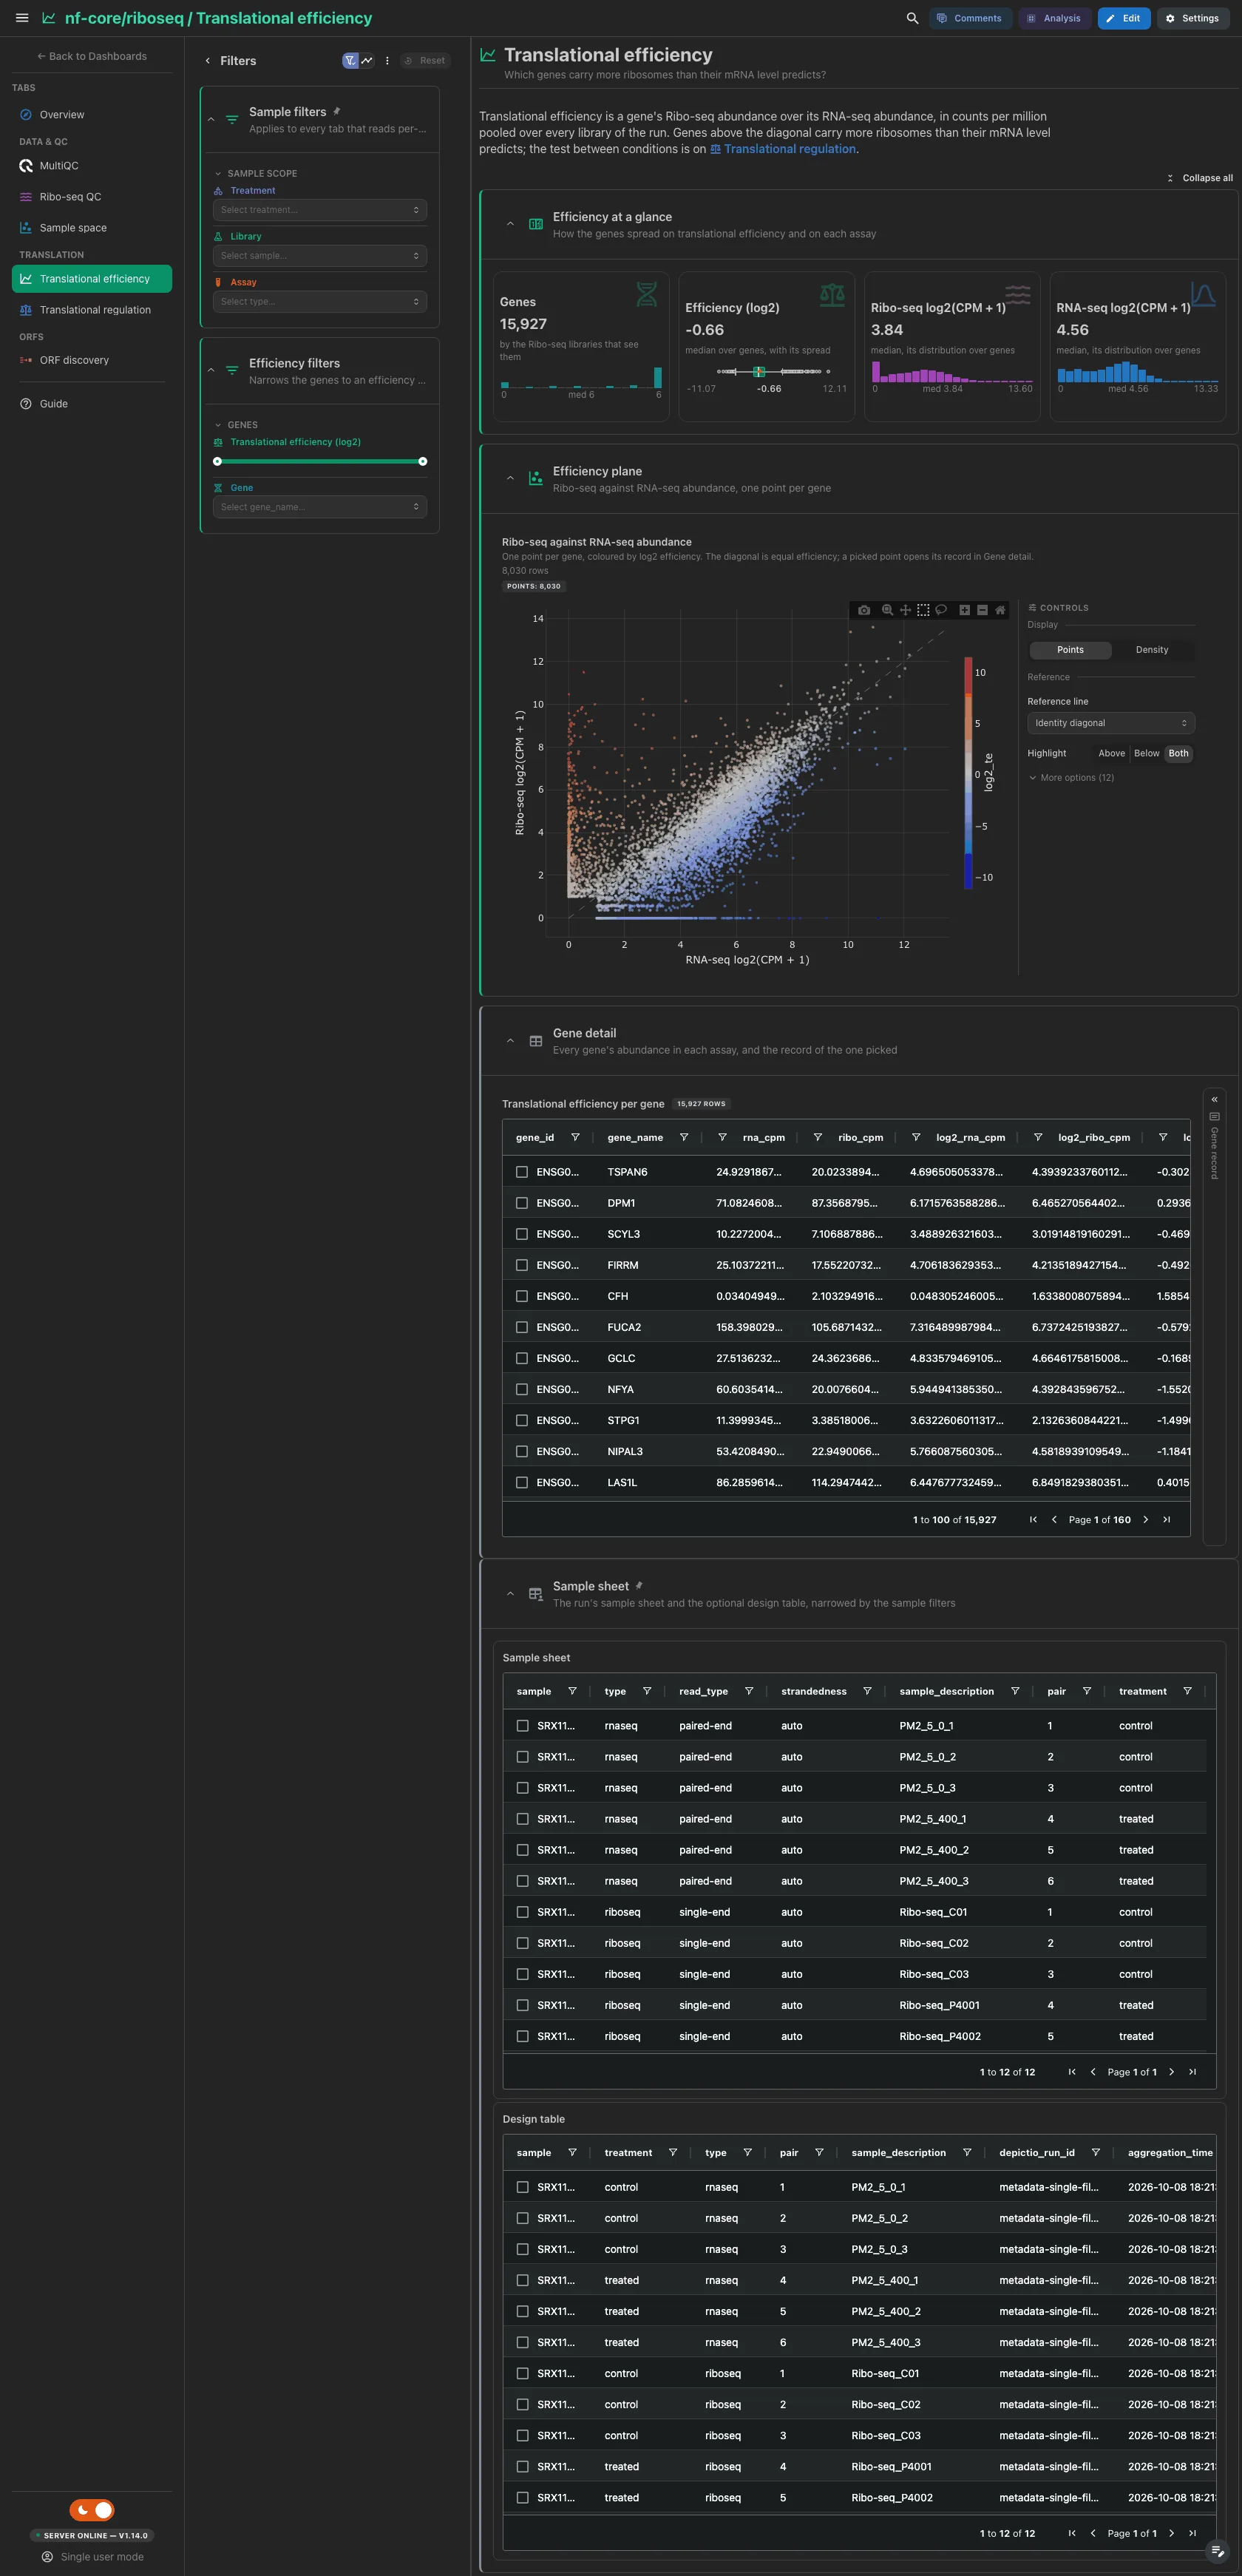
Translational efficiency is log2 of Ribo-seq CPM over RNA-seq CPM, computed by a template recipe from the in-frame P-site count matrix and pooled over every library of the run, so it needs no contrast. The genes both assays reach, the median log2 efficiency and the median Ribo-seq and RNA-seq abundance. Then the plane of Ribo-seq against RNA-seq abundance, one point per gene coloured by efficiency, with the diagonal of equal efficiency: genes above it carry more ribosomes than their mRNA level predicts. The plane has no point labels; hover names a gene. The per-gene table with the gene record beside it is collapsed.
Filters and components
Filters · a Translational efficiency (log2) range and Gene on
translational_efficiency.
| Section | What it holds |
|---|---|
| Efficiency at a glance | 4 cards |
| Efficiency plane | 1 advanced visualization |
| Gene detail (collapsed) | Translational efficiency per gene + a gene record card |
Translation · Which genes change translation between conditions, and through which mode?
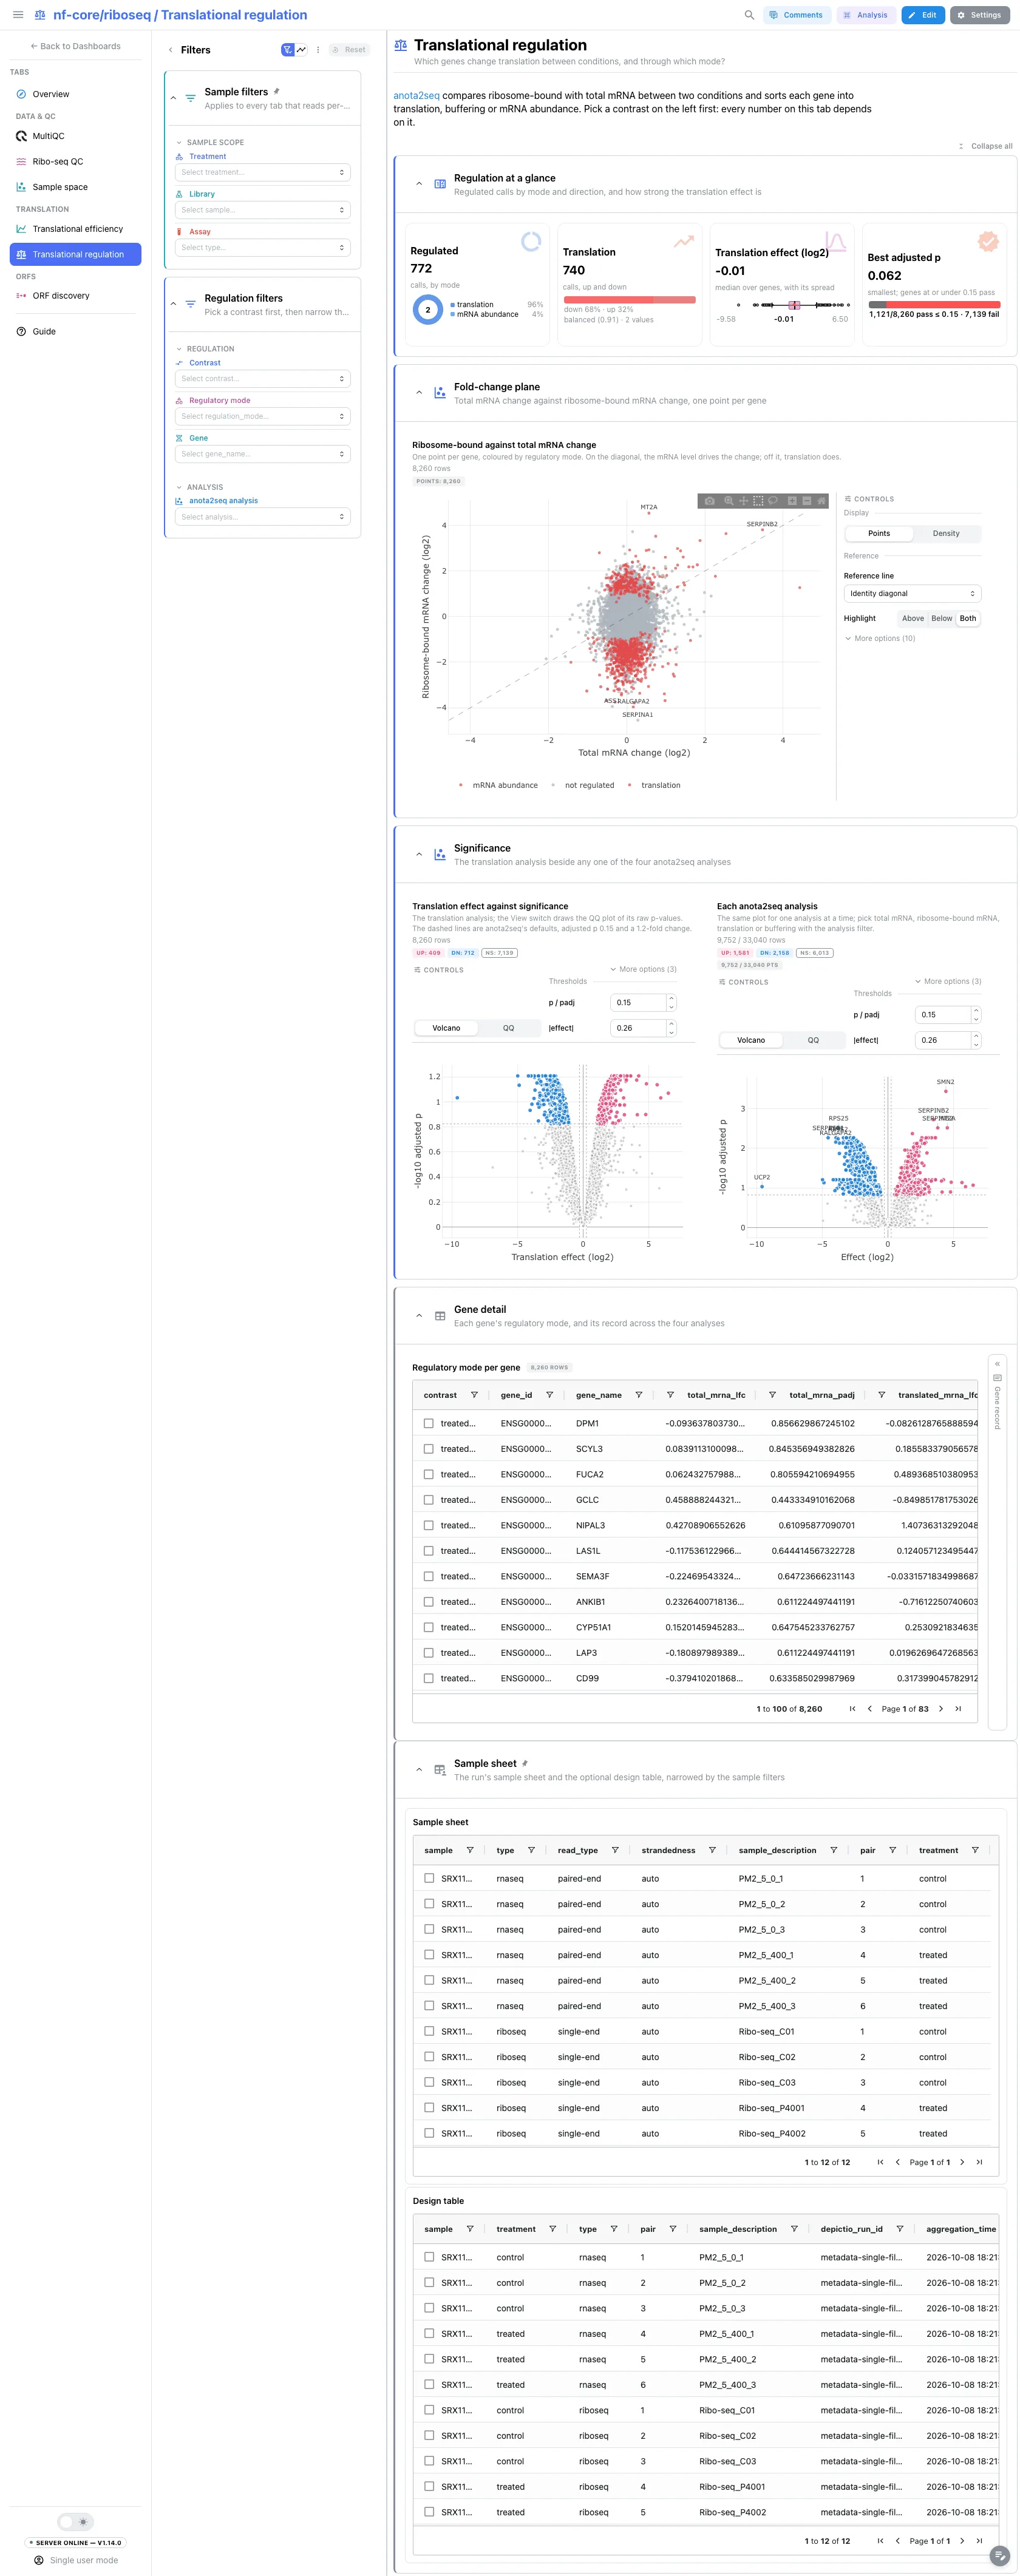
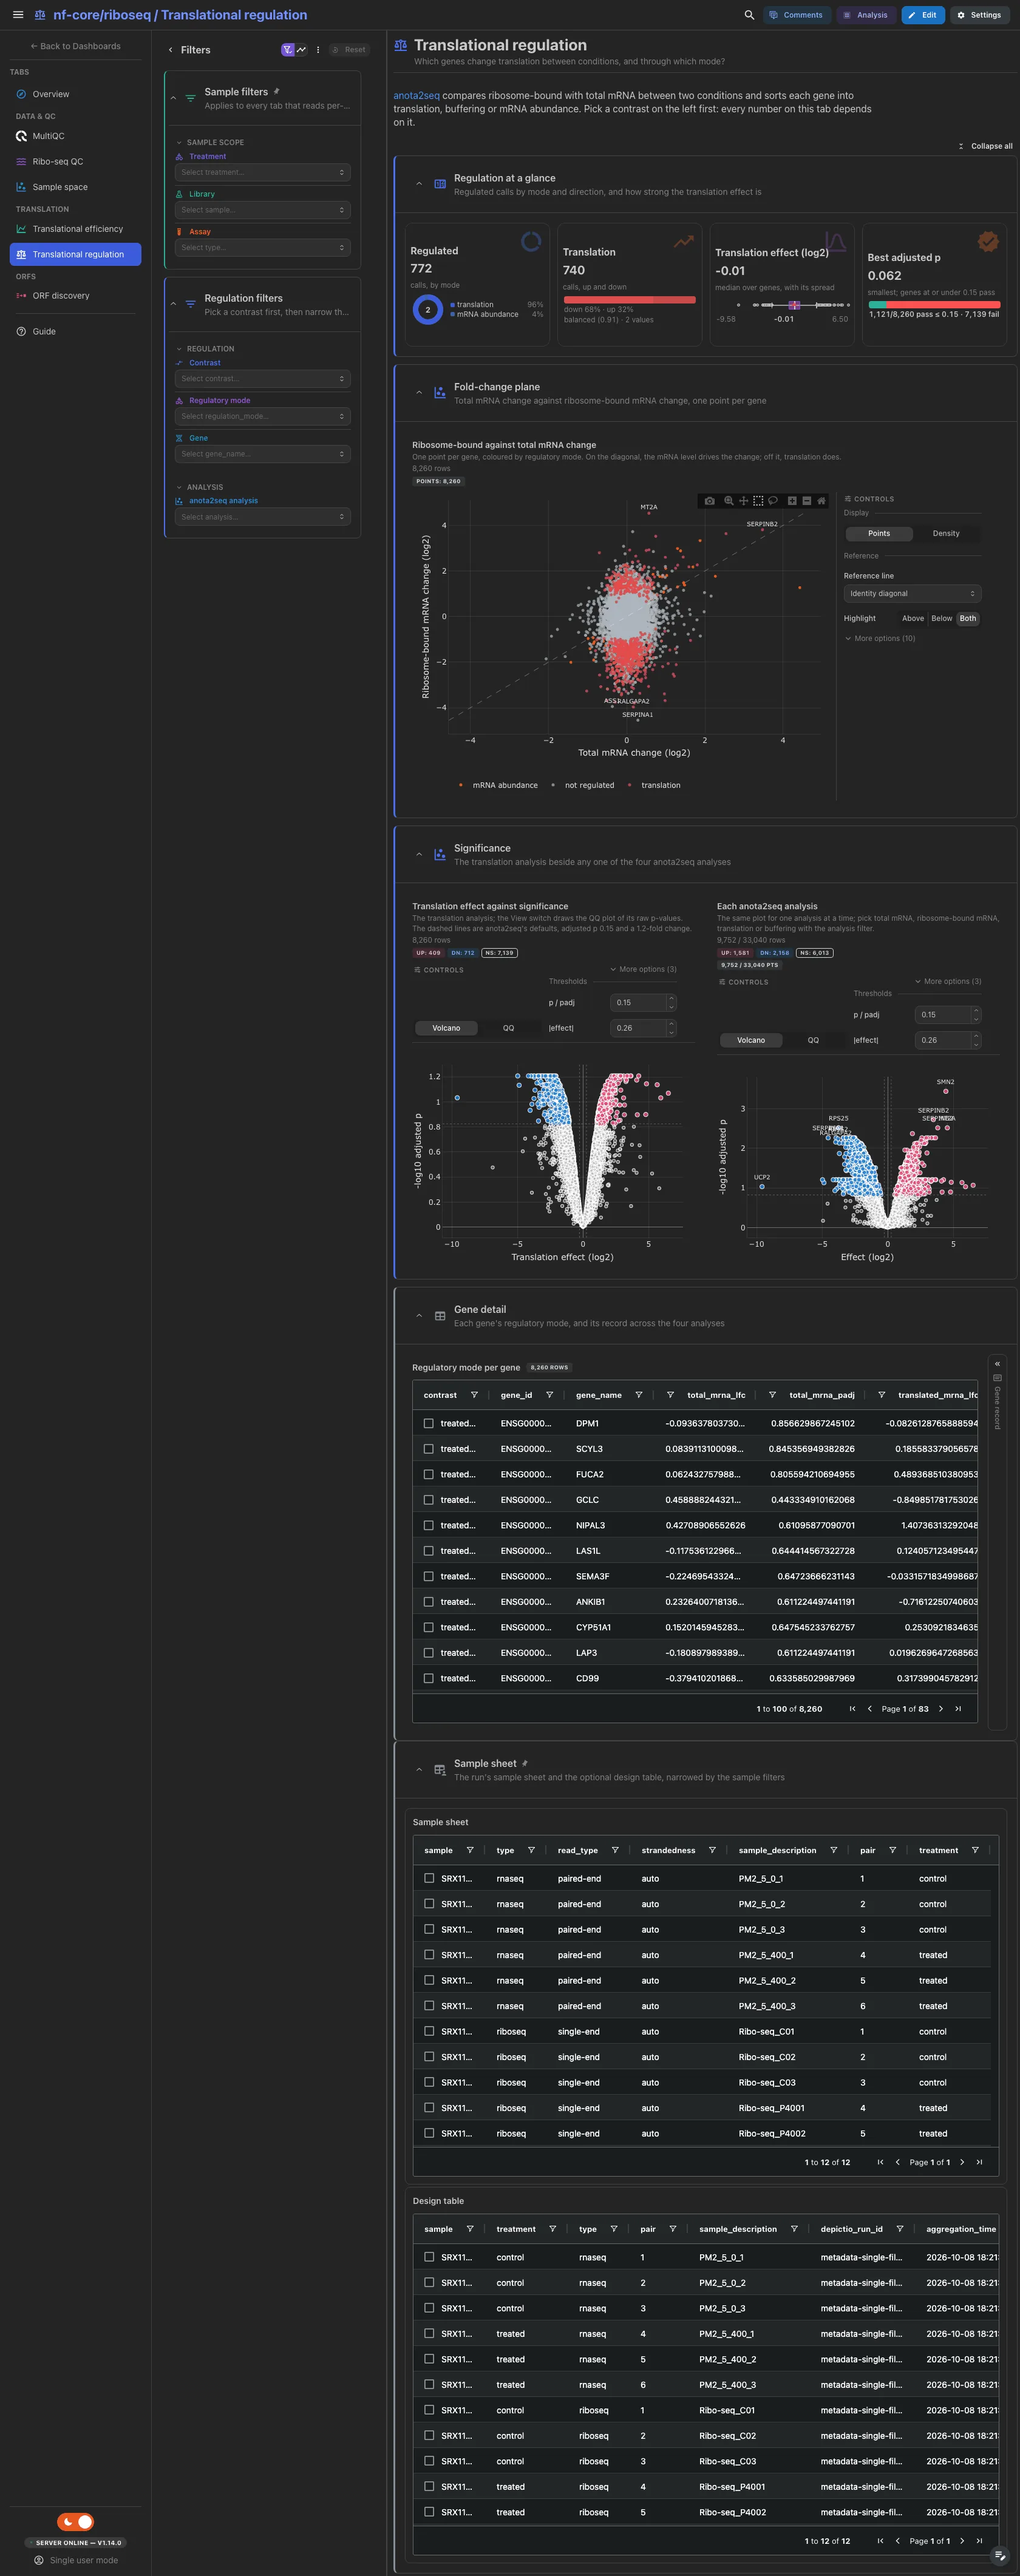
Pick a contrast first: every number on the tab depends on it. The regulated calls by mode, the translation calls by direction, the median translation effect and the smallest translation adjusted p against anota2seq's cut-off of 0.15. Then the fold-change plane, ribosome-bound against total mRNA change, coloured by mode: on the diagonal the mRNA level drives the change, off it translation does. Below, the translation volcano beside a volcano of any one of the four anota2seq analyses, each with a View switch to its QQ plot. The regulation table and its gene record, across the four analyses, are collapsed.
Filters and components
Filters · Contrast, Regulatory mode and Gene on
anota2seq_regulation, and an anota2seq analysis picker on
anota2seq_results for the second volcano.
| Section | What it holds |
|---|---|
| Regulation at a glance | 4 cards |
| Fold-change plane | 1 advanced visualization |
| Significance | 2 advanced visualizations |
| Gene detail (collapsed) | Regulatory mode per gene + a gene record card |
Only with contrasts
anota2seq runs only when the pipeline got --contrasts. Without it the
regulation collections are not written and the tab is dropped, with the
contrast filter, the regulation row and the fold-change figure on the
Overview.
ORFs · Which ORFs are translated, and do Ribo-TISH and RiboCode agree?
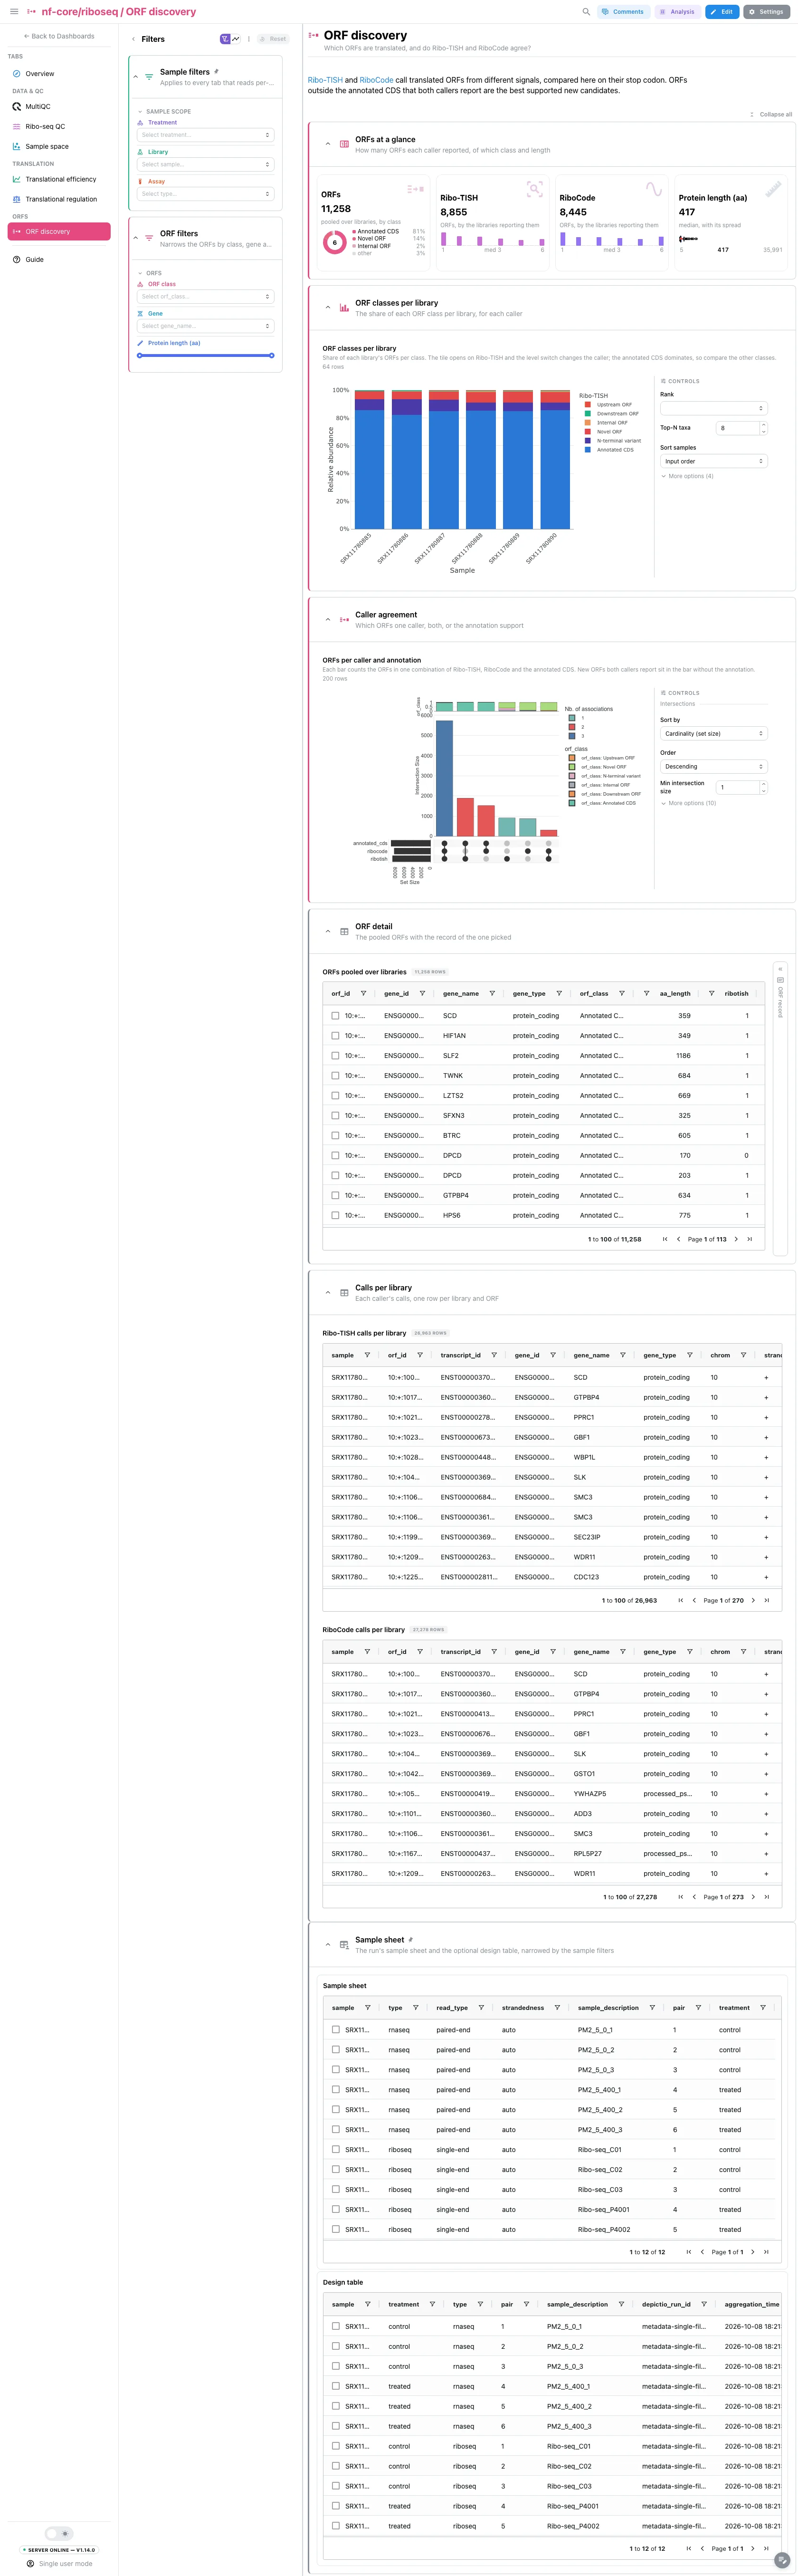
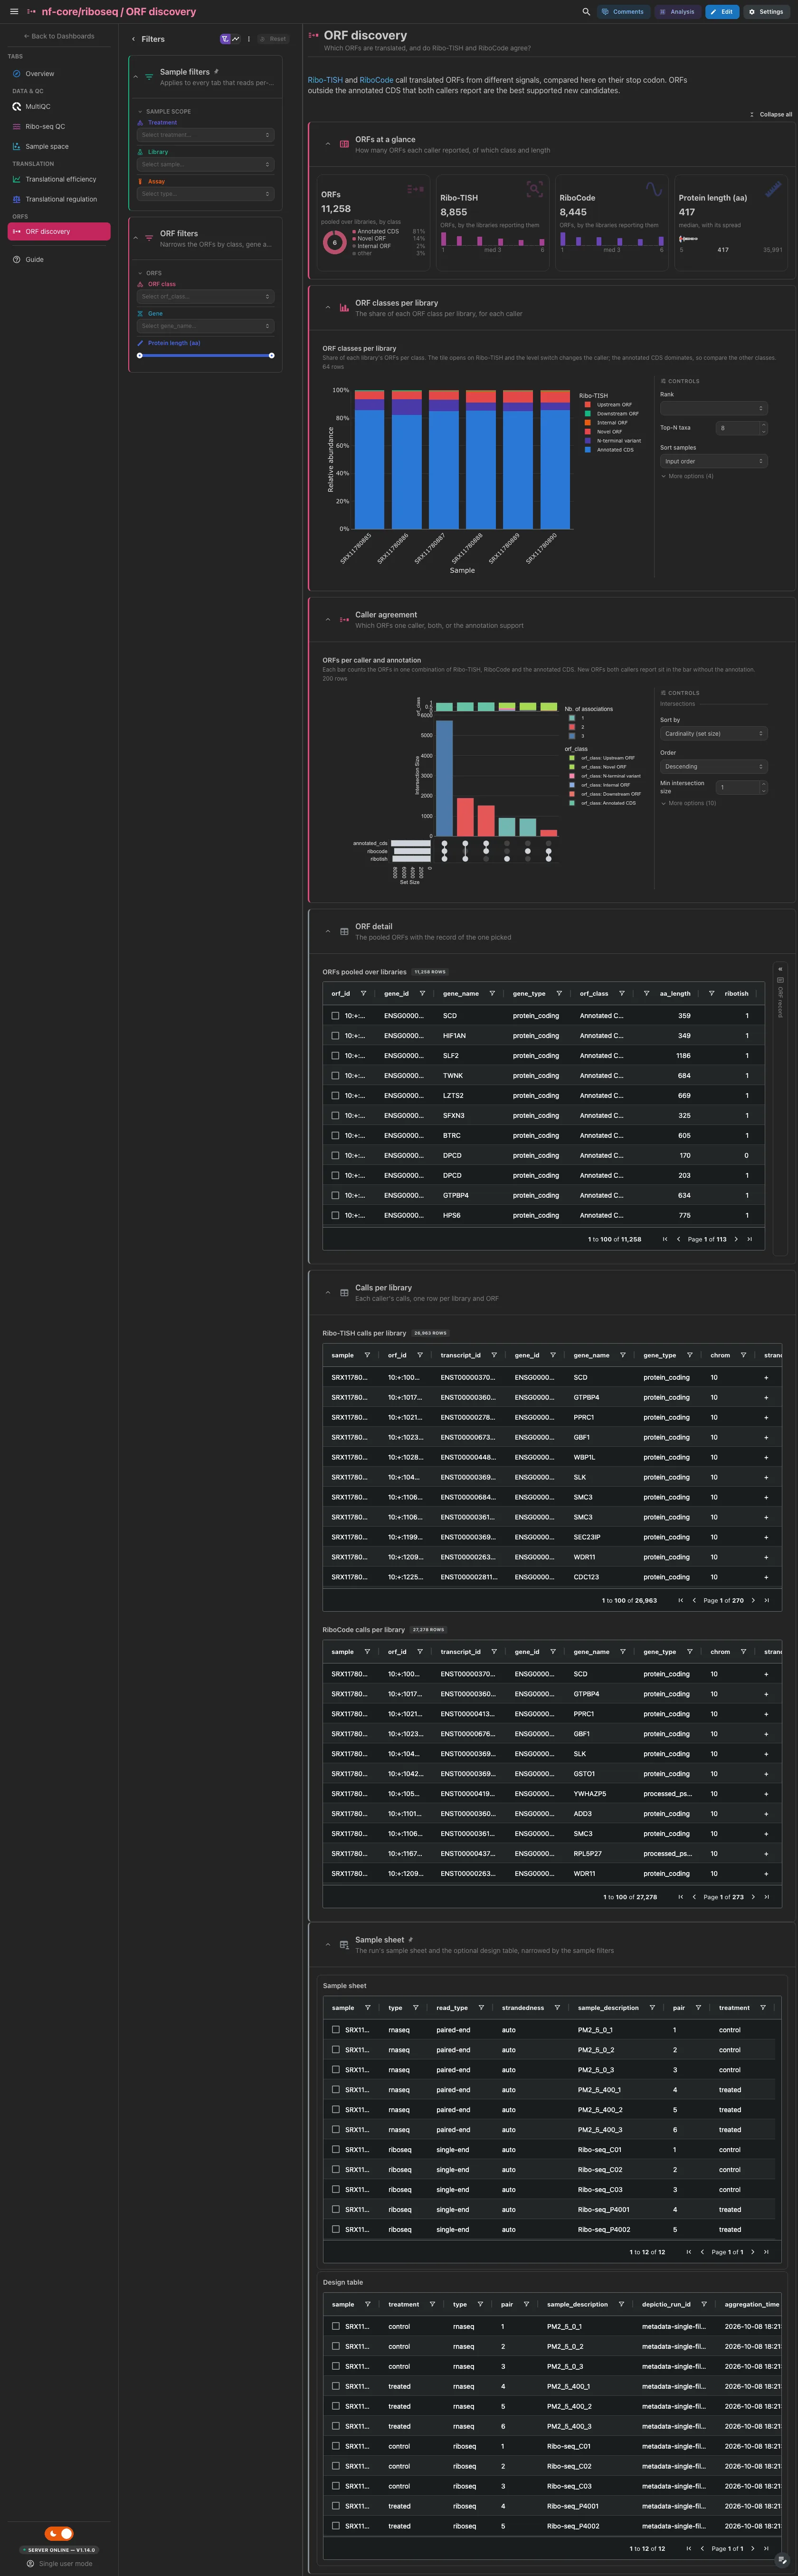
The pooled ORFs split by class, the ORFs Ribo-TISH and the ORFs RiboCode
report (each spread by the libraries reporting an ORF) and the median protein
length. Then the ORF classes per library, one caller at a time, and the UpSet
of Ribo-TISH, RiboCode and the annotated CDS. The callers are compared on the
genomic stop codon (chrom:strand:stop), so alternative start sites of one ORF
collapse onto one row; ORFs outside the annotated CDS that both callers report
are the best supported new candidates. The pooled table with the ORF record
beside it, then each caller's calls per library, are collapsed.
Filters and components
Filters · ORF class, Gene and a Protein length (aa) range on
orf_overlap.
| Section | What it holds |
|---|---|
| ORFs at a glance | 4 cards |
| ORF classes per library | 1 advanced visualization |
| Caller agreement | 1 advanced visualization |
| ORF detail (collapsed) | ORFs pooled over libraries + an ORF record card |
| Calls per library (collapsed) | Ribo-TISH calls per library, RiboCode calls per library |
One caller skipped
The four cards read the pooled table, so with --skip_ribotish or
--skip_ribocode the skipped caller keeps its card and reads 0, and only
its per-library table goes. The tab is dropped only when both callers are
skipped.
Tables select rows, and the phasing plane, the PCA and the efficiency and
fold-change planes select points: the sample sheet, the riboWaltz tables and the
phasing plane on sample, the design table on its id column, the PCA and its
table on sample_id, the efficiency and regulation planes and tables on
gene_id, the pooled ORF table on orf_id. A pick narrows the other tiles of its
collection and follows the project links to the collections downstream of it.
Each record card sits beside the table that drives it, in its collapsed section,
and waits for a picked row or point.
Running the pipeline
Depictio reads the output of nf-core/riboseq, it does not run the pipeline. Run the pipeline first, with a contrasts file if you want the Translational regulation tab:
nextflow run nf-core/riboseq -r 2.0.0 \
  --input samplesheet.csv \
  --contrasts contrasts.csv \
  --fasta genome.fa.gz --gtf genes.gtf.gz \
  --outdir results -profile docker
Then copy the sample sheet under input/ and point Depictio at the results:
mkdir -p results/input && cp samplesheet.csv results/input/
depictio ingest results/ --template nf-core/riboseq/latest \
  --var METADATA_FILE=design.tsv
See nf-co.re/riboseq/usage for full pipeline documentation.
Required data structure
Point depictio ingest at the directory holding the pipeline output. Depictio scans
recursively and matches on file name, so the aligner directory can differ from
the tree below.
<DATA_ROOT>/
├── input/
│   └── samplesheet.csv                          # the hub: sample, strandedness, type, design columns
├── pipeline_info/
│   ├── params_*.json
│   └── *software*versions*.yml
├── multiqc/star/multiqc_report_data/
│   └── multiqc.parquet                          # or multiqc/multiqc_data/
├── quantification/
│   ├── salmon/salmon.merged.gene_{counts,tpm}.tsv
│   └── inframe_psite/gene_counts.tsv            # optional, translational efficiency
├── psites/ribowaltz/ribowaltz_qc/*.tsv          # optional, --skip_ribowaltz drops it
├── translational_efficiency/anota2seq/
│   └── *.anota2seq.results.tsv                  # optional, needs --contrasts
└── orf_predictions/
    ├── ribotish/*_pred.txt                      # optional, --skip_ribotish drops it
    └── ribocode/*_collapsed.txt                 # optional, --skip_ribocode drops it
METADATA_FILE, when given, is read from wherever it points; its id column is
METADATA_ID_COL (default: the first column) and the group filter reads
GROUP_COL (default: the first annotation column). BAM files, bigWigs and the
RiboCode P-site stores are not read.
Validation runs
The template was validated against the AWS megatest of the 2.0.0 release
(results-11d66a3b8ae1f41f9c385af36bd431c35bf015ab), paired Ribo-seq and RNA-seq
libraries from a two-condition design with one contrast, and the screenshots
above come from it. The sample sheet, contrasts and a design table are not part
of the published run: they are vendored with the template under input/.
megatest.yaml lists the tables-only subset the template needs:
bash depictio/projects/nf-core/riboseq/2.0.0/download_test_data.sh /tmp/riboseq_test
mkdir -p /tmp/riboseq_test/input
cp depictio/projects/nf-core/riboseq/2.0.0/input/*.*sv /tmp/riboseq_test/input/
depictio ingest /tmp/riboseq_test --template nf-core/riboseq/latest \
  --var METADATA_FILE=/tmp/riboseq_test/input/metadata.tsv
Do not pass --project when ingesting: the dashboard is attached to the
project by name, so renaming it breaks a later depictio dashboard import.
Re-ingesting accumulates dashboards, so delete the project before repeating a run.
Additional resources
- nf-co.re/riboseq: official pipeline documentation
- nf-co.re/riboseq/2.0.0/results: AWS test results
- Template System Reference: YAML format, variables, conditionals
- Recipes: how to read, test, and write recipes
Authorship
 weber8thomas
Reviewing a template on your own data, or taking over a role here, is a contribution in itself: the contributing guide says what each one involves.