

The genomeassembler template follows an nf-core/genomeassembler run from its raw assemblies through polishing and scaffolding, one tab per question, in three groups:
- Overview: the run in four key figures, live findings and four figures, each linked to the tab that explains it
- Data & QC: which samples reached assembly QC and at which stages, and the genome the reads describe before any assembly, from the k-mer spectrum and GenomeScope
- Assemblies: which assembly is best across contiguity, accuracy and genes, and what each polishing and scaffolding step adds to a sample's assembly
- Quality: Nx curves and QUAST for contiguity, Merqury QV, k-mer completeness and copy number for accuracy, and BUSCO for gene completeness
The persistent Sample filters (the design group, then the sample id) sit in the
left panel and narrow every per-assembly tab through the samplesheet links;
Genome profile reads per read set and has its own Read set filter.
No MultiQC report, one row per assessed assembly
nf-core/genomeassembler writes no MultiQC report, so there is no MultiQC tab:
every tile reads the QC tools' own files. The unit of every tile is the
assessed assembly, which every QC tool names <sample>_<stage>: the raw
assembly, each polishing step (medaka, dorado, pilon) and each scaffolder
(LINKS, LongStitch, RagTag). A sample whose assembly never reached QC stays
in the sample sheet as No assembly QC and appears in no other tile.
Quick start
depictio ingest /path/to/genomeassembler_results \
  --template nf-core/genomeassembler/latest \
  --var METADATA_FILE=/path/to/samplesheet.csv \
  --var GROUP_COL=strategy
The pipeline publishes no copy of its samplesheet, and the samplesheet is the
design every filter reads. METADATA_FILE defaults to input/samplesheet.csv
under the data root, so copying the sheet there is enough. GROUP_COL
(default strategy) picks the column the design filter and the colours group
on: assembler, polish, group or any column you added work too, since
every per-assembly table carries the samplesheet columns through.
depictio config nextflow --install     # once per machine
nextflow run nf-core/genomeassembler -r 2.0.0 -profile docker --outdir results
No depictio ingest, and no template named: the pipeline ingests its own
output directory when it finishes and resolves this template from its own
manifest. See Nextflow trigger.
Reference
The template reads, per assessed assembly, the samtools idxstats of the reads
mapped back (every sequence and its length, from which N50, L50, auN and the Nx
curve are computed), Merqury's QV, completeness, per-sequence QV and copy-number
spectrum, the BUSCO batch summary and QUAST's transposed report; and per read
set, the jellyfish histogram and GenomeScope's summary. Every tool collection is
optional, so a run that skipped a tool, or an assembly a tool never reached,
prunes that tool's tiles instead of breaking the import, and a tab left without
data is dropped. 26 of its 57 tiles carry a use: catalog reference, so a tile
says where its panel comes from.
Self-adapting layout
The dashboard adapts to whatever the run actually produced: components bound to pruned or unparsed data collections are hidden, tabs left with no real visualizations are dropped entirely, and the remaining components are re-packed so there are no empty rows.
Template variables
Variables you provide when running the template: DATA_ROOT is the results directory given to depictio ingest, the others are set with --var NAME=value:
| Variable | Required | Description |
|---|---|---|
DATA_ROOT |
✓ | Root directory containing genomeassembler output: one directory per sample (and per read group) with assembly/, polish/, scaffold/, QC/ and reads/, plus pipeline_info/. |
METADATA_FILE |
— | The samplesheet the run was started with (the pipeline publishes no copy of it). Defaults to input/samplesheet.csv under DATA_ROOT. |
METADATA_ID_COL |
— | Samplesheet column holding the sample name every output directory is named after. |
GROUP_COL |
— | Samplesheet column the design filters and colours group on (strategy, assembler, polish, group or any column you added). |
GROUP_COL_DISPLAY |
— | Display label for GROUP_COL in titles. |
Data collections
24 data collections — 4 required 20 optional · 10 direct 14 derived.
Origin tells you whether a collection is real pipeline data or a reshape of it: direct = a pipeline output (scanned, or a recipe that reads raw files); derived = a recipe that reshapes one or more direct collections into the layout a visualization needs (no new measurement). Reads shows what produces it: a recipe .py transform, whose name links to its source on GitHub, or a raw file scanned off disk. (A direct collection can still have a recipe — one that merely parses/cleans the raw file; derived means the recipe reshapes another collection.)
| Tag | Origin | Type | Reads | Status |
|---|---|---|---|---|
samplesheet |
direct | Table | file {METADATA_FILE} |
required |
samtools_idxstats_raw |
direct | Table | file ^.+.idxstats$ |
optional |
merqury_qv_raw |
direct | Table | file [.]+.qv$ |
optional |
merqury_completeness_raw |
direct | Table | file ^.+.completeness.stats$ |
optional |
merqury_sequence_qv_raw |
direct | Table | file [.]+..+.qv$ |
optional |
merqury_spectra_cn_raw |
direct | Table | file ^.+.spectra-cn.hist$ |
optional |
busco_batch_raw |
direct | Table | file ^.+.batch_summary.txt$ |
optional |
quast_assembly_raw |
direct | Table | file ^transposed_report.tsv$ |
optional |
genomescope_raw |
direct | Table | file ^.+_genomescope.txt$ |
optional |
jellyfish_histo_raw |
direct | Table | file ^.+_hist.tsv$ |
optional |
merqury_assembly_qv |
derived | Table | recipe merqury/assembly_qv.py |
optional |
merqury_sequence_qv |
derived | Table | recipe merqury/sequence_qv.py |
optional |
merqury_copy_number |
derived | Table | recipe merqury/copy_number_composition.py |
optional |
busco_batch_summary |
derived | Table | recipe busco/batch_summary.py |
optional |
busco_composition |
derived | Table | recipe busco/composition.py |
optional |
quast_assembly_report |
derived | Table | recipe quast/assembly_report.py |
optional |
quast_length_ladder |
derived | Table | recipe quast/length_ladder.py |
optional |
quast_reference_report |
derived | Table | recipe quast/reference_report.py |
optional |
genomescope_summary |
derived | Table | recipe genomescope/summary.py |
optional |
jellyfish_histogram |
derived | Table | recipe jellyfish/histogram.py |
optional |
assemblies |
derived | Table | recipe nf-core/genomeassembler/assemblies.py |
required |
nx_curve |
derived | Table | recipe nf-core/genomeassembler/nx_curve.py |
optional |
stage_steps |
derived | Table | recipe nf-core/genomeassembler/stage_steps.py |
required |
sample_status |
derived | Table | recipe nf-core/genomeassembler/sample_status.py |
required |
Cross-DC links
18 links — selecting a value in the source collection filters the target. The join column is shown after the source.
| Source · column | Target | Filters | |
|---|---|---|---|
samplesheet · {METADATA_ID_COL} |
→ | assemblies |
Narrow the per-assembly table to the samples picked in the sample filters |
samplesheet · {METADATA_ID_COL} |
→ | sample_status |
Narrow the sample status table to the picked samples |
samplesheet · {METADATA_ID_COL} |
→ | stage_steps |
Narrow the stage routes to the picked samples |
samplesheet · {METADATA_ID_COL} |
→ | nx_curve |
Narrow the Nx curves to the picked samples |
samplesheet · {METADATA_ID_COL} |
→ | merqury_assembly_qv |
Narrow the Merqury QV table to the picked samples' assemblies |
samplesheet · {METADATA_ID_COL} |
→ | merqury_sequence_qv |
Narrow the per-sequence QV table to the picked samples' assemblies |
samplesheet · {METADATA_ID_COL} |
→ | merqury_copy_number |
Narrow the copy-number composition to the picked samples' assemblies |
samplesheet · {METADATA_ID_COL} |
→ | busco_batch_summary |
Narrow the BUSCO table to the picked samples' assemblies |
samplesheet · {METADATA_ID_COL} |
→ | busco_composition |
Narrow the BUSCO composition bars to the picked samples' assemblies |
samplesheet · {METADATA_ID_COL} |
→ | quast_reference_report |
Narrow the QUAST reference table to the picked samples' assemblies |
assemblies · assembly_id |
→ | nx_curve |
Carry the assemblies picked in the per-assembly filters to the Nx curves |
assemblies · assembly_id |
→ | busco_composition |
Carry the assemblies picked in the per-assembly filters to the BUSCO bars |
assemblies · assembly_id |
→ | merqury_copy_number |
Carry the assemblies picked in the per-assembly filters to the copy-number bars |
assemblies · assembly_id |
→ | merqury_sequence_qv |
Carry the assemblies picked in the per-assembly filters to the per-sequence QV |
assemblies · sample |
→ | stage_steps |
Carry the samples of the picked assemblies to the stage routes |
assemblies · assembly_id |
→ | merqury_assembly_qv |
Carry the assemblies picked in the per-assembly filters to the Merqury QV tiles |
assemblies · assembly_id |
→ | busco_batch_summary |
Carry the assemblies picked in the per-assembly filters to the BUSCO tiles |
genomescope_summary · read_set |
→ | jellyfish_histogram |
Carry the read sets picked in the genome profile filters to the k-mer spectrum |
Recipes
Each recipe reshapes raw pipeline output into a tidy table. The name links to its source; Output lists the validated OUTPUT_SCHEMA columns.
| Recipe | Transforms | Output |
|---|---|---|
busco/batch_summary.py |
One row per assessed assembly, from BUSCO's batch_summary.txt. |
assembly_id, input_file, lineage, complete_pct, single_pct, duplicated_pct, fragmented_pct, missing_pct, n_markers, stop_codon_pct, scaffold_n50, contig_n50, percent_gaps, n_scaffolds |
busco/composition.py |
BUSCO scores as four classes per assembly, for a composition bar. | assembly_id, lineage, busco_class, rank, class_order, percent |
genomescope/summary.py |
One row per read set, from GenomeScope's summary table. | read_set, genomescope_version, k, ploidy, heterozygosity_min, heterozygosity_max, haploid_length_min, haploid_length_max, repeat_length_min, repeat_length_max, unique_length_min, unique_length_max, repeat_fraction, model_fit_min, model_fit_max, read_error_rate_min, read_error_rate_max |
jellyfish/histogram.py |
The read k-mer spectrum of each read set, from jellyfish histo output. |
read_set, multiplicity, kmers, kmer_mass, peak_multiplicity |
merqury/assembly_qv.py |
One row per assembly: Merqury's QV joined to its k-mer completeness. | assembly_id, merqury_name, asm_only_kmers, total_kmers, qv, error_rate, solid_kmers_assembly, solid_kmers_reads, kmer_completeness |
merqury/copy_number_composition.py |
Share of solid read k-mers by copy number in the assembly, per assembly. | assembly_id, copy_class, rank, class_order, solid_kmers, percent, error_cutoff |
merqury/sequence_qv.py |
One row per assembled sequence, from Merqury's per-sequence QV files. | assembly_id, sequence, asm_only_kmers, total_kmers, qv, error_rate, error_free |
nf-core/genomeassembler/assemblies.py |
One row per assessed assembly: every QC tool of nf-core/genomeassembler, joined. | assembly_id, sample, stage, stage_class, stage_rank, assembler_used, scaffolders, n_sequences, total_length, largest_sequence, n50, l50, n90, l90, aun, qv, error_rate, kmer_completeness, busco_lineage, busco_complete, busco_single, busco_duplicated, busco_fragmented, busco_missing, genome_fraction, misassemblies, mismatches_per_100kbp, nga50, qc_tools, n_qc_tools |
nf-core/genomeassembler/nx_curve.py |
Nx curve of every assessed assembly, from the lengths samtools idxstats lists. |
assembly_id, sample, stage, nx, sequence_length, n_sequences, total_length |
nf-core/genomeassembler/sample_status.py |
One row per samplesheet sample: its design and what the QC tools found. | sample, assembler_used, scaffolders, n_assemblies_assessed, stages_assessed, best_qv, best_busco_complete, best_n50, qc_status |
nf-core/genomeassembler/stage_steps.py |
Each sample's route through the pipeline's stages, one row per step. | route, assembly_id, sample, stage, stage_rank, final_stage, qv, qv_gain, n50, n50_fold, total_length, kmer_completeness, busco_complete |
quast/assembly_report.py |
One row per assembly, from QUAST's transposed report. | assembly_id, assembler, sample, n_contigs, total_length, largest_contig, n50, n75, l50, l75, gc_percent, ns_per_100_kbp, predicted_rrna_genes, contigs_over_1kb, length_over_1kb |
quast/length_ladder.py |
The contig-length ladder of each assembly, one row per length threshold. | assembly_id, assembler, sample, min_contig_length, n_contigs, total_length, length_fraction |
quast/reference_report.py |
The reference-based columns of a QUAST report, one row per assembly. | assembly_id, report_id, reference_length, genome_fraction, duplication_ratio, misassemblies, misassembled_contigs, misassembled_length, local_misassemblies, mismatches_per_100kbp, indels_per_100kbp, unaligned_length, largest_alignment, total_aligned_length, ng50, nga50, lga50 |
Dashboard tabs
One dashboard: the Overview, then seven child tabs in three groups, read as a funnel from the samples and the genome their reads describe to the contiguity, accuracy and gene completeness of every assembly. Each tab below carries the same icon and colour the dashboard gives it, so the page and the app read alike.
| Group | Tabs |
|---|---|
| Data & QC | Samples, Genome profile |
| Assemblies | Best assembly, Stages |
| Quality | Contiguity, Accuracy, Gene completeness |
Each child tab opens with a short intro and a strip of four cards, then at most
three open sections; tables, details and comparisons follow, collapsed. The
pipeline writes no MultiQC report, so there is no MultiQC tab, and the unit of
every tile is the assessed assembly, <sample>_<stage>: one sample contributes
several rows. The persistent Sample filters (the group, then the sample id, on
the samplesheet) sit in the left panel and narrow every per-assembly tab through
the samplesheet links; Genome profile reads per read set, which no sample link
reaches. The Sample sheet (one row per samplesheet sample, with how far its
assembly QC got) is pinned, collapsed, to the bottom of every child tab. Every QC
collection is optional: a run without Merqury, BUSCO or k-mer profiling loses the
Accuracy, Gene completeness or Genome profile tab, with the Overview rows and
highlights that pointed at it.
De novo assemblies scored for contiguity, k-mer accuracy and gene completeness.
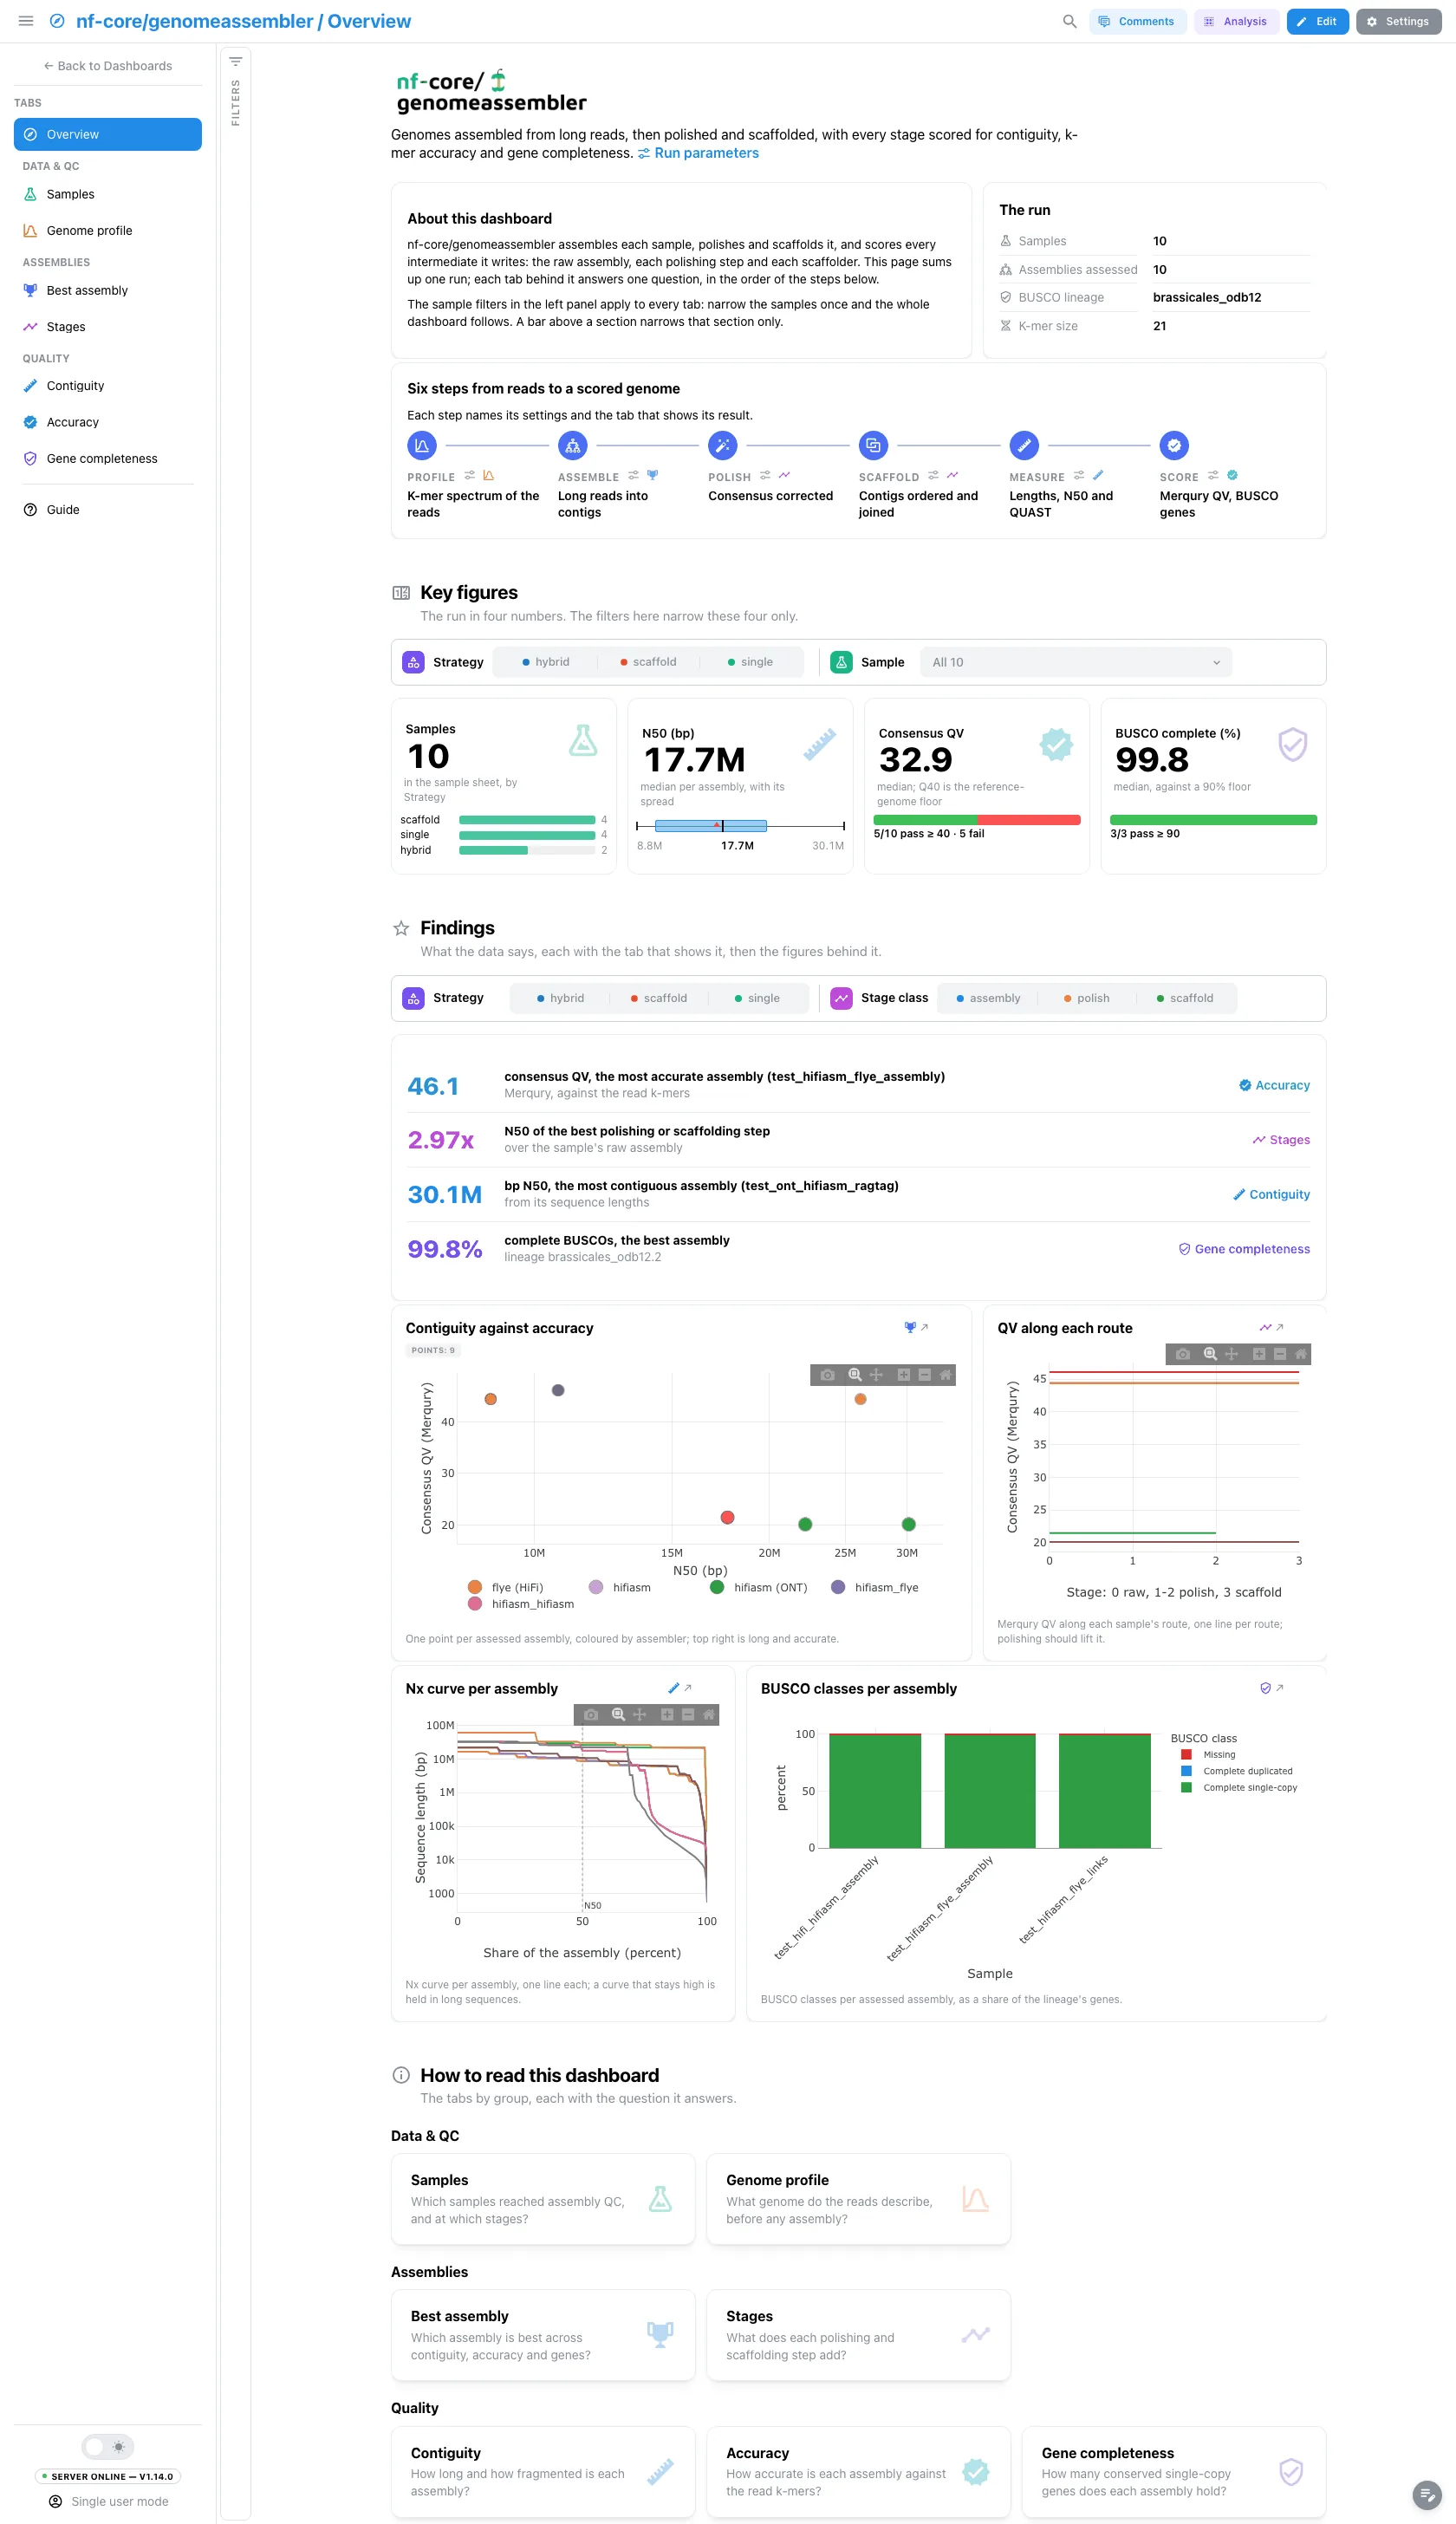
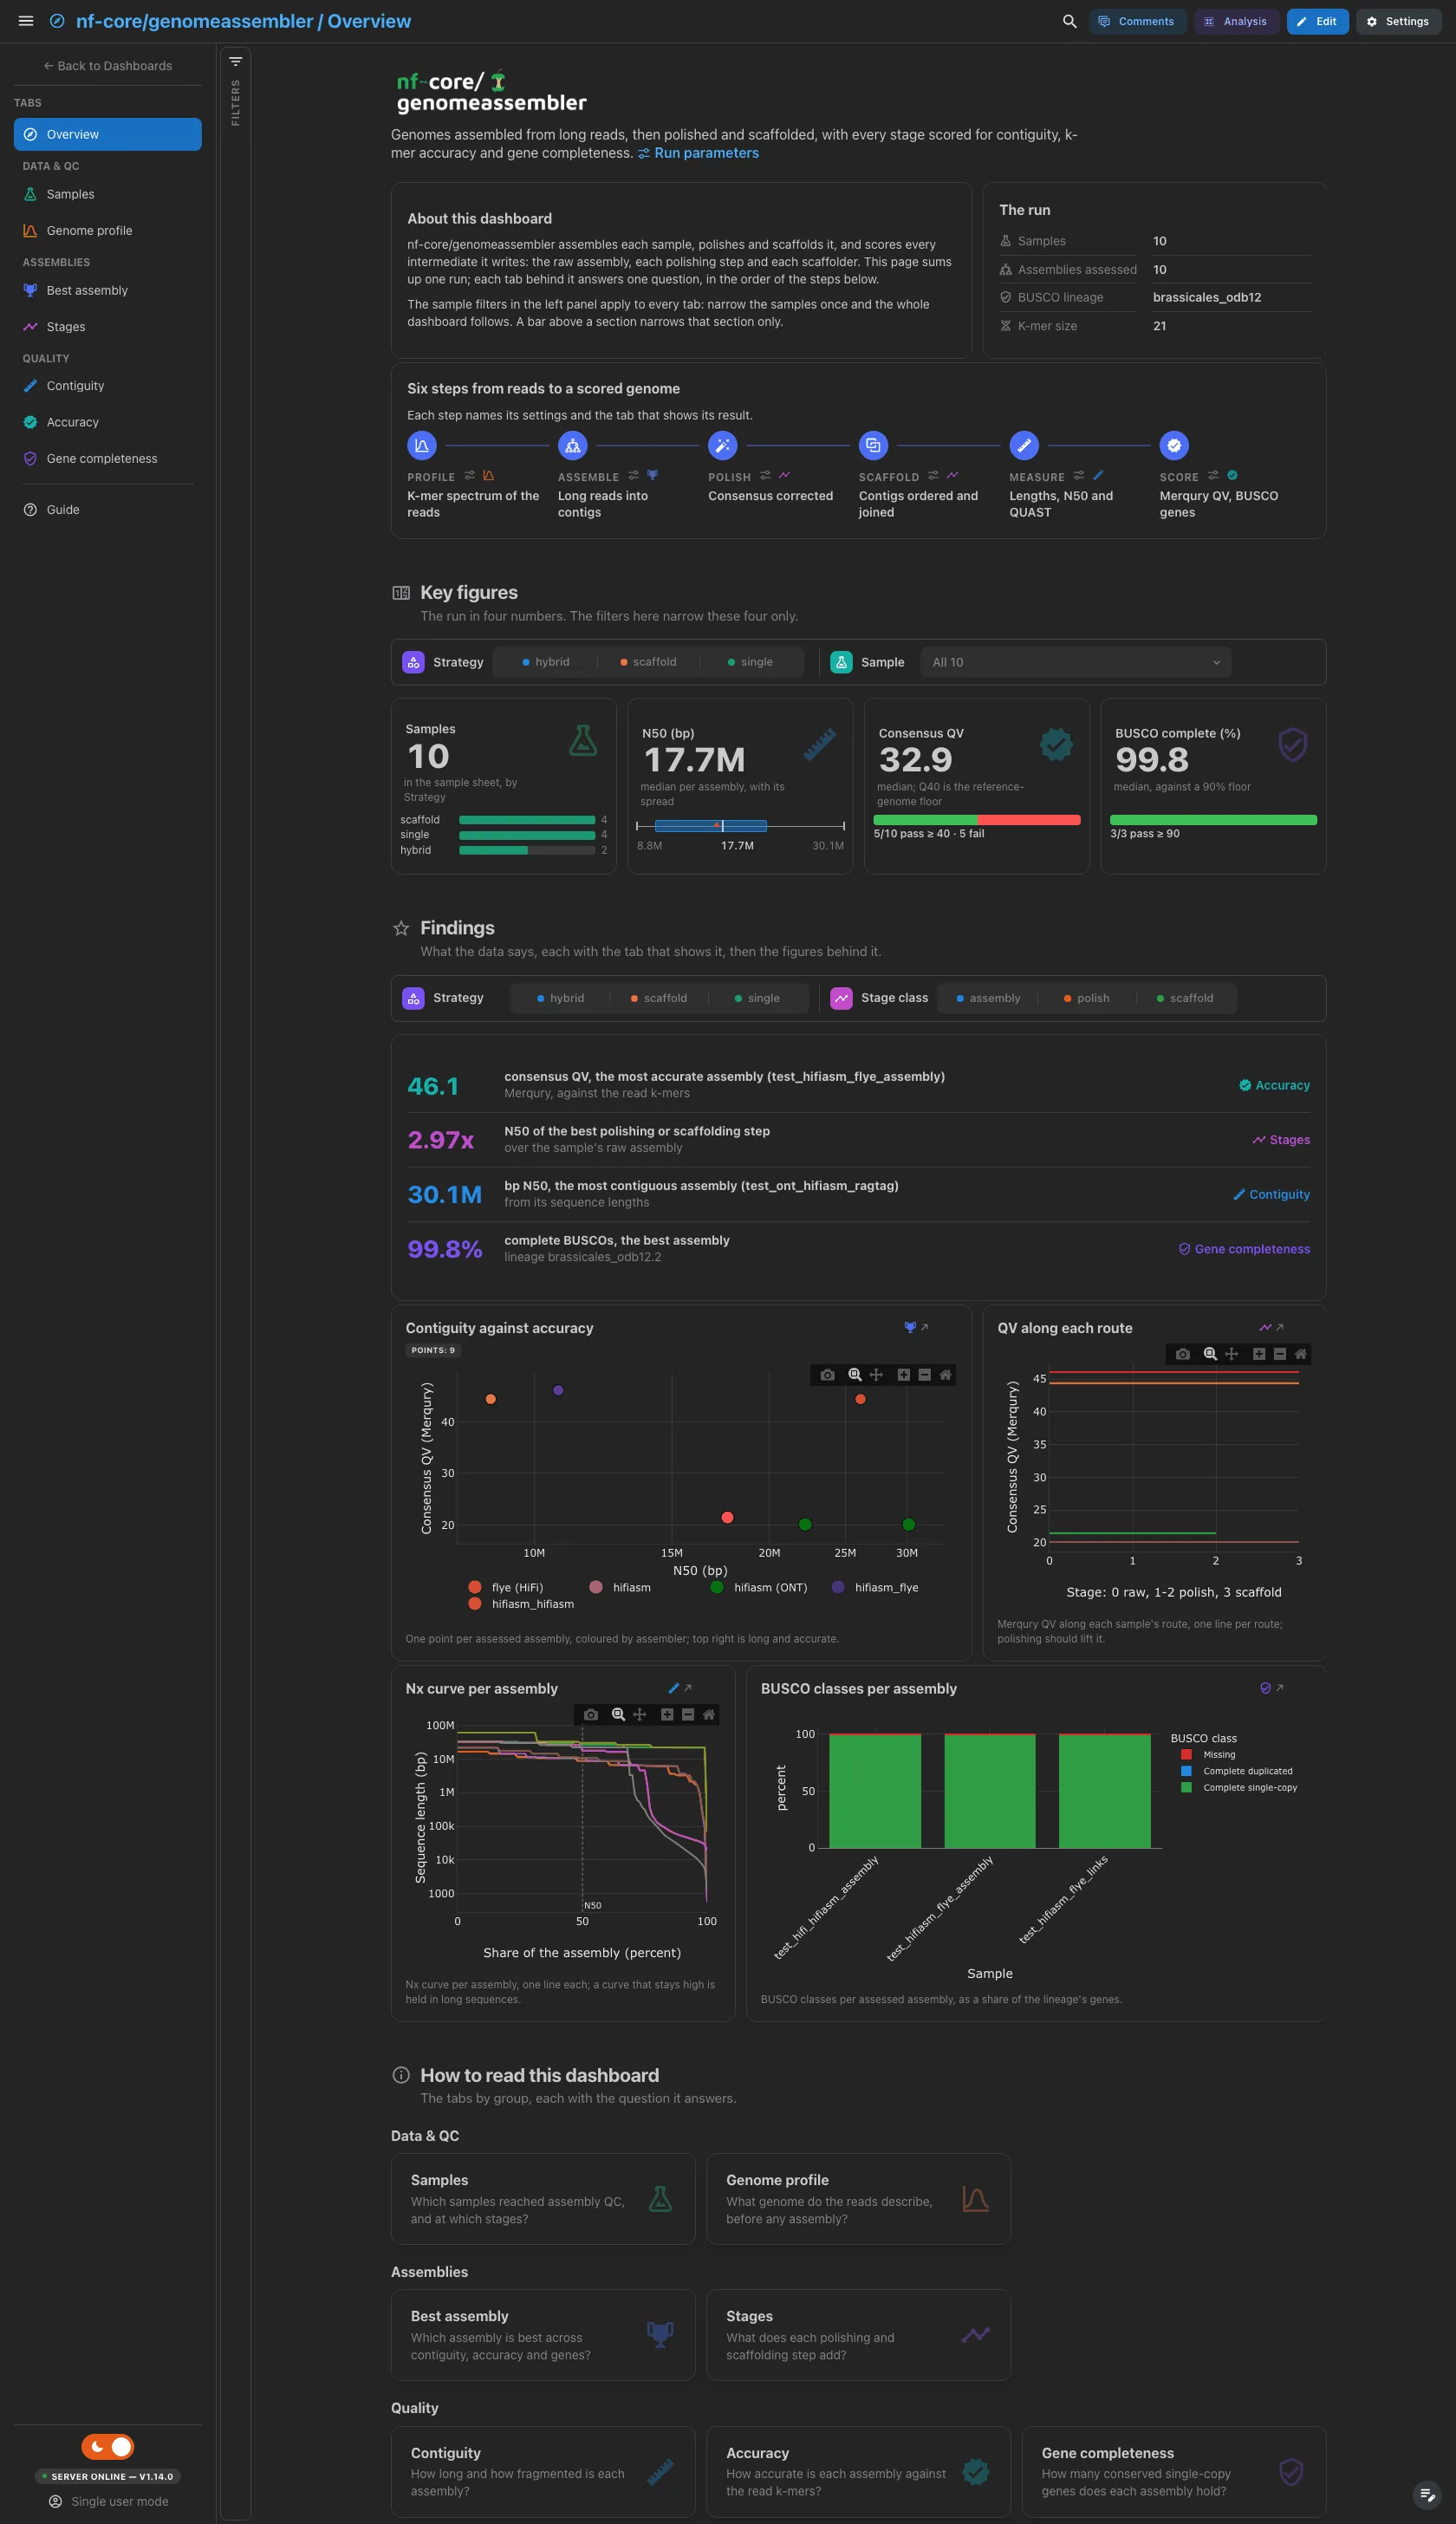
A short hero links the run parameters. About this dashboard says how the two
filter levels work, The run lists the samples, the assessed assemblies, the
BUSCO lineage and the k-mer size, and Pipeline walks the six steps from reads
to a scored genome (profile, assemble, polish, scaffold, measure, score), each
linked to the parameters that drive it and to its tab. The QV card reads
against QV 40, the Earth BioGenome Project floor. The three assembly cards read
assemblies, which every route writes, so a QC tool the run skipped leaves a
dash rather than a gap in the row. The findings are live values: they follow
the filters.
Filters and components
Filters · the left panel starts collapsed. Key figures has its own filter bar (the group and the sample id), and Findings another (the group and the stage class): each narrows its own section only.
| Section | What it holds |
|---|---|
| Top | Hero, About this dashboard, The run, Pipeline |
| Key figures | 4 headline cards: samples by group, N50, consensus QV, BUSCO complete |
| Findings | Live result rows, then 4 figures: N50 against QV per assembly, the QV along each route, the Nx curves and the BUSCO classes per assembly |
| How to read this dashboard | The tabs by group, each with its question |
Data & QC · Which samples reached assembly QC, and at which stages?
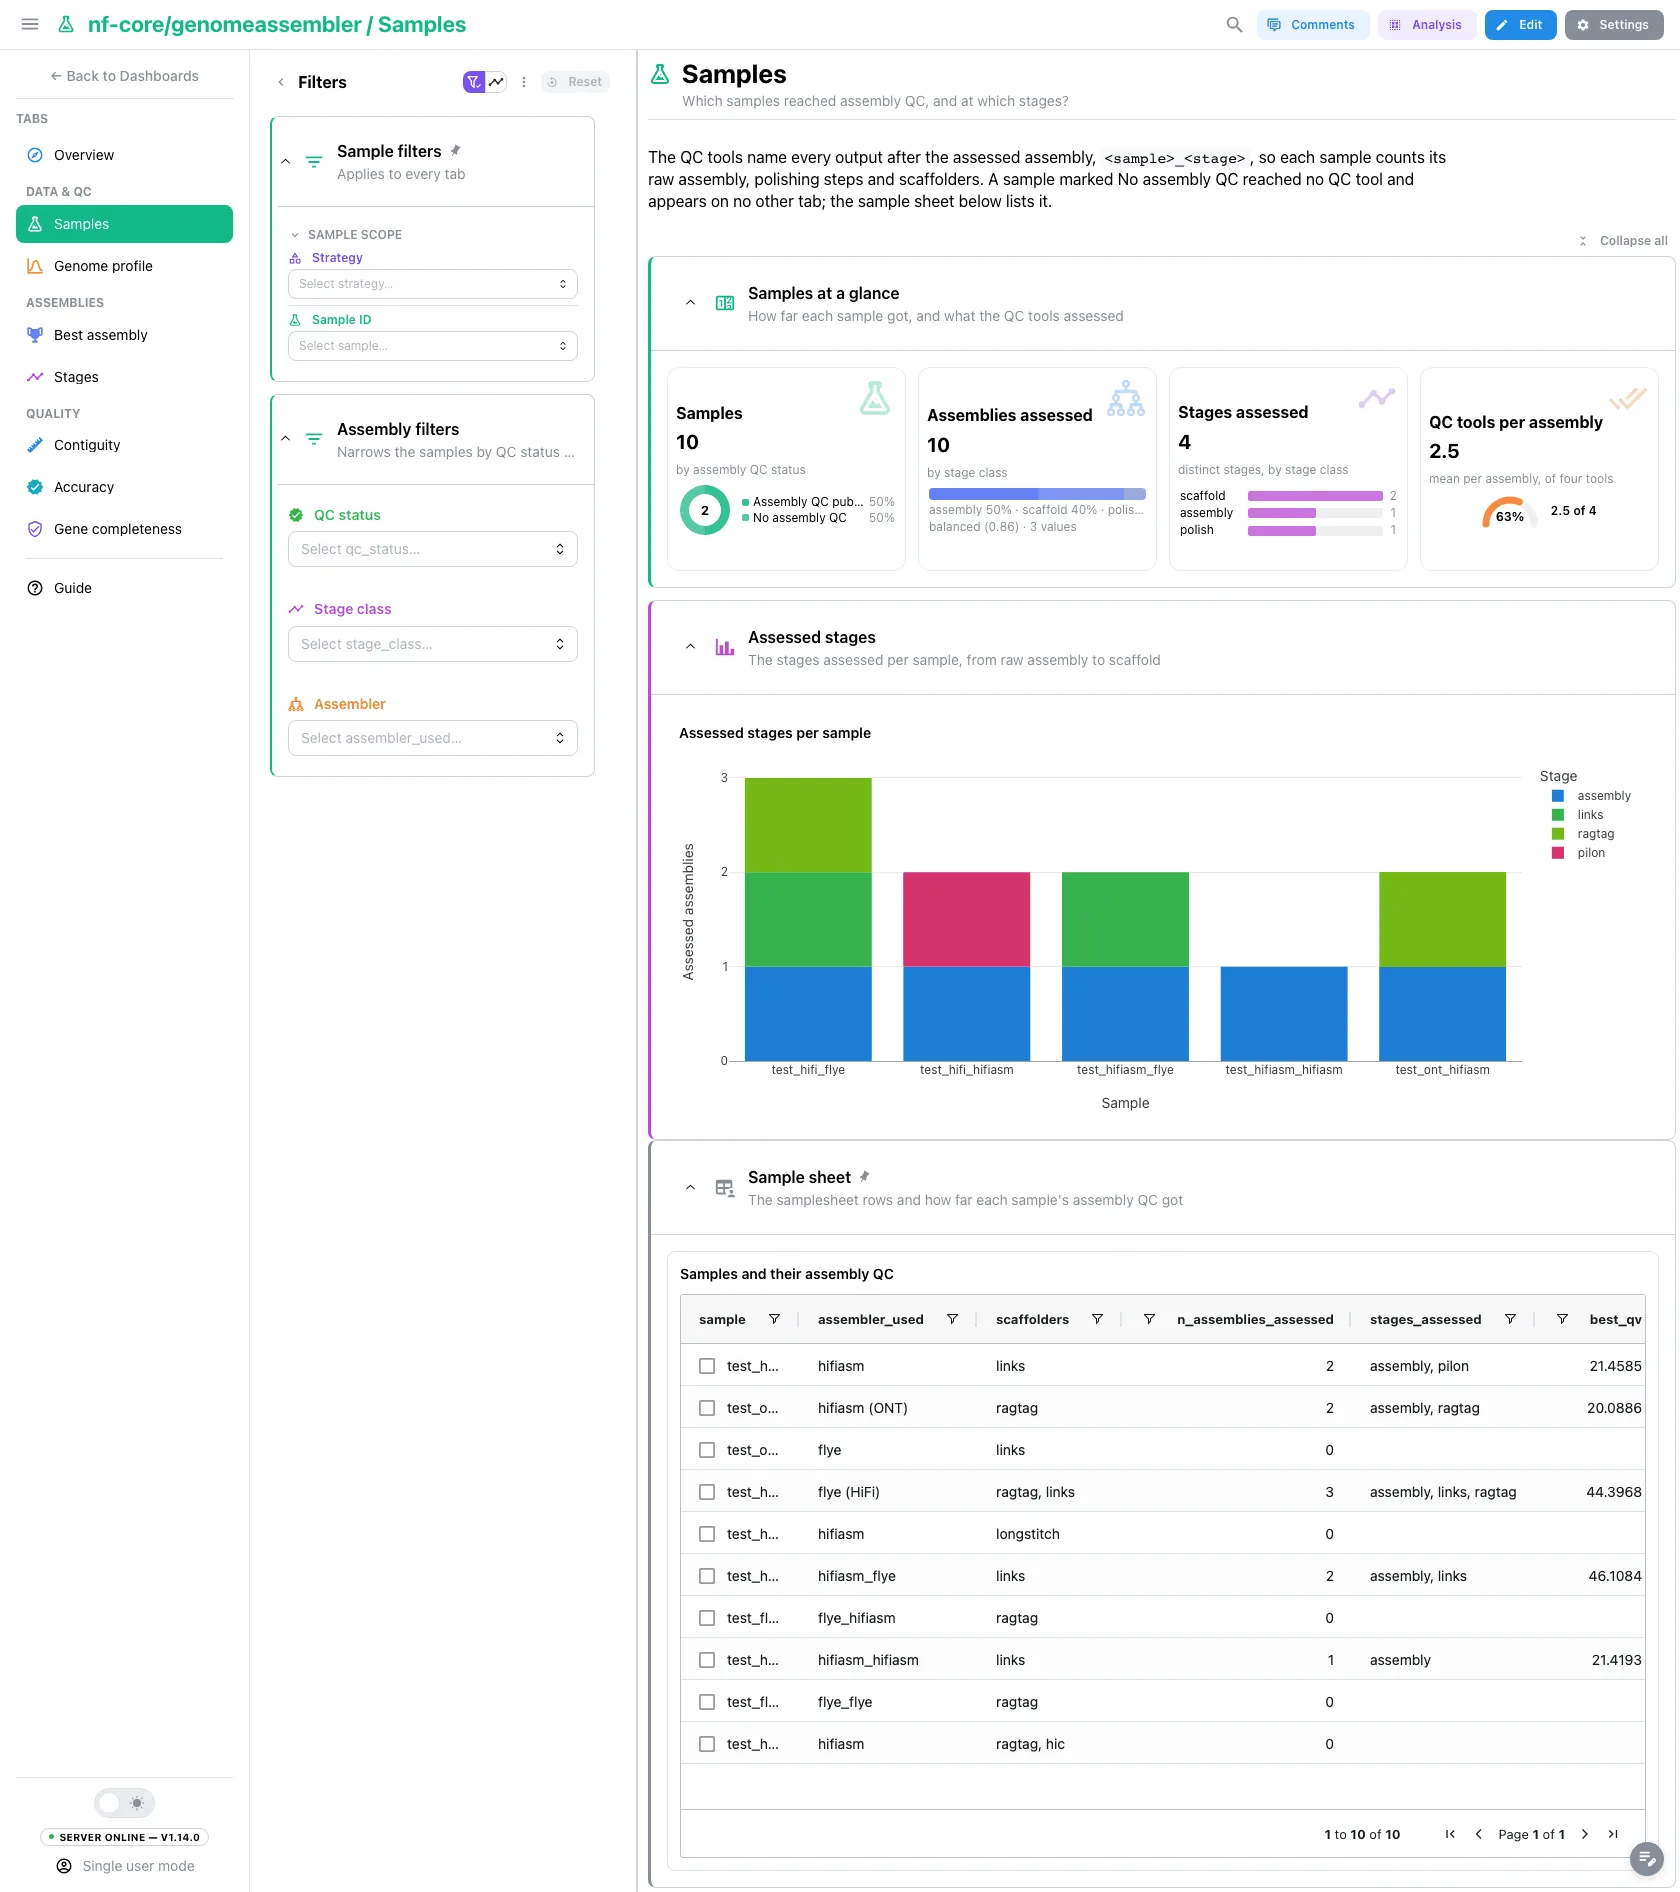
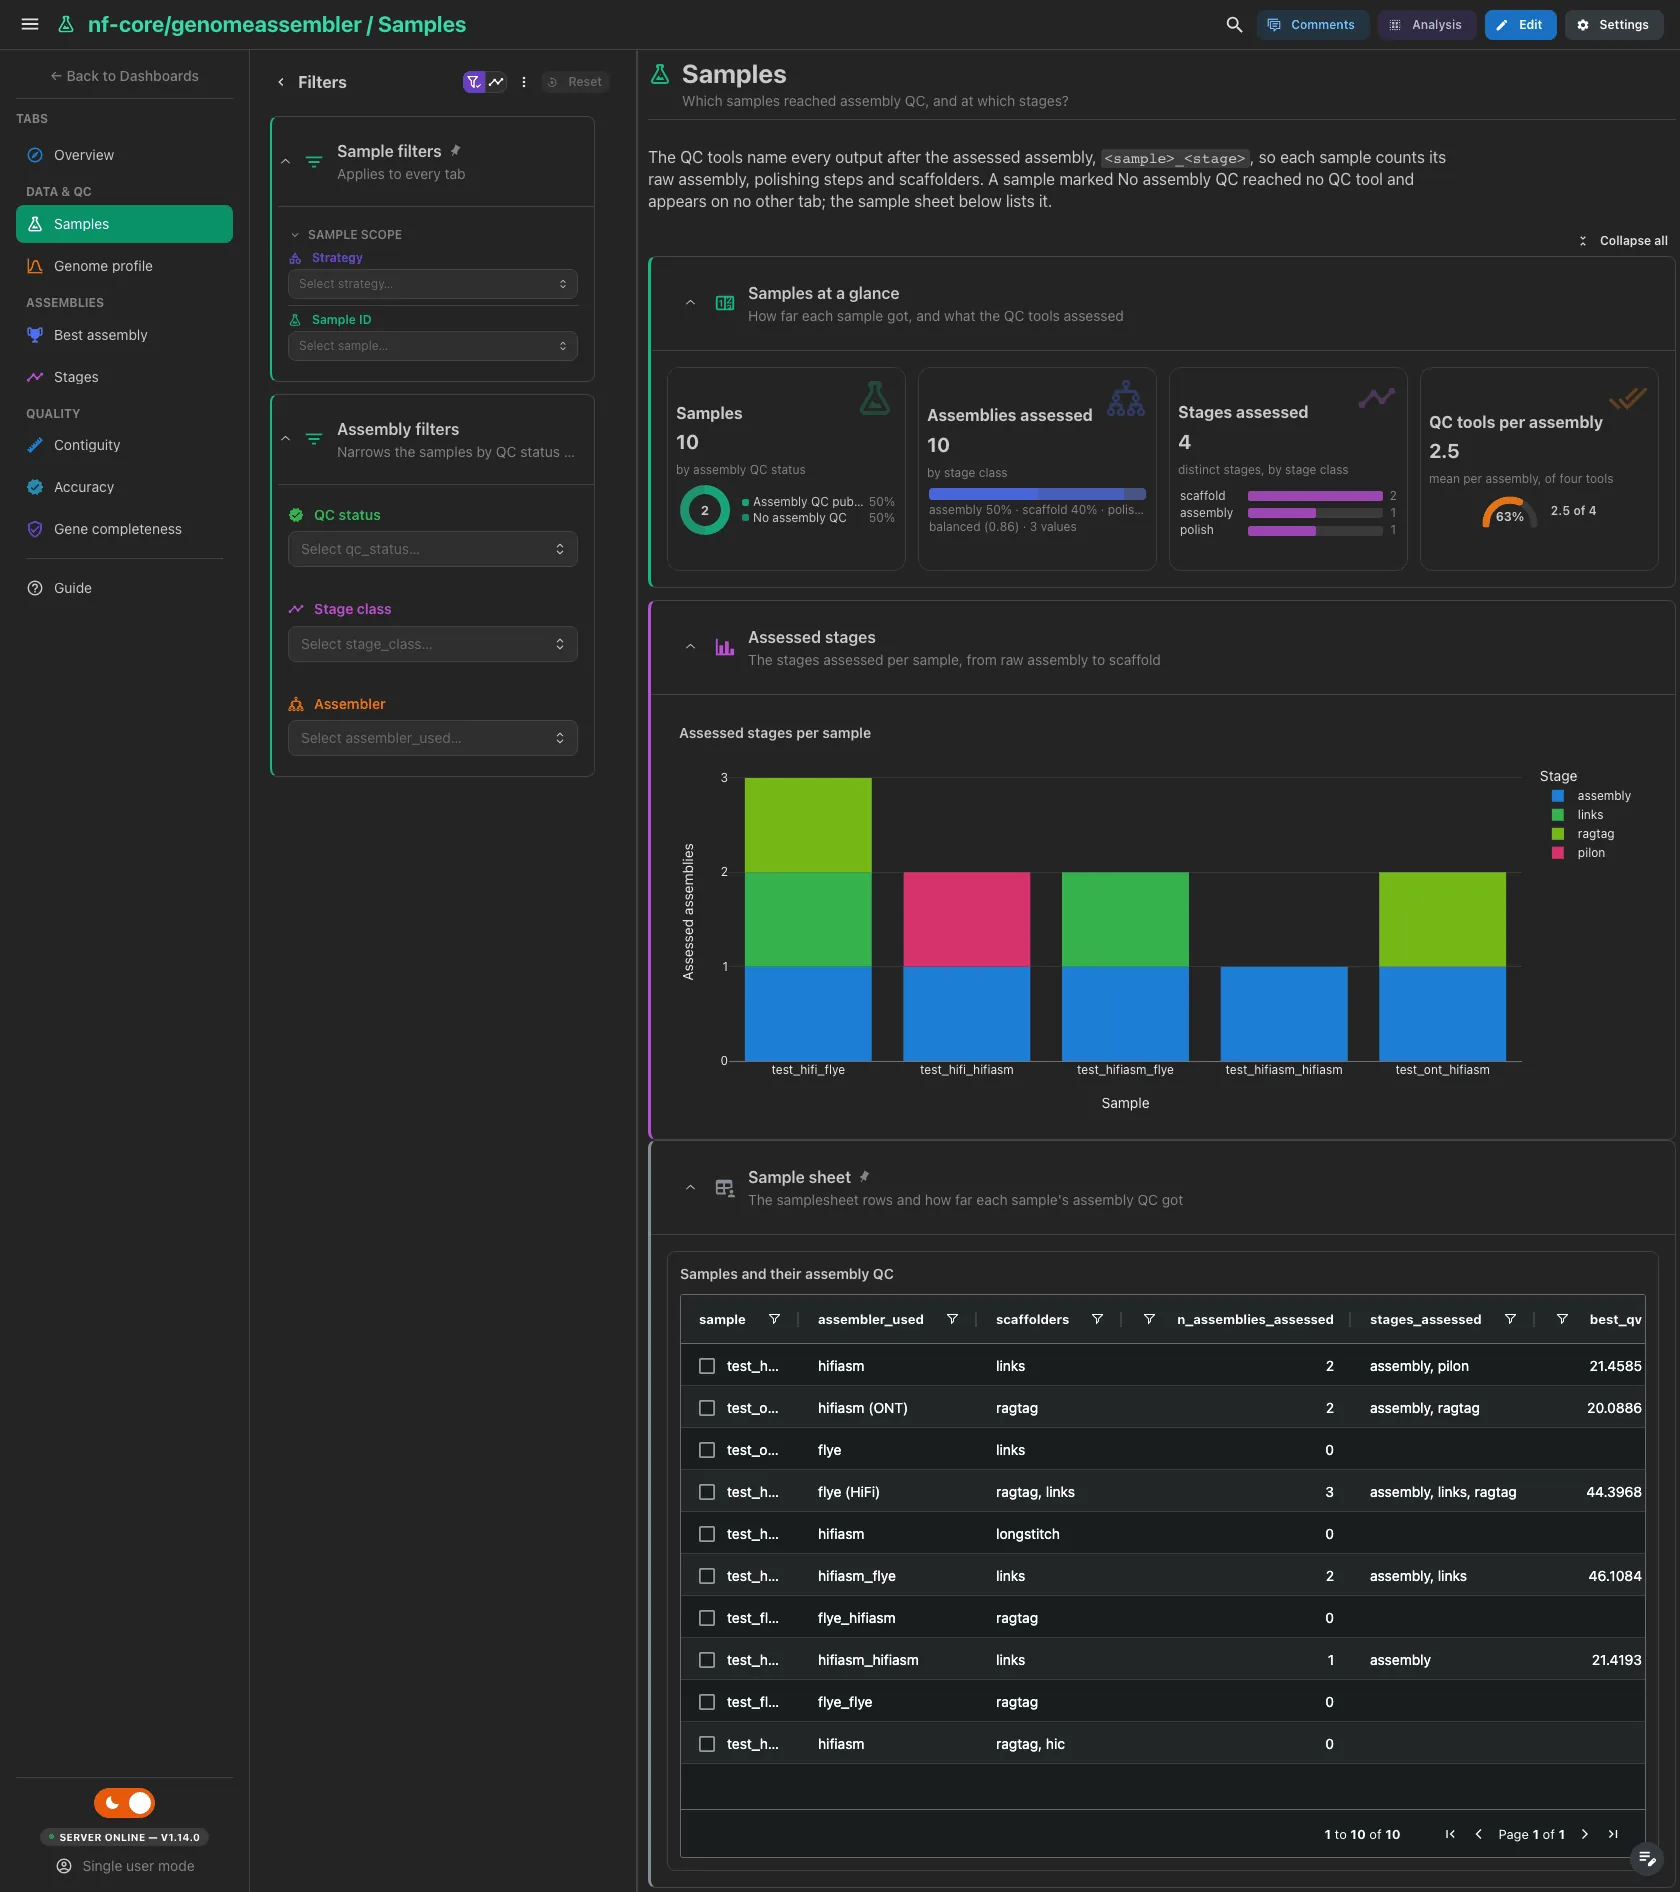
The samples as a ring by QC status, the assessed assemblies split by stage
class, the distinct stages assessed ranked by stage class, and the mean number
of QC tools per assembly on a gauge out of four (samtools, Merqury, BUSCO,
QUAST). Then the assessed stages per sample, one block per assessed assembly
coloured by stage, a code figure so the count axis steps by one; a group-by
set in Analysis mode splits it into panels. A sample marked No assembly QC
reached no QC tool and appears on no other tab: the sample sheet below lists
it.
Filters and components
Filters · QC status on sample_status, and Stage class and
Assembler on assemblies.
| Section | What it holds |
|---|---|
| Samples at a glance | 4 cards |
| Assessed stages | Assessed stages per sample |
Data & QC · What genome do the reads describe, before any assembly?
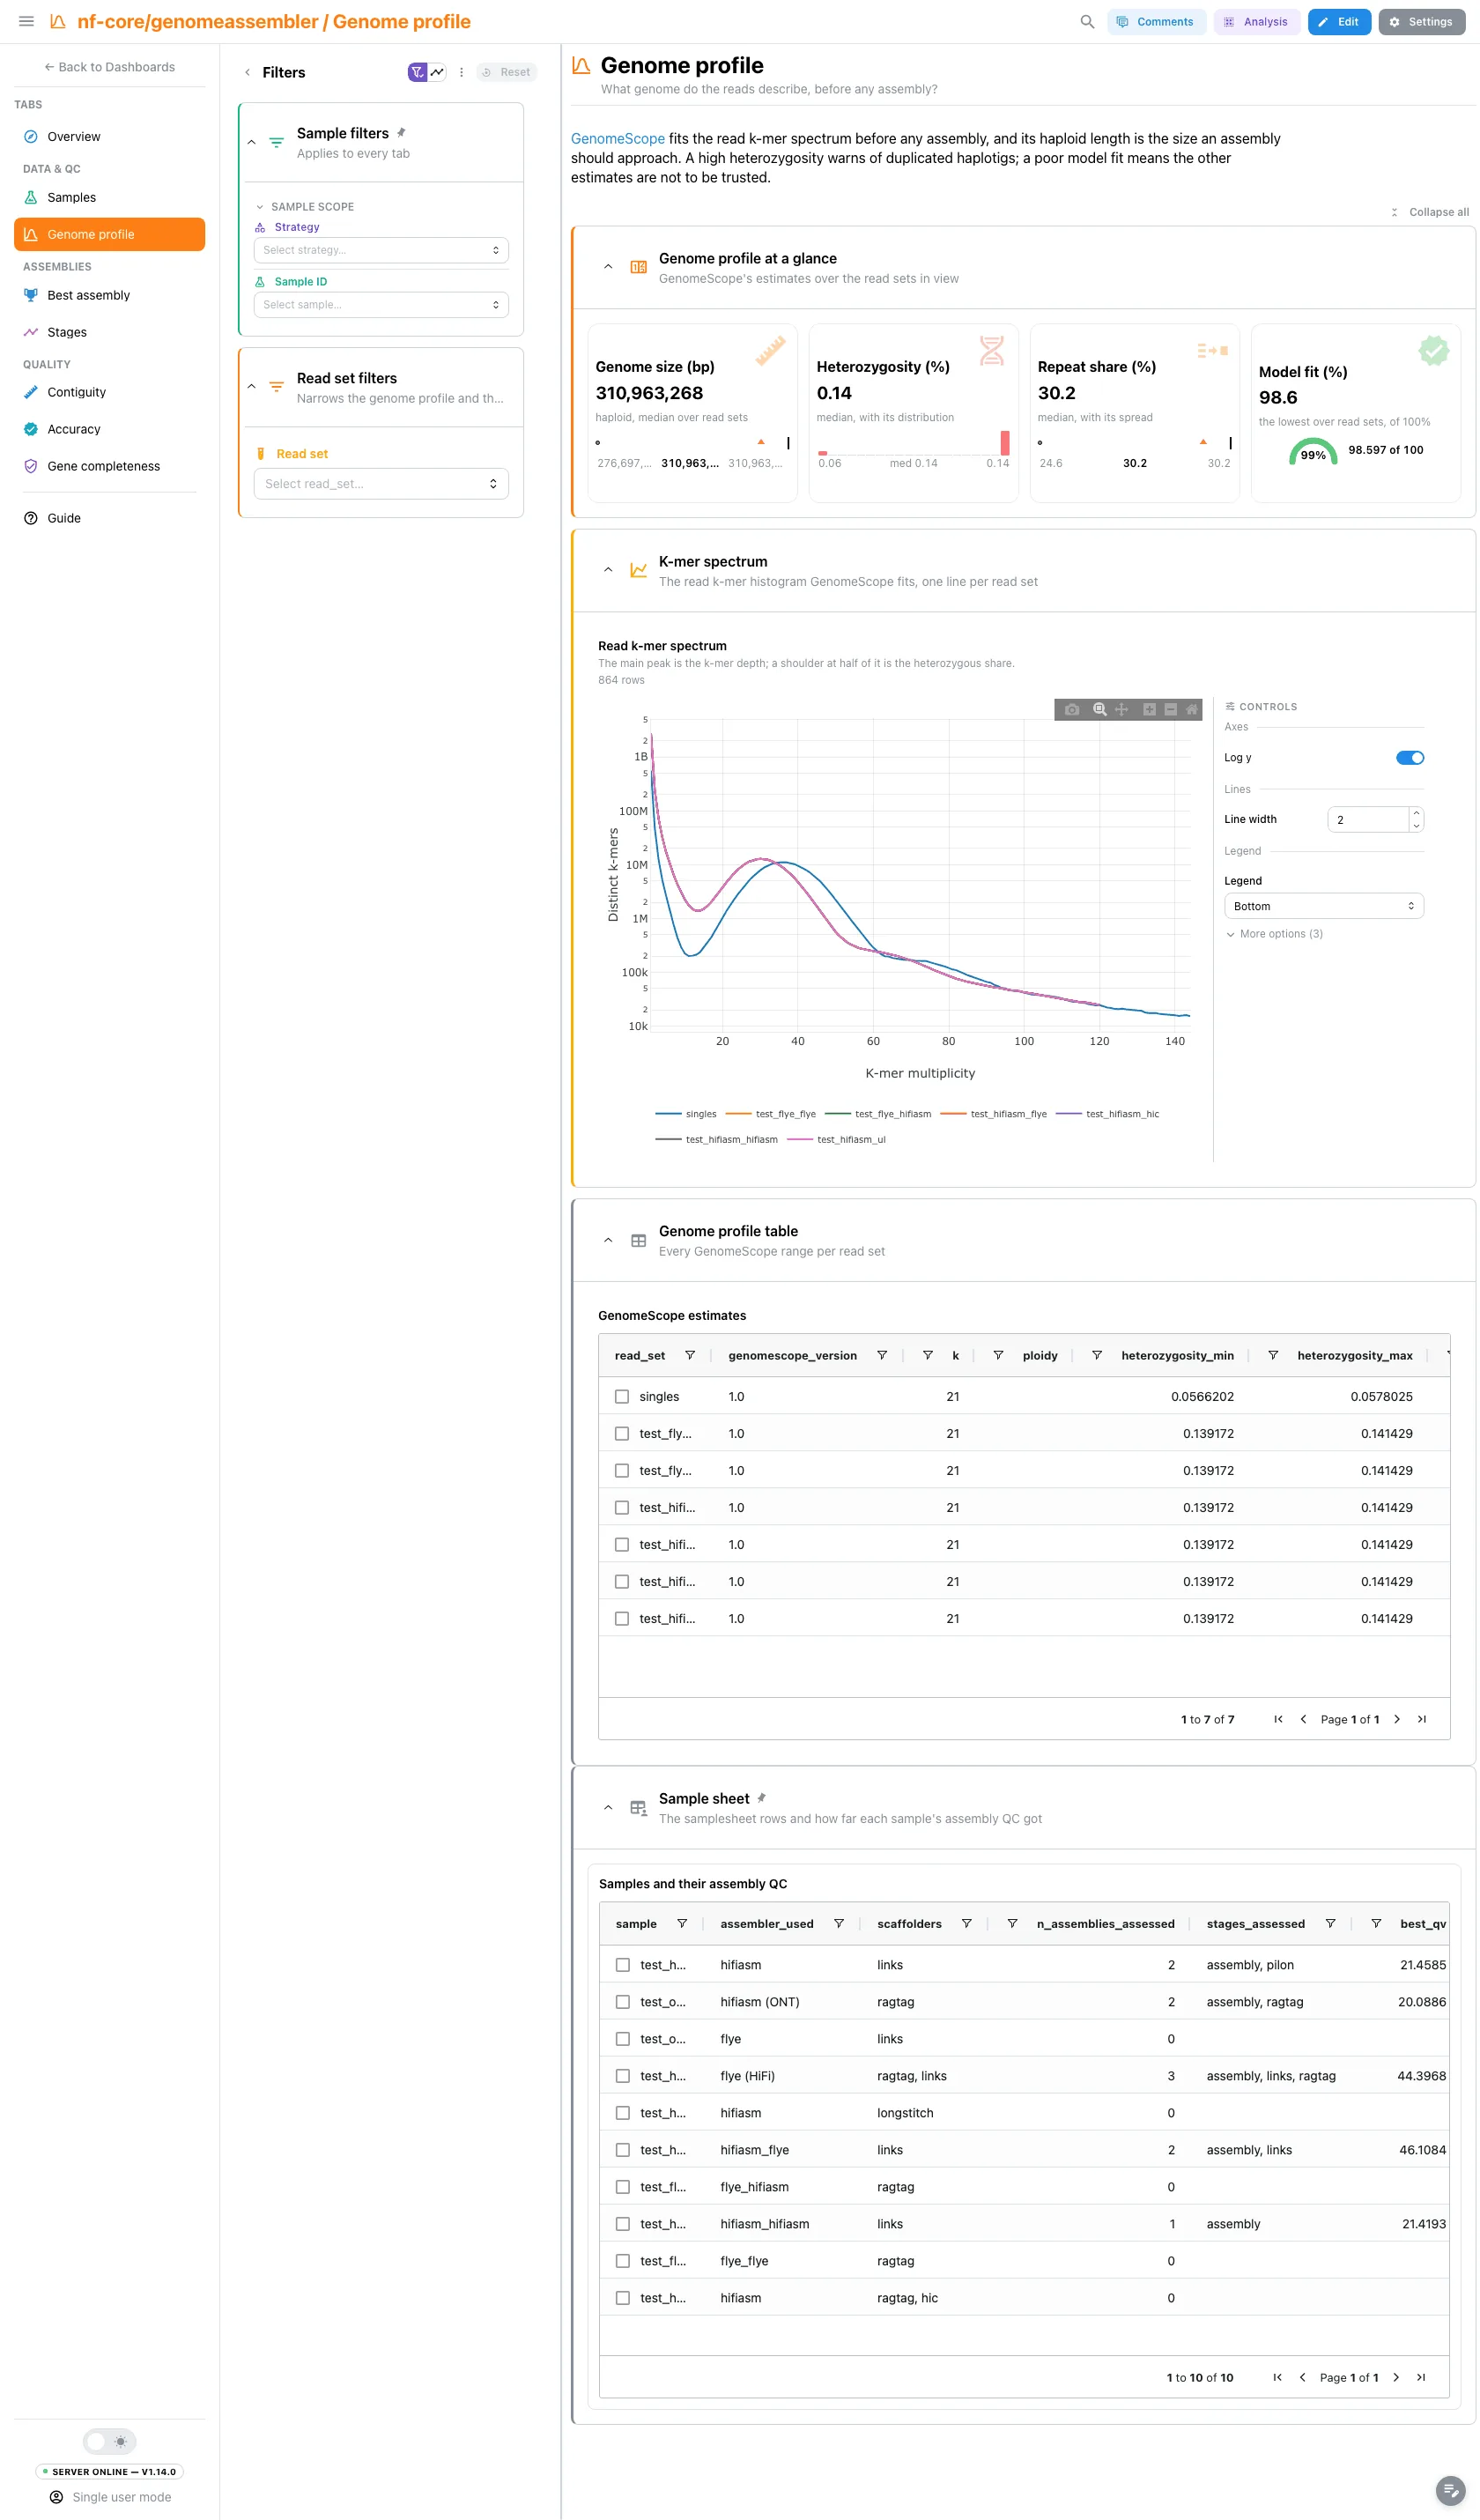
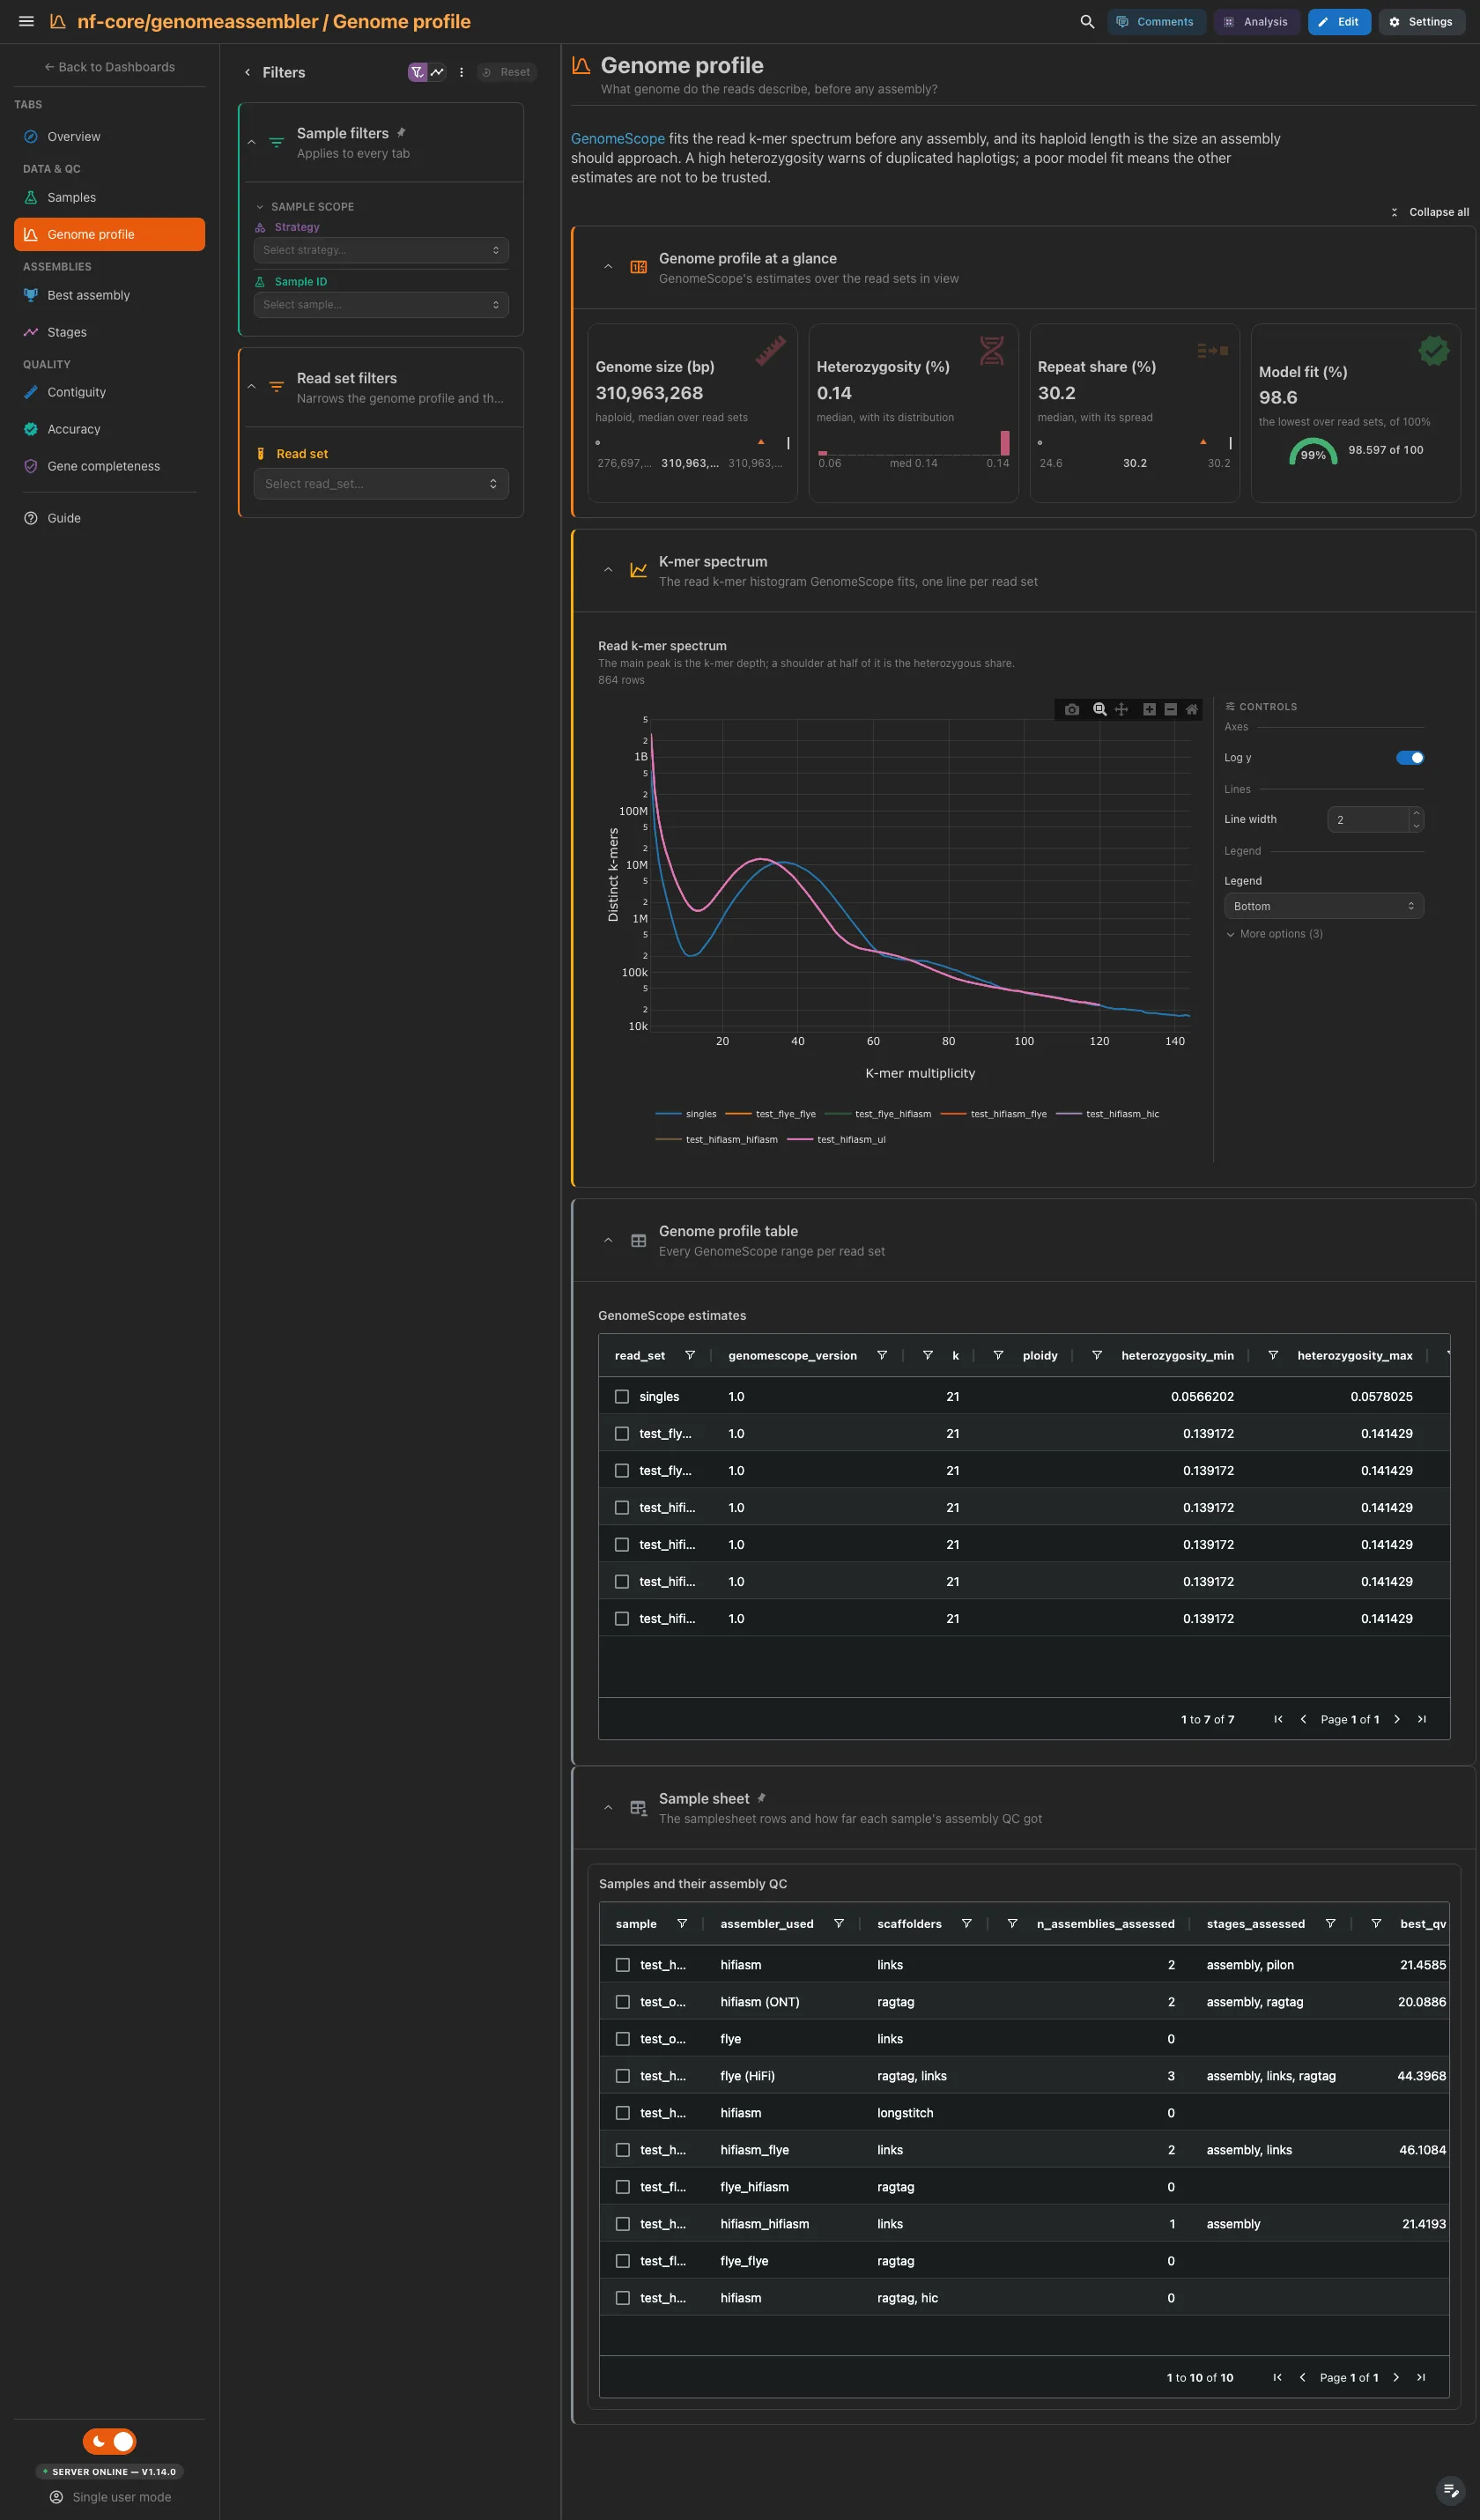
GenomeScope's haploid genome size, heterozygosity, repeat share and the lowest
model fit over the read sets. Then the jellyfish k-mer spectrum GenomeScope
fits, one line per read set. The haploid length is the size an assembly should
approach; a high heterozygosity warns of duplicated haplotigs, and a poor model
fit means the other estimates are not to be trusted. The GenomeScope table is
collapsed. Both collections are per read set, not per assembly: the sample
filters do not reach this tab, and the Read set filter does the narrowing.
Filters and components
Filters · Read set on genomescope_summary, which links to the
spectrum.
| Section | What it holds |
|---|---|
| Genome profile at a glance | 4 cards |
| K-mer spectrum | 1 advanced visualization |
| Genome profile table (collapsed) | GenomeScope estimates |
Assemblies · Which assembly is best across contiguity, accuracy and genes?
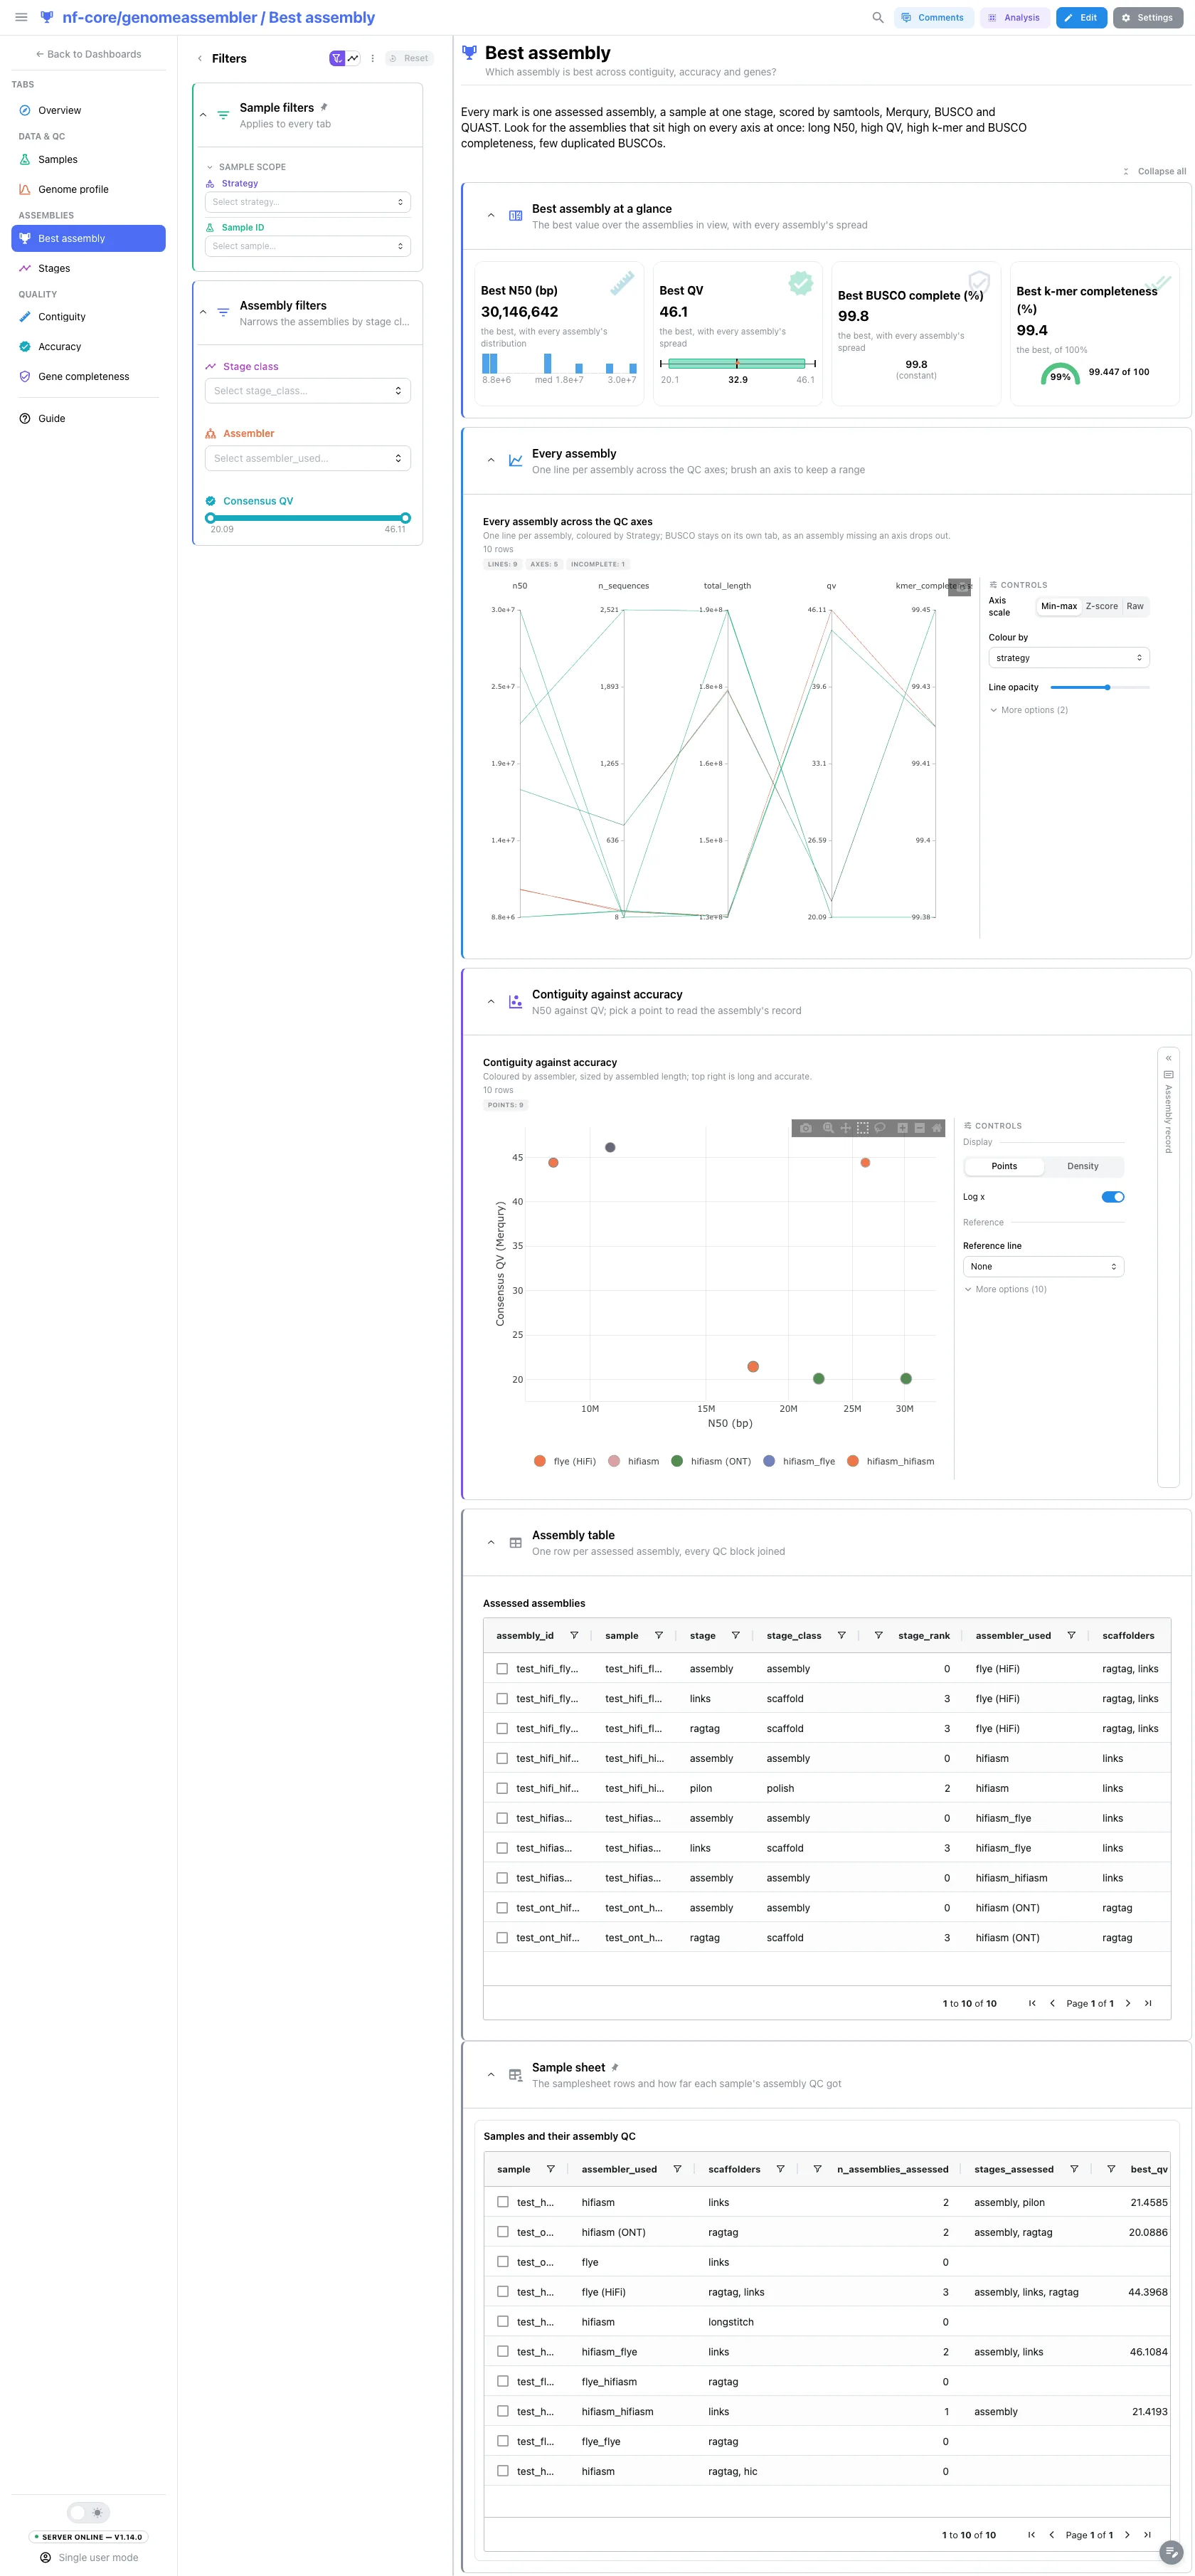
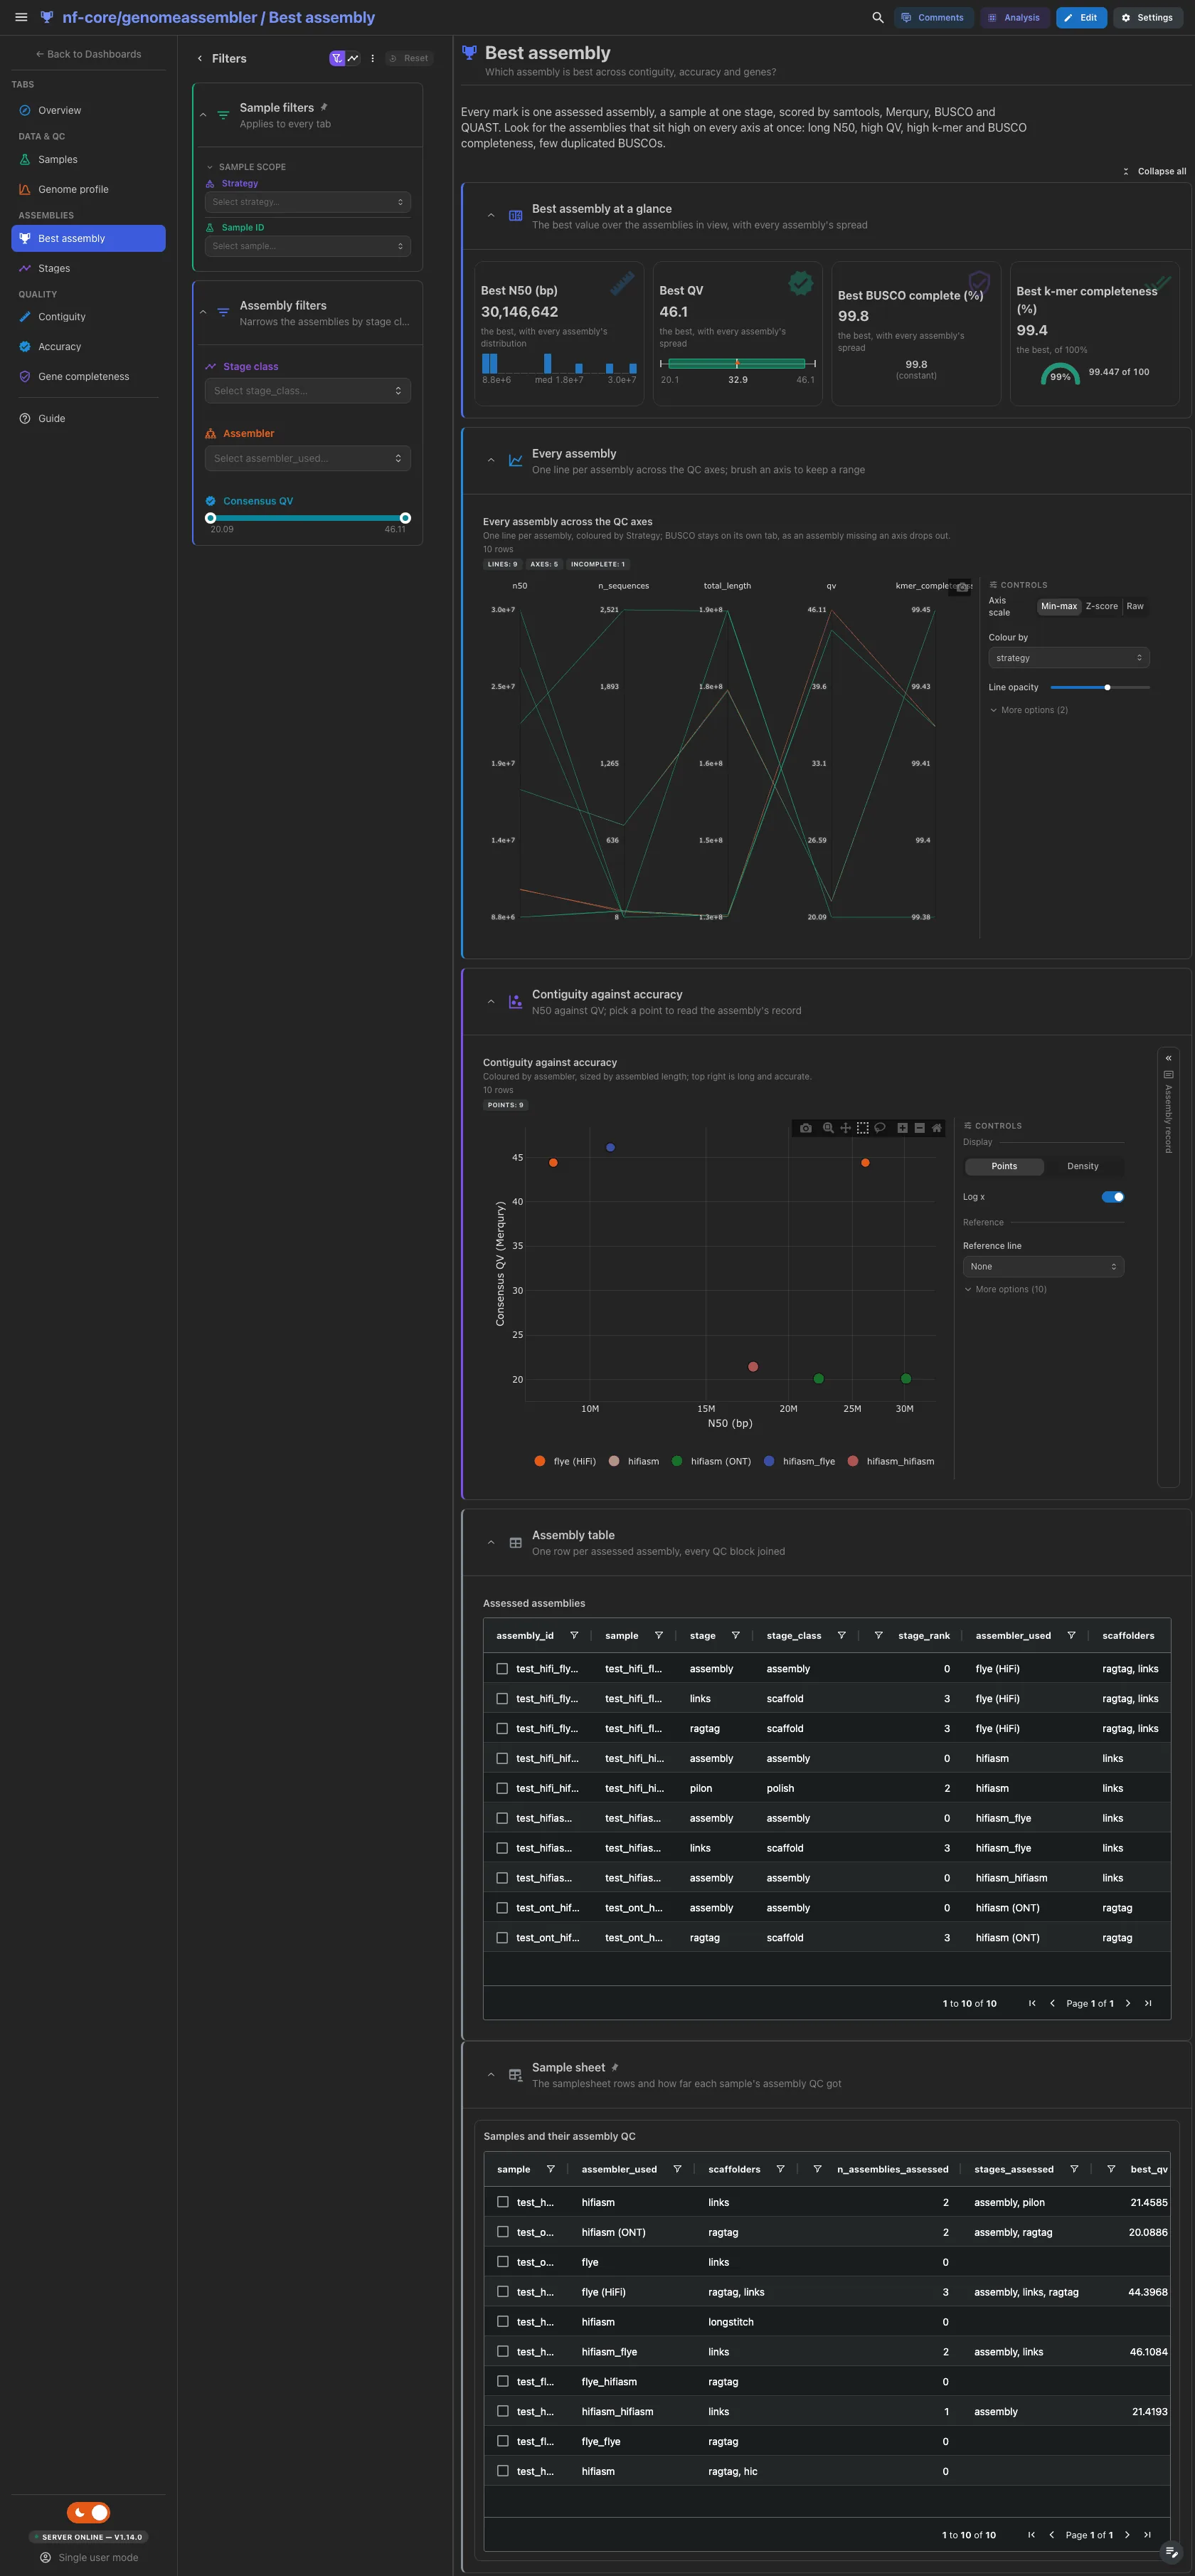
The best N50, QV, share of complete BUSCOs and k-mer completeness over the assemblies in view, each with every assembly's spread. Then the parallel coordinates over N50, sequence count, length, QV and k-mer completeness, coloured by group; brush an axis to keep a range. BUSCO stays off it: the plot drops a line that misses an axis, and BUSCO scores fewer assemblies than Merqury. Below, N50 against QV coloured by assembler, with the assembly record card beside it, which waits for a picked point. The assembly table is collapsed.
Filters and components
Filters · Stage class, Assembler and a Consensus QV range on
assemblies.
| Section | What it holds |
|---|---|
| Best assembly at a glance | 4 cards |
| Every assembly | 1 advanced visualization |
| Contiguity against accuracy | 2 advanced visualizations: the N50 against QV scatter and the assembly record card |
| Assembly table (collapsed) | Assessed assemblies |
Assemblies · What does each polishing and scaffolding step add?
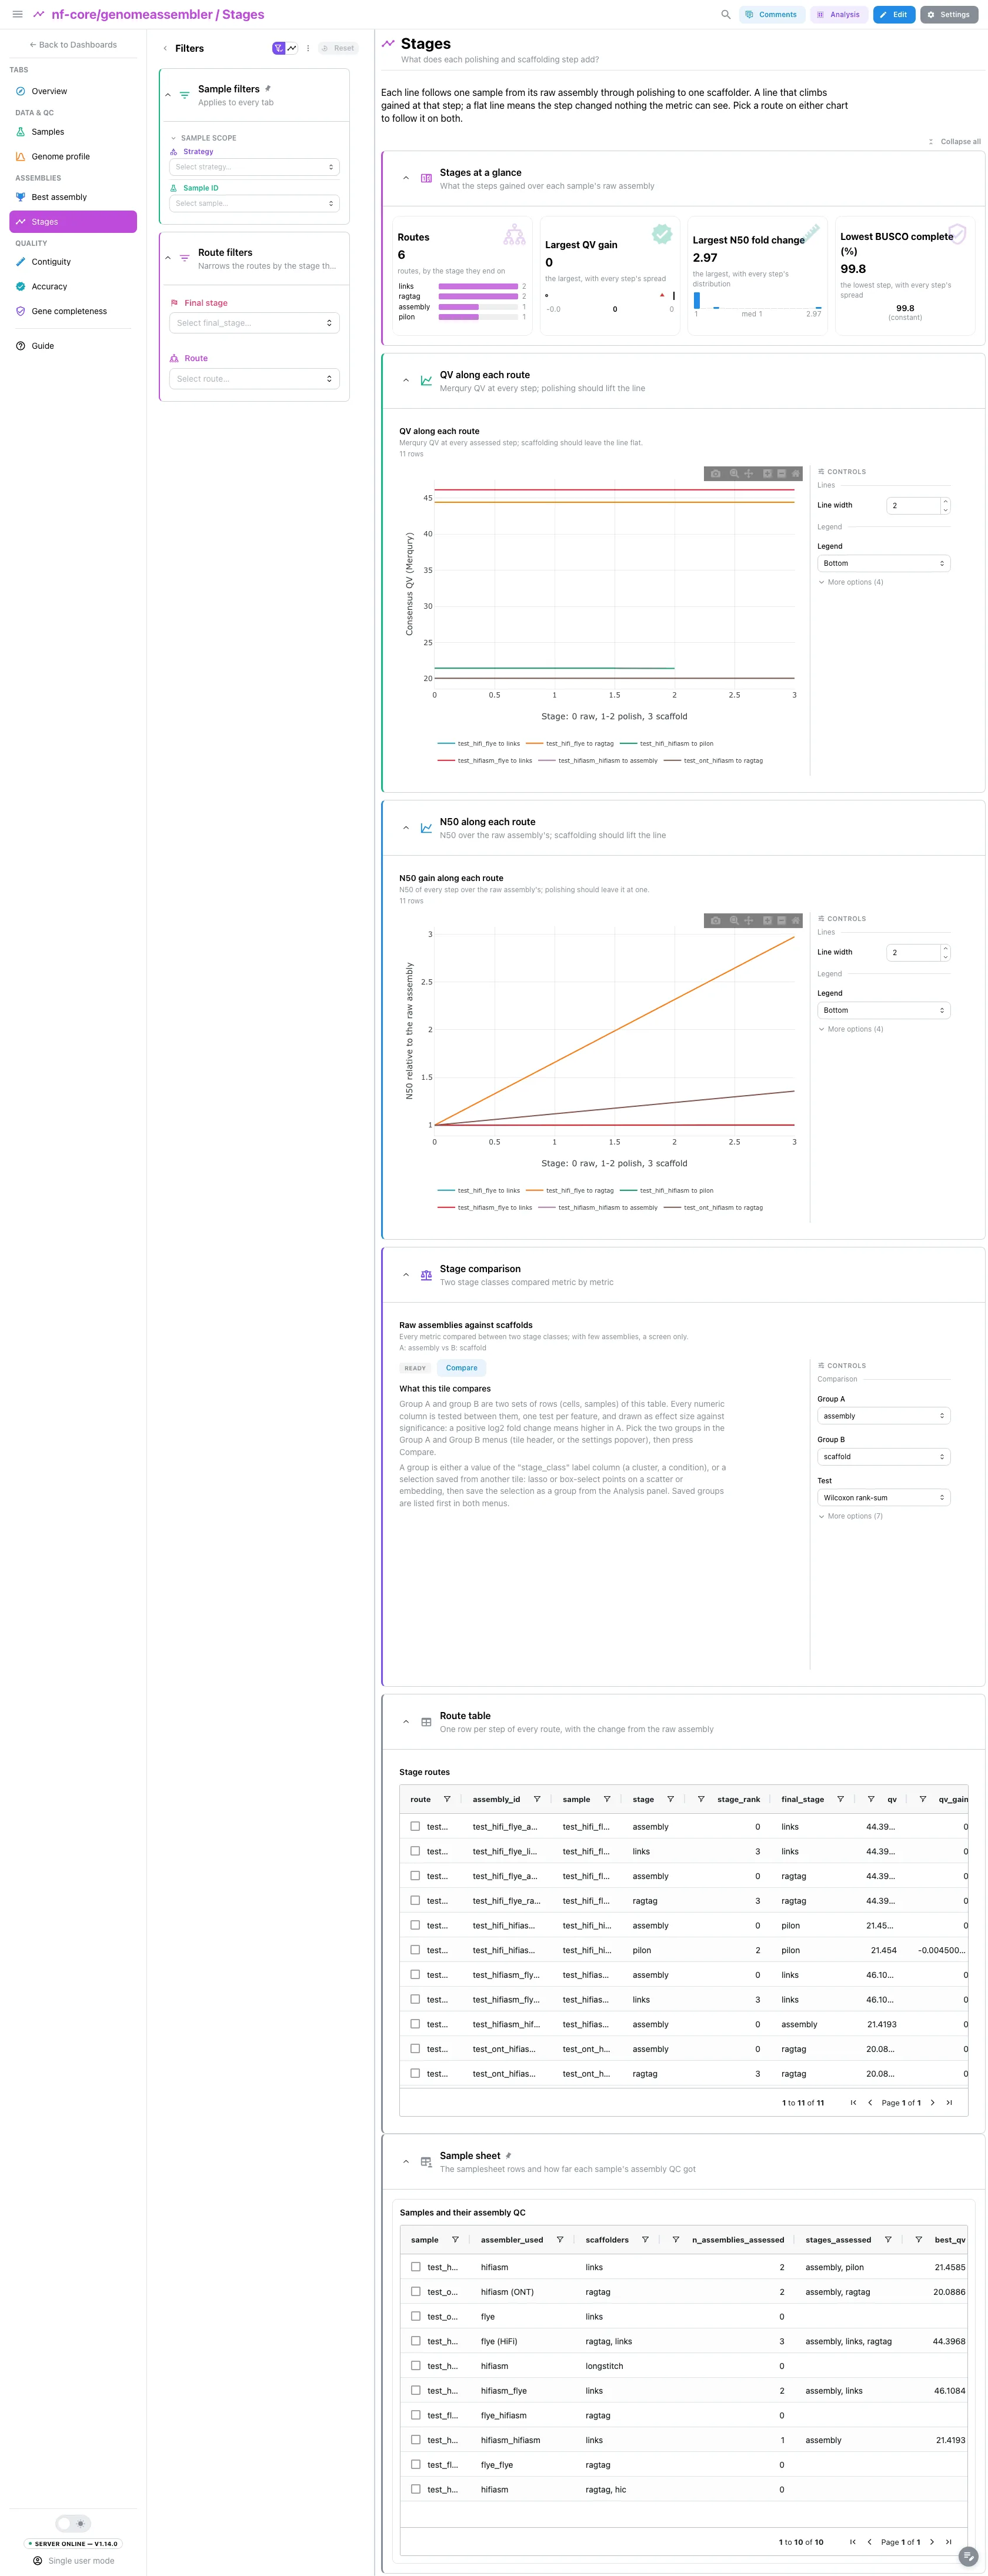
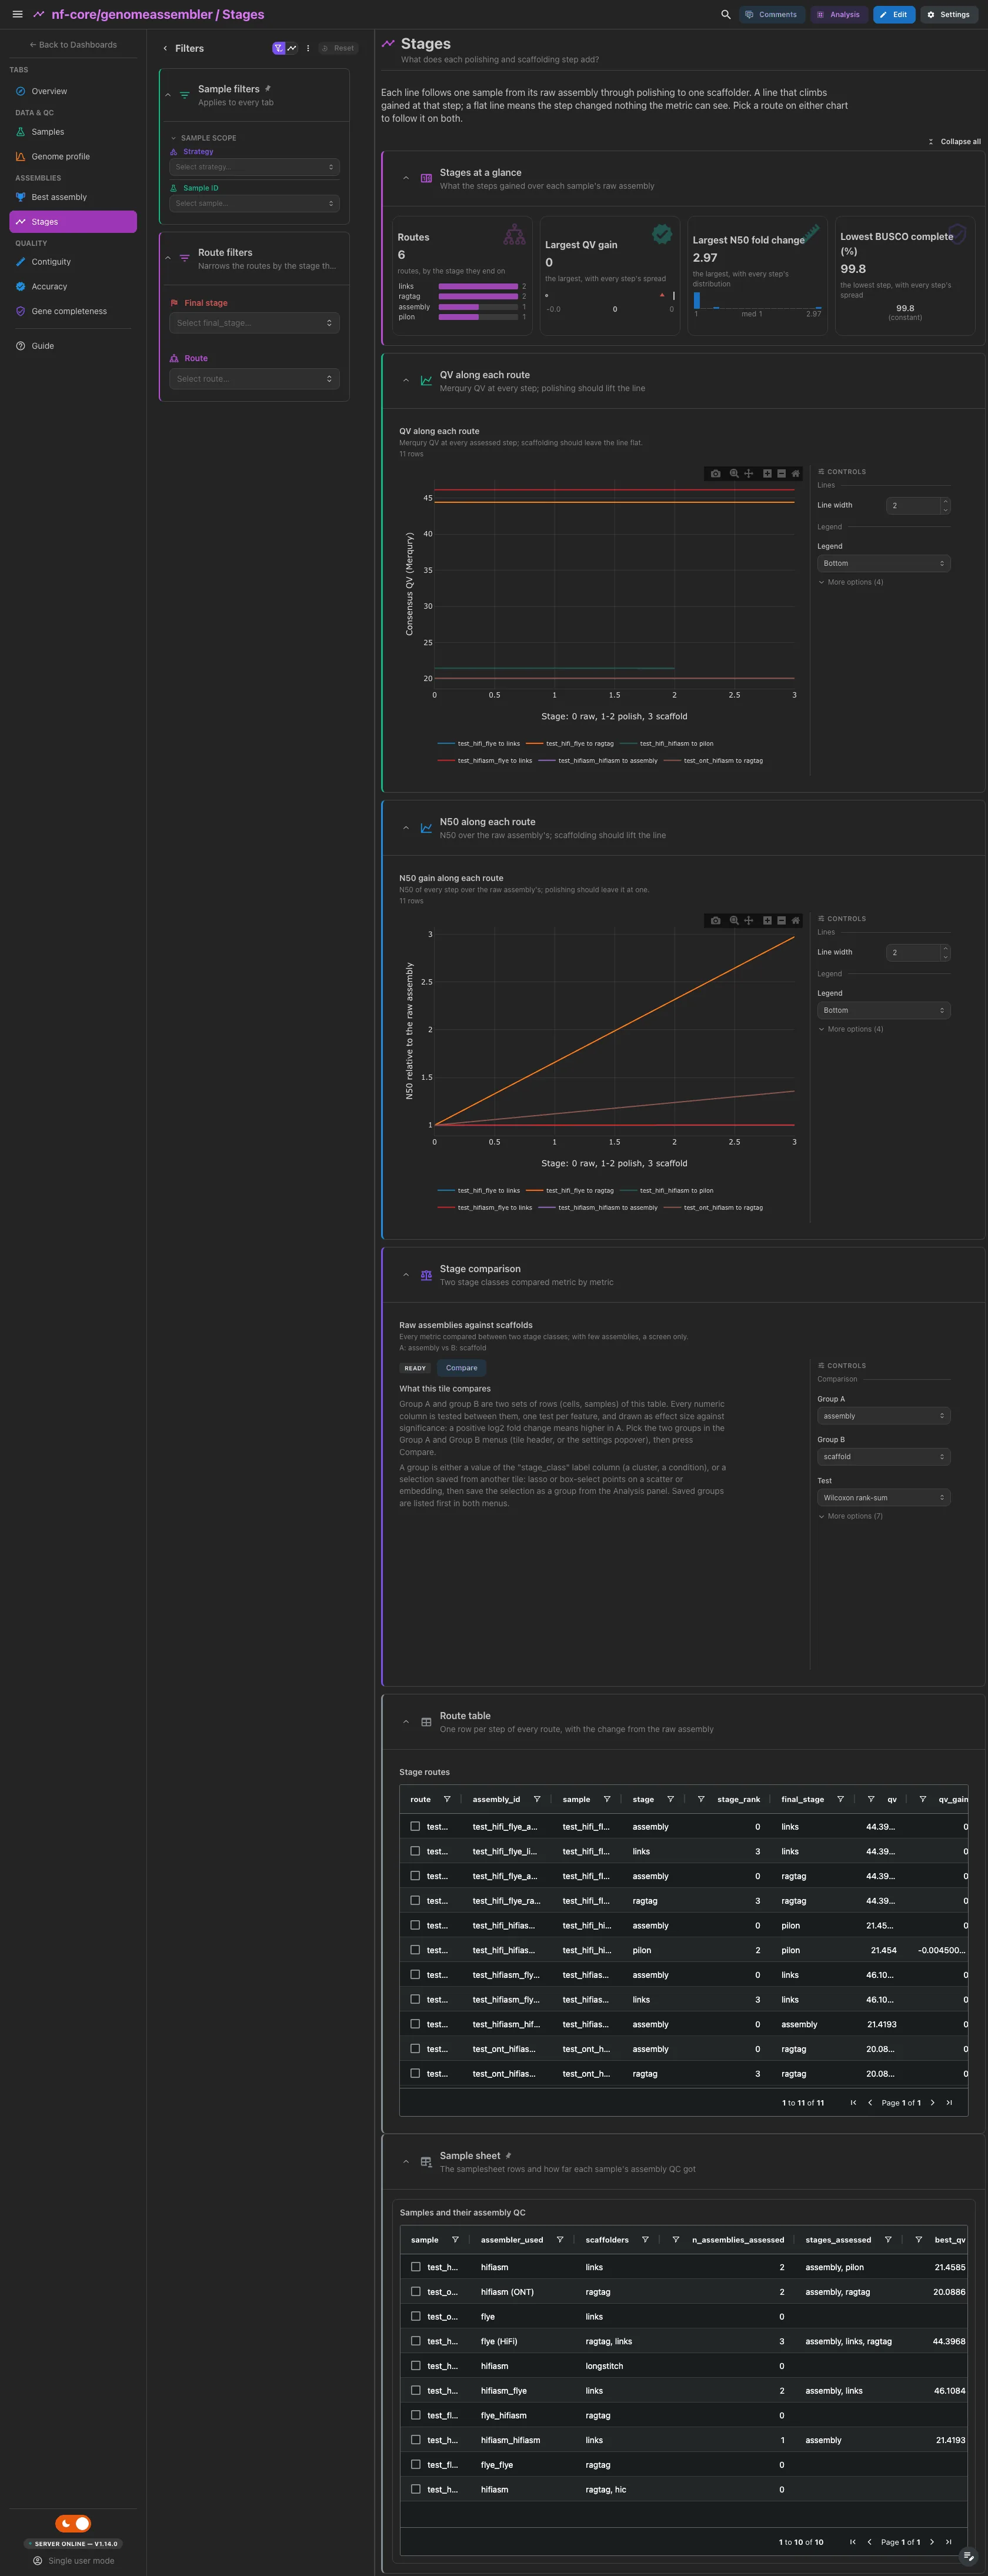
A route runs from a sample's raw assembly through polishing to one scaffolder. The routes ranked by the stage they end on, the largest QV gain, the largest N50 fold change and the lowest share of complete BUSCOs over the steps. Then the QV and the N50 fold change along each route, one line per route: a line that climbs gained at that step, a flat one changed nothing the metric can see. Pick a route on either chart to follow it on both. The comparison of raw assemblies against scaffolds, metric by metric (a screen, not a verdict, with few assemblies per class), and the route table are collapsed.
Filters and components
Filters · Final stage and Route on stage_steps.
| Section | What it holds |
|---|---|
| Stages at a glance | 4 cards |
| QV along each route | 1 advanced visualization |
| N50 along each route | 1 advanced visualization |
| Stage comparison (collapsed) | 1 advanced visualization |
| Route table (collapsed) | Stage routes |
Quality · How long and how fragmented is each assembly?
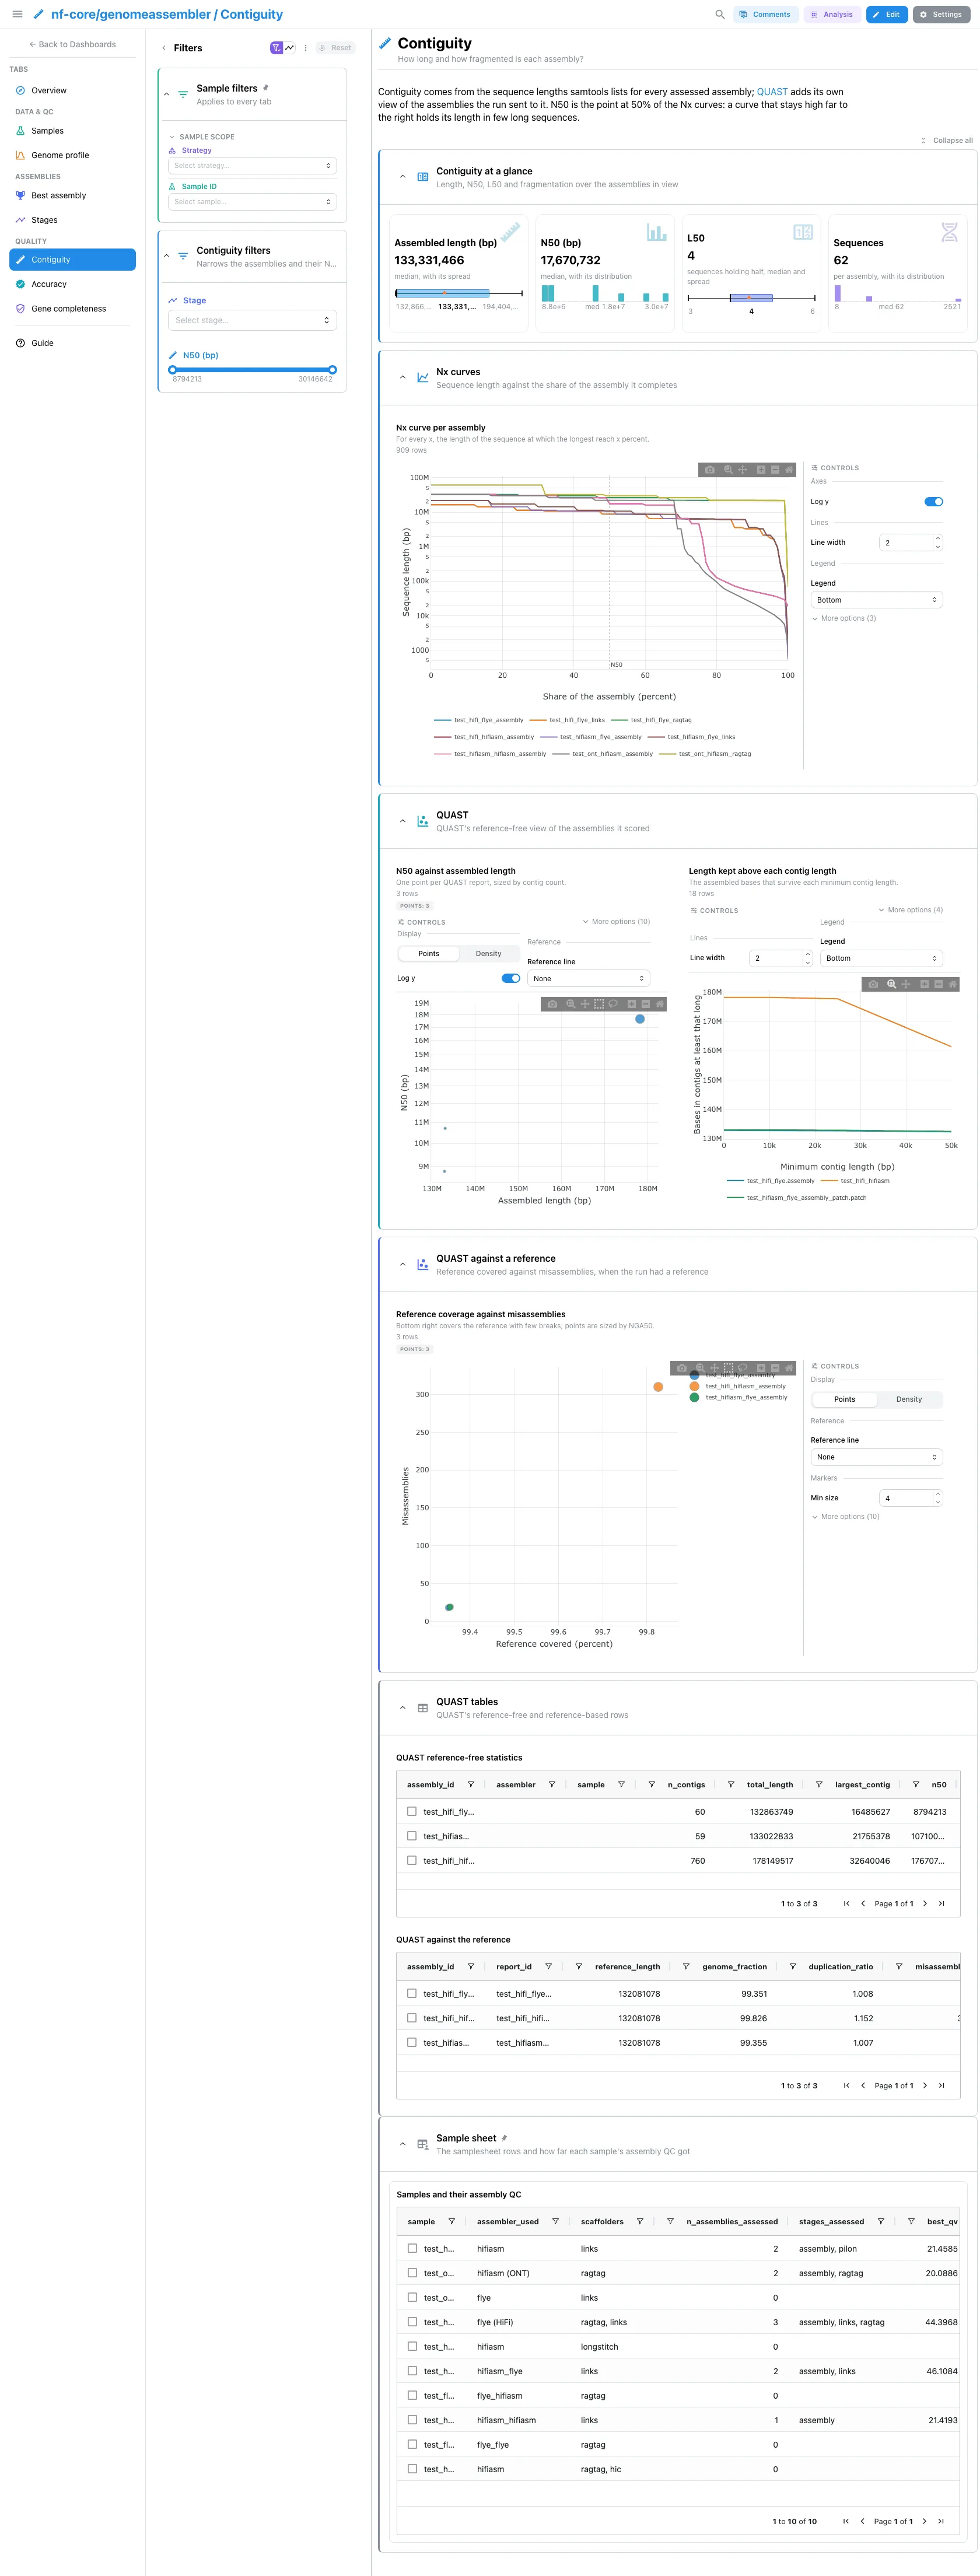
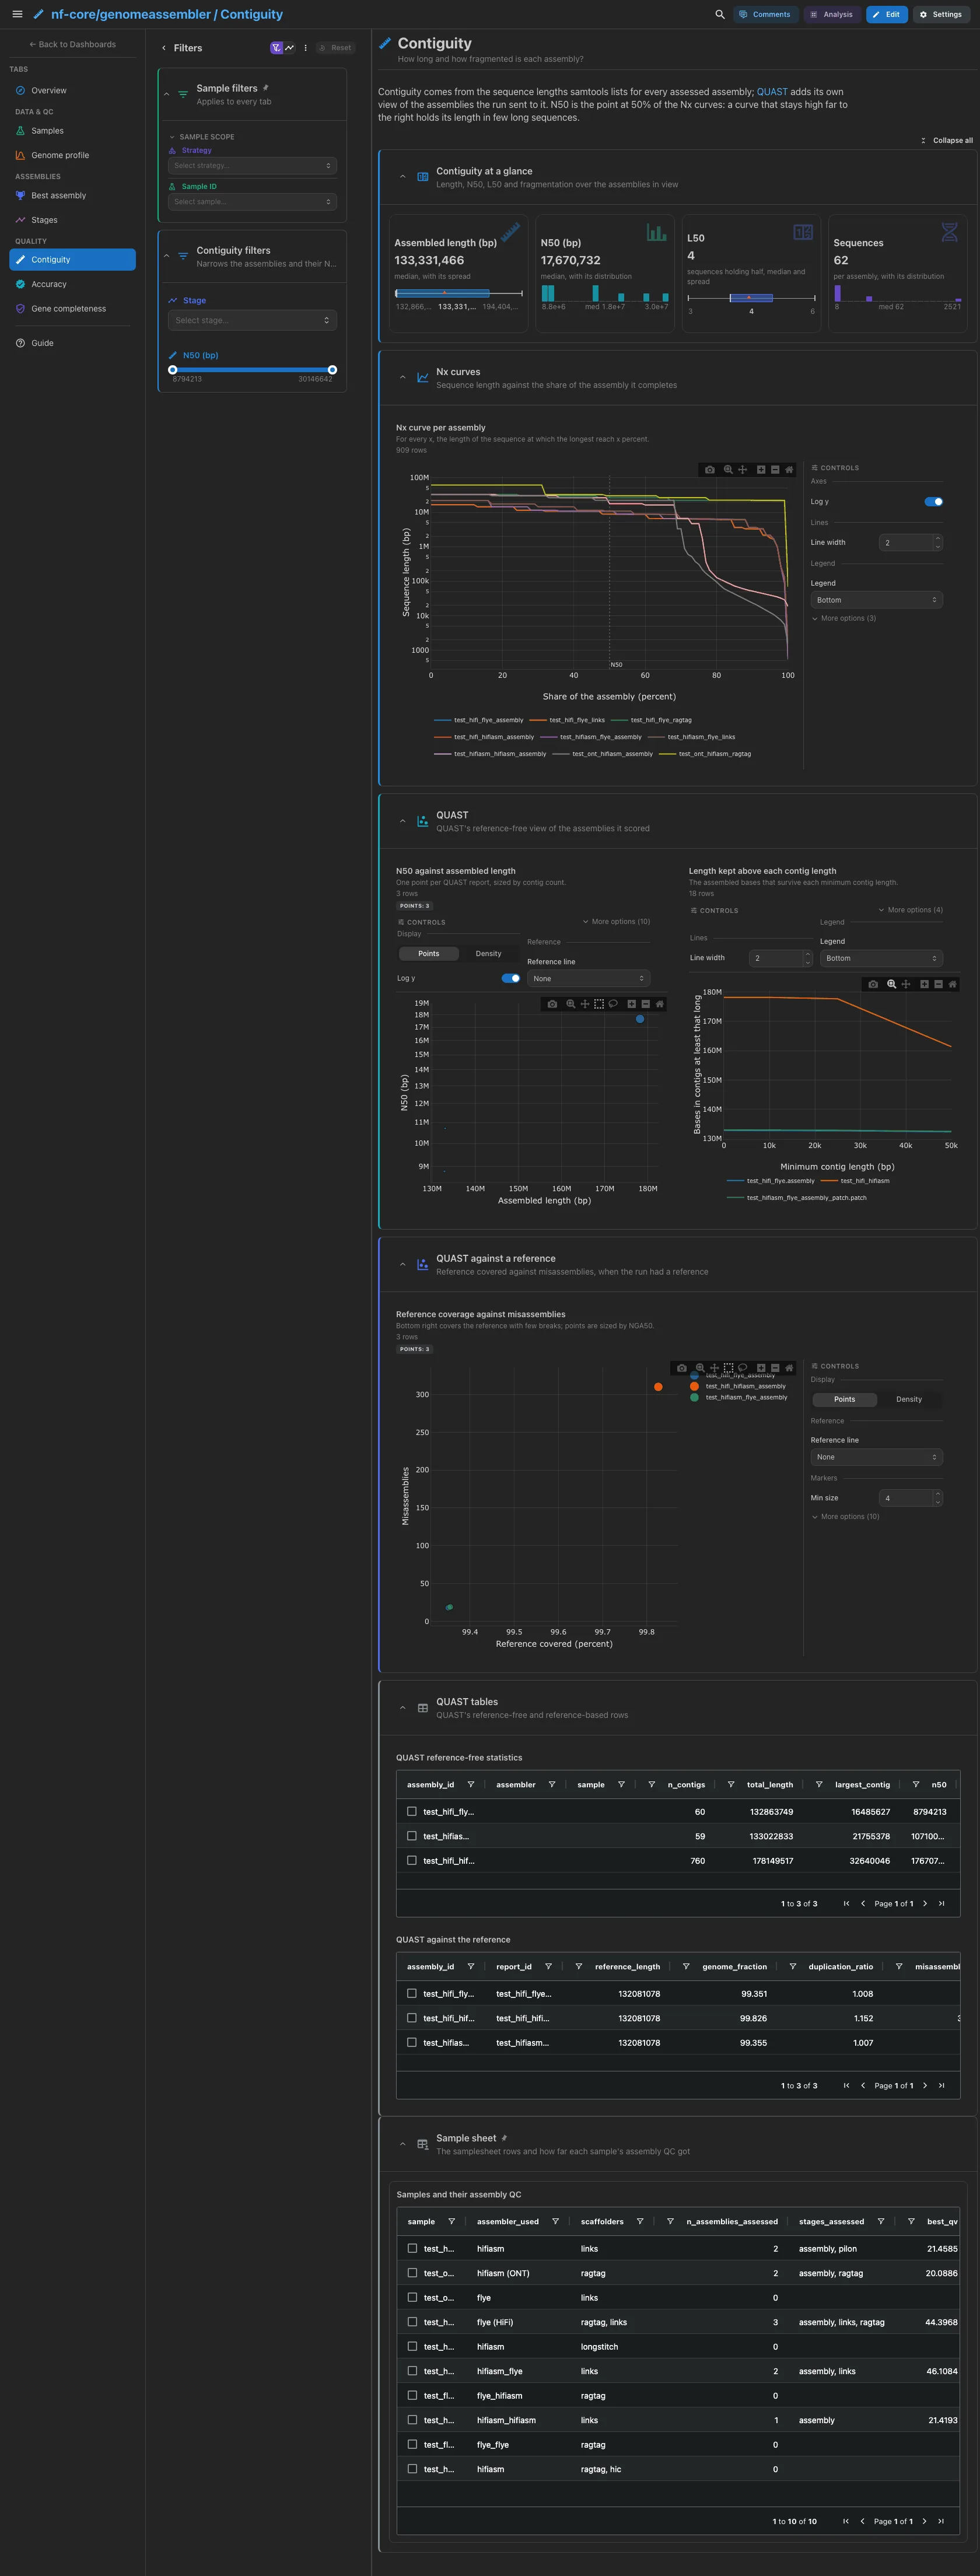
The median assembled length, N50, L50 and sequence count. Then the Nx curves, computed from the samtools idxstats sequence lengths of every assessed assembly, so they cover assemblies QUAST never scored: N50 is the point at 50%, and a curve that stays high far to the right holds its length in few long sequences. Then QUAST's reference-free view, N50 against assembled length beside the length kept above each contig length. QUAST against a reference, written only when the run had one, and the QUAST tables are collapsed.
Filters and components
Filters · Stage and an N50 (bp) range on assemblies.
| Section | What it holds |
|---|---|
| Contiguity at a glance | 4 cards |
| Nx curves | 1 advanced visualization |
| QUAST | 2 advanced visualizations: N50 against assembled length and the length kept above each contig length |
| QUAST against a reference (collapsed) | 1 advanced visualization |
| QUAST tables (collapsed) | QUAST reference-free statistics, QUAST against the reference |
QUAST is optional, the reference too
A run without QUAST has no QUAST sections on this tab; a run without a reference has no reference view or table. The Nx curves and the strip do not depend on QUAST.
Quality · How accurate is each assembly against the read k-mers?
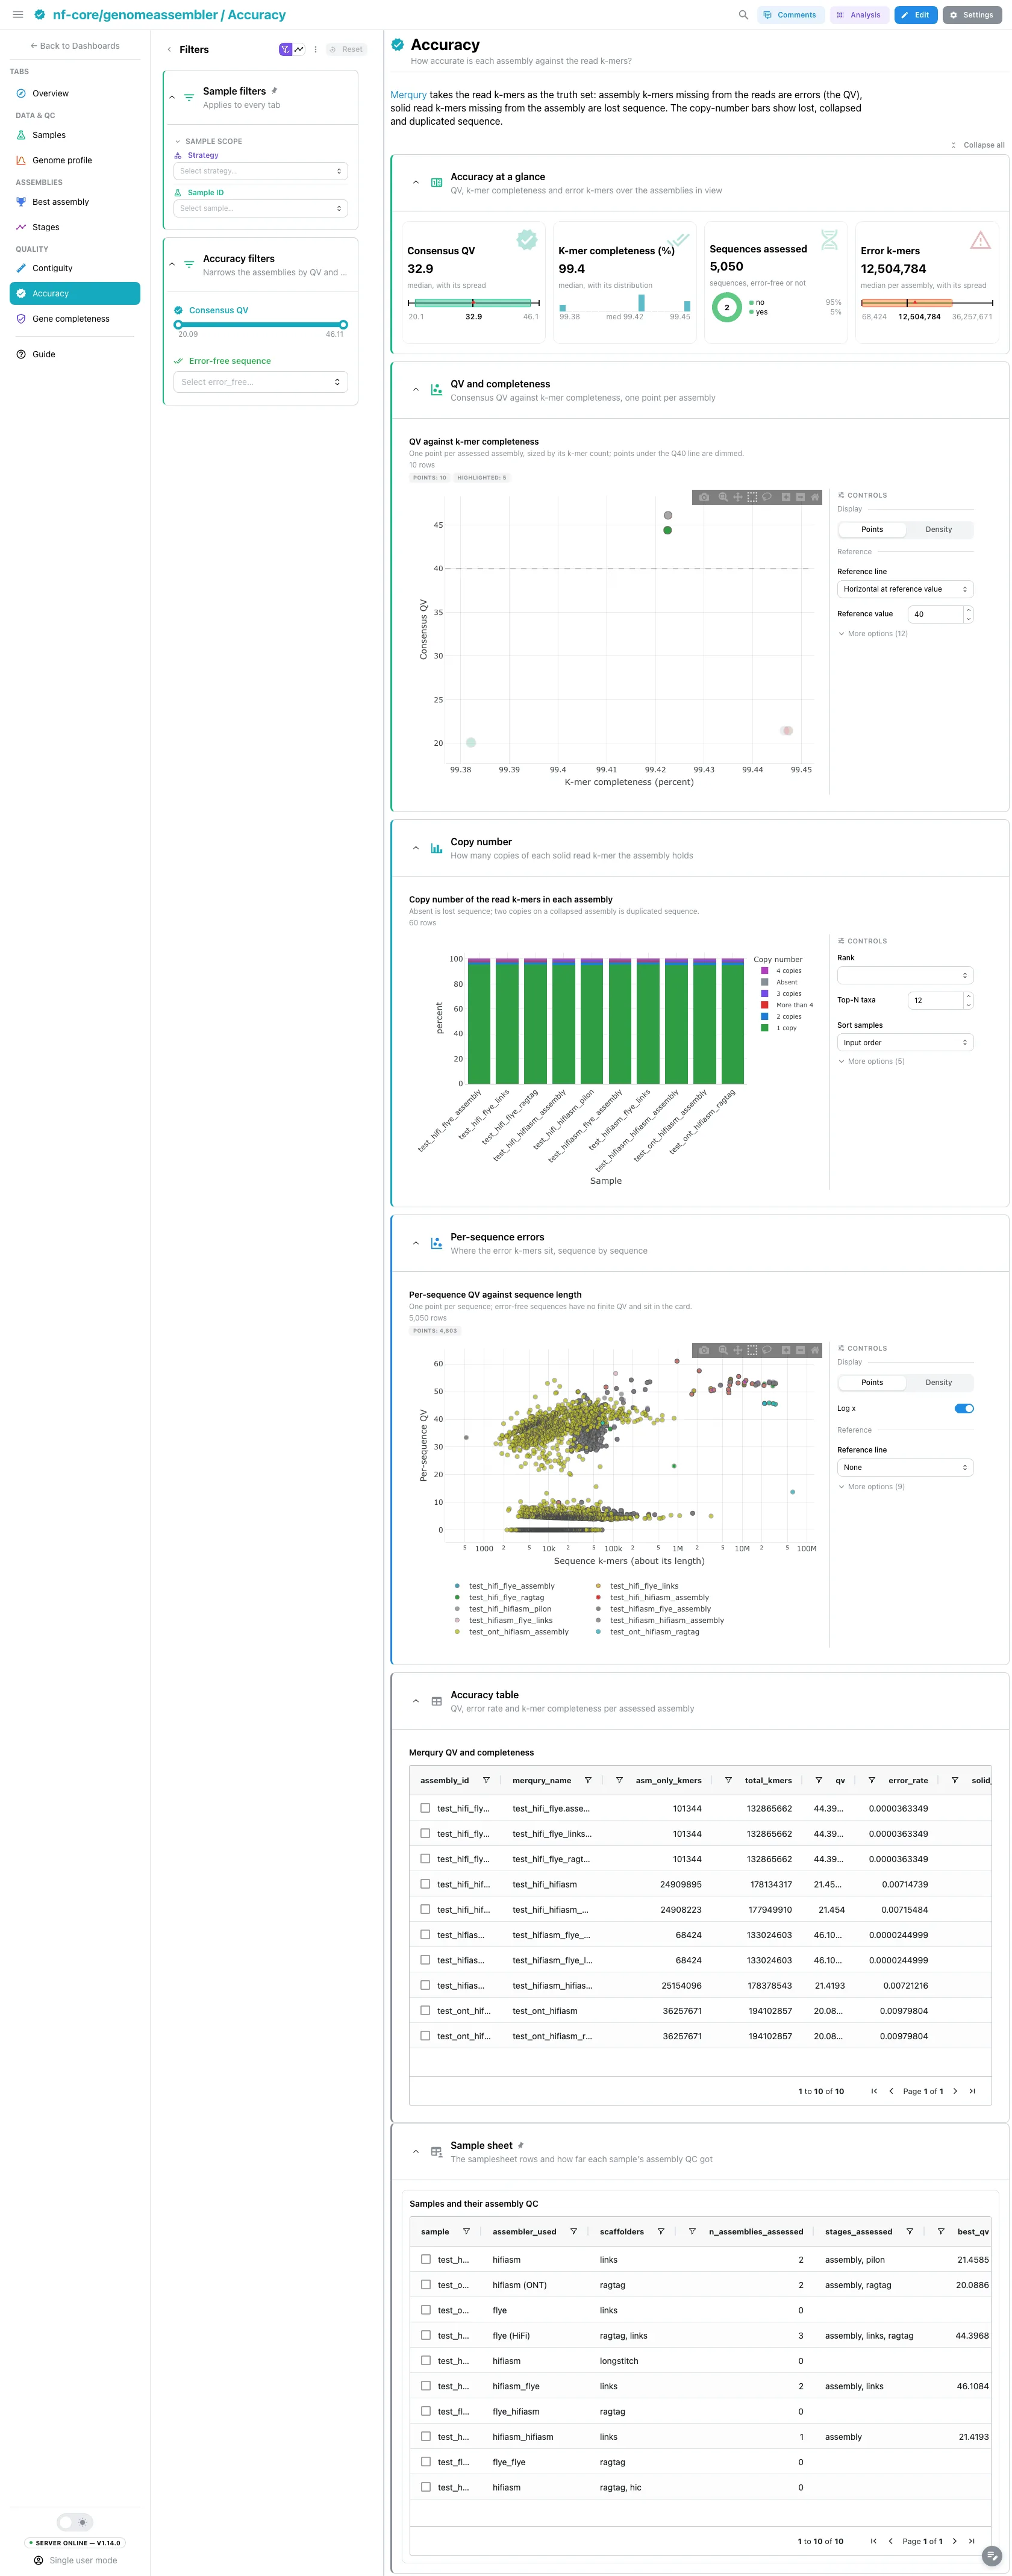
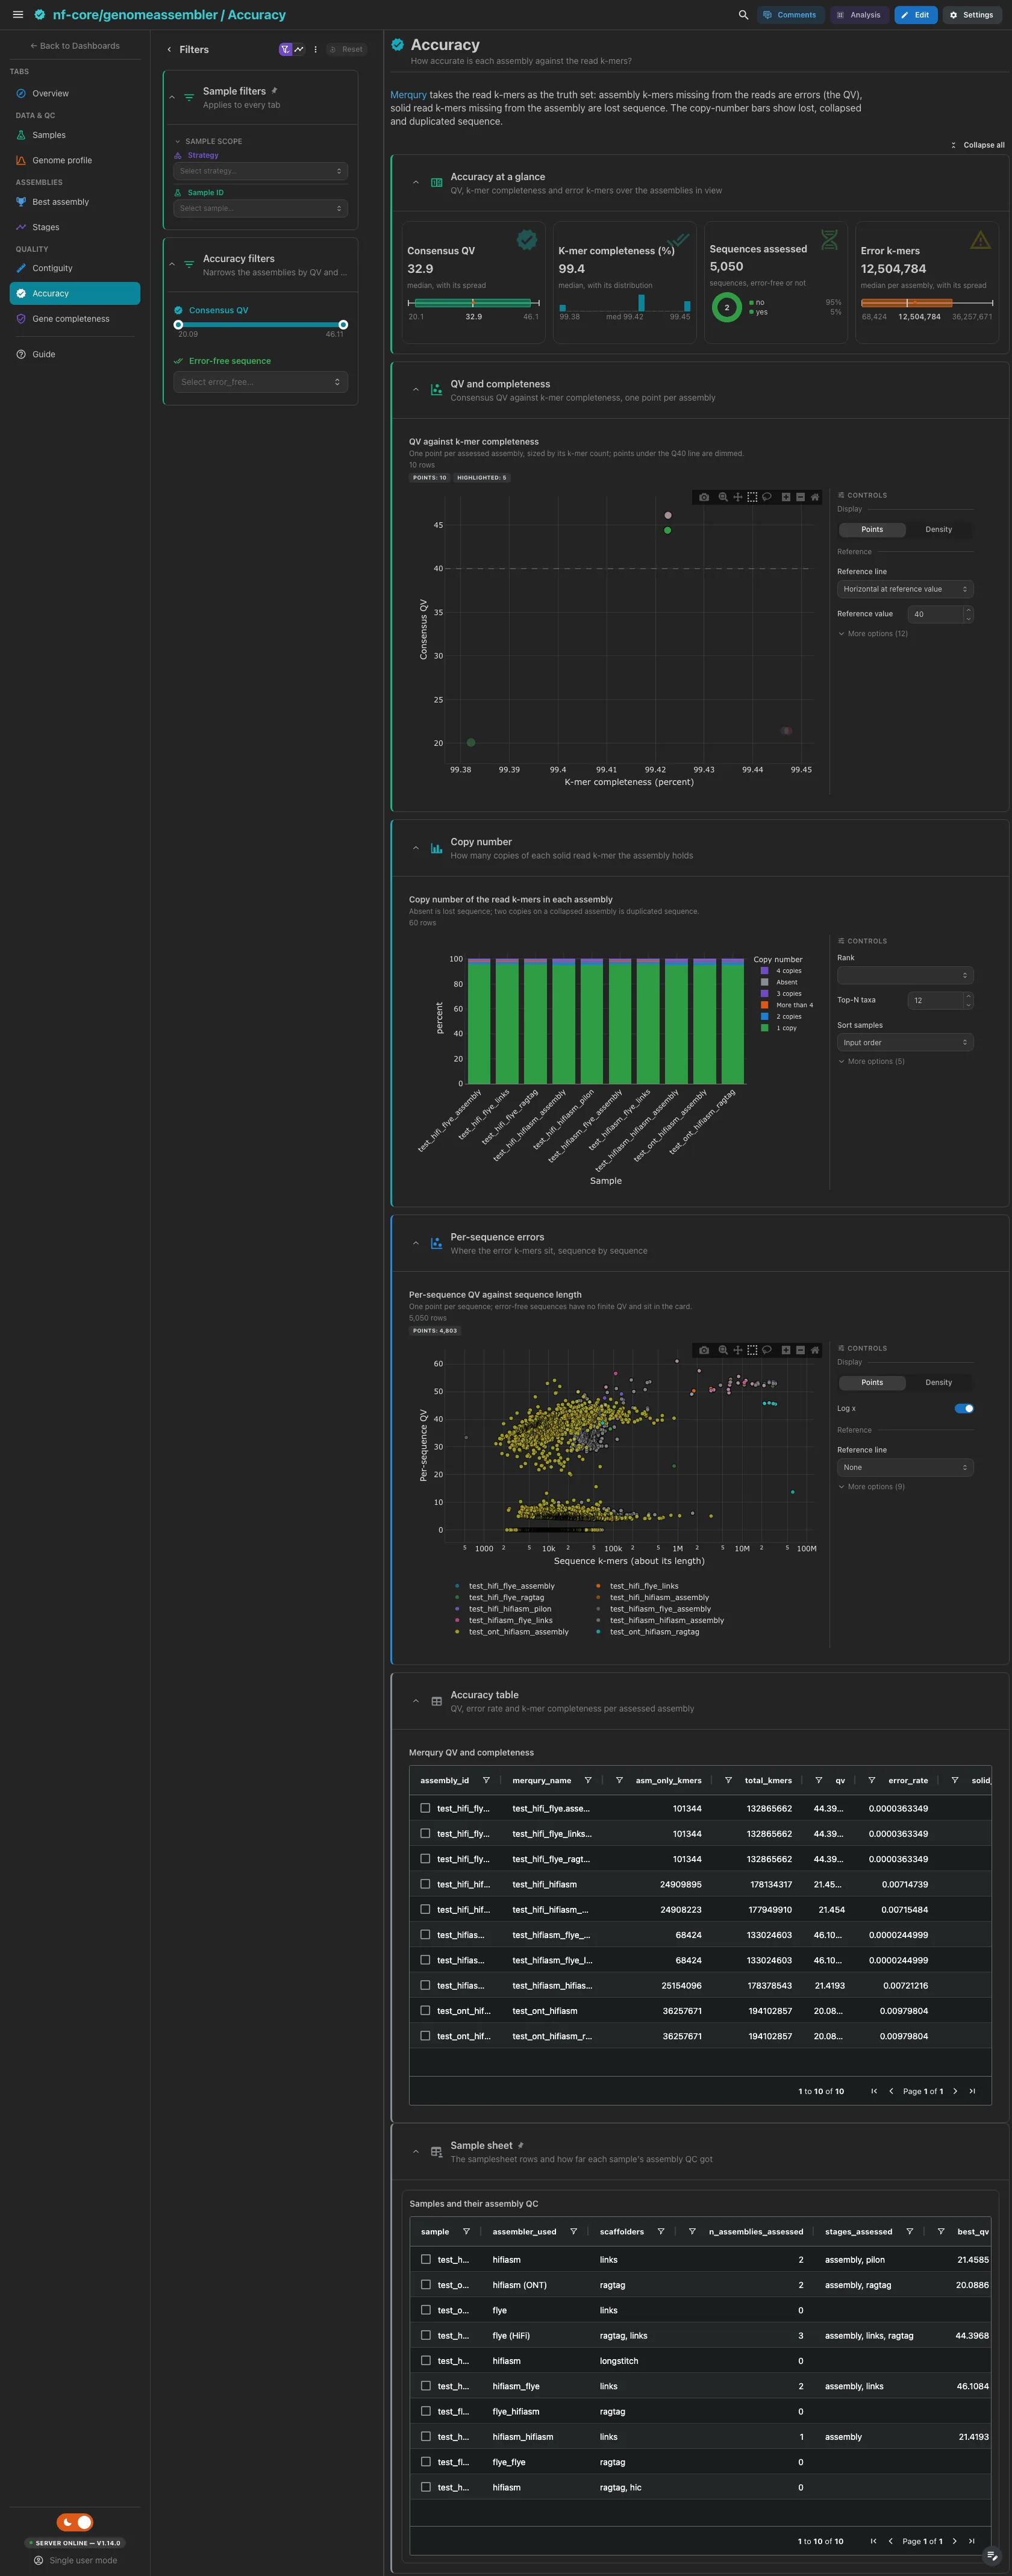
The median consensus QV, the median k-mer completeness, the sequences Merqury scored (a ring, error-free or not) and the median error k-mers per assembly. Then QV against k-mer completeness, with a line at Q40 and the points under it dimmed, and the copy number of the read k-mers in each assembly. Merqury takes the read k-mers as the truth set: assembly k-mers missing from the reads are errors (the QV), solid read k-mers missing from the assembly are lost sequence, and the copy-number bars show lost, collapsed and duplicated sequence. The per-sequence QV scatter and the Merqury table are collapsed.
Filters and components
Filters · a Consensus QV range on merqury_assembly_qv and
Error-free sequence on merqury_sequence_qv.
| Section | What it holds |
|---|---|
| Accuracy at a glance | 4 cards |
| QV and completeness | 1 advanced visualization |
| Copy number | 1 advanced visualization |
| Per-sequence errors (collapsed) | 1 advanced visualization |
| Accuracy table (collapsed) | Merqury QV and completeness |
Quality · How many conserved single-copy genes does each assembly hold?
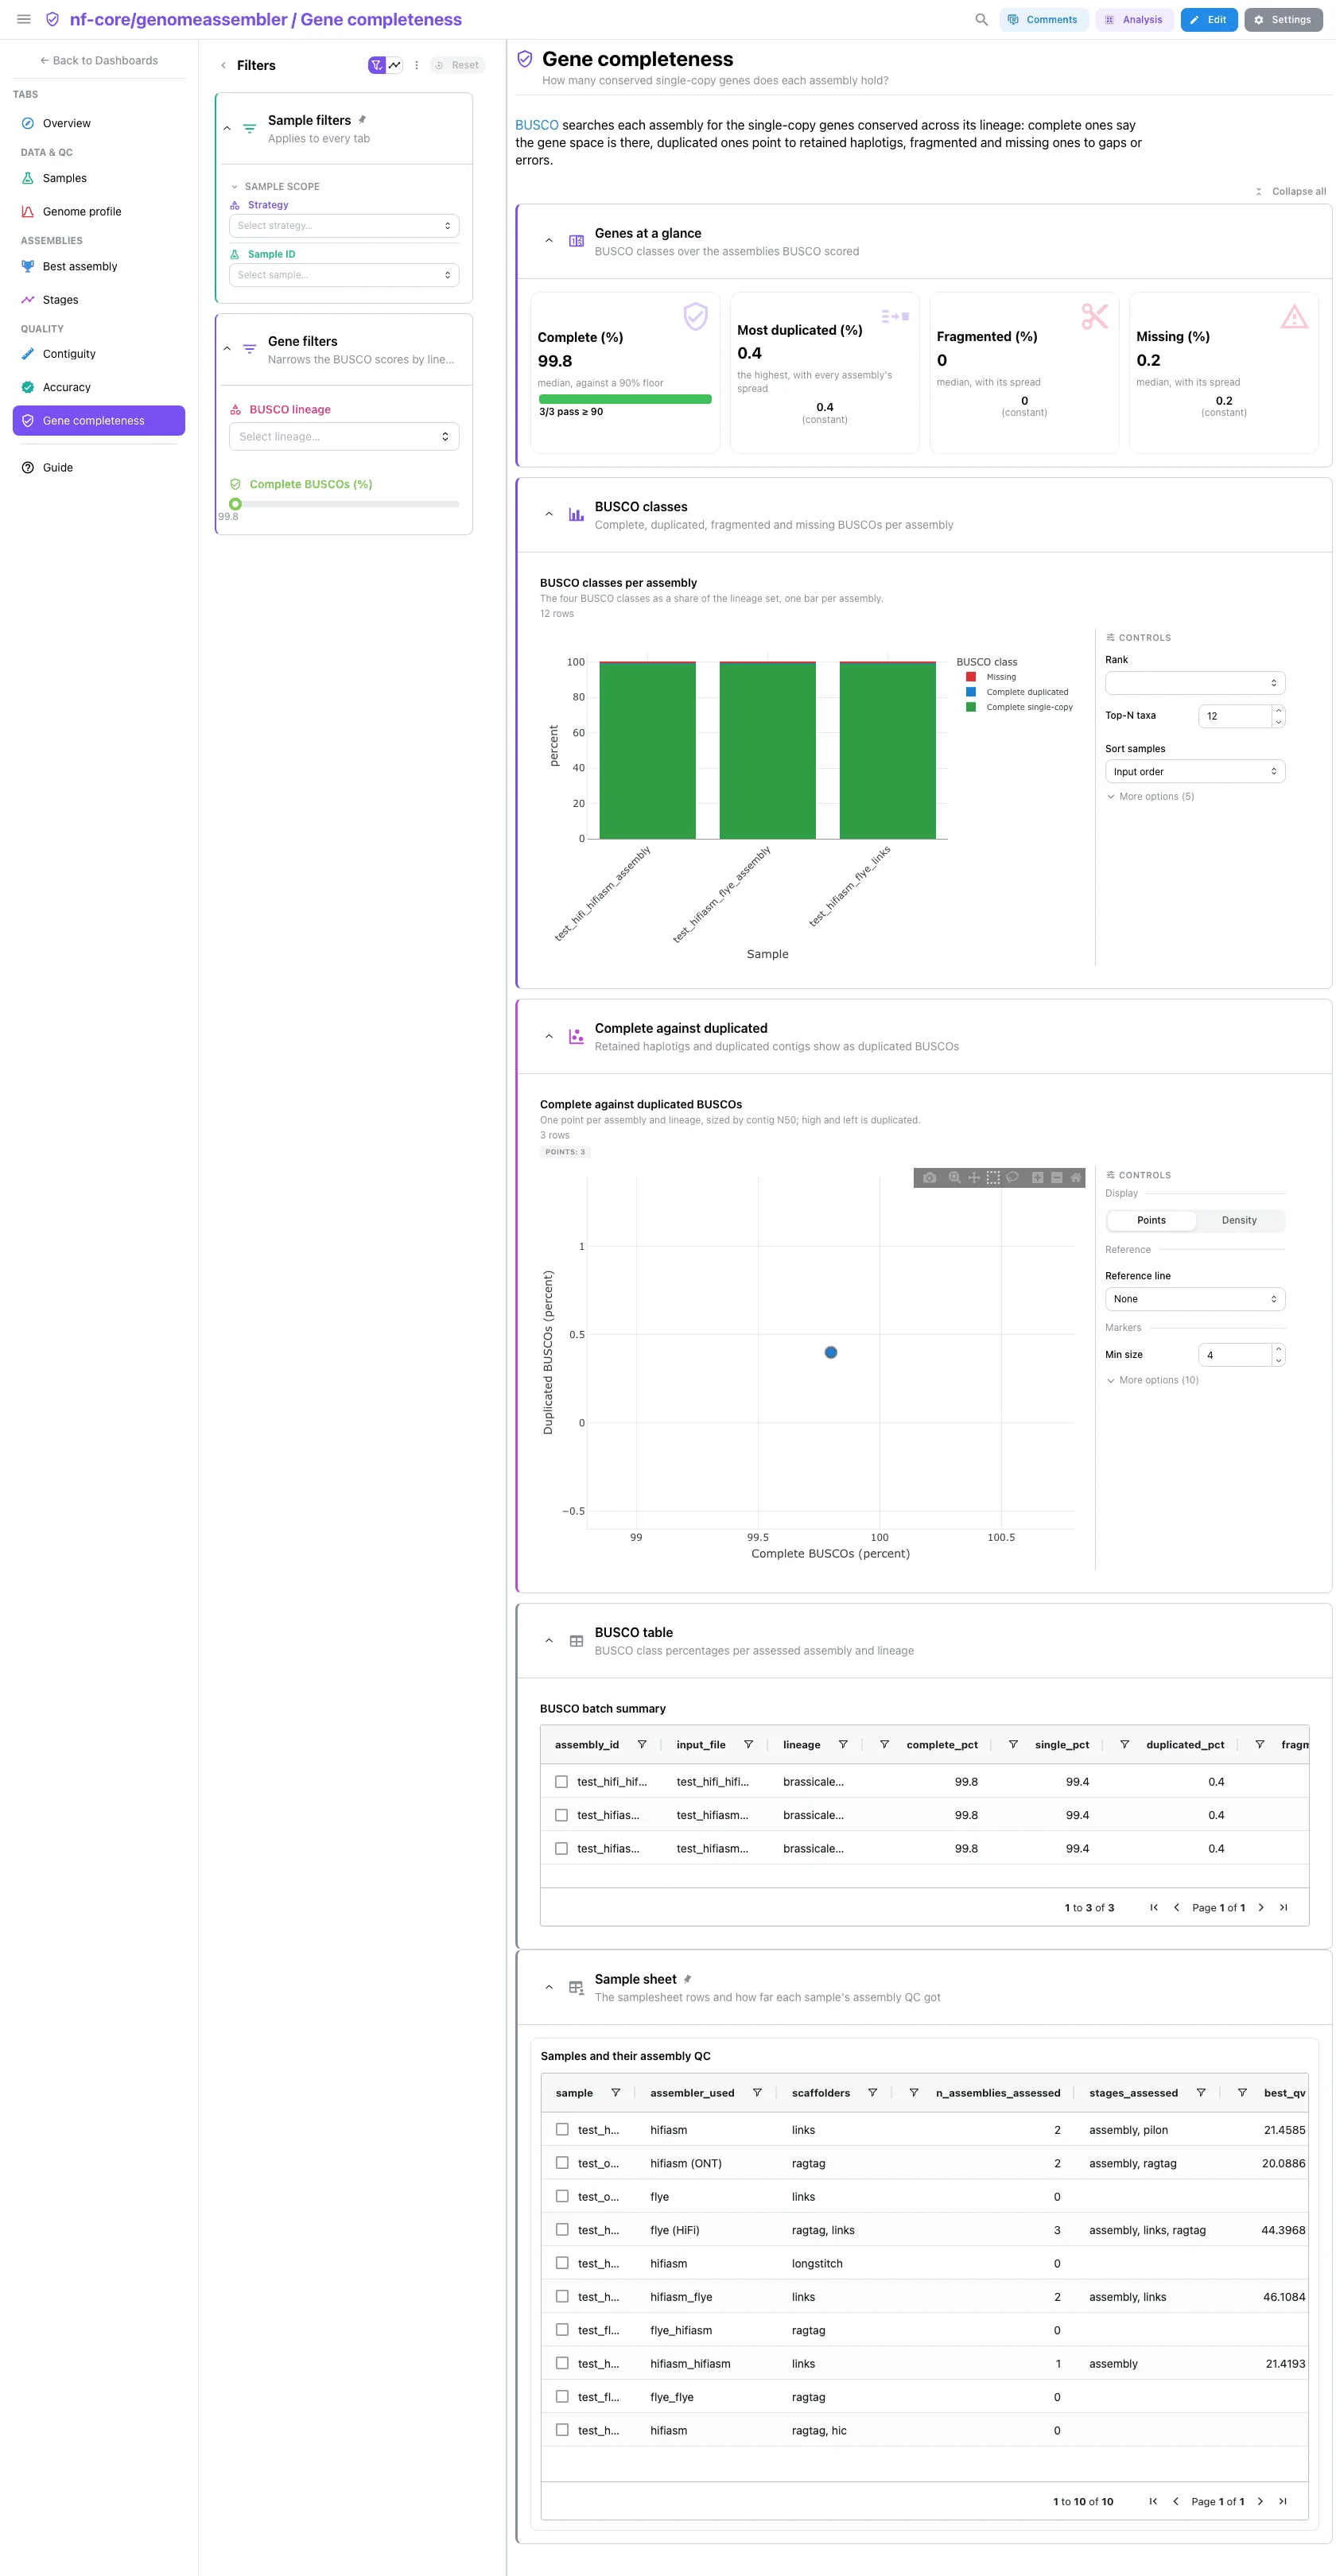
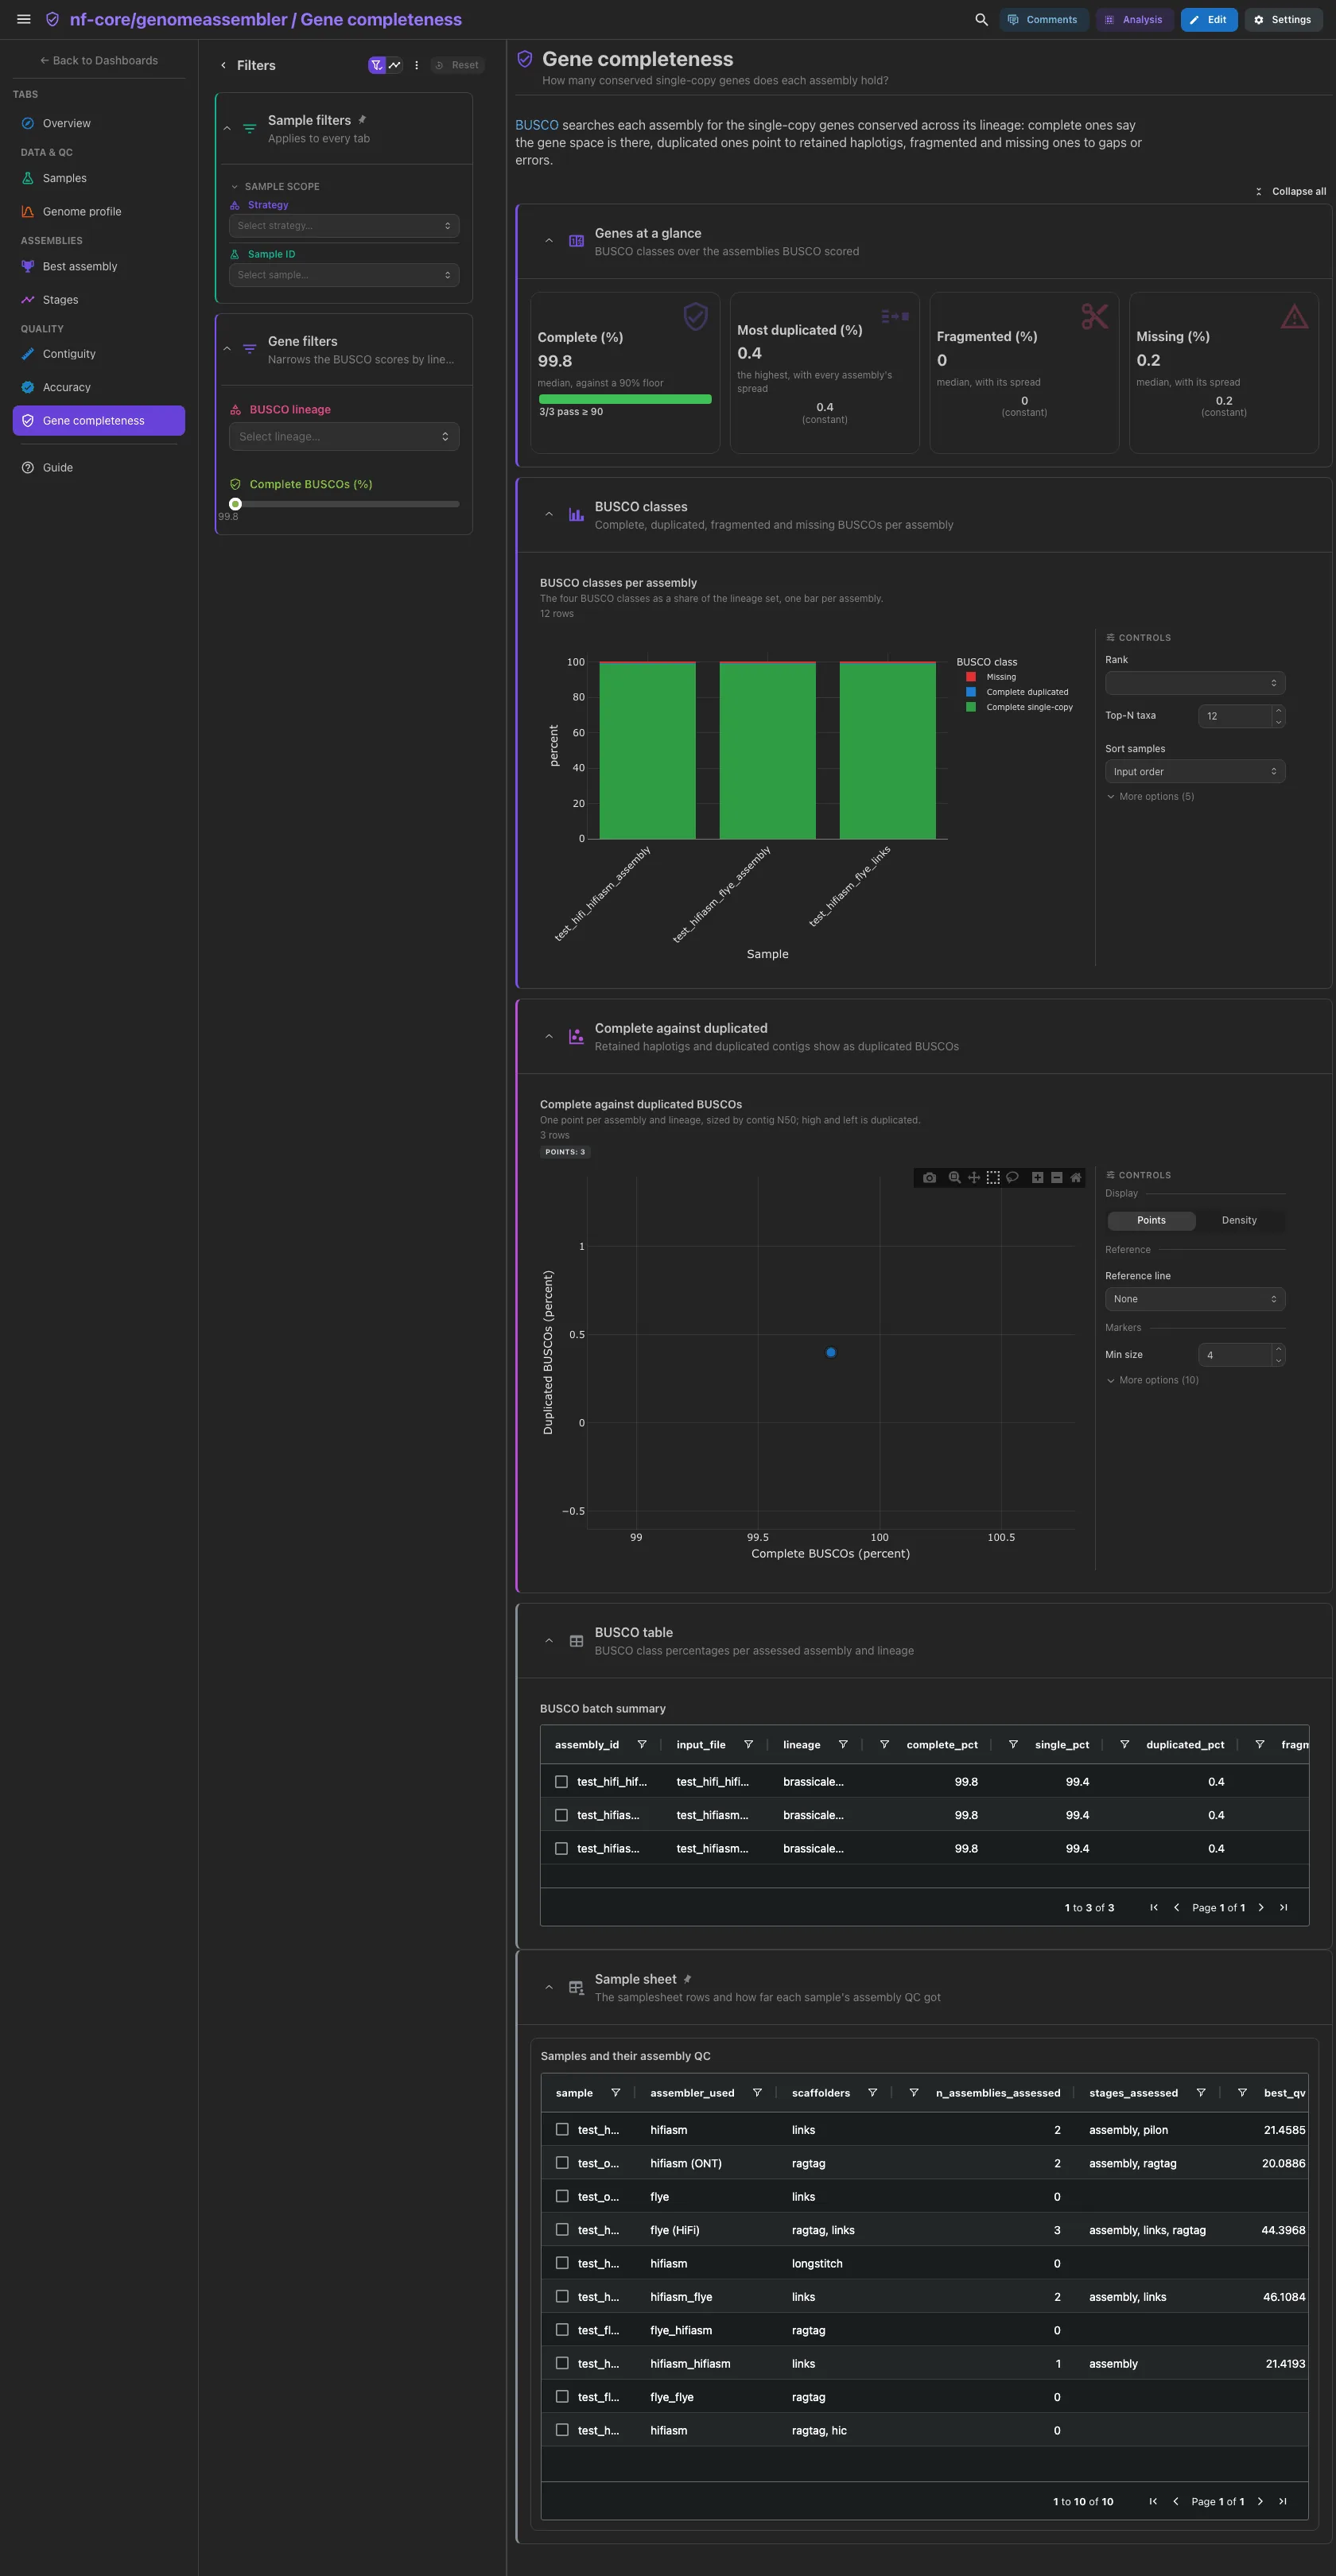
The median share of complete BUSCOs (counting the assemblies at 90% or above), the highest duplicated share, and the median fragmented and missing shares, each with its spread. Then the BUSCO classes per assembly and complete against duplicated BUSCOs. Complete BUSCOs say the gene space is there; duplicated ones point to retained haplotigs, fragmented and missing ones to gaps or errors. The BUSCO table is collapsed.
Filters and components
Filters · BUSCO lineage and a Complete BUSCOs (%) range on
busco_batch_summary.
| Section | What it holds |
|---|---|
| Genes at a glance | 4 cards |
| BUSCO classes | 1 advanced visualization |
| Complete against duplicated | 1 advanced visualization |
| BUSCO table (collapsed) | BUSCO batch summary |
Tables and points select on their entity column: every per-assembly tile (the
Best assembly scatter and table, the QUAST, Merqury and BUSCO scatters and tables,
the Nx curves) on assembly_id, the per-sequence QV scatter on sequence, the
stage profiles and the route table on route, the GenomeScope table on
read_set and the pinned sample sheet on sample. A pick narrows the other
tiles of its collection and follows the project links to the collections they
reach. The parallel coordinates, the k-mer spectrum, the length ladder, the
copy-number bars and the BUSCO class bars do not select.
Running the pipeline
Depictio reads the output of nf-core/genomeassembler, it does not run the
pipeline. Run the pipeline first; give it a reference (use_ref and
ref_fasta, see the usage docs) if you want QUAST's reference-based view:
nextflow run nf-core/genomeassembler -r 2.0.0 \
  --input samplesheet.csv \
  --busco_lineage <lineage>_odb12 \
  --outdir results -profile docker
Then copy the samplesheet under input/ and point Depictio at the results:
mkdir -p results/input && cp samplesheet.csv results/input/
depictio ingest results/ --template nf-core/genomeassembler/latest
See nf-co.re/genomeassembler/usage for full pipeline documentation.
Required data structure
Point depictio ingest at the directory holding the pipeline output. Depictio scans
recursively and matches on file name. The pipeline writes one directory per
sample, plus one per read group that holds the reads-only outputs.
<DATA_ROOT>/
├── input/
│   └── samplesheet.csv                          # the hub (METADATA_FILE default)
├── pipeline_info/
│   ├── params_*.json
│   └── *software*versions*.yml
├── <sample>/QC/
│   ├── alignments/<sample>_<stage>.idxstats      # sequence lengths: N50, L50, Nx
│   ├── merqury/*.qv, *.completeness.stats, *.spectra-cn.hist
│   ├── BUSCO/*-busco.batch_summary.txt
│   └── QUAST/<sample>_<stage>/transposed_report.tsv
└── <sample or group>/reads/genomescope/
    ├── genomescope/*_genomescope.txt
    └── jellyfish/histo/*_hist.tsv
METADATA_ID_COL (default sample) is the column every output directory is
named after. The assemblies themselves, the BAM files and the BUSCO run
directories are not read.
Validation runs
The template was validated against the AWS megatest of the 2.0.0 release
(results-a72d47d9cdb50f21b97882dfb2abf4af8f4c74ad, the full test samplesheet
without medaka), and the screenshots above come from it. That run is partial:
LINKS failed on one sample and the tasks aborted after it, so only half of the
samples reached assembly QC, QUAST and BUSCO ran on a few assemblies, and only
the raw, LINKS and RagTag stages carry data. The polishing stages and Hi-C
scaffolding are wired by name but not yet verified on data. megatest.yaml
lists the tables-only subset, and the download script also places the vendored
samplesheet under input/:
bash depictio/projects/nf-core/genomeassembler/2.0.0/download_test_data.sh /tmp/genomeassembler_test
depictio ingest /tmp/genomeassembler_test --template nf-core/genomeassembler/latest
Do not pass --project when ingesting: the dashboard is attached to the
project by name, so renaming it breaks a later depictio dashboard import.
Re-ingesting accumulates dashboards, so delete the project before repeating a run.
Additional resources
- nf-co.re/genomeassembler: official pipeline documentation
- nf-co.re/genomeassembler/2.0.0/results: AWS test results
- Template System Reference: YAML format, variables, conditionals
- Recipes: how to read, test, and write recipes
Authorship
 weber8thomas
Reviewing a template on your own data, or taking over a role here, is a contribution in itself: the contributing guide says what each one involves.