nf-core/ampliseq

nf-core pipeline · nf-co.re/ampliseq
The ampliseq template covers the main outputs of a standard nf-core/ampliseq run:
- MultiQC quality control — FastQC read quality, Cutadapt trimming statistics
- Taxonomy composition — phylum-level barplots, sunburst, heatmap with annotations
- Alpha diversity — Faith's Phylogenetic Diversity, rarefaction curves (requires metadata)
- Differential abundance — ANCOM-BC volcano plots, log-fold change (requires metadata +
--ancombc) - Sampling locations — geographic scatter map from metadata coordinates (requires metadata)
Quick start
Template variables
| Variable | Required | Auto | Description |
|---|---|---|---|
DATA_ROOT |
— | Pipeline output root (set via --data-root) |
|
SAMPLESHEET_FILE |
— | Path to ampliseq samplesheet CSV | |
METADATA_FILE |
— | — | Sample metadata TSV. Enables extended mode. |
GROUP_COL |
— | Grouping column for facetting. Auto: first annotation column. | |
GROUP_COL_DISPLAY |
— | Title-cased GROUP_COL for chart labels | |
ANNOTATION_COLS |
— | All annotation columns from metadata |
Data collections
| Data Collection | Type | Recipe | Base | Extended |
|---|---|---|---|---|
multiqc_data |
MultiQC | — | ||
samplesheet |
Table | — | ||
taxonomy_composition |
Table | taxonomy_composition.py |
||
taxonomy_rel_abundance |
Table | taxonomy_rel_abundance.py |
||
taxonomy_heatmap |
Table | taxonomy_heatmap.py |
||
metadata |
Table | — | ||
alpha_diversity |
Table | alpha_diversity.py |
||
alpha_rarefaction |
Table | alpha_rarefaction.py |
||
ancombc_results |
Table | ancombc.py |
Base vs Extended
No METADATA_FILE provided. The template removes metadata-dependent DCs (alpha diversity, rarefaction, ANCOM-BC) and imports a single dashboard with MultiQC + taxonomy composition.
Use when: Quick QC check, no sample metadata available, or testing the pipeline setup.
METADATA_FILE provided. All 9 DCs active. Dashboard includes facetted charts by GROUP_COL, sampling location map, heatmap with metadata annotations, and ANCOM-BC differential abundance.
Use when: Full analysis with sample grouping, geographic data, and differential abundance.
Dashboard tabs
The ampliseq dashboard ships as a six-tab funnel (MultiQC parent + five
child tabs). Filters propagate across tabs via cross-DC links on the
metadata sample column — see Cross-DC links below.
Quality control overview powered by MultiQC.
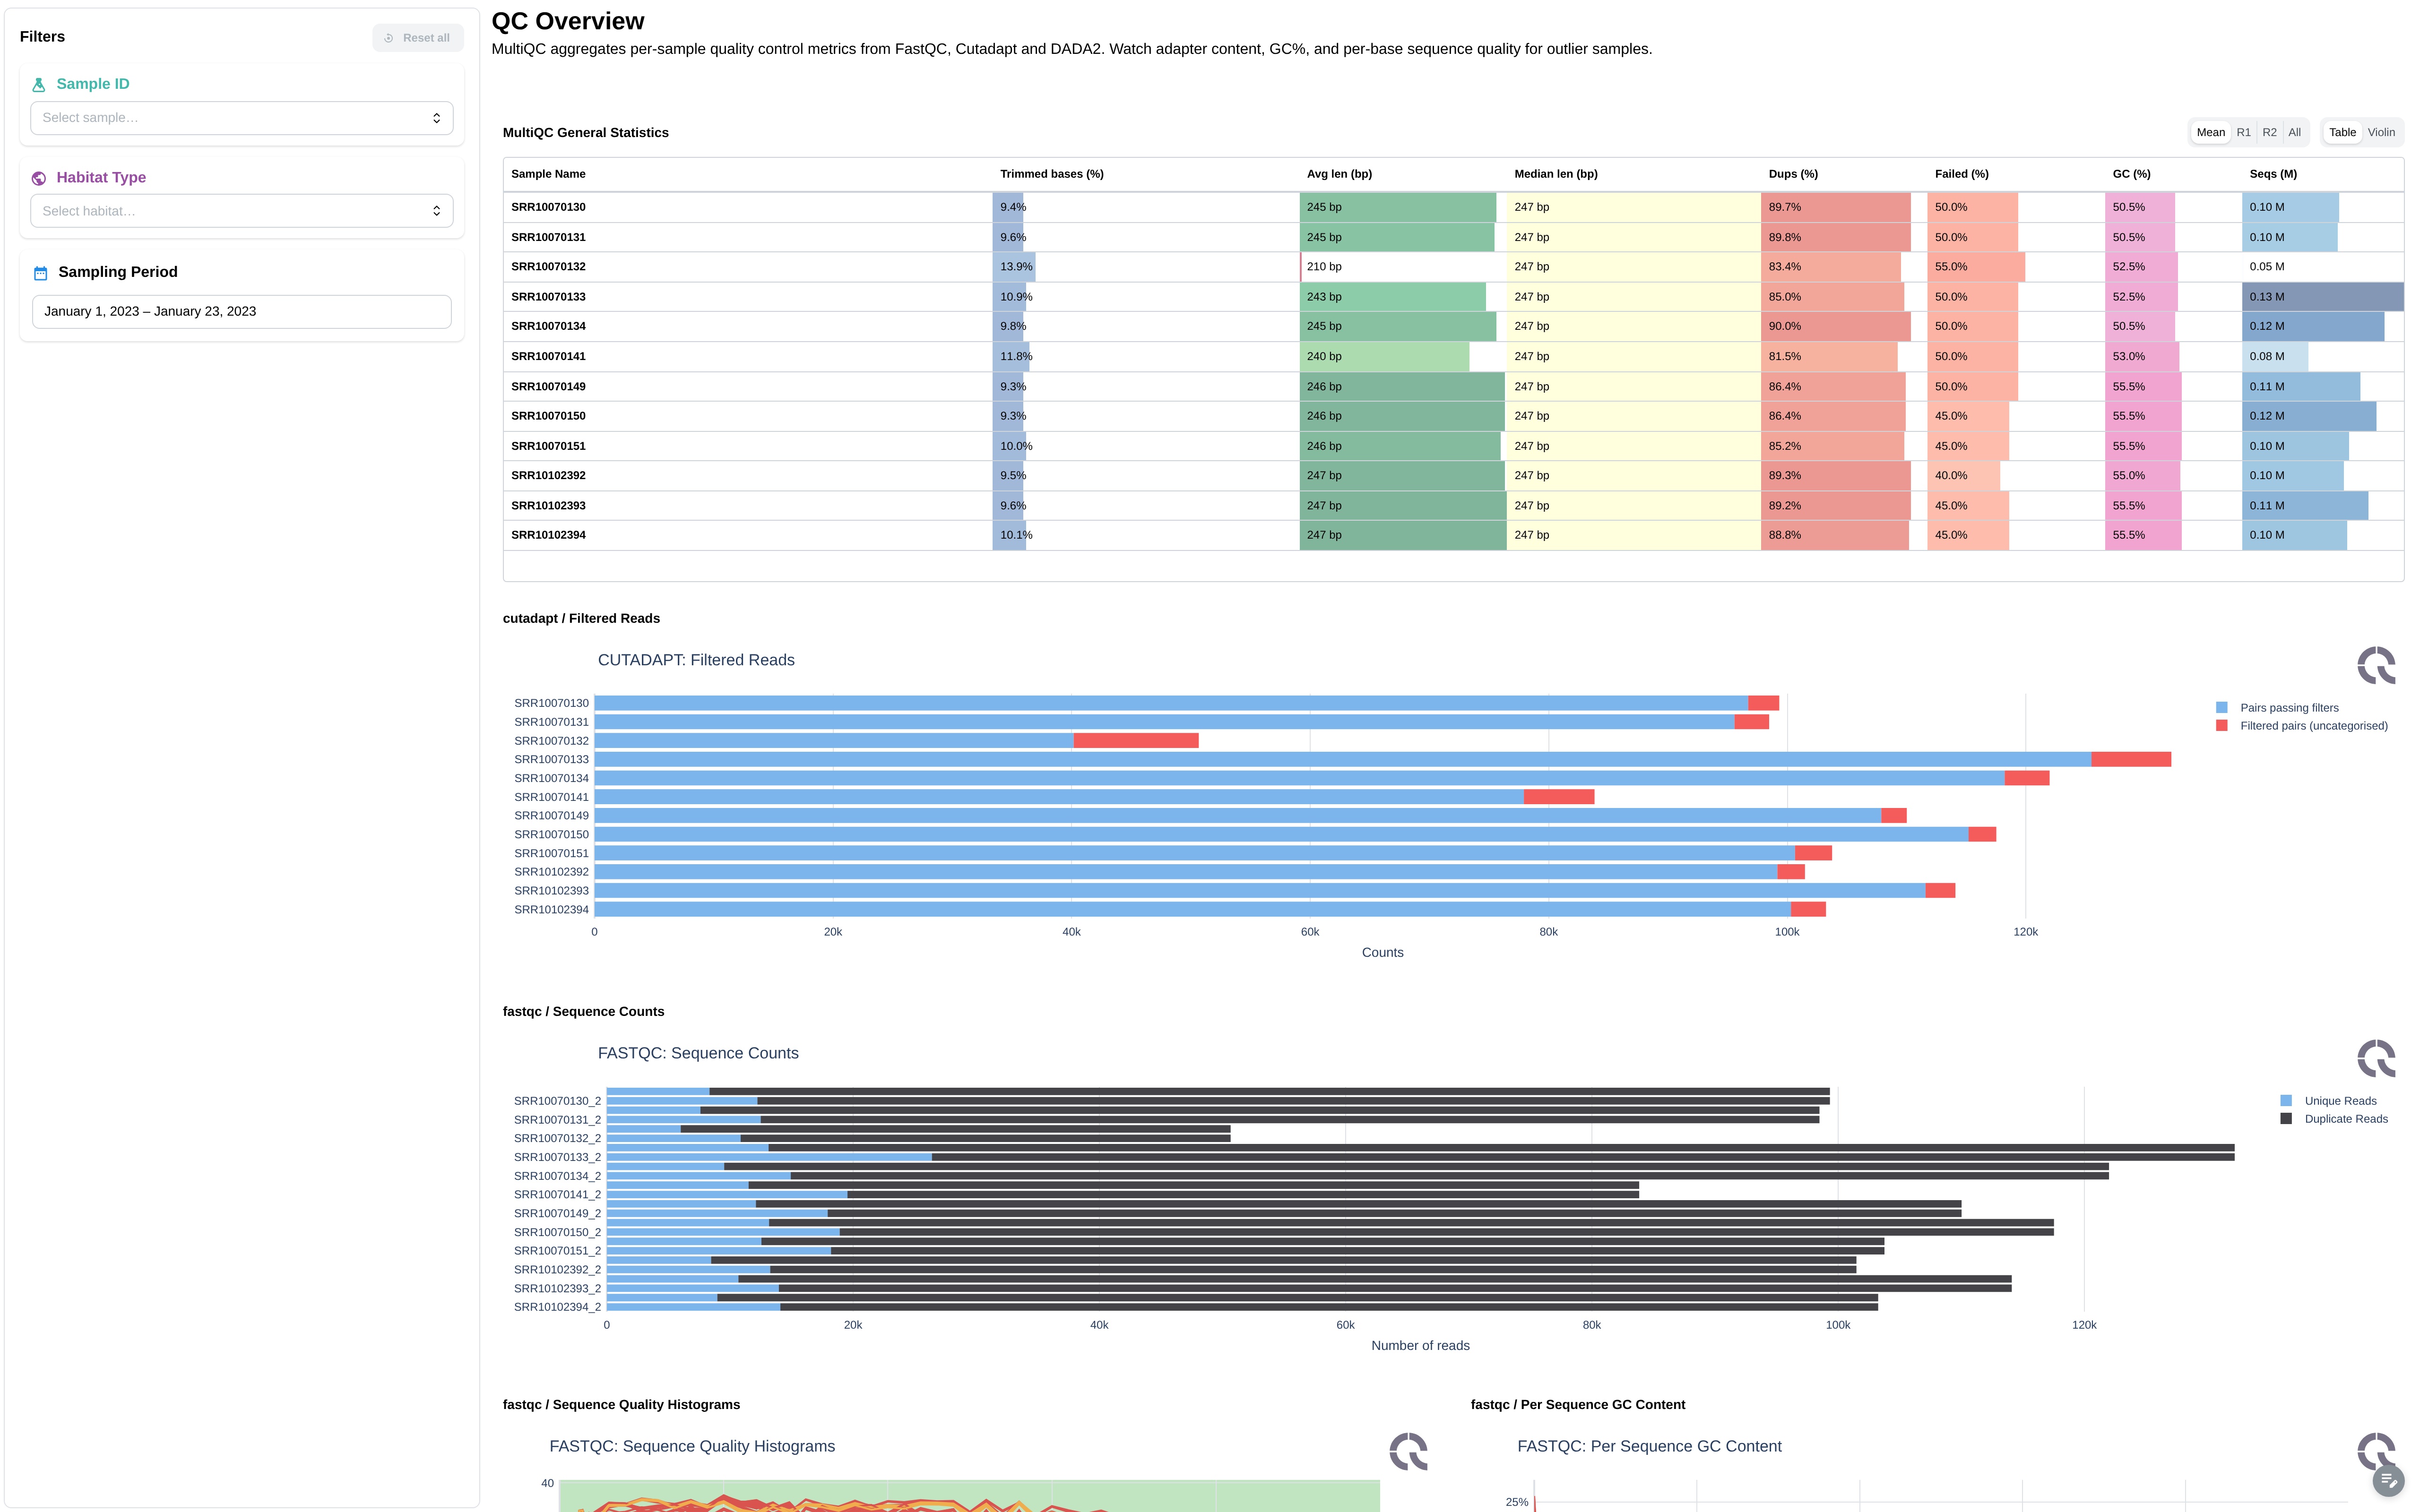
Filters: Sample ID, Habitat Type, Sampling Period (DatePicker).
Components:
- General stats table
- Cutadapt: filtered reads, trimmed sequence lengths
- FastQC: sequence counts, quality histograms, GC content, adapter content, status checks, Per-sequence quality / GC / N content, sequence duplication levels, length distribution
Within-sample diversity metrics, rarefaction, and per-habitat comparisons. Extended mode only.
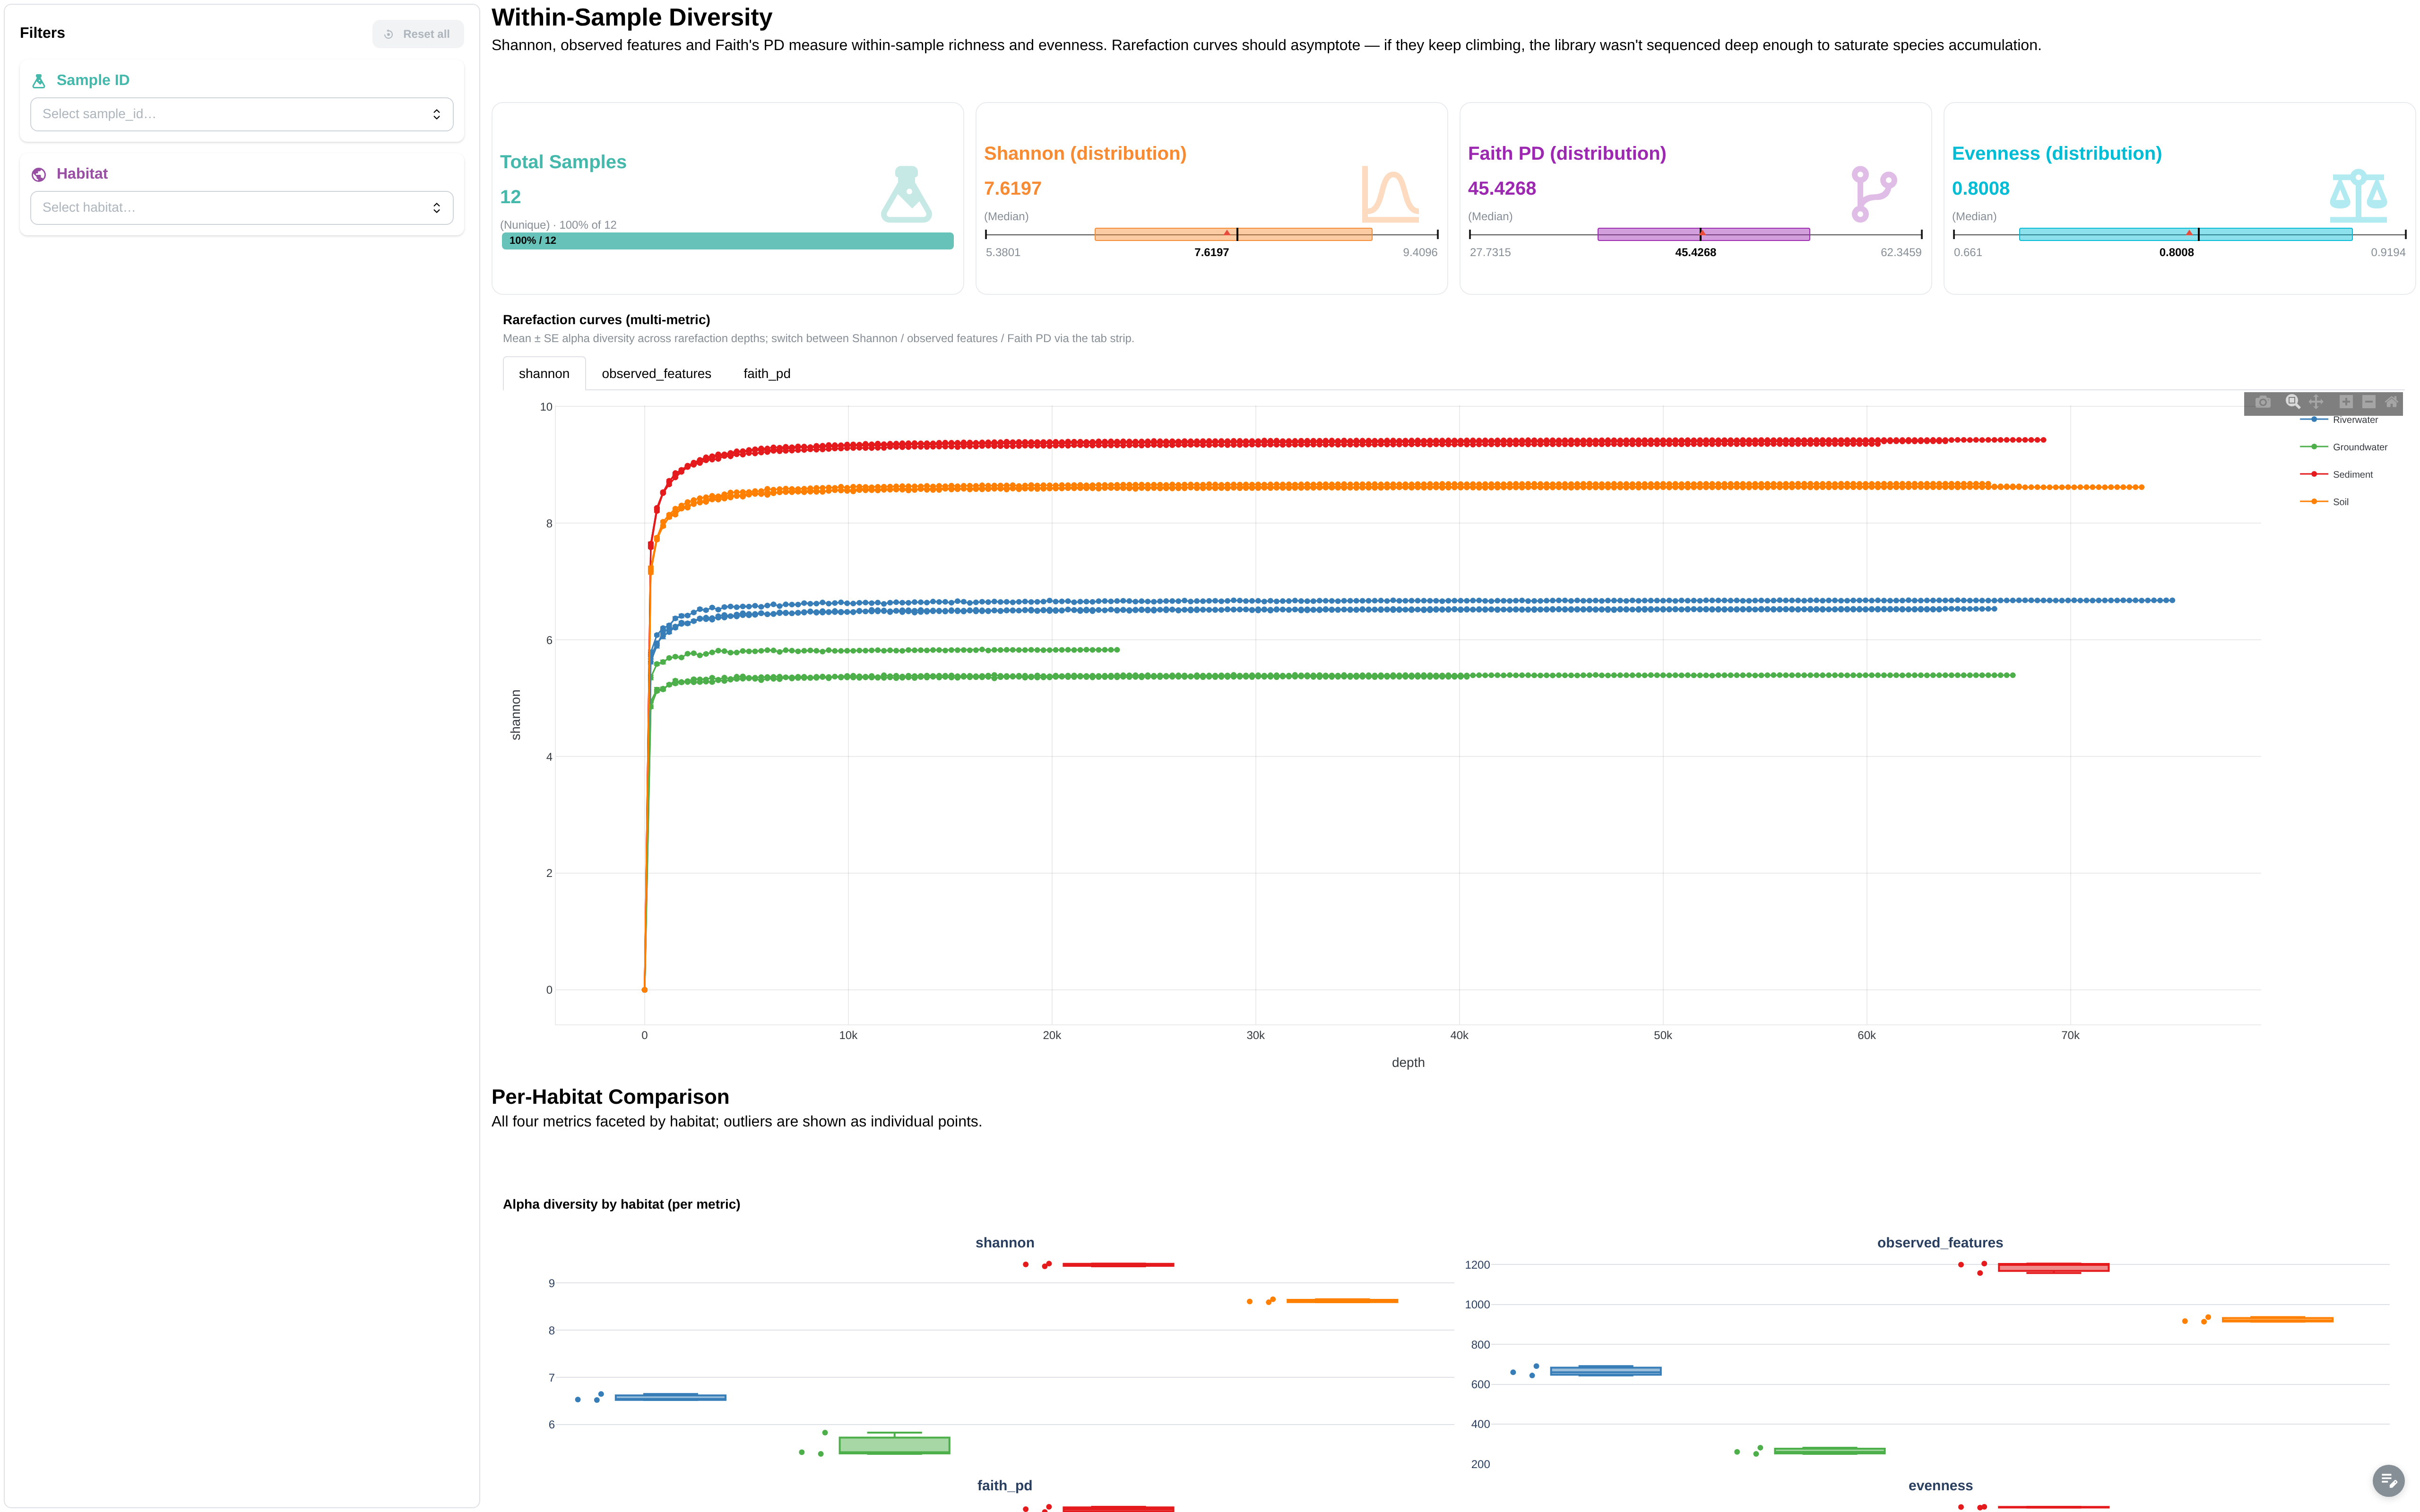
Filters: Sample ID, Habitat.
Components:
- 4 metric cards: Total Samples, Shannon (distribution), Faith PD (distribution), Evenness (distribution)
- Rarefaction curves (multi-metric) — advanced viz, filterable by habitat / sample via the in-tab DCLink
- Alpha diversity by habitat (per metric) — facetted boxplot
- Per-sample alpha diversity data table
Taxonomy composition + sampling-location map (extended mode).
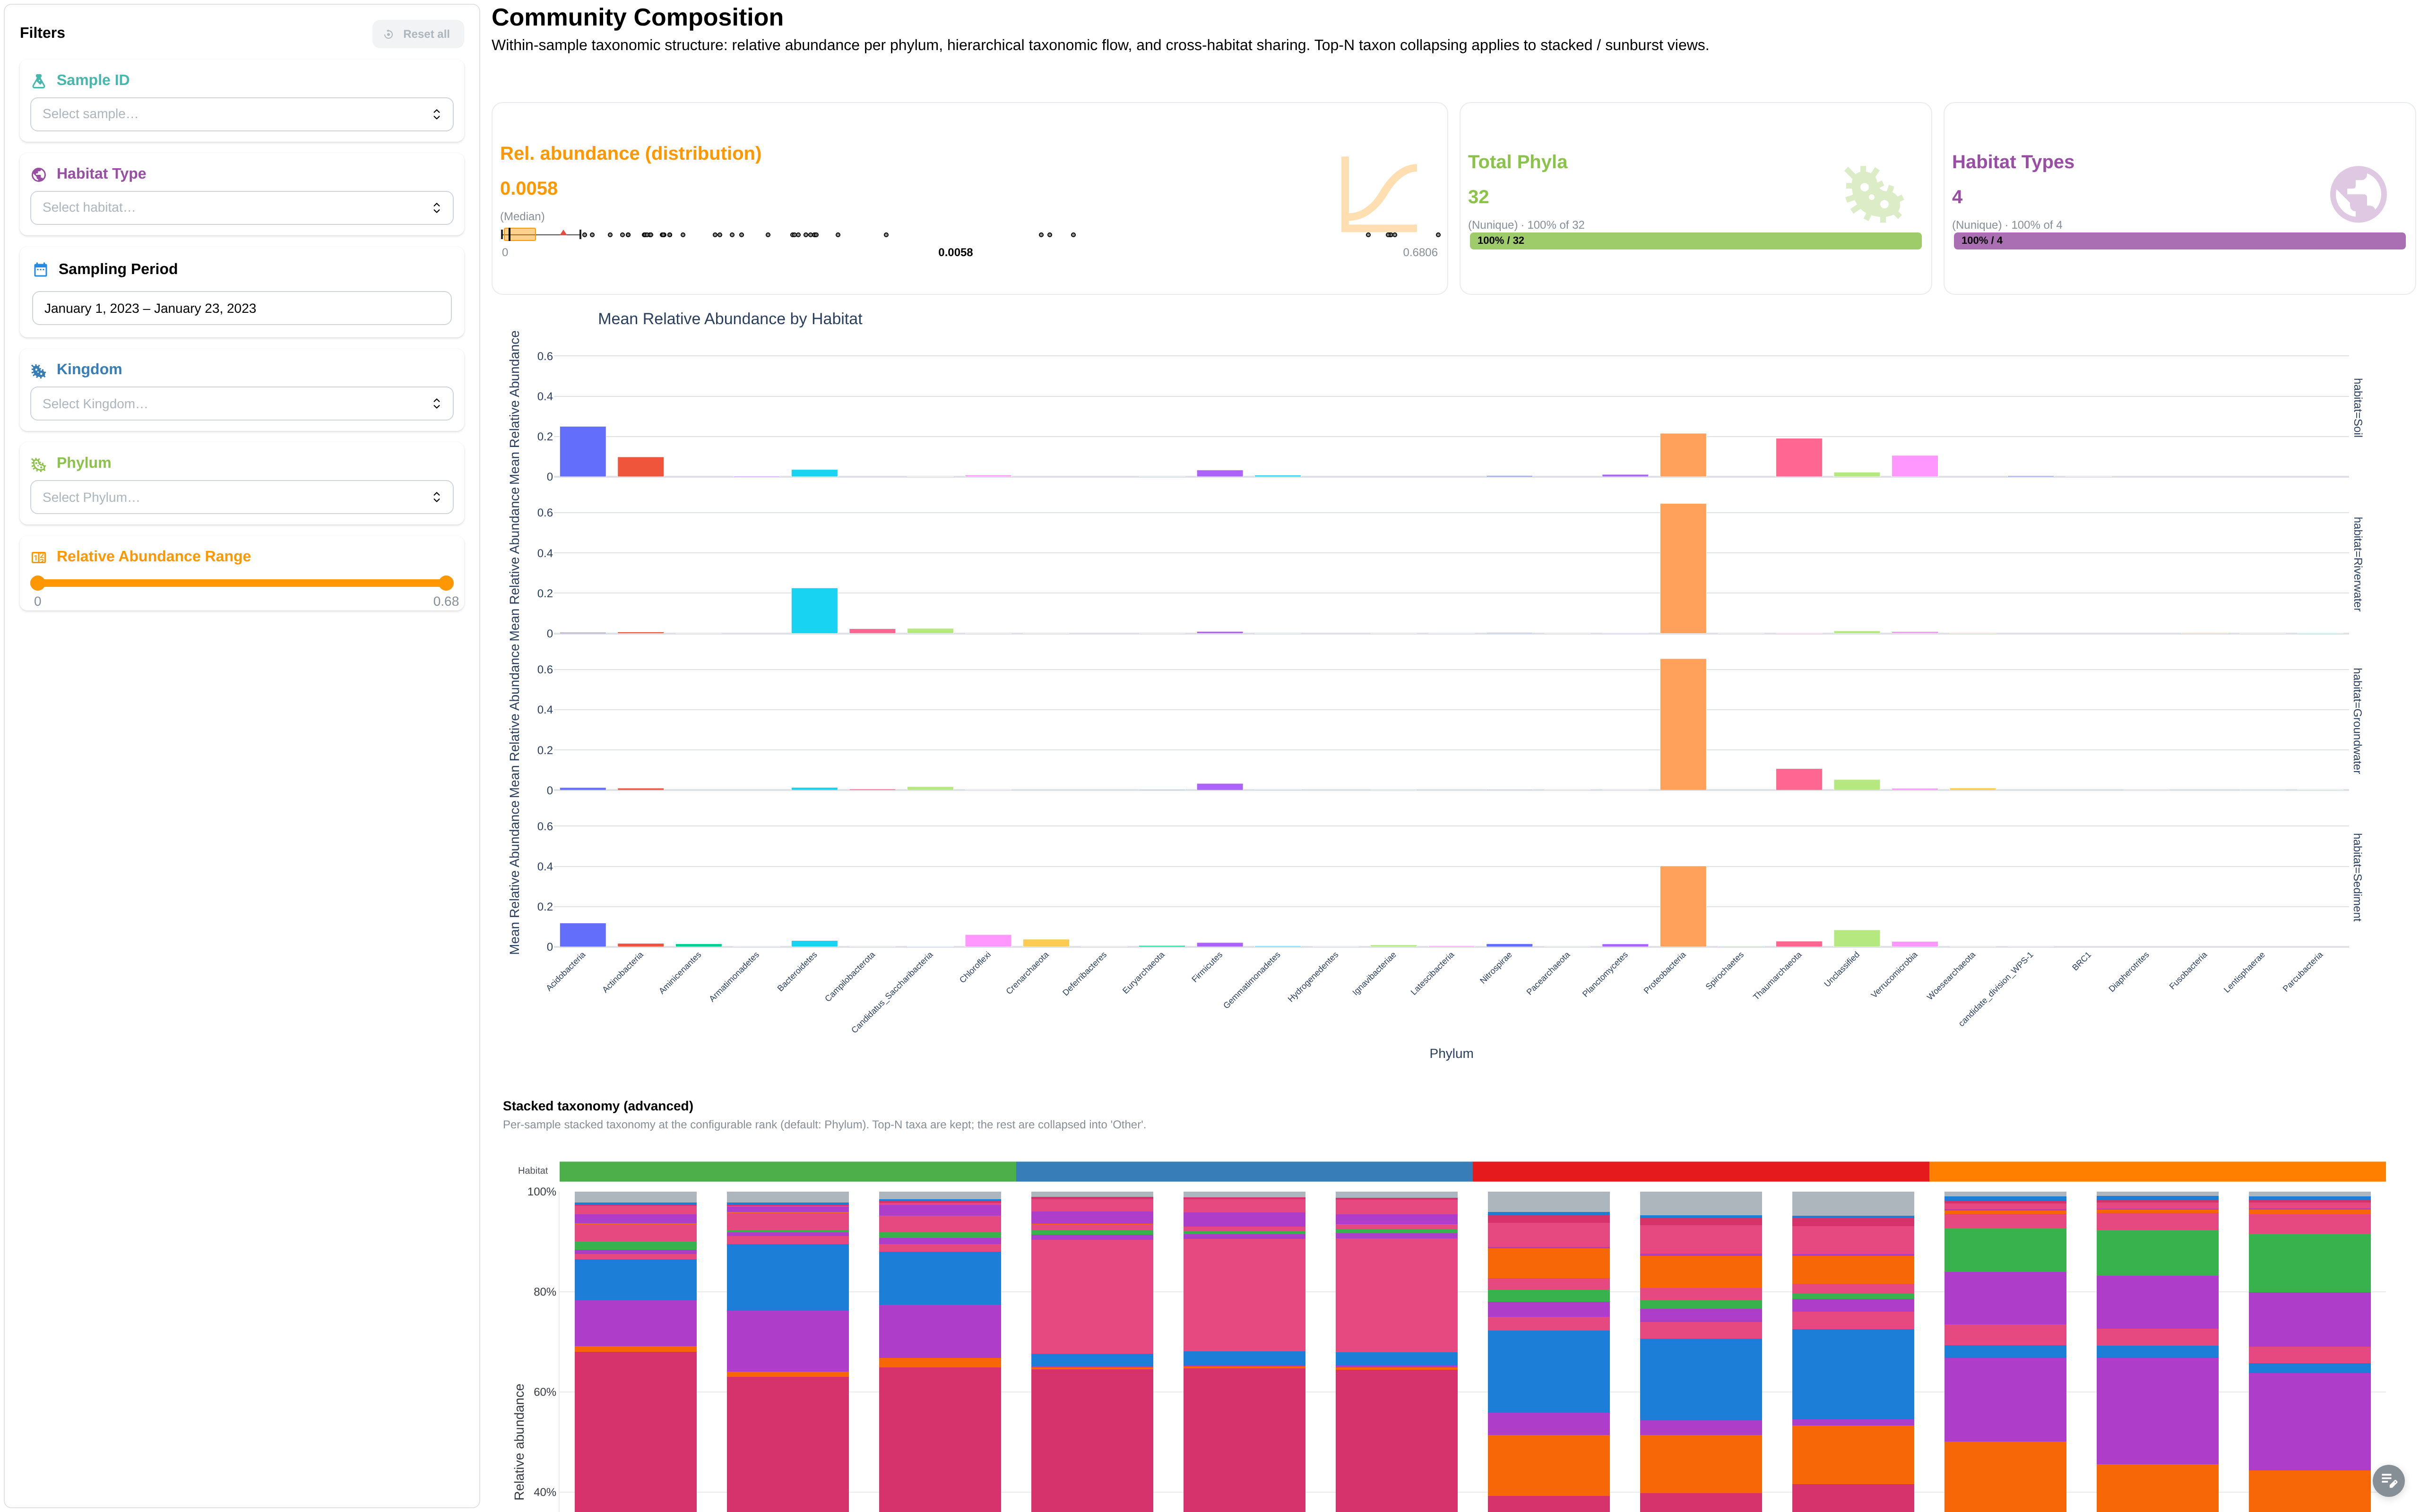
Components (base):
- Metric cards: total samples, total taxa, kingdoms, unique phyla
- Sunburst: Kingdom → Phylum hierarchy
- Mean relative abundance by Phylum (± std)
- Stacked bar: taxonomic composition per sample
- ComplexHeatmap: z-score normalized, clustered, with Kingdom row annotations
- Data table: taxonomy relative abundance
- Filters: Kingdom, Phylum, relative abundance range
Additional components (extended):
- Facetted bar charts by GROUP_COL
- Sampling locations scatter map
- Heatmap with habitat + city column annotations
- Filters: sampling period (DatePicker), GROUP_COL, sample ID
ANCOM-BC differential abundance results. Extended mode only.
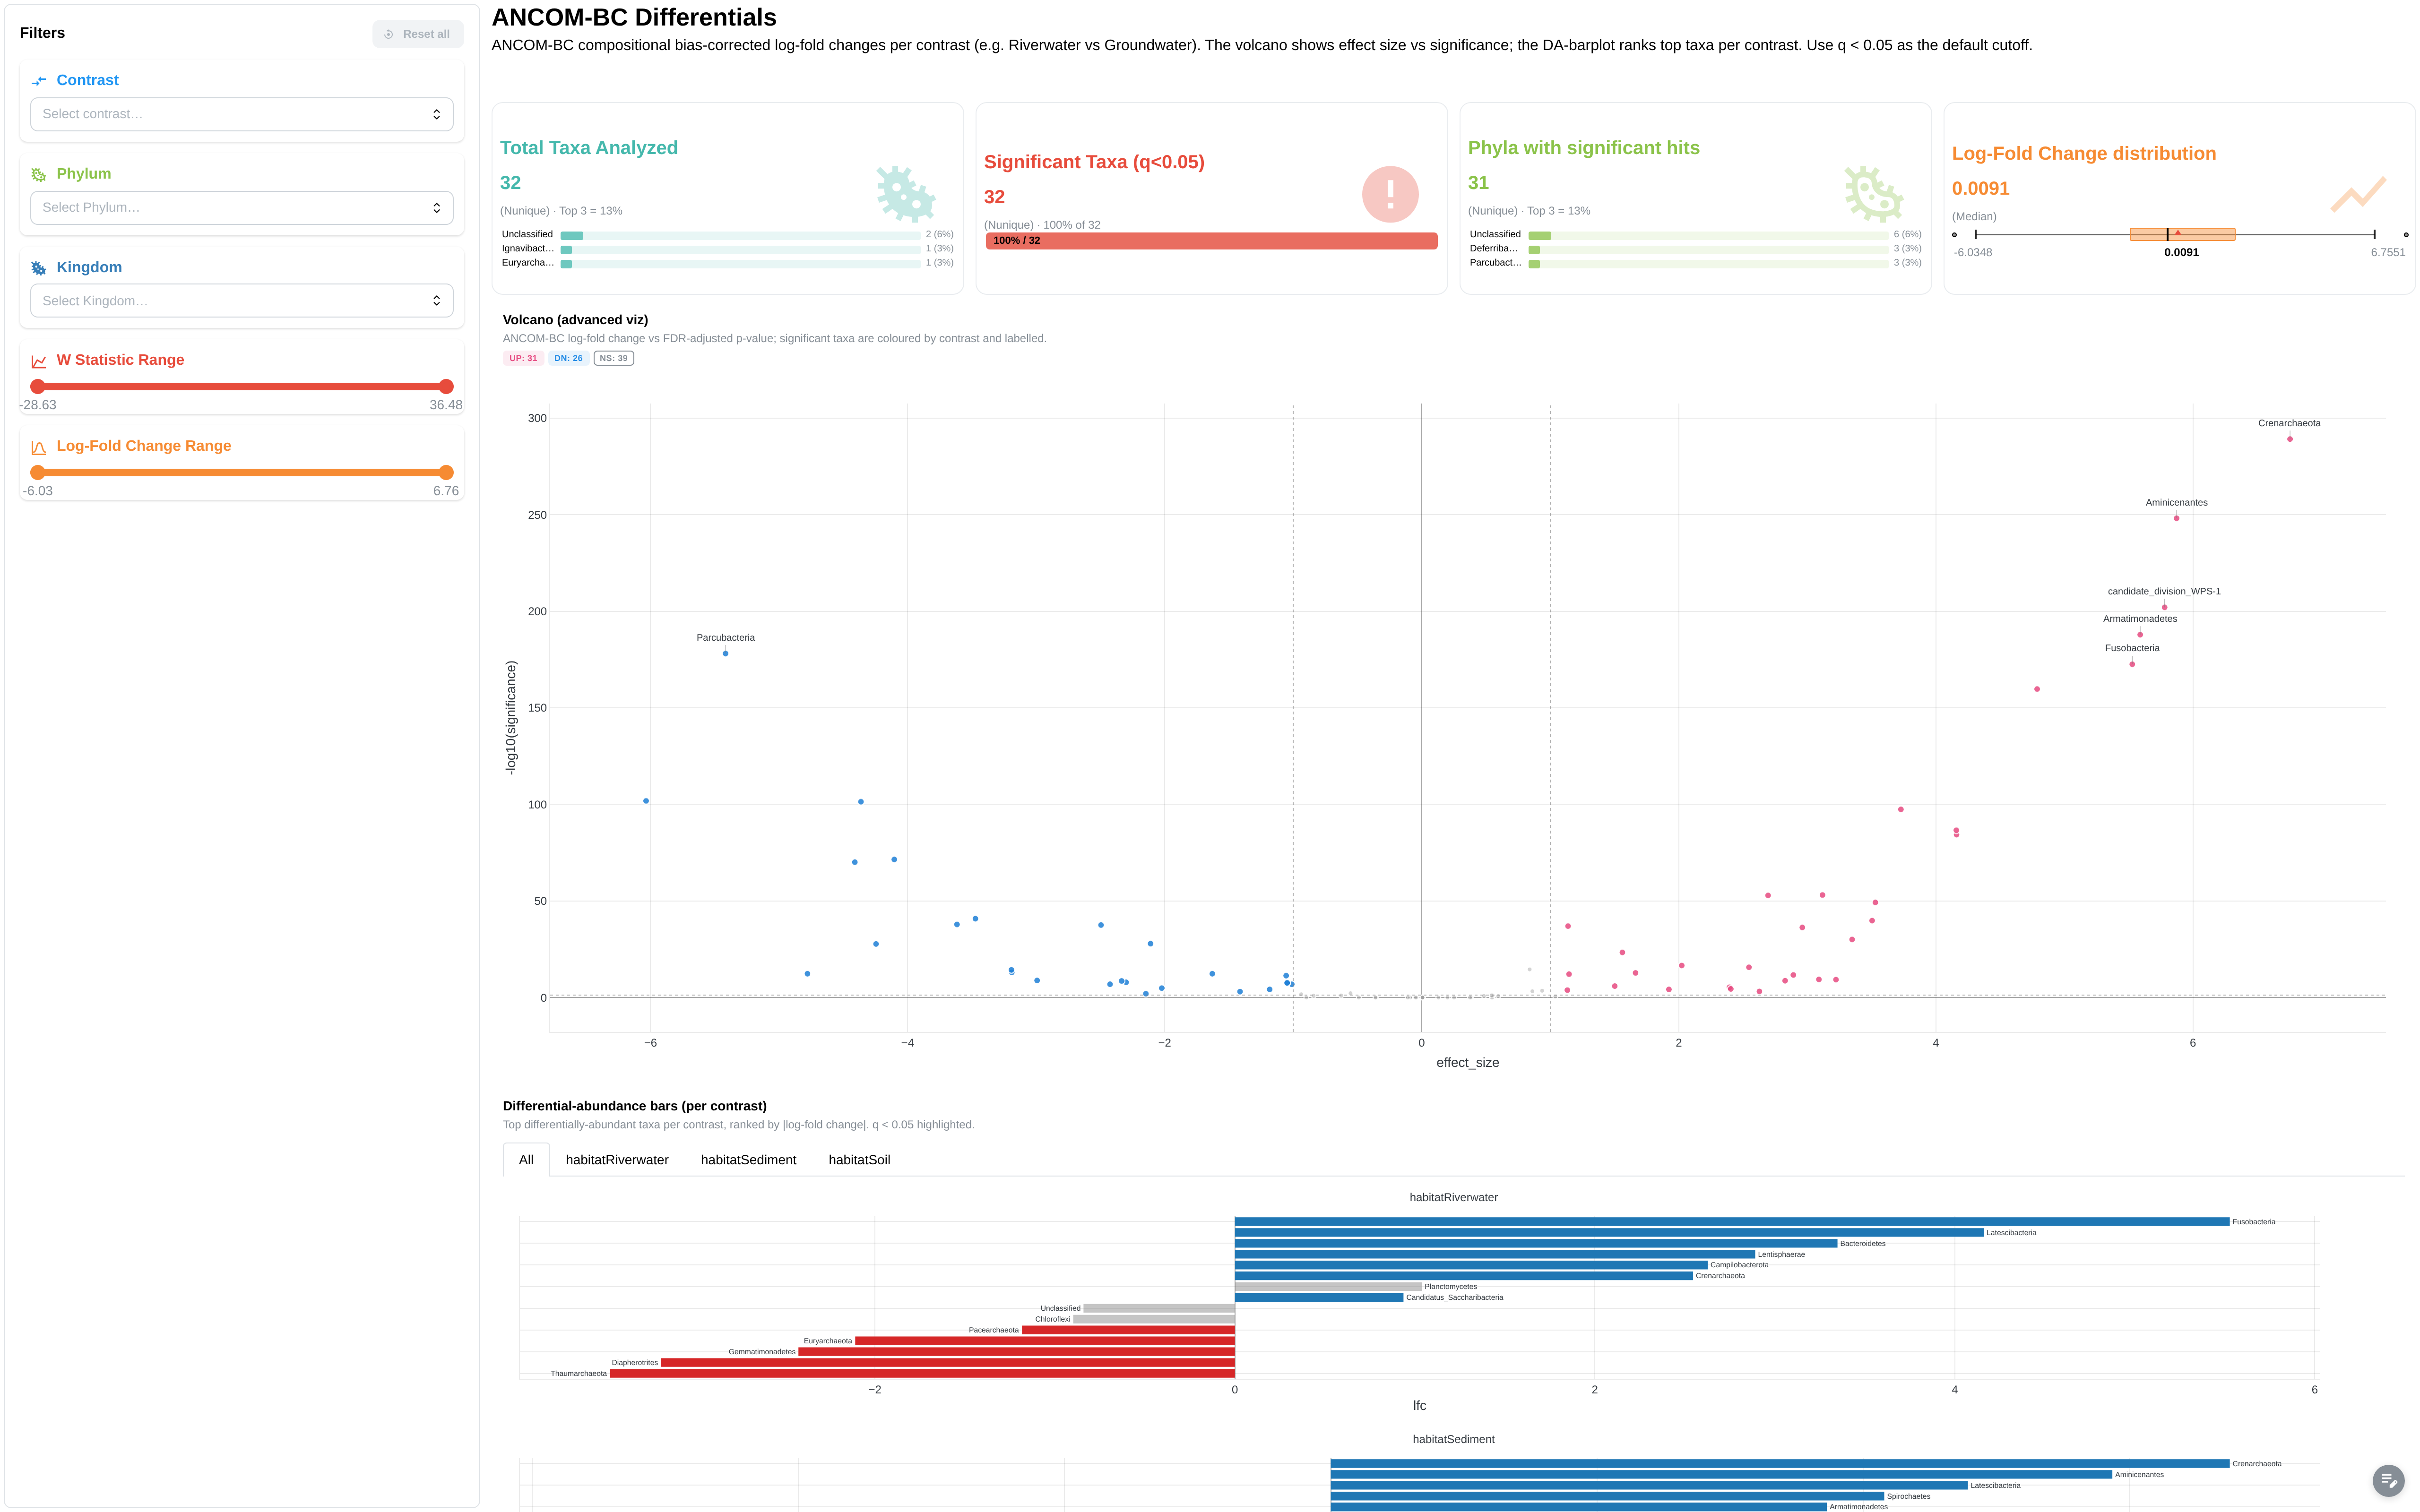
Components:
- Metric cards: total taxa, significant taxa (q<0.05), unique phyla, max log-fold change
- Volcano plot: LFC vs -log10(q-value), facetted by contrast
- DA barplot: per-contrast log-fold change
- Top differential taxa bar chart
- Results data table
- Filters: contrast, Phylum, Kingdom, W statistic range, LFC range
Beta-diversity / PCoA embedding + ComplexHeatmap on the canonical feature matrix. Surfaces clusters and outliers across samples.
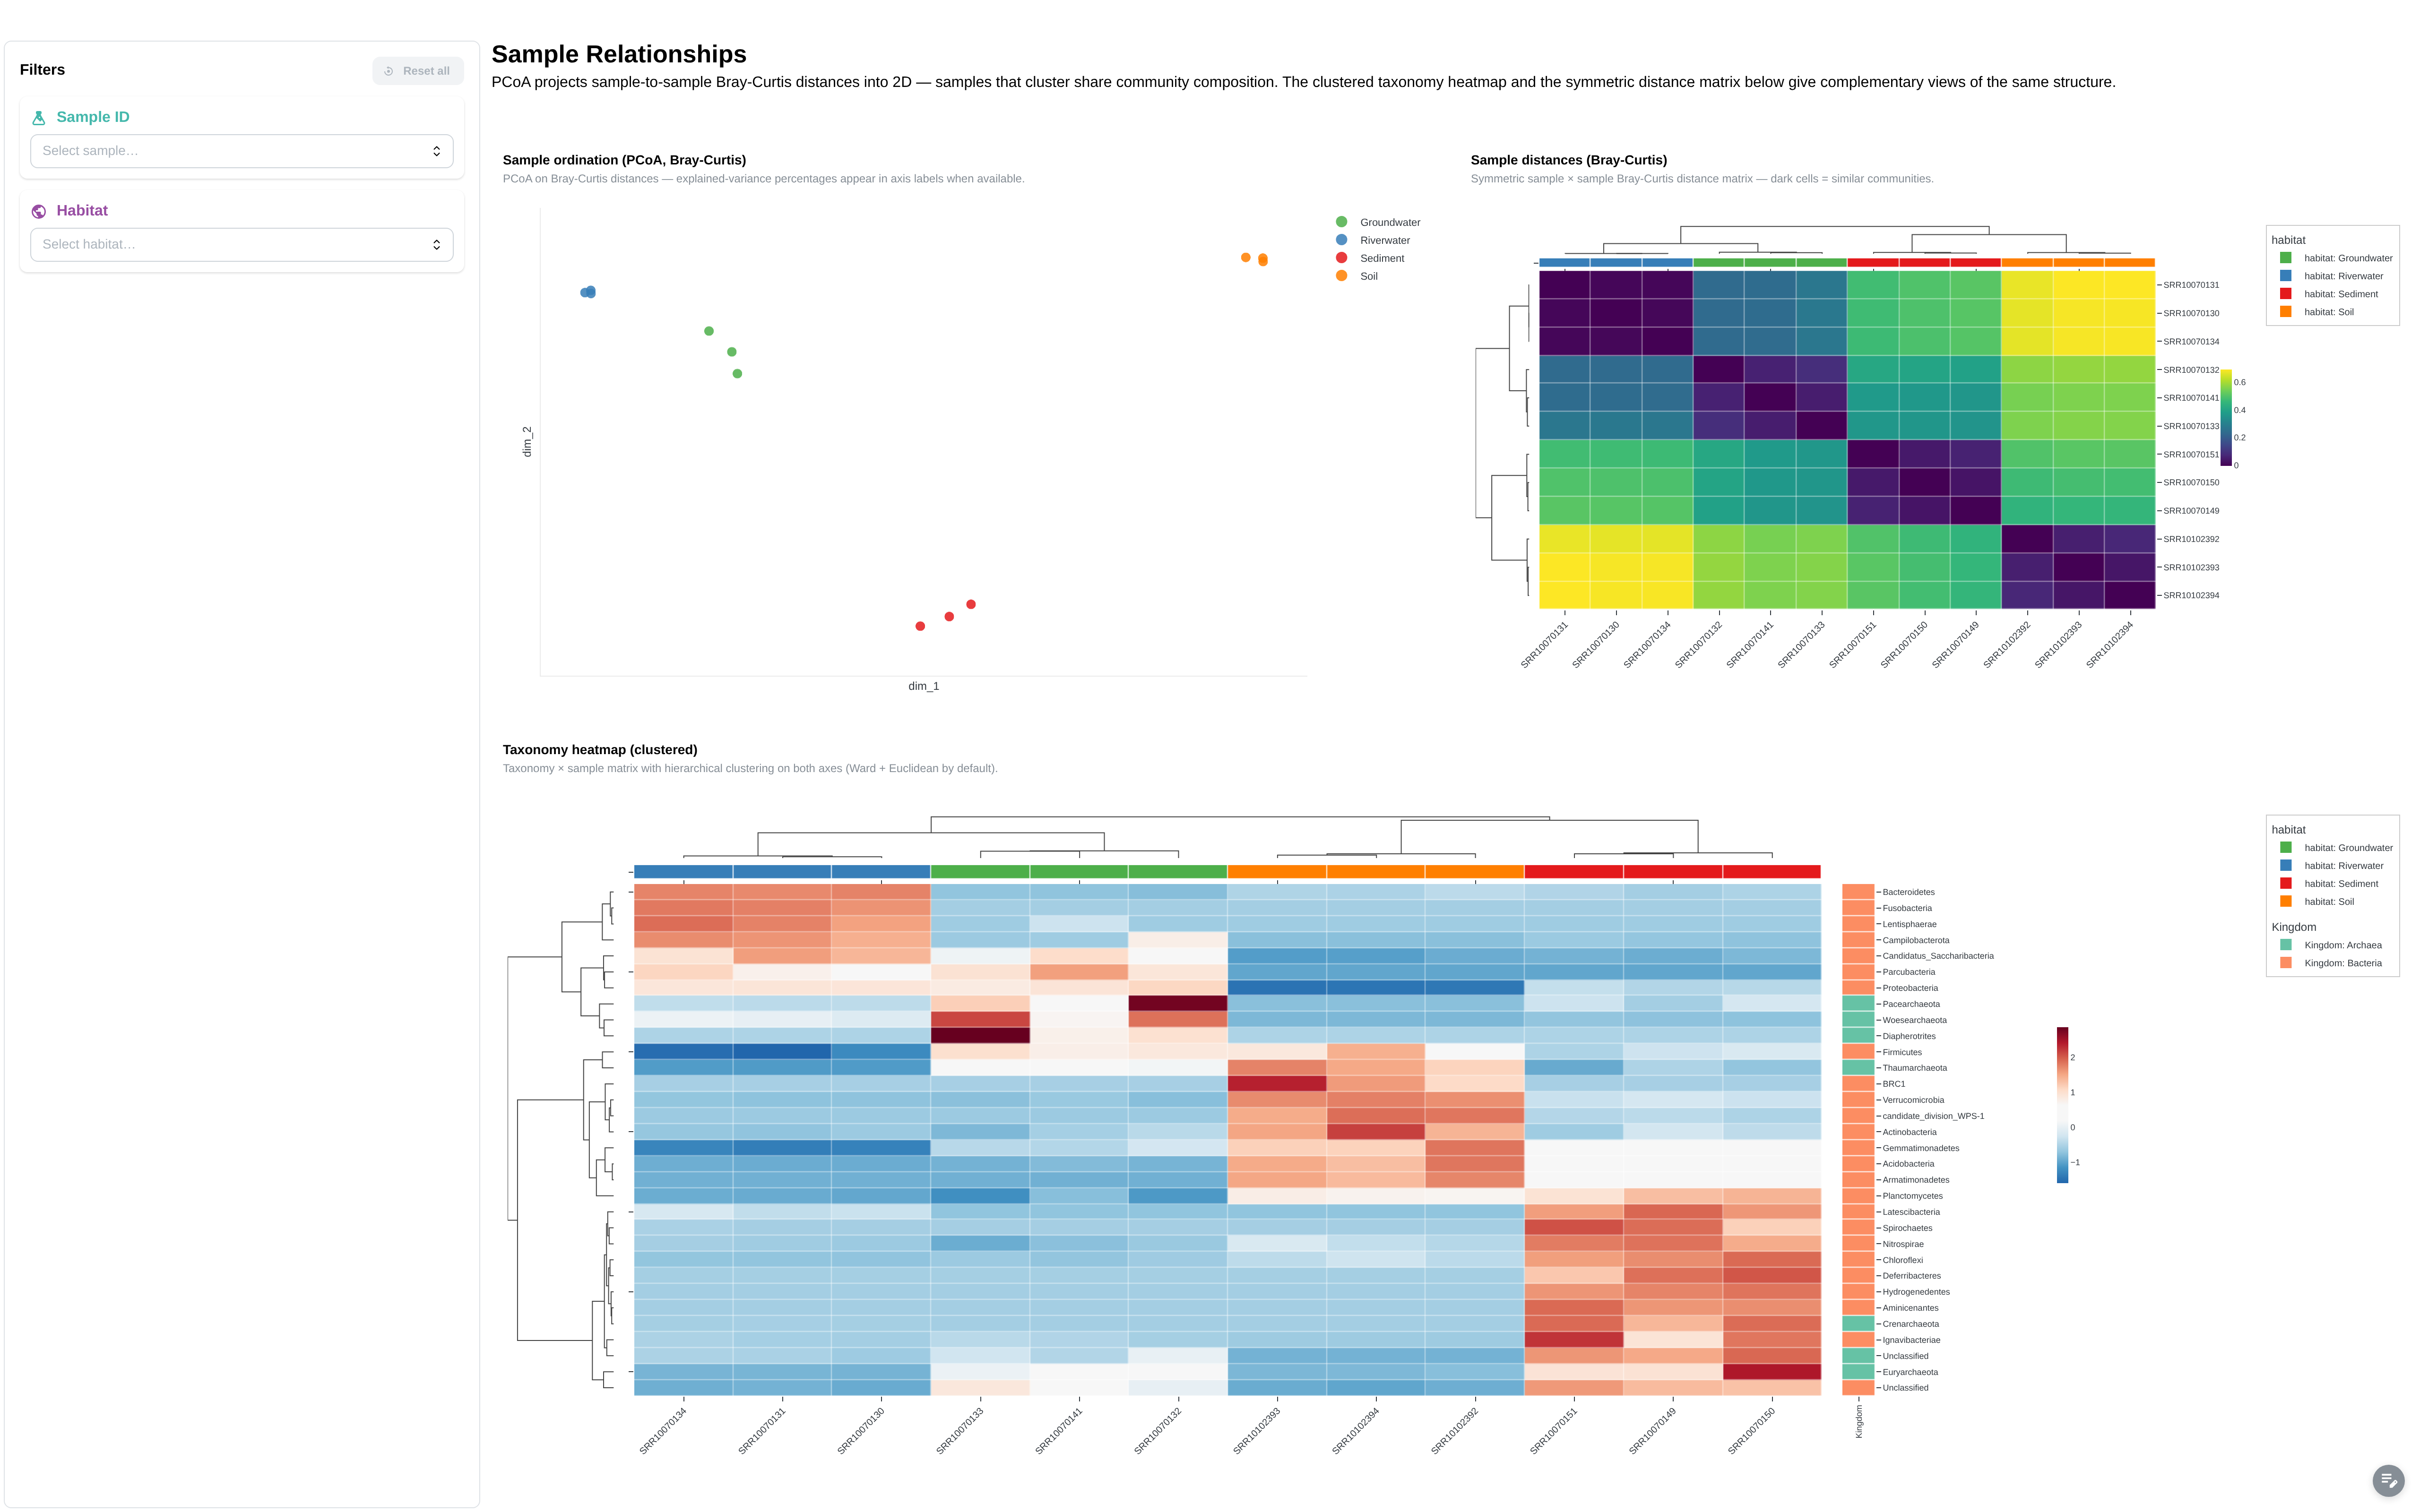
Components:
- Embedding (PCoA): 2D sample projection, colour-coded by habitat
- ComplexHeatmap: clustered z-score heatmap on the canonical feature matrix
- Bray-Curtis sample-distance heatmap
Rooted phylogenetic tree of ASVs with tip metadata overlay.
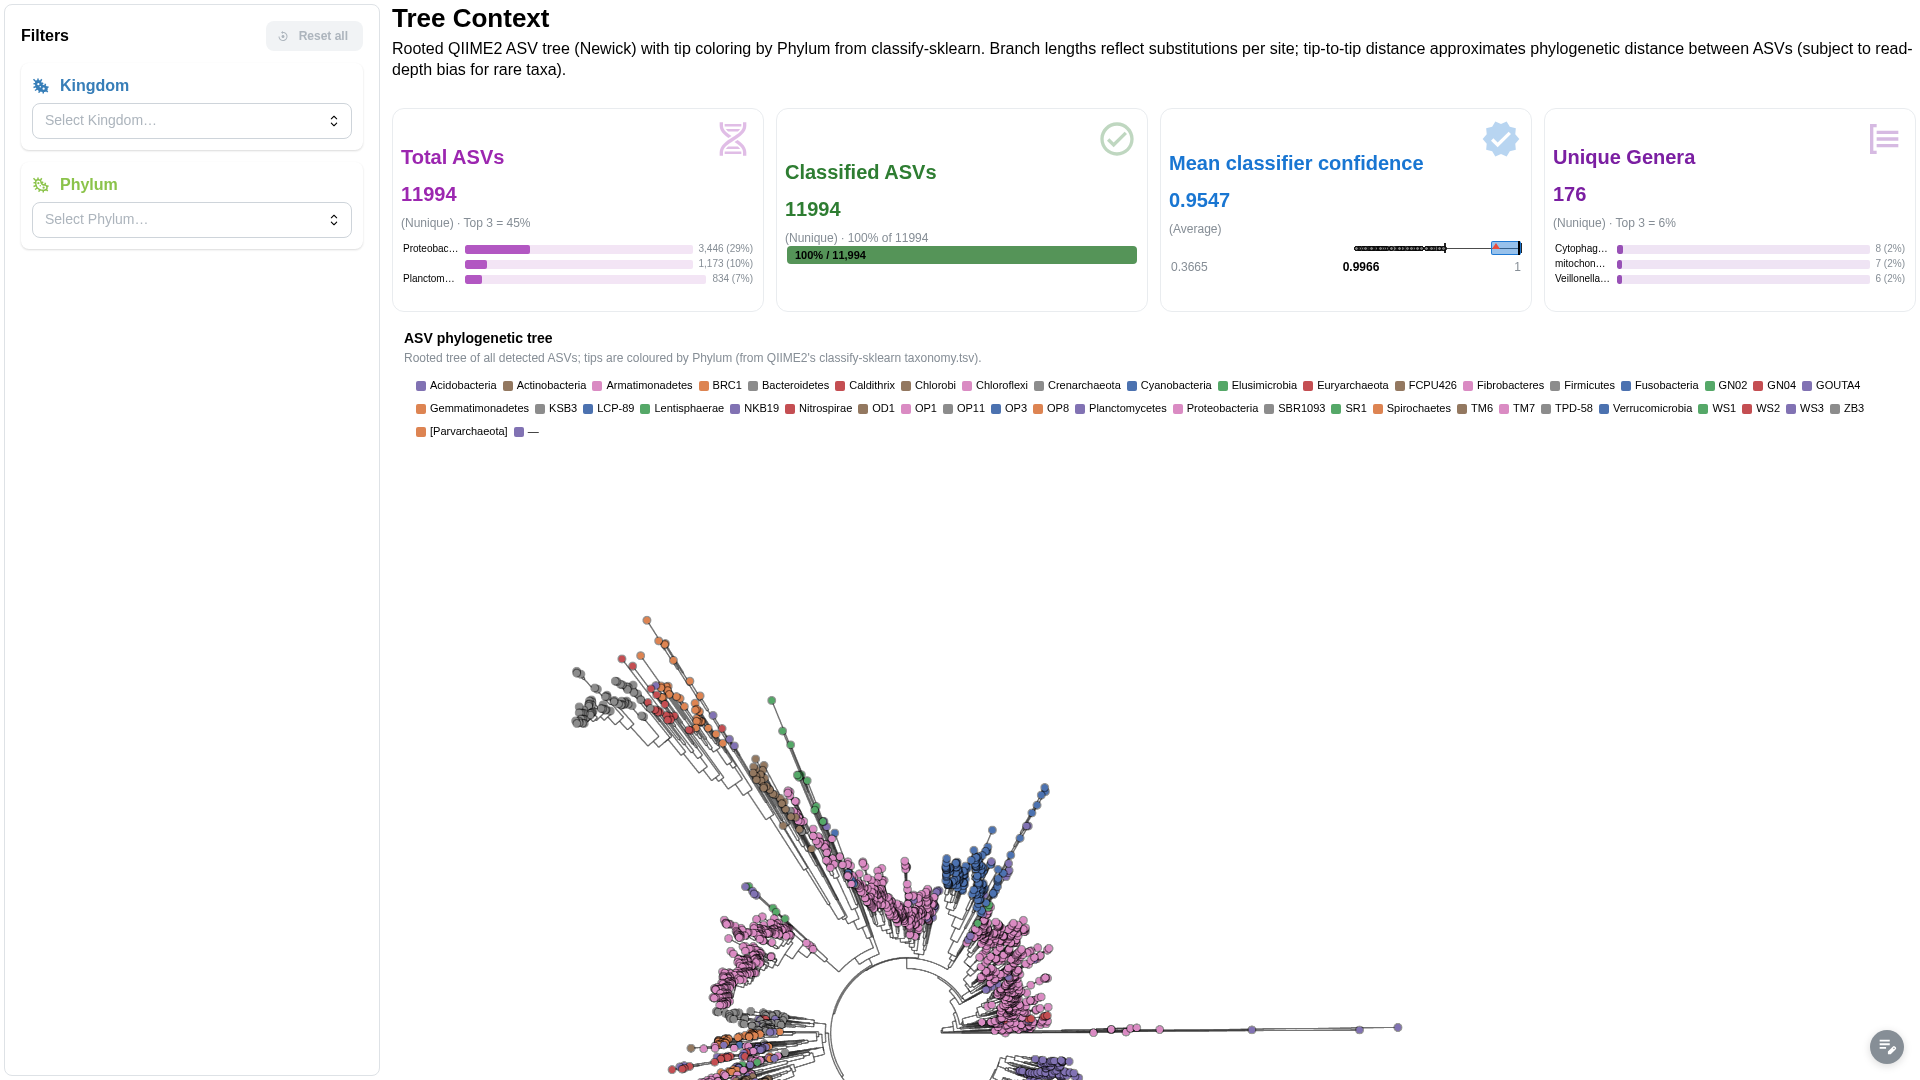
Components:
- Phylogenetic tree viewer (Newick) with metadata-annotated tips
Cross-DC links (7)
| Source | Column | Target | Description |
|---|---|---|---|
samplesheet |
sampleID |
multiqc_data |
Filter MultiQC by samples |
metadata |
ID |
alpha_diversity |
Filter diversity by metadata |
metadata |
ID |
alpha_rarefaction |
Filter rarefaction by metadata |
metadata |
ID |
taxonomy_composition |
Filter taxonomy by metadata |
metadata |
ID |
taxonomy_rel_abundance |
Filter rel abundance by metadata |
samplesheet |
sampleID |
taxonomy_heatmap |
Filter heatmap (base) |
metadata |
ID |
taxonomy_heatmap |
Filter heatmap (extended) |
Metadata links are auto-pruned when METADATA_FILE is absent.
Running the pipeline
Depictio reads the output of nf-core/ampliseq — it does not run the pipeline. Run the pipeline first:
nextflow run nf-core/ampliseq \
  --input samplesheet.csv \
  --FW_primer GTGYCAGCMGCCGCGGTAA \
  --RV_primer GGACTACNVGGGTWTCTAAT \
  --metadata Metadata.tsv \
  -profile docker
Then point Depictio at the results:
depictio run --template nf-core/ampliseq/2.16.0 \
  --data-root results/ \
  --var SAMPLESHEET_FILE=samplesheet.csv \
  --var METADATA_FILE=Metadata.tsv
See nf-co.re/ampliseq/usage for full pipeline documentation.
Required data structure
Point --data-root to the directory containing your ampliseq outputs. This can be a single run's results/ folder or a parent directory containing multiple runs — Depictio scans recursively. Not all files are required; the template adapts based on what's present and which --var flags you provide.
<DATA_ROOT>/
├── samplesheet.csv                                # --var SAMPLESHEET_FILE
├── Metadata.tsv                                   # --var METADATA_FILE (optional)
└── <run_id>/                                      # One or more pipeline run output folders
    ├── multiqc/
    │   └── multiqc_data/
    │       └── multiqc.parquet
    └── qiime2/
        ├── alpha-rarefaction/                      # ⚠ Requires --metadata
        │   └── faith_pd.csv
        ├── ancombc/differentials/                  # ⚠ Requires --metadata + --ancombc
        │   └── Category-<GROUP_COL>-level-2/
        │       ├── lfc_slice.csv
        │       ├── p_val_slice.csv
        │       ├── q_val_slice.csv
        │       ├── se_slice.csv
        │       └── w_slice.csv
        ├── barplot/
        │   └── level-2.csv
        ├── diversity/alpha_diversity/              # ⚠ Requires --metadata
        │   └── faith_pd_vector/
        │       └── metadata.tsv
        └── rel_abundance_tables/
            └── rel-table-2.tsv
Recipes (6)
| Recipe | Input | Key transformation |
|---|---|---|
alpha_diversity.py |
faith_pd_vector/metadata.tsv |
Filter comment rows, rename id → sample, pass through metadata cols |
alpha_rarefaction.py |
faith_pd.csv |
Wide → long unpivot, regex depth/iter extraction |
taxonomy_composition.py |
barplot/level-2.csv |
Detect taxonomy by ; in column names, melt to long format |
taxonomy_rel_abundance.py |
rel-table-2.tsv + metadata DC |
Wide → long, taxonomy split, generic metadata join |
taxonomy_heatmap.py |
rel_abundance DC + metadata DC | Pivot to Phylum × sample matrix, embed metadata annotations with Plotly colors |
ancombc.py |
5 ANCOM-BC CSVs (via source_overrides) | Melt 5 slices, join, compute -log10(q) and significance |
Additional resources
- nf-co.re/ampliseq — official pipeline documentation
- nf-co.re/ampliseq/2.16.0/results — AWS test results
- Template System Reference — YAML format, variables, conditionals
- Recipes — how to read, test, and write recipes